77


Pa
kis
tan
Re
sid
en
tM
issio
nW
ork
ing
Paper
Seri
es
Asian Development Bank
Working Paper No. 2
A Review of the Evidence
Sohail J. Malik

2005 Asian Development BankPakistan Resident MissionAll rights reserved.
First printing March 2005
The findings, interpretations, and conclusions expressedin this study are those of the author and should not beattributed in any manner to the Asian Development Bank(ADB), or its Board of Directors, or the governmentsits members represent.
The Asian Development Bank encourages use of thematerial presented herein, with appropriate credit.
Asian Development BankPakistan Resident MissionOPF Building, Shahrah-e-JumhuriyatG-5/2, Islamabad, PO Box 1863PakistanTel (92-51) 282-5011-16Fax (92-51) 282-3324, [email protected]
Malik, Sohail J. 2005. Agricultural Growth and Rural Poverty:A Review of the Evidence. Islamabad: Asian Development Bank.
Publication Stock No. 010805
c

Foreword
Poverty reduction has always been an important objective of the Asian Development Bank (ADB).
In November 1999, ADB approved a Poverty Reduction Strategy articulating the reduction of poverty as
the institution's overarching goal. Work on a poverty analysis for Pakistan was initiated in 2000 as part of
the process of developing a new Country Strategy and Program. ADB has supported poverty reduction
efforts through enhanced levels of assistance and targeted investment projects with the objective of
reducing poverty and generating employment; assistance has averaged over $950 million a year over the
last 3 years. In comparison, average annual lending between 1990 and 1998 was just over $500 million per
year. The increased lending specifically focuses on supporting poverty reduction and improvements in
systems of governance. Under its Country Strategy and Program for Pakistan for 2002 06, the reduction of
poverty is ADB's central objective, and will be made operational by promoting sustainable pro-poor
growth, inclusive social development, and good governance.
This report examines the apparent paradox that emerged over the 1990s of relatively good
reported agricultural growth accompanied by increasing levels of poverty. Several components of the
report were disseminated and discussed during its preparation. The report should be viewed as part of an
evolving effort to increase the understanding of poverty in Pakistan. It also points out significant
outstanding issues that should be the subject of future work.
Given the importance of the topic, ADB's Pakistan Resident Mission (PRM) feels that it would be
useful to circulate the paper among a wider audience. We hope that this publication will not only
contribute to the debate on a key issue in Pakistan, but will also prove valuable to our development
partners in policymaking and implementation, as well as to a wide range of stakeholders who are
interested in poverty reduction issues in general.
Kunio Senga
Director GeneralSouth Asia Department
Asian Development Bank

Preface
In the last 3 years, ADB's assistance to Pakistan has averaged about $950 million, as compared to a
previous average of about $500 million. The increased level of assistance to Pakistan reflects ADB's strong
commitment to poverty reduction and to the Government of Pakistan's reform program. Pakistan has
largely achieved macroeconomic stability in the last 2 years, with macroeconomic fundamentals showing
the best performance in over a decade. Similarly, growth rates have risen appreciably to an estimated 6.4%
in the fiscal year 2004 the highest rate in the last 7 years. Unfortunately, the Pakistan Integrated
Household Survey has not been conducted since 2001, and, therefore, it is not possible to determine the
extent to which this marked improvement in the macroeconomic picture has translated into improved
living conditions for the majority of Pakistan's population about one-third of Pakistanis were estimated
to be living below the poverty line in 2001.
ADB is working with the Government to ensure that the benefits of increased growth and a
stronger macroeconomic framework reach the country's poor, resulting in sustained poverty reduction
and support for the Government's economic reform program. To this end, ADB supports policy measures
geared towards achieving higher growth and poverty reduction in the medium term, and is particularly
interested in growth in agriculture, given that it is not only the single biggest sector of the economy, but
also employs over half the population. As such, the performance of the agriculture sector has important
implications for rural poverty, as well as for gross domestic product (GDP) growth and exports. This
paper, the second in PRM's Working Paper Series, examines the relationship between agricultural growth
and rural poverty, and reaches some interesting conclusions on the structure of the sector in Pakistan and
the consequent implications for poverty.
Dr. Sohail J. Malik, Chairman, Innovative Development Strategies, was commissioned by ADB to
prepare this paper. The study was supervised by Dr. Naved Hamid, Senior Economic Advisor, PRM, and
benefited from comments from Dr. G. M. Arif, Poverty Consultant, PRM; Dr. Emma Hooper, Poverty and
Macroeconomic Specialist, PRM; Safdar Parvez, Program Officer, PRM; and Shanza N. Khan, Poverty
Analyst, PRM. The paper was edited and prepared for publication by Maheen Pracha, and the cover
designed by Cecilia Caparas at ADB Headquarters in Manila. We hope that this paper will contribute
meaningfully to the ongoing debate on poverty dynamics in Pakistan.
M. Ali Shah
Country DirectorADB Pakistan Resident Mission

Author's Acknowledgments
The author wishes to thank Professor John W. Mellor of Abt Associates, USA, and Dr. Naved
Hamid and Safdar Parvez at ADB's Country Office for their comments. The considerable time and effort
spent by Dr. G. M. Arif at ADB in editing this paper is also gratefully acknowledged. Thanks are also due to
two staff members at Innovative Development Strategies: Hina Nazli for substantive intellectual support
and Nadia Assad for research assistance. Any errors of omission or commission, however, are the
responsibility of the author.

The fiscal year (FY) of the Government ends on 30 June. FY before a calendar year denotes the year in which the fiscal year ends. For example, FY2002 begins on 1 July 2001 and ends on 30 June 2002. All year figures without the prefix "FY" refer to calendar years, unless otherwise stated.
In this paper, "$" refers to US dollars.
The analysis in this paper is up to date until December 2003, which is when the study was completed.
Currency Unit
PRe/PRs1.00
$1.00
Pakistan rupee (PRe/PRs)
$0.017
PRe/PRs59.55
Currency Equivalents(as of 27 January 2005)

Contents
Appendixes
Foreword
Preface
Author's Acknowledgments
Abbreviations
Summary ........................................................................................................................... xv
1 Introduction ....................................................................................................... 1
2 Rural Poverty: Trends, Sources of Income, and Dynamics .................................. 5
2.1 Trends in Rural Poverty ................................................................................. 5
2.2 Regional Variations in Rural Poverty .............................................................. 7
2.3 Sources of Income ....................................................................................... 11
2.4 Rural Poverty Dynamics ................................................................................ 18
3 Agricultural Growth and Rural Poverty ............................................................. 23
3.1 Decomposing the Agricultural Growth of the 1990s ....................................... 23
3.2 High Reported Agricultural Growth in the 1990s: A Statistical Artifact .............. 25
3.3 Great Variability in Agricultural Growth.......................................................... 28
3.4 High Poverty in Cotton/Wheat Punjab: An Illustration ..................................... 30
4 Land Distribution, Tenancy Arrangements, and Rural Poverty ........................... 33
5 Poverty and Changes in the Rural Labor Market ............................................... 37
5.1 Decline in Use of Casual Labor .................................................................... 37
5.2 Decline in Real Wage Rate in the 1990s ........................................................ 38
6 Conclusions and Policy Recommendations ........................................................ 41
References .................................................................................................................... 45
1 Background Economic Data ............................................................................... 53
Table A1.1: Agro-Climatic Zones of Pakistan ......................................................... 53
Table A1.2: Share of Different Agro-Climatic Zones and Households by
Poverty Status and Different Income Sources ......................................... 54
Table A1.3: Sources of Income Across Agro-Climatic Zones and Size of
Operated Land Holding ...................................................................... 55

Table A1.4: Percentage Share of Important Crops in Total Major Crops ................... 57
Table A1.5: Yield per Hectare of Major Crops (Tons/Hectare) ................................. 57
Table A1.6: Percentage Distribution of Tenant-Operated Area Under
Different Tenancy Arrangements .......................................................... 58
2 Data and Research Gaps ................................................................................... 59
Table A2.1: Advantages and Limitations of Available Quantitative
Data Sources ...................................................................................... 62
Table 1: Rural Poverty Trends ......................................................................................... 6
Table 2: Poverty Headcount and Change in Incidence of Poverty by Agro-
Climatic Zone ................................................................................................... 8
Table 3: Poverty Headcount in Rural Punjab by Region ..................................................... 8
Table 4: Distribution of Poor by Agro-Climatic Zone in FY2002 ........................................ 9
Table 5: Farm and Non-Farm Poverty Headcount by Agro-Climatic Zone ......................... 10
Table 6: Share of Different Income Sources in Total Income by Zone in FY2002 ................ 12
Table 7: Share of Different Income Sources in Total Income by Size of Operated
Land Holding in FY2002 ................................................................................... 12
Table 8: Sources of Income by Agro-Climatic Zone and Poverty Status .............................. 13
Table 9: Sources of Farm Income by Poverty Status and Agro-Climatic Zone
in FY2002 ........................................................................................................ 15
Table 10: Sources of Non-Farm Income by Poverty Status and Agro-Climatic
Zone in FY2002 ............................................................................................... 17
Table 11: Sample Entry and Exit Probabilities for Poverty .................................................... 19
Table 12: Number of Periods: Poor by Poverty Status ......................................................... 20
Table 13: Composition of Agriculture Sector, GDP Growth, and Agricultural
Value-Added .................................................................................................... 24
Table 14: Coefficient of Variation for Area, Production, and Yield of Cotton
and Wheat ....................................................................................................... 29
Table 15: Percentage Share of Major Crops and Agricultural Value-Added and
Annual Growth Rates of Cotton and Wheat ........................................................ 31
Table 16: Distribution of Cropped Areas in Cotton/Wheat Punjab and Sindh by
Important Kharif and Rabi Crops ....................................................................... 32
Table 17: Farm Classification by Size ................................................................................ 33
Table 18: Percentage Distribution of Farms by Size and Type of Tenure ............................... 34
Table 19: Percentage Distribution of Farms Reporting Use of Casual Labor ......................... 37
Table 20: Nominal and Real Daily Wages for Agricultural Laborers .................................... 38
Table 21: Nominal and Real Daily wages for Construction Workers .................................... 39
Tables

Figures
Figure 1: Reported and Adjusted Value-Added of Livestock and Agriculture ........................ 26
Figure 2: Trend in Growth Rates of Reported and Adjusted Agricultural
Value-Added .................................................................................................... 27
Figure 3: Percentage Agricultural Growth ......................................................................... 28
Figure 4: Annual Growth Rates of Cotton and Wheat ........................................................ 29
Figure 5: Land Distribution in Selected Cotton-Producing Districts of Punjab ....................... 35

Summary
In Pakistan, achieving high agricultural growth is considered one
of the key factors in poverty reduction. The reported growth rate of 4.6%
in the agriculture sector in the 1990s was reasonable. However, estimates
of poverty based on a headcount measure show an increase in rural
poverty during the 1990s. The present study explores the reasons why the
benefits of agricultural growth in the 1990s could not be translated into
poverty reduction.
A review of the literature shows that, despite high growth rates in
the agriculture sector in the 1960s, poverty increased in rural areas because
the initial beneficiaries of agricultural subsidies and new technology
emerging during this period were generally large farmers. Hence, the
increased agricultural growth was not reflected in reduced levels of
poverty. The 1970s witnessed a decrease in the incidence of rural poverty,
largely due to private investment in agriculture and the heavy emigration
of rural-based workers to the Middle East. The resulting increased foreign
remittances is cited as one of the major reasons behind the falling poverty
trends witnessed during this period. These trends continued through the
1980s largely due to the sustained inflow of remittances and relatively
better performance of the agriculture sector.
Several recent studies concur on a trend of increasing rural poverty
since the late 1980s. Certain other studies, which found that rural poverty
fluctuated during the 1990s, also indicate that by the fiscal year (FY) 2001,
the incidence of poverty was considerably higher than in the early 1990s.
The consensus is that the percentage of rural persons living below the
poverty line has increased over time and especially between FY1997 and
FY2001.
This study also examines regional variations in rural poverty.
Despite methodological differences, the results of recent studies
consistently indicate the lowest levels of poverty for barani (rain-fed)
Punjab in various years, while high poverty levels have generally been
observed in the cotton/wheat zones of Sindh and southern Punjab.
Together, these two zones account for over 33% of the poor in Pakistan, but
only about 29% of the country's total population (17.5% in cotton/wheat
Punjab and 11.2% in cotton/wheat Sindh). Barani Punjab has only a little
Several recent
studies concur on a
trend of increasing
rural poverty since
the late 1980s.

xvi Agricultural Growth and Rural Poverty
more than half its share of poor as compared to its share of the population.
Relatively low poverty levels in the barani areas of northern Punjab are
attributed first to certain socio-economic characteristics of barani areas,
including the lowest dependency ratio, the highest levels of literacy
(particularly female literacy), and the lowest number of unpaid family
workers. Second, the rural areas in this region are well integrated with
prosperous urban centers that have strong linkages to the services sector.
Third, a significant proportion of the region's labor force is employed in
both the armed forces and government sector. Finally, due to the high
incidence of domestic and overseas migration, remittances contribute a
significantly higher proportion to total household income in the barani
areas of Punjab.
One of the major contributions of this study is an analysis of income
sources: it identifies five major sources in rural Pakistan, including
wages/salaries, transfer income, crop income, rental income, and
livestock income. Crop income accounts for 67% of the total income in
cotton/wheat Sindh and 64% of the total income in cotton/wheat Punjab.
These ratios are highest across the two zones, showing that the highest
incidence of poverty is in zones that rely most on crop incomes. The
incidence of poverty is low in zones where the percentage of incomes from
wages and salaries and transfer incomes is high. It appears that poverty is
greater in zones where the possibility of diversifying incomes in order to
manage risk is limited.
Sources of income vary with poverty status. Crop income is an
important source for non-poor households, particularly in irrigated areas
of Punjab, while poor households generally rely on wages and salaries.
Within the farm sector of the cotton/wheat zone, both non-poor and poor
households depend on the cotton crop, although the former diversify crop
production by growing sugarcane, particularly in Sindh. The share
generated by rice seems to contribute significantly to the income of poor
and non-poor households in rice-growing areas of Sindh and Punjab while
maize is an important source of income for households located in the
North-West Frontier Province (NWFP) and in barani Punjab.
A majority of poor, rural, landless households derive their non-
farm income from the construction sector where nearly half the employed
persons were found to be under-employed. The services sector, on the
other hand, appears to be the most important source of non-farm income
for better-off households. Moreover, the wholesale and retail trade, and
transport and communications sectors also contribute significantly to the
non-farm incomes of non-poor households.
The incidence of
poverty is low in
zones where the
percentage of
incomes from
wages and salaries
and transfer
incomes is high.

Summary xvii
The findings of this study, based on data from the Household1Integrated Economic Survey (HIES) for FY2002, show that income from
livestock occupies a small proportion of overall household income (less
than 2%), and that it increases only marginally across income quintiles.
The highest livestock income was reported in the cotton/other zones of
Sindh and Balochistan and the lowest in mixed Punjab. These findings,
however, are not consistent with the results of earlier studies, which show
a much higher contribution of livestock income to total household income.
More importantly, the national accounts show that 40% of the value
addition to the agriculture sector is from livestock income, and that this
contribution is equal to that of crop income. Although it is likely that the
HIES does not provide an accurate valuation of livestock produce
consumed at home or gifted out, much more in-depth research using all
available datasets is needed on this issue.
The study also examines the dynamics of rural poverty, i.e., the
movement into and out of poverty. While more rural households have
fallen into poverty since the 1990s, many may also have escaped it. The
results of the International Food Policy Research Institute (IFPRI) 5-year
panel show that, although 21% to 29% of households fall below the poverty
line in any given survey year, the probability of entering poverty ranges
between 0.15 and 0.24, while that of overcoming poverty varies between
0.43 and 0.51. The sample entry and exit probabilities for the five pairs of
sequential years used in the study indicate an increase in the probability of
moving into poverty and a decline in that of escaping it over the survey
years. Consequent to external shocks or disasters, the probability of
remaining poor is much higher amongst poor households than it is for
non-poor households. Chronically poor households remain poor for
longer periods than those that are transitorily poor.
With respect to the agricultural growth and poverty nexus, this
study shows that the estimates of agricultural growth reported by the
Pakistan Economic Surveys during the 1990s were highly overstated. The
incorrect accounting of livestock, fishing and forestry value-added in
some years has contributed to the high reported rate of 4.6% per annum
during the 1990s. However, the high growth rates reported for these
sectors in this period were not backed by data from the Census of
Agriculture or by the disaggregated data in the Pakistan Economic
Surveys themselves. After adjusting for these overstated sub-sector
growth rates, the growth rate of the agriculture sector over the 1990s
declines to only 3.1% per annum. Assuming a population growth rate of
2.5% over this period, this implies a paltry 0.6% per annum per capita
growth rate. With such low growth per capita, the increase in rural
poverty in the 1990s was inevitable.
1 Government of Pakistan. 2003. Household Integrated Economic Survey 2001 02.
Islamabad: Federal Bureau of Statistics.
Consequent to
external shocks or
disasters, the
probability of
remaining poor is
much higher
amongst poor
households than it
is for non-poor
households.

xviii Agricultural Growth and Rural Poverty
A major portion of agricultural growth is dependant on the
production of cotton and wheat, Pakistan's two major crops. Cotton
production is concentrated in a few districts of the country where land
distribution is highly unequal: expanding the production of this crop
would theoretically benefit large farmers. Moreover, given the large
variability in the production of cotton and wheat, the growth in value-
added from these two crops over the 1990s is only 1.3% per annum,
implying a negative per capita growth in value-added. For the small
farmer in particular, the reliance on cotton with few avenues for
diversification means increased poverty. Persistent drought and the lack
of irrigation in these regions has also resulted in a substantial decline in
cotton production, otherwise the mainstay of many households in this
region. The rise in poverty in the 1990s seems to be a result of the increase
in the number of poor in the cotton/wheat zones of southern Punjab and
Sindh.
Agricultural production in Pakistan is highly erratic: one good year
may be preceded or followed by a bad year(s). The available research
indicates that, for small farmers, the possibility of overcoming poverty
after a bad year declines even if it is followed by a very good year. A
considerably higher incidence of transitory poverty indicates the
vulnerability of households close to the poverty line. A minor shock may
push them into poverty while a little assistance (in terms of employment or
income) can help them escape it.
The skewed land distribution is one of the major obstacles
hindering the rapid reduction of rural poverty. More than half the total
farms are smaller than 5 acres in size. Excessive land fragmentation and
the sub-division of landholdings from generation to generation are
causing a persistent decline in farm size, and, therefore, in agricultural
productivity. Smaller farms tend to be less diversified and so more
vulnerable to poverty. In particular, the dependence of small farmers on a
highly erratic cotton crop across most of the cotton belt seems to be a major
cause of rural poverty. It is necessary to provide small farmers with
technology and information to help smooth out the variability in cotton
production that they are subject to, and to give them access to technology
and markets to enable them to diversify their incomes.
The highly skewed land distribution in rural Pakistan results in
sharecropping, which is detrimental to poverty reduction. The incidence
of poverty among sharecroppers has been found to be considerably higher
than those who cultivate their own land (even small farmers) or cultivate
the land of others at a fixed rent. The prevailing tenancy arrangements in
different parts of the country lead to the exploitation of sharecroppers.
While various tenancy laws exist, there is no proper mechanism to monitor
the implementation of these laws.
The skewed land
distribution is one
of the major
obstacles hindering
the rapid reduction
of rural poverty.

Finally, mechanization in agriculture has increased considerably,
reducing the use of on-farm hired labor. Agricultural workers' real wages
show a decline and this, too, has contributed significantly to the rise in
poverty.
Summary xix

2 Mellor, John W. 2001. Employment Multiplier from Agricultural Growth and
Poverty Reduction. Pakistan Development Review 40 (4). Mellor, in his excellent
survey on the subject, has dwelt at length on the relative importance for poverty
reduction of 'agricultural growth' vis-à-vis 'growth in general'. While he argues
strongly in favor of agriculture-led non-farm growth, he is also careful to assert
the relative importance of other factors such as infrastructure and human capital
development in order to maximize the gains from such a growth strategy. The
important role of these supporting factors is also borne out by his earlier work in
the context of agricultural development (see Mellor, John W. 1988. Lectures on
Agricultural Growth and Employment. Edited by Syed Nawab Haider Naqvi, M.
Ghaffar Chaudhry, and Sohail J. Malik. Islamabad: Pakistan Institute of
Development Economics).3 Government of Pakistan. 2004. Pakistan Economic Survey 2002 03. Islamabad:
Economic Advisor's Wing/Finance Division.
1 Introduction
In recent years, the relationship between agricultural growth and
poverty has been widely debated in Pakistan. This is the outcome of a
concern regarding the apparent paradox of relatively good reported
agricultural growth accompanied by increasing levels of rural poverty
during the 1990s. While the available international literature on the
relationship between overall growth and poverty reduction is somewhat
ambiguous, the relationship between agricultural growth and poverty
reduction is generally assumed as much more clear-cut. In addition to the
direct effect of agricultural growth on poverty reduction, there is a much
larger indirect effect through the linkages between agriculture and non-
farm growth. Non-farm growth is closely linked with agricultural growth
since peasant farmers spend a large portion of their incremental income on
locally produced non-agricultural goods, thus generating employment
and incomes in adjoining areas. The increased demand for non-farm
goods leads to a much larger increase in employment, which is the main2vehicle for poverty reduction (Mellor 2001). As such, the increasing rural
poverty during the 1990s in the face of the reasonable agricultural growth
rates in Pakistan is viewed as surprising.
Agriculture contributes 23% to the total gross domestic product
(GDP) of Pakistan, employs 42% of the total employed labor force, and
accounts for nearly 9% of the country's export earnings (Government of3Pakistan 2004). Food products constituted 48% of household
The increasing
rural poverty
during the 1990s in
the face of the
reasonable
agricultural growth
rates in Pakistan is
viewed as
surprising.

2 Agricultural Growth and Rural Poverty
consumption expenditure (39% in urban areas and 54% in rural areas) in
the fiscal year (FY) 2002. Agro-based industries accounted for 64% of the4total industrial production of Pakistan (Government of Pakistan 2001).
The agriculture sector is, thus, a major determinant of the overall economic
growth and well-being in Pakistan.
The reported growth rate of 4.6% in the agriculture sector in the
1990s was reasonable. However, estimates of poverty based on a
headcount measure also show a surprising increase in rural poverty
during this period. The agricultural growth and rural poverty nexus of the
1990s has not been investigated, although several recent studies have
discussed important dimensions of growth and/or poverty. For example,
while analyzing total factor productivity trends in Punjab, Ali and Byerlee
(2002) observed an increase in average yield as well as cropping intensity5over the period 1966 1994. However, labor use declined during the post-
6green revolution period as it was displaced by mechanical inputs. Wide
differences were also observed in the growth rates of different production
systems with total factor productivity (TFP) growth appearing positive in
wheat/cotton and wheat/mung (lentil) bean regions, and negative in
wheat/rice zones. The decomposition of TFP into different components
revealed that all the positive effects of technical innovation and
infrastructure improvement were overridden by soil and water
degradation. The study also showed the large extent of resource
degradation in the province, mostly stemming from the increased use of
productivity-enhancing inputs themselves.
It has been emphasized that the skewed land distribution patterns
in Pakistan be considered before assuming high agricultural growth as a
panacea for rural poverty. Arif and Ahmed (2001), for example, argue that
in the presence of political roadblocks to agrarian reforms, the only way to
achieve poverty reduction is by providing better employment
opportunities in the farm and non-farm sectors as well as a more7egalitarian income distribution. Ali and Tahir (1999), on the contrary,
assert that growth is the primary factor responsible for poverty reduction
and that a focus on overall growth-oriented policies would automatically
4 Government of Pakistan. 2001. Census of Manufacturing Industries 1995 96.
Islamabad: Government of Pakistan.5 Ali, Mubarak, and Derek Byerlee. 2002. Productivity Growth and Resource
Degradation in Pakistan's Punjab: A Decomposition Analysis. Economic
Development and Cultural Change 50 (4).6 The availability of subsidized credit also favored the adoption of mechanical
technology in the post-green revolution period (Ali and Byerlee 2002).7 Arif, G. M., and Munir Ahmad. 2001. Poverty Across the Agro-Ecological Zones
in Rural Pakistan. Paper presented at the National Workshop on Pro-Poor
Intervention Strategies in Irrigated Agriculture in Asia: Pakistan, International
Water Management Institute, Lahore, 12 March.
Skewed land
distribution
patterns in
Pakistan need to be
considered before
assuming high
agricultural growth
as a panacea for
rural poverty.
Introduction 3
8alleviate poverty in rural areas. This singular focus on overall growth is
also found in earlier studies. Chaudhry and Chaudhry (1997) highlight
the importance of achieving high agricultural growth in order to ensure9macroeconomic stability and poverty reduction. They argue that green
revolution technologies did not increase the income disparity between
small and large farmers since both showed similar productivity gains.
They also point out that there is no issue of unequal access to more capital-
intensive inputs, since the development of rental markets for these inputs
has facilitated access even for small farmers.
Kemal (2001) evaluates the impact of structural adjustment
programs on poverty, finding that between FY1988 and FY1998, the tax
burden on the poorest increased by 7.4% and that on the richest decreased10by 15.9%. Hence, the tax structure actually became regressive rather than
progressive. The government also decreased development expenditure
during that decade. According to the study, the withdrawal of
development subsidies had a serious impact on the agricultural
production of small farmers. Although the government increased the
prices of agricultural products to compensate farmers, this did not fully
offset the negative impact of the input subsidy removal, particularly for
small farmers. Kemal's (2001) (footnote 10) findings are in line with the
earlier work by Chaudhry and Chaudhry (1997) (footnote 9) that the
adverse pricing policies followed by the government had a greater
negative impact on small farmers than on large farmers. Except for the
1960s, they argue, agricultural commodities have generally been under-
priced. This has led to lower profit margins for farmers and, consequently,
declining employment opportunities for agricultural labor.
While Chaudhry and Chaudhry (1997) argue that the impact of
price factors overrides that of non-price factors (footnote 9), recent work11by Murgai, Ali, and Byerlee (2001) tends to stress otherwise. In
comparing TFP growth trends in Indian and Pakistani Punjab, they
observe higher growth rates for the former. The authors attribute this
difference to non-price factors since both regions were following similar
price policies. All villages in India were electrified by the mid-1980s, 90%
8 Ali, Salman Syed, and Sayyid Tahir. 1999. Dynamics of Growth, Poverty and
Inequality in Pakistan. Pakistan Development Review 38 (4).9 Chaudhry, M. Ghaffar, and Ghulam Mustafa Chaudhry. 1997. Pakistan's
Agricultural Development Since Independence: Inter-Temporal Trends and
Explanations. Pakistan Development Review 36 (4).10 Kemal, A. R. 2001. Structural Adjustment, Macroeconomic Policies and Poverty
Trends in Pakistan. Paper presented at the Asia and Pacific Forum on Poverty:
Reforming Policies and Institutions for Poverty Reduction, ADB, Manila, 5 9
February.11 Murgai, Rinku, Mubarik Ali, and Derek Byerlee. 2001. Productivity Growth and
Sustainability in Post-Green Revolution Agriculture: The Case of the Indian and
Pakistan Punjabs. World Bank Research Observer 16 (2).
Adverse pricing
policies followed by
the government
had a greater
negative impact on
small farmers than
on large farmers.

4 Agricultural Growth and Rural Poverty
were irrigated, and the density of road network was far greater than that in
Pakistan. Moreover, Pakistan lagged far behind India in terms of
infrastructure development, education, and research in agriculture. In the
case of India, the positive effects of infrastructure development
outweighed the negative impact of adverse price policies.
This brief review of recent studies shows that the agricultural
growth and rural poverty nexus has not been a key focus of research. The
present study is an attempt to fill this gap by exploring the paradox of
reasonable agricultural growth and increasing rural poverty in the 1990s.
This study shows that the reported high growth rate of 4.6% for agriculture
in the 1990s was a statistical artifact. The actual rate during the 1990s was
closer to 3%, resulting in a very low 0.6% growth in per capita agriculture12income per annum. This, accompanied by land concentration and a
decline in the use of casual labor and real rural wages, was responsible for
worsening rural poverty over the 1990s. Increased agricultural growth
will only decrease poverty if it serves to directly increase the income
sources on which the poor are concentrated, or indirectly helps to generate
activities that would provide employment and income generation for the
poor.
This paper is divided into six sections. Poverty trends, sources of
income, and poverty dynamics are discussed in Section 2, followed by an
in-depth analysis of agricultural growth in Section 3. Section 4 links rural
poverty with land distribution. The decline in the use of casual labor and
real wages in rural areas is examined in Section 5. The study's major
findings and policy recommendations are presented in Section 6.
12 A population growth of around 2.5% per annum during the 1990s is assumed
here.
Increased
agricultural growth
will only decrease
poverty if it serves
to directly increase
the income sources
on which the poor
are concentrated.

2 Rural Poverty: Trends, Sources of
Income, and Dynamics
2.1 Trends in Rural Poverty
Understanding the complex relationship between rural poverty
and agricultural growth in Pakistan requires a comprehensive review of
the literature covering the 1990s. This section reviews four important
dimensions of rural poverty. The first part examines the available
literature on estimated trends in rural poverty; the second looks at regional
variations in rural poverty, focusing on agro-climatic zones. Recent
studies have highlighted the relatively higher incidence of poverty among
non-farm households as compared to farm households across all agro-
climatic zones. It seems appropriate, therefore, to examine the sources of
income of the poor this is covered in the third part of the section. Poverty
dynamics, i.e., the movement into and out of poverty, are discussed in the
fourth part of this section.
Various studies have examined prevailing poverty trends in13Pakistan since the 1960s. Although these studies suffer from the
weaknesses inherent in comparing poverty over time and place, it is
possible to make some general inferences from the results concluded. The
consensus emerging from this literature is that poverty increased in rural
areas during the 1960s despite high growth rates in the agriculture sector.
One argument concerning this unexpected relationship, i.e., high growth
rates and a rise in poverty, is that the initial beneficiaries of agricultural
13 Some new evidence on poverty is presented in M. H. Malik. 1988. Some New
Evidence on the Incidence of Poverty in Pakistan. Pakistan Development Review
27 (4); Malik, S. J. 1994. Poverty in Pakistan, 1984 85, 1987 88 and 1990 91.
Washington, DC: International Food Policy Research Institute; Amjad, R., and A.
R. Kemal. 1997. Macroeconomic Policies and Their Impact on Poverty
Alleviation in Pakistan. Pakistan Development Review 36 (1); Ali and Tahir (1999);
Jaffri, Younus. 1999. Assessing Poverty in Pakistan. In A Profile of Poverty in
Pakistan. Islamabad: Mahbub ul Haq Centre for Human Development; Arif, G.
M., Hina Nazli, and Rashida Haq. 2001. Rural Non-Agricultural Employment
and Poverty in Pakistan (Part II). Pakistan Development Review 39 (4); Anwar,
Talat, and Sarfraz K. Qureshi. 2002. Trends in Absolute Poverty in Pakistan: 1990
to 2001. Pakistan Development Review 41 (4).
Poverty increased
in rural areas
during the 1960s
despite high growth
rates in the
agriculture sector.

6 Agricultural Growth and Rural Poverty
subsidies in the 1960s were generally large farmers. Hence, the increased
agricultural growth could not be translated into reduced levels of poverty
(footnote 7).
The 1970s were marked by the decreasing incidence of rural
poverty. It was during this time that private investment in agriculture
reached its peak. There was also very heavy out-migration from the rural
areas, resulting in increased foreign remittances, which has been cited as
one of the major reasons behind falling poverty trends in the country at the14time (Irfan and Amjad 1984). Declining trends in poverty continued in
the 1980s, largely due to the inflow of remittances and the relatively better
performance of the agriculture sector.
Numerous studies using different methodologies have estimated
poverty trends for the 1990s. The results of some of the studies covering
more than one survey year are presented in Table 1. Independent studies
concur on a continuous trend of increasing rural poverty since the late
1980s (footnotes 8 and 13).
14 Irfan, M., and R. Amjad. 1984. Poverty in Rural Pakistan. In Poverty in Rural Asia
edited by Aziz ur R. Khan and Eddy Lee. International Labour Organisation/
Asian Employment Programme.
Table 1: Rural Poverty Trends
SY1985
1988
1991
1993
1994
1997
1999
2002
SY
SY
SY
SY
SY
SY
SY
Malik(1994)
Amjad andKemal(1997)Year
Ali andTahir
(1999)
Arif, Nazli,and Haq(2001)
FederalBureau
of Statistics
SY = survey year.
Note: SY before a calendar year denotes the year in which the survey year ends, e.g.,SY2002 ends at some point in 2002.
Sources: Malik, S. J. 1994. Poverty in Pakistan, 1984 85, 1987 88 and 1990 91.Washington, DC: International Food Policy Research Institute; Amjad, R., and A. R. Kemal. 1997. Macroeconomic Policies and Their Impact on PovertyAlleviation in Pakistan. Pakistan Development Review 36 (1); Ali, Salman Syed, and Sayyid Tahir. 1999. Dynamics of Growth, Poverty and Inequality in Pakistan.Pakistan Development Review 38 (4); Arif, G. M., Hina Nazli, and Rashida Haq. 2001. Rural Non-Agricultural Employment and Poverty in Pakistan (Part II). Pakistan Development Review 39 (4); Government of Pakistan. HouseholdIntegrated Economic Survey. Various issues. Islamabad: Federal Bureau of Statistics.
27.0
33.0
28.8
34.7
39.0
25.9
20.4
24.5
30.5
31.2 29.9
31.6
39.8
25.9
18.3
23.6
23.4
21.1
19.6
20.6
Declining trends in
poverty continued
in the 1980s,
largely due to the
inflow of
remittances and the
relatively better
performance of the
agriculture sector.

Rural Poverty: Trends, Sources of Income, and Dynamics 7
However, the Federal Bureau of Statistics (FBS) finds that rural
poverty fluctuated during the 1990s but that by FY2001, the incidence of15poverty was considerably higher than in the early 1990s. The consensus
is that the percentage of rural persons living below the poverty line has
increased over time and especially since the late 1990s.
Most available analyses of poverty have been conducted at a highly
aggregate level. Treating the entire rural area of the country collectively,
specifically when an analysis of agricultural performance vis-à-vis other
macroeconomic indicators is involved, is intrinsically a myopic approach.
Although the majority of such studies have not considered regional
variations much beyond rural/urban differences, the few studies that
have divided regions on the basis of agro-ecological differences16(Appendix 1) have found significant differences in poverty levels.
Unfortunately, these studies do not span similar years so that the effect of
different methodologies on their estimates is difficult to isolate. However,
it is possible to make some general inferences.
Poverty estimates at the level of agro-ecological zones are
presented in Table 2. Malik (1992) found the highest incidence of poverty
in cotton/wheat Punjab, followed by Balochistan and rice/other Sindh in
FY1985 (footnote 16). This order changed, ranking low-intensity Punjab
first, followed by cotton/wheat Punjab and rice/other Sindh in FY1988.
Arif and Ahmed (2001) found that cotton/wheat Sindh and rice/wheat
Punjab were the poorest regions in FY1994 and FY1999 (footnote 7). Using
recent data, the present study finds that Sindh and southern Punjab are the
poorest regions in Pakistan. During the period FY1994 to FY1999, poverty
increased across all regions. Between FY1999 and FY2002, southern and
mixed Punjab and the North-West Frontier Province (NWFP) were the
most adversely affected by poverty.
Despite methodological differences, the results of the studies
presented in Table 2 consistently indicate the lowest levels of poverty in
barani (rain-fed) Punjab during various years, while high poverty levels
are generally observed in Sindh and southern Punjab.
2.2 Regional Variations in Rural Poverty
15 Government of Pakistan. Household Integrated Economic Survey. Various issues.
Islamabad: FBS.16 See Malik, S. J. 1992. Rural Poverty in Pakistan: Some Recent Evidence. Pakistan
Development Review 31 (4); Qureshi, S. K., and G. M. Arif. 1999. Profile of Poverty
in Pakistan. Micro Impacts of Macroeconomic and Adjustment Policies
Technical Paper Series, No. 5. Pakistan Institute of Development Economics,
Islamabad; Arif and Ahmad (2001); World Bank, the. 2002. Pakistan Poverty
Assessment: Poverty in Pakistan Vulnerabilities, Social Gaps, and Rural Dynamics.
Washington, DC: The World Bank; Asian Development Bank (ADB). 2002.
Poverty in Pakistan: Issues, Causes and Institutional Responses. Islamabad: ADB.
The present study
finds that Sindh
and southern
Punjab are the
poorest regions in
Pakistan.
8 Agricultural Growth and Rural Poverty
FY1985(1)
Agro-ClimaticZone
FY1988(2)
FY1994(3)
FY1999(4)
FY2002(5)
Table 2: Poverty Headcount and Change in Incidence ofPoverty by Agro-Climatic Zone
Rice/Wheat Punjab
Mixed Punjab
Cotton/Wheat Punjab
Low-Intensity Punjab
Barani Punjab
Cotton/Wheat Sindh
Rice/Other Sindh
North-West Frontier Province
Balochistan
14.30
22.70
29.30
28.00
5.70
20.50
24.30
9.10
28.50
8.20
15.90
21.90
27.10
3.90
18.90
20.60
8.20
7.90
33.10
21.00
25.40
24.20
13.80
34.10
26.90
28.70
21.90
47.70
31.40
36.50
32.60
27.50
39.40
36.80
28.20
54.40
38.27
48.93
55.51
54.17
26.43
56.81
53.07
46.90
39.06
FY = fiscal year.
Sources: For columns 1 and 2, Malik, S. J. 1992. Rural Poverty in Pakistan: Some RecentEvidence. Pakistan Development Review 31 (4); for columns 3 and 4, Arif, G. M., and Munir Ahmad. 2001. Poverty Across the Agro-Ecological Zones in RuralPakistan. Paper presented at the National Workshop on Pro-Poor Intervention Strategies in Irrigated Agriculture in Asia: Pakistan, International WaterManagement Institute, Lahore, 12 March; for column 5, author's estimates.
Poverty Headcount
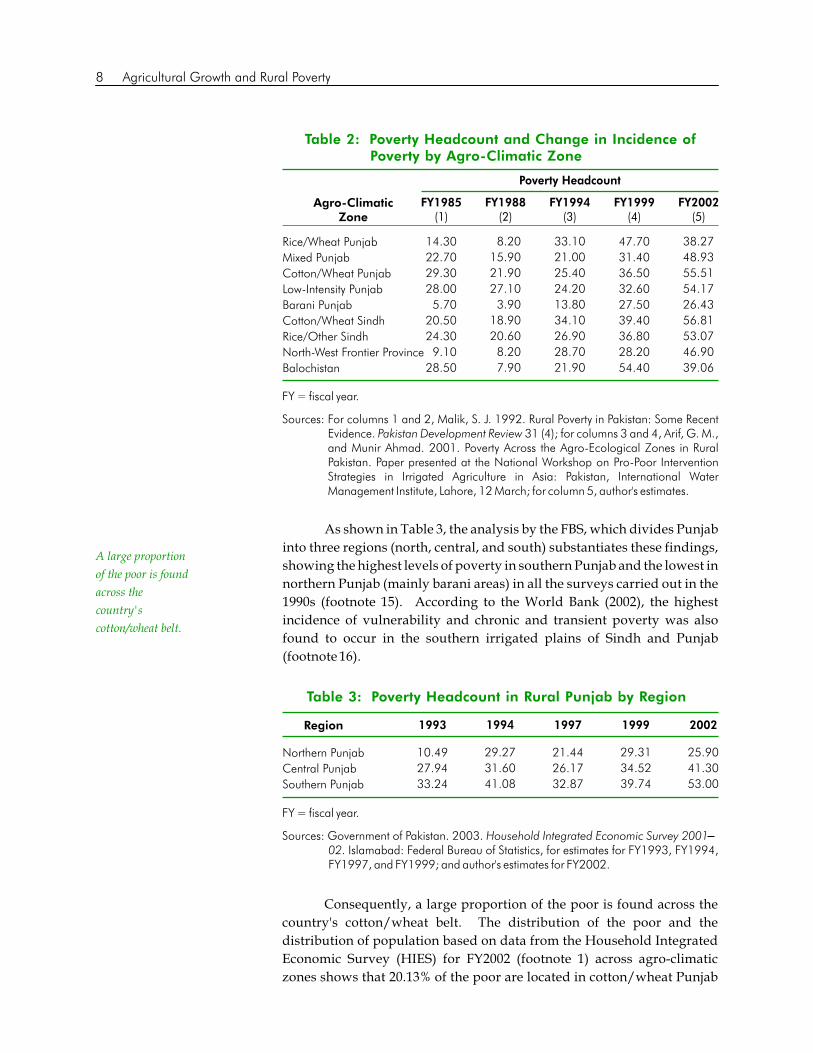
Consequently, a large proportion of the poor is found across the
country's cotton/wheat belt. The distribution of the poor and the
distribution of population based on data from the Household Integrated
Economic Survey (HIES) for FY2002 (footnote 1) across agro-climatic
zones shows that 20.13% of the poor are located in cotton/wheat Punjab
As shown in Table 3, the analysis by the FBS, which divides Punjab
into three regions (north, central, and south) substantiates these findings,
showing the highest levels of poverty in southern Punjab and the lowest in
northern Punjab (mainly barani areas) in all the surveys carried out in the
1990s (footnote 15). According to the World Bank (2002), the highest
incidence of vulnerability and chronic and transient poverty was also
found to occur in the southern irrigated plains of Sindh and Punjab
(footnote 16).
FY = fiscal year.
Sources: Government of Pakistan. 2003. Household Integrated Economic Survey 200102. Islamabad: Federal Bureau of Statistics, for estimates for FY1993, FY1994, FY1997, and FY1999; and author's estimates for FY2002.
1993Region 1994 1997 1999 2002
Table 3: Poverty Headcount in Rural Punjab by Region
Northern Punjab
Central Punjab
Southern Punjab
10.49
27.94
33.24
29.27
31.60
41.08
21.44
26.17
32.87
29.31
34.52
39.74
25.90
41.30
53.00
A large proportion
of the poor is found
across the
country's
cotton/wheat belt.

Rural Poverty: Trends, Sources of Income, and Dynamics 9
and another 13.21% in cotton/wheat Sindh (Table 4). Together, these two
zones account for over 33% of Pakistan's poor, but only about 29% of the
total population (17.47% in cotton/wheat Punjab and 11.20% in
cotton/wheat Sindh). A useful index visualizing the location of the poor
shows the share of the poor relative to the share of population in each zone.
A value of 1 for this index implies that the region in question has a share of
the poor equal to its share of the population. A value greater than 1 shows
that the zone has a higher share of poor compared to its population, and a
share less than 1 shows a smaller share of poor relative to its share of
population.
Table 4: Distribution of Poor by Agro-Climatic Zone in FY2002
Rice/Wheat Punjab
Mixed Punjab
Cotton/Wheat Punjab
Low-Intensity Punjab
Barani Punjab
Cotton/Wheat Sindh
Rice/Other Sindh
North-West Frontier Province
Balochistan
Rural Pakistan
12.17
13.61
20.13
10.88
3.09
13.21
9.28
13.86
3.77
100.00
15.32
13.40
17.47
9.67
5.63
11.20
8.42
14.24
4.65
100.00
0.79
1.02
1.15
1.12
0.55
1.18
1.10
0.97
0.81
1.00
Index: Location of Poor(Column 1 ÷ 2)
Poor (%)(1)
Agro-ClimaticZone
Population (%)(2)
FY = fiscal year.
Source: Computed from data in Government of Pakistan. 2003. Household Integrated Economic Survey 2001 02. Islamabad: Federal Bureau of Statistics.
This index is calculated in the last column of Table 4, showing that
cotton/wheat Sindh has the highest proportion of poor relative to its share
of population, followed by cotton/wheat Punjab and low-intensity
Punjab. Rice/other Sindh and mixed Punjab indicate a share of 1.10 and
1.02, respectively. Other regions have a smaller share of poor relative to
their share of population. Barani Punjab has only a little more than half its
share of poor compared to its share of population. Relatively low poverty
in the barani areas of northern Punjab is attributed first to the socio-
economic characteristics of barani areas, including the lowest dependency
ratio, the highest levels of literacy (particularly female literacy) and the
lowest number of unpaid family workers. Second, the rural areas in this
region are well integrated with prosperous urban centers that have strong
linkages to the services sector only 28% of the employed are involved in
agricultural activities. Third, the region's labor force works on a large
scale in both the armed forces and the government sector. Due to the high
incidence of domestic and overseas migration, remittances contribute a
significantly higher proportion to total household income in the barani
areas of Punjab.
Relatively low
poverty in the
barani areas of
northern Punjab is
attributed first to
the socio-economic
characteristics of
barani areas.

10 Agricultural Growth and Rural Poverty
Agro-ClimaticZone
Rice/Wheat Punjab
Mixed Punjab
Cotton/Wheat Punjab
Low-Intensity Punjab
Barani Punjab
Cotton/Wheat Sindh
Rice/Other Sindh
North-West Frontier Province
Balochistan
21.6
16.9
19.9
15.3
15.7
33.4
25.7
23.0
33.0
Table 5: Farm and Non-Farm Poverty Headcount byAgro-Climatic Zone
39.9
25.8
31.4
28.3
12.5
34.2
27.1
32.3
21.1
22.3
30.5
35.2
40.2
3.9
20.4
19.5
31.7
31.3
33.1
34.6
44.7
63.4
10.1
32.2
14.6
31.1
26.7
24.9
40.9
42.1
48.9
24.2
59.3
60.8
45.7
40.4
40.4
48.3
55.6
54.6
25.2
57.7
53.0
47.6
39.4
FY1994 FY1999
Farm Non-Farm Farm Non-Farm Farm Non-Farm
FY2002
FY = fiscal year.
Sources: Arif, G. M., and Munir Ahmad. 2001. Poverty Across the Agro-Ecological Zones in Rural Pakistan. Paper presented at the National Workshop on Pro-PoorIntervention Strategies in Irrigated Agriculture in Asia: Pakistan, International Water Management Institute, Lahore, 12 March; and author's estimates.
17 See Arif, G. M., Hina Nazli, and Rashida Haq. 2000. Rural Non-Agricultural
Employment and Poverty in Pakistan. Pakistan Development Review 39 (4). The
study distinguishes between farm and non-farm households on the basis of
individual occupation rather than the industrial status of the head of the
household.18 They use the definition provided by Qureshi and Arif (2000) to distinguish
between farm and non-farm households.
The heterogeneity of rural poverty across these zones and regions
indicates the need for further disaggregated analysis to understand the
relationship between agricultural growth and rural poverty. Table 5
examines the incidence of poverty across agro-zones by classifying rural
households into two important categories: farm and non-farm. Based on
HIES data for FY1994 and FY1999 by Qureshi and Arif (1999), a higher
incidence of poverty is reported among non-farm households in all the
provinces of Pakistan (footnote 16). These estimates classify households
by the industrial status of the head of the household, finding a
concentration of non-farm poor in Punjab in both years.
However, based on a more detailed classification, Arif, Nazli, and
Haq (2000) do not find any significant differences between the levels of17poverty for farm and non-farm workers. Arif and Ahmed (2001)
(footnote 7) examine the levels of poverty for farm and non-farm
households across agro-climatic zones during FY1994 and FY1999, and
find a higher incidence of poverty among non-farm households in all18zones of Punjab, with the exception of its barani zone in FY1994.
The results of the present analysis for FY2002 presented in the last
two columns of Table 5 are interesting: poverty among non-farm
A higher incidence
of poverty is
reported among
non-farm
households in all
the provinces of
Pakistan.

Rural Poverty: Trends, Sources of Income, and Dynamics 11
households remained higher in all zones of Punjab but not in Sindh. One
reason for this could be the significantly larger share of tenants in Sindh
that drives up poverty estimates for the farm sector. In Sindh, owner farms
are generally larger while tenant farms tend to be much smaller than in
other provinces. This leads to the question, what are the sources of income
for rural households across these agro-climatic zones?
In Pakistan, very little analysis is available on the sources of income19in rural areas. Previous studies, including Alderman and Garcia (1993),
20 21Adams and He (1995), Adams (1996), and the World Bank (2002)
(footnote 16), point to the increasing importance of non-farm incomes for
rural households. This study defines five major sources of income in rural
Pakistan:
Wages/salaries,
Transfer income,
Crop income,
Rental income,
Livestock income.
The distribution of income from these sources based on HIES data
for FY2002 (footnote 1) is presented in Table 6. This distribution, along
with the poverty estimates from the same survey (column 5 of Table 2)
reveals that crop income accounts for 67.30% of the total income generated
in cotton/wheat Sindh and 64.26% of the total income in cotton/wheat
Punjab. These ratios are highest across these two zones, thus showing that
the highest incidence of poverty occurs in zones that rely most heavily on
crop income.
Three other features of this income distribution by source have
significant implications for the poverty question (Tables 2 and 6). These
are:
Crop income in overall rural Pakistan accounted for only about50% of the total income in FY2002;
Wages and salaries, and transfer incomes are also significantincome sources;
2.3 Sources of Income
(i)
(ii)
(iii)
(iv)
(v)
(i)
(ii)
19 Alderman, H., and M. Garcia. 1993. Poverty, Household Security, and Nutrition
in Rural Pakistan. Research Report 96. International Food Policy Research
Institute, Washington, DC.20 Adams Jr., Richard H., and Jane J. He. 1995. Sources of Income Inequality and
Poverty in Rural Pakistan. Research Report 102. International Food Policy
Research Institute, Washington, DC.21 Adams Jr., Richard H. 1996. Remittances, Income Distribution, and Rural Asset
Accumulation. Food Consumption and Nutrition Division (FCND) Discussion
Paper No. 17. International Food Policy Research Institute, Washington, DC.
The highest
incidence of
poverty occurs in
zones that rely
most heavily on
crop income.

12 Agricultural Growth and Rural Poverty
Based on the information given in Tables 2 and 6, the Spearman
rank correlation coefficient between the headcount of poverty and the
percentage share from crop income in FY2002 is + 0.87 and significant at
the 1% level. This result confirms the finding that higher levels of poverty
are associated with a greater reliance on crop income. Poverty is high in
zones where the possibility of diversifying incomes in order to manage
risk is limited.
Another important aspect of the rural distribution of income needs
to be highlighted. Crop income accounts for only about 27% of the total
income of very small farm households with operated land holdings of up
to 1 acre (Table 7).
(iii) The incidence of poverty is low in zones where the percentage ofincomes from wages and salaries and transfer incomes is high.
Table 6: Share of Different Income Sources in Total Incomeby Zone in FY2002
Rice/Wheat Punjab
Mixed Punjab
Cotton/Wheat Punjab
Low-Intensity Punjab
Barani Punjab
Cotton/Wheat Sindh
Rice/Other Sindh
North-West Frontier
Province
Balochistan
Rural Pakistan
37.39
37.60
26.45
31.05
56.94
29.76
37.14
41.38
54.16
35.81
12.85
15.12
5.33
8.68
29.26
1.22
1.90
33.84
3.69
11.14
44.50
41.59
64.26
55.37
13.02
67.30
59.59
21.43
39.33
49.49
3.61
2.45
1.69
2.23
0.05
0.57
0.51
1.96
0.36
1.73
1.65
3.24
2.28
2.68
0.73
1.15
0.86
1.40
2.46
1.84
100.00
100.00
100.00
100.00
100.00
100.00
100.00
100.00
100.00
100.00
Wages andSalaries
TransferIncome
CropIncome
RentalIncome
LivestockIncome
TotalIncome
Agro-ClimaticZone
FY = fiscal year.
Source: Computed from data in Government of Pakistan. 2003. Household Integrated Economic Survey 2001 02. Islamabad: Federal Bureau of Statistics.
Wagesand
SalariesTransferIncome
CropIncome
RentalIncome
LivestockIncome
TotalMonthlyIncome
Size of OperatedLand Holding
(Acres)Households
(%)
None
Up to 1
Up to 5
Up to 12.5
More than 12.5
All households
76.25
45.46
23.44
9.40
4.54
35.81
20.11
24.07
10.31
4.33
2.06
11.14
1.43
26.73
61.16
82.44
89.10
49.49
0.74
1.00
2.53
1.64
2.95
1.73
1.47
2.73
2.56
2.20
1.35
1.84
100.00
100.00
100.00
100.00
100.00
100.00
56.61
5.12
18.01
13.95
6.31
100.00
Table 7: Share of Different Income Sources in Total Income bySize of Operated Land Holding in FY2002
FY = fiscal year.
Source: Computed from data in Government of Pakistan. 2003. Household Integrated Economic Survey 2001 02. Islamabad: Federal Bureau of Statistics.
Poverty is high in
zones where the
possibility of
diversifying
incomes in order to
manage risk is
limited.

Rural Poverty: Trends, Sources of Income, and Dynamics 13
In fact, these households should be classified as non-farm
households. Following this classification, non-farm households account
for over 60% of total rural households (56.61% with no land and 5.12% with
less than 1 acre). Poverty alleviation strategies aimed at providing gainful
sources of alternative employment to this 60% of rural households should
receive much greater focus than they presently do.
Sources of income differ not only across agro-climatic zones, but
also across poverty status in each zone (Table 8). Crop income is an
important source for non-poor households while poor households
generally rely on wages and salaries.
Wagesand
SalariesTransferIncome
CropIncome
RentalIncome
LivestockIncome
TotalIncome
Agro-ClimaticZone
Source: Computed from data in Government of Pakistan. 2003. Household Integrated
Economic Survey 2001 02. Islamabad: Federal Bureau of Statistics.
PovertyStatus
Table 8: Sources of Income by Agro-Climatic Zone andPoverty Status
Rice/Wheat Punjab
Mixed Punjab
Cotton/Wheat Punjab
Low-Intensity Punjab
Barani Punjab
Cotton/Wheat Sindh
Rice/Other Sindh
North-West Frontier
Province
Balochistan
Rural Pakistan
Poor
Non-poor
Total
Poor
Non-poor
Total
Poor
Non-poor
Total
Poor
Non-poor
Total
Poor
Non-poor
Total
Poor
Non-poor
Total
Poor
Non-poor
Total
Poor
Non-poor
Total
Poor
Non-poor
Total
Poor
Non-poor
Total
63.28
29.62
37.39
48.48
31.44
37.60
39.36
18.04
26.45
36.11
26.01
31.05
64.85
54.79
56.94
30.13
29.37
29.76
34.02
39.85
37.14
44.92
39.05
41.38
56.24
53.05
54.16
41.66
32.08
35.81
9.04
13.99
12.85
12.28
16.73
15.12
4.40
5.93
5.33
7.84
9.51
8.68
19.24
31.98
29.26
0.87
1.58
1.22
1.16
2.55
1.90
28.87
37.10
33.84
1.49
4.87
3.69
7.96
13.16
11.14
24.83
50.40
44.50
33.60
46.12
41.59
53.39
71.34
64.26
51.93
58.79
55.37
14.94
12.50
13.02
67.65
66.93
67.30
64.21
55.57
59.59
23.38
20.15
21.43
40.60
38.65
39.33
47.78
50.58
49.49
1.52
4.24
3.61
1.31
3.09
2.45
0.65
2.37
1.69
1.11
3.35
2.23
0.00
0.07
0.05
0.05
1.13
0.57
0.18
0.79
0.51
1.27
2.42
1.96
0.00
0.56
0.36
0.69
2.38
1.73
1.32
1.75
1.65
4.33
2.63
3.24
2.20
2.32
2.28
3.01
2.35
2.68
0.97
0.66
0.73
1.30
0.98
1.15
0.43
1.23
0.86
1.56
1.29
1.40
1.67
2.88
2.46
1.90
1.80
1.84
100.00
100.00
100.00
100.00
100.00
100.00
100.00
100.00
100.00
100.00
100.00
100.00
100.00
100.00
100.00
100.00
100.00
100.00
100.00
100.00
100.00
100.00
100.00
100.00
100.00
100.00
100.00
100.00
100.00
100.00
Crop income is an
important source
for non-poor
households while
poor households
generally rely on
wages and salaries.

14 Agricultural Growth and Rural Poverty
Over 45% of total crop income is generated in the cotton/wheat
zones of Punjab and Sindh, 26% of which goes to non-poor households
(Appendix 1). In barani Punjab and NWFP, transfer income is a more
important source of income, followed by wages and salaries. Most non-
poor households depend on transfer income in these zones. It is, therefore,
important to examine the sources of farm and non-farm income in more
detail to see how they vary in importance across regions for both poor and
non-poor households.
Due to the highly skewed distribution of land in rural Pakistan,
farm income was found to be an inequality-increasing source of income
during the early 1990s. A high correlation was found to exist between farm
income and land ownership, and an uneven distribution in favor of the
rich, as substantiated in Alderman and Garcia (1993) (footnote 19), and
Adams and He (1995) (footnote 20). Wheat and rice appeared the most
important crops for poor households; while rich households depended on22sugarcane and other crops. Recent household survey data indicate large
variations in average crop income across poverty status (Table 9). Better-
off households in rural areas derive a larger share of their income from
crop production (Appendix 1). Due to the unequal distribution of land, an
increase in crop income serves to exacerbate inequality. There is also a
greater level of income diversity among households belonging to upper
income quintiles since they have the resources to invest in business and/or
human capital. Within crop income, the poor rely mainly on food crops
such as wheat, while the rich diversify crop production by growing more
cash crops such as sugarcane and cotton.
Livestock plays an important role in the process of income
generation. Adams and He (1995) classify it as an inequality-reducing
source of income (footnote 20). A majority of poor households, especially
those who are landless or small landowners, depend on livestock for
income. Nazli (2003) found that 47% of rural households depend on either
farm cultivation or livestock for their livelihood while 13% of households
depend solely on livestock; the incidence of poverty is found to be highest23among the latter. According to Adams and He (1995), local cows and
female buffalo are the main sources of livestock income for both the
poorest as well as richest households (footnote 20). The poor, however,
derive 60% of their livestock income from local cows whereas the rich
depend more on female buffalo.
2.3.1 Farm Income
2.3.2 Livestock Income
22 These included cotton, groundnut, rapeseed, mustard, and others.23 Nazli, Hina. 2003. Rural Labor Markets in Pakistan: Institutions and Constraints.
Background paper prepared for Pakistan Rural Factor Market Study. The World
Bank, Washington, DC.
Within crop
income, the poor
rely mainly on food
crops such as
wheat.

Rural Poverty: Trends, Sources of Income, and Dynamics 15
Source: Computed from data in Government of Pakistan. 2003. Household Integrated Economic Survey 2001 02.
Islamabad: Federal Bureau of Statistics.
0.78
1.06
1.28
3.12
0.45
0.17
0.26
10.89
3.98
1.59
2.74
2.36
2.98
1.22
7.63
1.67
2.36
9.21
3.86
2.82
2.47
1.98
2.41
2.12
5.60
0.87
1.29
9.96
3.90
2.35
21.60
22.71
12.96
14.78
36.32
5.19
7.94
29.58
8.87
12.18
18.75
19.24
12.31
16.88
22.65
6.06
6.84
30.02
7.43
13.91
19.13
20.26
12.52
15.89
26.52
5.60
7.40
29.83
7.98
13.24
100.00
100.00
100.00
100.00
100.00
100.00
100.00
100.00
100.00
100.00
100.00
100.00
100.00
100.00
100.00
100.00
100.00
100.00
100.00
100.00
100.00
100.00
100.00
100.00
100.00
100.00
100.00
100.00
100.00
100.00
Table 9: Sources of Farm Income by Poverty Status and Agro-Climatic Zone in FY2002
VegetablesOtherCrops
TotalCrop
IncomeCotton Sugarcane Rice Maize Pulses FruitsAgro-Climatic
Zone Wheat
Poor Households
Non-Poor Households
All Households
Rice/Wheat Punjab
Mixed Punjab
Cotton/Wheat Punjab
Low-Intensity Punjab
Barani Punjab
Cotton/Wheat Sindh
Rice/Other Sindh
North-West Frontier
Province
Balochistan
Rural Pakistan
Rice/Wheat Punjab
Mixed Punjab
Cotton/Wheat Punjab
Low-Intensity Punjab
Barani Punjab
Cotton/Wheat Sindh
Rice/Other Sindh
North-West Frontier
Province
Balochistan
Rural Pakistan
Rice/Wheat Punjab
Mixed Punjab
Cotton/Wheat Punjab
Low-Intensity Punjab
Barani Punjab
Cotton/Wheat Sindh
Rice/Other Sindh
North-West Frontier
Province
Balochistan
Rural Pakistan
37.98
42.52
32.11
38.57
44.23
26.61
29.15
22.86
41.72
31.73
40.22
31.65
31.01
40.62
42.48
23.69
19.25
23.47
46.79
31.81
39.91
34.84
31.38
39.65
42.97
25.24
24.30
23.20
44.85
31.78
0.71
3.48
46.21
35.92
0.00
53.55
4.75
0.17
3.96
30.65
0.35
2.49
44.16
28.63
0.00
44.07
2.59
0.09
4.41
21.52
0.40
2.78
44.85
32.06
0.00
49.10
3.69
0.12
4.24
25.03
8.09
16.73
3.49
3.27
0.00
11.25
9.56
7.13
2.18
8.05
3.65
16.37
3.87
6.80
0.00
21.37
20.50
7.61
1.01
9.87
4.25
16.47
3.74
5.14
0.00
16.00
14.92
7.39
1.46
9.17
24.41
11.00
2.41
0.70
2.02
1.88
46.15
2.94
22.21
11.53
33.47
6.91
1.73
0.87
1.16
1.40
28.29
2.04
8.99
11.41
32.23
8.11
1.96
0.79
1.40
1.66
37.40
2.44
14.06
11.46
0.04
0.78
0.13
0.33
13.66
0.02
0.36
20.94
3.12
1.60
0.27
2.41
0.25
0.26
18.91
0.00
0.58
20.71
1.24
1.67
0.24
1.93
0.21
0.29
17.43
0.01
0.47
20.81
1.96
1.65
0.00
0.95
0.35
3.20
3.33
0.00
0.97
1.25
0.01
0.76
0.31
1.60
0.42
3.40
7.15
0.00
0.02
1.22
0.24
0.78
0.27
1.41
0.40
3.31
6.07
0.00
0.51
1.23
0.16
0.77
6.39
0.76
1.06
0.11
0.00
1.34
0.86
4.23
13.95
1.91
0.26
16.96
3.26
1.31
0.02
1.74
19.57
5.63
26.02
6.21
1.09
12.21
2.53
0.74
0.01
1.52
10.03
5.01
21.39
4.55

16 Agricultural Growth and Rural Poverty
This study finds the ownership of female buffalo and local cows to
be an inequality-reducing source of income while the ownership of male
buffalo and bullocks is inequality-increasing. Data from the HIES for
FY2002, however, indicate that income from livestock forms a small
proportion of overall household income (less than 2%) and that it increases
only marginally across income quintiles (footnote 1). Based on this
dataset, the highest livestock income is reported in the cotton/other zone
of Sindh and in Balochistan, and the lowest in mixed Punjab.
Much more in-depth research is needed on the low contribution of
livestock to overall household income, as computed from the HIES
datasets, keeping in view that 40% of the value addition to the agriculture
sector is from livestock, and that this contribution is equal to that of the
crop sector. It is likely that the HIES does not provide an accurate
valuation of livestock produce consumed at home or gifted out.
Given the lack of employment opportunities in the farm sector, the
focus of rural households has shifted towards the non-farm sector. Adams
and He (1995), for example, observe that the non-farm sector was the most
important source of income in rural areas, and indicate that self-
employment, unskilled labor, and government employment are three
major sources of non-farm income (footnote 20). The World Bank (2002)
also observes a high dependency on non-farm sources of income in rural
Pakistan: about 44% of rural households were found to depend on non-
farm sources of income in 2001, of which 40% belonged to the lowest
income group and 45% to the highest income group (footnote 16).
Non-farm income forms a considerable share of total income (73%)
for landless households. This share was found to be higher for households
belonging to the highest income groups. Wage income appears the largest
source of non-farm income. Arif, Nazli, and Haq (2000) find that wages,
salaries and self-employment income are the major sources of non-farm
income (footnote 17). In their sample, these categories apply to more than
94% of all non-farm workers. They find a significant difference in the
nature of activities between self-employed and wage employees. For the
self-employed, wholesale and retail trade appear the most important
economic activities, whereas wage employees are concentrated in the
construction sector.
2.3.3 Non-Farm Income
Self-employment,
unskilled labor, and
government
employment are
three major sources
of non-farm
income.

Rural Poverty: Trends, Sources of Income, and Dynamics 17
Table 10: Sources of Non-Farm Income by Poverty Status and Agro-Climatic Zonein FY2002
100.00
100.00
100.00
100.00
100.00
100.00
100.00
100.00
100.00
100.00
100.00
100.00
100.00
100.00
100.00
100.00
100.00
100.00
100.00
100.00
100.00
100.00
100.00
100.00
100.00
100.00
100.00
100.00
100.00
100.00
TotalNon-Farm
IncomeServicesConstructionWholesale/Retail Trade
Hotel/RestaurantOperation
Transport/Communication
Agro-ClimaticZone
Manufacturing/Mining
Rice/Wheat Punjab
Mixed Punjab
Cotton/Wheat Punjab
Low-Intensity Punjab
Barani Punjab
Cotton/Wheat Sindh
Rice/Other Sindh
North-West Frontier Province
Balochistan
Rural Pakistan
Rice/Wheat Punjab
Mixed Punjab
Cotton/Wheat Punjab
Low-Intensity Punjab
Barani Punjab
Cotton/Wheat Sindh
Rice/Other Sindh
North-West Frontier Province
Balochistan
Rural Pakistan
Rice/Wheat Punjab
Mixed Punjab
Cotton/Wheat Punjab
Low-Intensity Punjab
Barani Punjab
Cotton/Wheat Sindh
Rice/Other Sindh
North-West Frontier Province
Balochistan
Rural Pakistan
24.32
21.87
8.35
10.29
12.38
7.78
10.51
7.45
1.02
12.21
27.08
16.74
10.49
9.60
4.98
10.45
10.21
4.36
2.23
12.15
26.00
19.14
9.24
10.00
6.78
9.05
10.34
5.69
1.80
12.18
18.92
17.28
19.83
17.73
36.00
12.92
19.28
22.86
25.59
19.43
6.71
9.64
9.12
8.11
14.67
8.87
6.87
8.45
14.94
9.35
11.48
13.20
15.41
13.69
19.86
10.98
12.15
14.65
18.80
13.91
15.79
16.49
16.01
11.45
11.04
7.28
9.66
14.53
5.74
12.71
21.33
20.74
18.69
13.46
15.91
11.03
17.19
17.38
11.07
16.99
19.17
18.76
17.12
12.29
14.72
9.08
13.99
16.15
9.14
15.05
1.71
1.49
1.73
1.32
0.00
1.13
1.70
0.41
2.05
1.36
2.39
2.47
1.15
0.90
0.34
1.47
3.09
1.43
5.02
2.05
2.13
2.02
1.49
1.14
0.26
1.29
2.49
0.99
3.94
1.74
7.04
8.77
9.20
11.07
5.74
6.67
8.36
15.74
14.76
9.55
8.91
10.59
8.19
6.69
12.29
7.91
5.21
13.81
17.76
10.14
8.18
9.74
8.78
9.23
10.69
7.27
6.55
14.64
16.67
9.87
13.76
17.13
19.71
27.41
32.95
19.80
22.84
26.61
33.16
21.71
22.86
28.98
29.80
45.22
46.70
33.63
27.50
43.18
36.59
33.52
19.31
23.45
23.87
34.89
43.35
26.42
25.52
36.05
35.35
28.17
Poor Households
Non-Poor Households
All Households
FY = fiscal year.
Note: The total of each row does not add up to 100 since some columns have been suppressed to highlight the important
sources of non-farm income.
Source: Computed from data in Government of Pakistan. 2003. Household Integrated Economic Survey 2001 02.
Islamabad: Federal Bureau of Statistics.

18 Agricultural Growth and Rural Poverty
An analysis of the HIES dataset for FY2002 indicates that a majority
of poor households derive their non-farm income from the construction
sector (Table 10). According to the Labour Force Survey for FY2000, this
sector is characterized by the highest incidence of under-employment:
nearly half the employed persons in this sector were found to be under-24employed. This sector absorbs unskilled and/or low-skilled labor. The
services sector, on the other hand, appears to be the most important source
of non-farm income for better-off households. For example, households
belonging to the highest income group derive 50% of their non-farm
income from the services sector. In addition, wholesale and retail trade,
and transport and communication also contribute significantly to the non-
farm income of non-poor households.
The foregoing analysis indicates a higher incidence of vulnerability
among households who depend solely on agriculture. Rural areas that are
well connected with urban centers seem to be more prosperous. The lack
of employment opportunities in rural areas results in either labor
reallocation or migration. In both cases, human capital plays a positive
and significant role. The poorest of the poor possess neither the human
capital nor the resources to migrate this vulnerable group needs special
attention.
Income from the non-farm sector derives from diverse activities.
The poor tend to be found in low-productivity activities that demand low
levels of skill and little education, whereas within wage work, the poor are
generally involved in unskilled labor in the construction sector. The poor
tend to be concentrated in regions that involve minimum investment since
they lack the resources to invest in high-productivity self-employment or
wage work. Better-off households in the non-farm sector invest in high-
productivity self-employment activities that demand high physical
capital, or engage in wage work that offers high returns but requires high
levels of human capital.
Poor rural households do not necessarily remain poor forever.
While more rural households have fallen into poverty since the 1990s than
at any other time, some may indeed have escaped it. These movements
into and out of poverty have rarely been examined in Pakistan because
data that might provide information on such poverty dynamics are scarce.
However, the International Food Policy Research Institute's (IFPRI)
survey of 728 households conducted between 1986 and 1991 contains
2.4 Rural Poverty Dynamics
24 Government of Pakistan. 2001. Labour Force Survey. Islamabad: FBS.
The foregoing
analysis indicates a
higher incidence of
vulnerability
among households
who depend solely
on agriculture.

25 This survey was conducted in the rural areas of four districts chosen from each
province of Pakistan, during a period of 14 visits to the same 728 households
across 6 years between 1986 and 1991. In this survey, one of the poorest districts
in each province was selected based on a ranking of districts according to levels
of development. The four districts thus selected were Attock in Punjab, Badin in
Sindh, Dir in the NWFP, and Kalat in Balochistan. In addition to these districts,
Faisalabad (one of the more prosperous districts in Punjab) was chosen as a
control unit. Two markets (mandis) within each district were chosen at random
as primary sampling units, and 52 villages were selected on the basis of their
distance from the main markets serving these districts. Households were
randomly selected from a complete list of households in each village. Data were
collected from the selected households on a wide range of topics: income,
expenditure, food consumption, nutrition and health status, education,
employment, land ownership and rural credit. For details, see Alderman and
Garcia (1993), and Adams and He (1995).26 Baulch, Bob, and Neil McCulloch. 1998. Being Poor and Becoming Poor:
Poverty Status and Poverty Transitions in Rural Pakistan. Institute of
Development Studies (IDS) Working Paper No. 79. IDS, Sussex. Available
http://www.ids.ac.uk/ids/pvty/pvprp.html
Rural Poverty: Trends, Sources of Income, and Dynamics 19
25useful information on poverty dynamics. Analyzing this panel data,
Baulch and McCulloch (1998) constructed a poverty transition matrix for
poor and non-poor households for each sequential pair of years between26the first and last years of the panel. A high level of mobility was observed
throughout the period. For example, the results of the 5-year panel show
that, although 21% to 29% of households fall below the poverty line in any
given survey year, the probability of entering into poverty ranges between
0.15 and 0.24, while the probability of overcoming poverty varies between
0.43 and 0.51 (Table 11). The sample entry and exit probabilities for the five
pairs of sequential years indicate an increase in the probability of moving
into poverty and a decline in the probability of escaping it. This is also
reflected in the rising trend in poverty headcount.
Probability of EscapingPoverty
Headcount(%)
HouseholdsMoving In or
Out of Poverty (%)Year
Probability of EnteringPoverty
Table 11: Sample Entry and Exit Probabilities for Poverty
FY1987 to FY1988
FY1988 to FY1989
FY1989 to FY1990
FY1990 to FY1991
FY1987 to FY1991
0.15
0.17
0.20
0.20
0.24
0.51
0.43
0.51
0.46
0.49
21.40
25.20
27.10
29.30
29.30
22.00
22.20
27.60
27.00
29.00
FY = fiscal year.
Source: Baulch, Bob, and Neil McCulloch. 1998. Being Poor and Becoming Poor:Poverty Status and Poverty Transitions in Rural Pakistan. Institute of Development Studies (IDS) Working Paper No. 79. IDS, Sussex. Available http://www.ids.ac.uk/ids/pvty/pvprp.html.
The results of the
5-year panel show
that, although 21%
to 29% of
households fall
below the poverty
line in any given
survey year, the
probability of
entering into
poverty ranges
between 0.15 and
0.24.

27 McCulloch, Neil, and Bob Baulch. 1999. Distinguishing the Chronically from the
Transitorily Poor: Evidence from Pakistan. IDS Working Paper No. 97. IDS,
Sussex. Available http://www.ids.ac.uk/ids/pvty/pvprp.html28 McCulloch, Neil, and Bob Baulch. 2000. Simulating the Impact of Policy Upon
Chronic and Transitory Poverty in Rural Pakistan. Journal of Development Studies
36 (6).
ChronicallyPoor
TransitorilyPoor TotalNo. of Periods
Table 12: Number of Periods: Poor by Poverty Status
1
2
3
4
5
Total
1
7
33
44
20
105
164
92
37
2
0
295
165
99
70
46
20
400
Source: McCulloch, Neil, and Bob Baulch. 1999. Distinguishing the Chronically from the Transitorily Poor: Evidence from Pakistan. Institute of Development Studies (IDS) Working Paper No. 97. IDS, Sussex. Available http://www.ids.ac.uk/ids/pvty/pvprp.html.
20 Agricultural Growth and Rural Poverty
McCulloch and Baulch (2000), in a third study, decomposed
estimates of the poverty headcount, poverty gap, and square of the28poverty gap into transitory and chronic components. Their results
indicated that 61% of poverty is caused by the chronic component, while
62% of the poverty gap and 82% of the square of the poverty gap can be
attributed to the transitory component. This indicates that both the depth
and severity of poverty is higher among transitorily poor households and
that poverty in the panel is predominantly explained by fluctuations in
income rather than by levels of average income.
The McCulloch and Baulch (2000) study also simulates the impact
of policy intervention on the severity of chronic and transitory poverty
(footnote 28). The study examines the impact of two types of policies:
those designed to 'smooth' incomes, and those designed to 'increase
growth in income'. The authors find that an increase in income leads to a
greater reduction in chronic poverty, but that its effect on transitory
poverty is almost negligible. The smoothing of income, on the other hand,
reduces overall poverty through a reduction in transitory poverty, but
does not significantly reduce chronic poverty. These results indicate that
transitory poverty can be reduced if policy interventions aim at leveling
In order to distinguish the chronically poor from the transient poor
in rural Pakistan, McCulloch and Baulch (1999) conducted another study
using the same IFPRI panel data, and found that 58% of the sampled
households experienced poverty at least once during the 5 years of the27panel survey. Of these, 73% were transitorily poor and 26% were
chronically poor (Table 12). Chronically poor households remained poor
for longer periods compared to transitorily poor households.
Both the depth and
severity of poverty
is higher among
transitorily poor
households.

out income fluctuations. The results also show that a reduction in chronic
poverty is possible through large and sustained growth in household
incomes.
Using the IFPRI dataset but applying a different methodology,29Villanger's (2003) findings substantiate the results of the McCulloch and
Baulch (2000) study (footnote 28). Examining the impact of natural
disasters on the income mobility of rural households in Pakistan, Villanger
finds that consequent to a shock/disaster, the probability of remaining
poor is much higher among poor households than it is for rich households.
Research conducted by Kurosaki (2002) based on a panel dataset of
299 sample households surveyed in 1996 and 1999 in three villages in the
Peshawar district of NWFP, also found a higher incidence of transitory30poverty. Contrary to other studies, Kurosaki (2003) observes a partial
transformation of income variability into consumption variability due to31the ex-post risk coping mechanism. Households that are excluded from
such coping mechanisms are found to be more vulnerable, exhibiting a
higher risk of a substantial fall in consumption, a loss of land assets, and a
drastic cut in children's school enrollment.
Based on more recent data from rural Pakistan, the World Bank
(2002) indicates that nearly 57% of households are prone to poverty as they
are clustered around the poverty line (these households lie between 0.75 to
1.25 times the poverty line) (footnote 16). Of those prone to falling into32poverty, 69% were found to be vulnerable. On the other hand, only 2% of
households with mean expenditure levels greater than 1.25 times the
poverty line could be classified as vulnerable, although some did
29 Villanger, Espen. 2003. The Effects of Disasters on Income Mobility in Rural Pakistan:
Bootstrap Inference and Measurement Error Simulations. Bergen: Norwegian School
of Economics. Villanger uses a simple bootstrap method to facilitate statistical
inference based on mobility matrices, and constructs confidence intervals for the
probability estimates.30 Kurosaki, Takashi. 2002. Consumption Vulnerability and Dynamic Poverty in
the North-West Frontier Province, Pakistan. Available www.ier.hit-
u.ac.jp/~kurosaki. In this study, the choice of villages was based on different
levels of economic development. The first selection criterion was agricultural
technology: one of the three sample villages was rain-fed, another semi-
irrigated, and the other fully irrigated. The second criterion was location, i.e.,
villages should be located along the rural-urban continuum. Real per capita
consumption expenditure was used as a welfare indicator.31 . 2003. Measurement of Chronic and Transient Poverty: Theory and
Application to Pakistan. Discussion Paper Series A, No. 436. Institute of
Economic Research at Hitotsubashi University, Tokyo.32 Households with mean expenditure levels below 0.75% of the poverty line were
classified as vulnerable although they exhibited a substantially smaller variance
in estimated expenditure.
Rural Poverty: Trends, Sources of Income, and Dynamics 21
Consequent to a
shock/disaster, the
probability of
remaining poor is
much higher
among poor
households than it
is for rich
households.

22 Agricultural Growth and Rural Poverty
experience transient poverty. These results indicate that vulnerability to
poverty in rural Pakistan is due to low mean expenditure levels as well as
variations in expenditure due to shocks.

3 Agricultural Growth and Rural Poverty
3.1 Decomposing the Agricultural Growth of the
1990s
The main objective of this paper is to explore the unexpected
relationship between the reported reasonable agricultural growth and rise
in poverty witnessed during the 1990s. High agricultural growth is
considered a key factor in ensuring macroeconomic stability and poverty
reduction; a focus on overall growth-oriented policies can help alleviate
rural poverty. Understanding the effect of agricultural growth on poverty
requires an in-depth analysis of trends in agricultural growth. This
section first deconstructs the growth of agriculture, establishes the reasons
why the high reported agricultural growth in the 1990s was a statistical
artifact, and then discusses fluctuations in agricultural growth. As
mentioned earlier, poverty levels tend to be higher across the country's
cotton/wheat belt. This is illustrated in the cotton/wheat Punjab zone in
terms of its crop production.
Overall agricultural growth is a composite of the growth of
different sub-sectors, e.g., crop and livestock; each of these sub-sectors has
a different impact on income distribution, and, accordingly, on poverty
(footnotes 20 and 21). Any conclusive statement regarding the growth and
poverty nexus, therefore, needs to be made in the light of a disaggregated
analysis.
According to official statistics, the agriculture sector grew at an
overall rate of 4.6% per annum during the 1990s. However, after FY1997,
the combined scarcity of water and persistent drought affected
agricultural growth badly, causing economic growth to slow down during
the last 2 years of the decade. The crop sub-sector, in particular, declined
during these years, with a substantial fall in the value-added of major
crops. However, the livestock and fisheries sub-sectors grew remarkably
during this period (Table 13). Wheat, rice, cotton, and sugarcane account
for 90% of the total major crop production (Appendix 1) while the share of
major crops in total agricultural value-added is 41% (Table 13). This
indicates that these four crops contribute nearly 37% to the total
agricultural value-added.
High agricultural
growth is
considered a key
factor in ensuring
macroeconomic
stability and
poverty reduction.

24 Agricultural Growth and Rural Poverty
Share ofAgriculturein GDP (%)Year
GDPGrowthRate (%)
MajorCrops
MinorCrops Livestock Fishing Forestry
Table 13: Composition of Agriculture Sector, GDP Growth, and Agricultural Value-Added
Share of Agricultural Value-Added (%)
Growth Rate for Period
FY1992
FY1993
FY1994
FY1995
FY1996
FY1997
FY1998
FY1999
FY2000
FY2001
FY2002
FY2003
FY1970 to FY1975
FY1975 to FY1980
FY1980 to FY1985
FY1985 to FY1990
FY1990 to FY1995
FY1995 to FY2000
FY2000 to FY2002
7.57
2.10
4.37
5.06
6.60
1.70
3.49
4.18
3.91
2.20
3.40
5.10
4.58
5.25
6.46
5.40
4.56
3.67
2.98
26.25
24.35
24.55
24.91
26.10
25.70
25.95
25.40
25.93
24.64
23.90
23.60
1.39
3.52
2.50
4.45
3.44
4.03
(0.65)
50.40
44.91
43.21
44.07
41.80
39.94
41.37
40.57
44.14
40.72
40.00
40.64
0.79
3.43
1.37
3.23
1.19
3.77
(10.27)
16.18
17.75
19.00
19.06
17.90
18.04
18.67
19.08
16.35
16.79
16.49
15.90
3.88
3.98
2.40
5.55
5.70
2.59
1.10
28.81
32.25
32.48
32.16
36.40
37.89
35.97
36.41
34.97
37.86
39.31
38.85
1.98
3.09
4.65
5.91
5.62
7.08
8.44
0.91
0.95
0.95
0.91
0.61
0.67
0.50
0.49
0.97
1.10
1.08
1.13
7.19
17.77
(4.24)
7.12
(3.58)
2.61
11.02
3.71
4.13
4.35
3.79
3.29
3.45
3.49
3.45
3.57
3.53
3.11
3.48
(12.91)
11.19
7.07
4.38
4.12
3.73
0.15
FY = fiscal year, GDP = gross domestic product.
Sources: Computed from data in Government of Pakistan. Pakistan Economic Survey. Various issues. Islamabad: Economic Advisor's Wing/Finance Division.
The share of wheat, rice, and sugarcane in the total major crop
value-added has increased over time, although that of cotton has declined,
and yields show a fluctuating pattern during the 1990s the cotton yield
fluctuated between 0.77 to 0.49 tons per hectare in this period (Appendix331). These fluctuations are reflected in the performance of the crop sub-
sector and have a significant effect on the performance of the overall
agriculture sector and, therefore, on GDP. For example, a fall in
agricultural output in FY1993 and FY1997 coincided with a slowing down
of overall economic growth as reported in the Pakistan Economic Surveys34for those years.
33 Pickney, Thomas C. 1989. The Demand for Public Storage of Wheat in Pakistan.
Research Report 77. IFPRI, Washington, DC. According to the agro-climatic
classification given in this study, the cotton zone consists of 19 districts: 9 in
Punjab and 10 in Sindh. The ranking given in Social Policy Development Center.
2001. Annual Review. Karachi: Social Policy Development Center, places most of
these districts at lower levels not only within the province but also at a national
level.34 Government of Pakistan. Pakistan Economic Survey. Various issues. Islamabad:
Economic Advisor's Wing/Finance Division.

Agricultural Growth and Rural Poverty 25
Livestock is another important sub-sector of agriculture.
According to the Pakistan Economic Survey, nearly 40% of Pakistan's rural
population is engaged in livestock activities (footnote 34). This sub-sector
contributes 39% to the agricultural value-added, which is nearly as much
as the crop sector and about 9% of the GDP. Yet data from the HIES
(footnote 1) show that income from livestock accounts for only 1.84% of
rural income (Tables 6 and 7). This anomaly needs to be explored further.
Livestock production includes milk, beef, mutton, poultry meat,
wool, hair, bones, fat, blood, eggs, hides, and skins. A considerable
increase in the population of livestock and production of livestock
products has been noted (footnote 34). As pointed out earlier, the majority
of the non-poor depends on crops while the poor, the majority of whom are
landless or small farmers, depend on livestock. The proportion of
households that depend on both crops and livestock is substantially35higher for the non-poor. It is, therefore, important to analyze the
disaggregated growth rate of agriculture and its components to determine
its relationship with rural poverty.
An analysis of disaggregated agricultural growth shows that the
high reported growth rate of agriculture in the 1990s was a statistical
artifact. The following factors contributed to the high estimates of
agricultural growth during the 1990s.
The agriculture sector grew at its highest rate (11.7%) in FY1996,
mainly due to the high growth of livestock value-added that year. The
livestock census conducted in FY1996 was responsible for documenting
this large reported growth, and revealed a much higher value-added than36had previously been documented. This additional value-added was
recorded as a large one-time increase in the survey year and shows up as
3.2 High Reported Agricultural Growth in the
1990s: A Statistical Artifact
3.2.1 Over-Reported Growth in Livestock Value-Added in
FY1996
35 Government of Pakistan. 2001. Household Integrated Economic Survey 1999 2000.
Islamabad: FBS. See also Nazli (2003).36 Government of Pakistan. 1996. Census of Livestock. Islamabad: Agriculture
Census Organization/Statistics Division.
An analysis of
disaggregated
agricultural growth
shows that the high
reported growth
rate of agriculture
in the 1990s was a
statistical artifact.

Figure 1: Reported and Adjusted Value-Added of Livestock and Agriculture
0
20,000
40,000
60,000
80,000
100,000
120,000
140,000
160,000
180,000
FY1991 FY1992 FY1993 FY1994 FY1995 FY1996 FY1997 FY1998 FY1999 FY2000
Reported Agricultural Value-Added
Adjusted Agricultural Value-Added
Reported Livestock Value-Added
Adjusted Livestock Value-Added
Million
Rupees
Year
Note: 'Reported' indicates values given in the Pakistan Economic Survey 2002 03.
Sources: Government of Pakistan. 2003. Pakistan Economic Survey 2002 03. Islamabad: Economic Advisor's Wing/Finance Division; and author's calculations.
37 The livestock census actually shows a decline in livestock population from 116
million in the previous year to 110 million in that year. Only after including
poultry does the livestock population show an increase of 5% between FY1995
and FY1996. It can be noted that the production of most livestock products
documented in the Pakistan Economic Surveys also shows a decline. In
particular, there was a fall in the production of skins and eggs in this year, and
the increase in value-added comes from the considerable reported increase in the
production of milk and poultry meat. For example, the production of milk alone
reportedly increased by 21% between FY1995 and FY1996 (Pakistan Economic
Survey 2002 03, p. 31, Tables 2.14 and 2.15 in the statistical appendix). It is not
biologically possible for milk production to go up by that large a percentage
without any significant increase in the number of milch animals.38 Simply spreading this growth out over 10 years to the previous livestock census
in FY1986 would assume that the census in FY1985 had no under-coverage.
However, the possibility that the large additional unreported livestock value-
added detected in FY1996 was a carryover from the period prior to FY1986 is
equally likely. Hence, for the purpose of this adjustment, we have opted to
assume that the growth rate for the decade minus the FY1996 outlier is the true
rate and have applied it to all years including FY1996.
26 Agricultural Growth and Rural Poverty
37the reported growth rate of livestock value-added of 26%. This high
growth rate is one of the reasons for the 11.7% growth in the agriculture
sector as a whole, in FY1996.
In fact, the previously unreported livestock value-added should
have resulted in a backward adjustment in the under-reported numbers
for value-added over several years, rather than in a one-time increase in
livestock value-added to the extent of 26% over the previous year. Making
this adjustment reduces the overall agricultural growth rate from 12.0% to384.7%, while the overall growth rate of the agriculture sector during the
1990s declines to 3.2% from 4.5% simply by adjusting for the one outlying
value of livestock value-added in FY1996 (Figures 1 and 2).
The previously
unreported
livestock value-
added should have
resulted in a
backward
adjustment in the
under-reported
numbers for value-
added over several
years.

Agricultural Growth and Rural Poverty 27
3.2.2 High Growth Rate of Fisheries and Forestry in FY2000
In addition to the high growth rate of the major crops sector, the
national accounts for FY2000 also indicate high growth rates for the fishery
and forestry sub-sectors. The value-added of fisheries as reported in the
national accounts grew by 9.5%. However, fish production for that year39declined by 6%. This occurred mainly because of the decline in marine
fish production in Sindh that was reported in the Agricultural Statistics
(Footnote 39) and substantiated by popular record. Despite this decline,
the national accounts data indicate high growth in this sub-sector (Table
1.3 in the statistical appendix of the Pakistan Economic Survey 2002 03;
footnote 3).
The share of the forestry sub-sector declined from 1.26% in FY1991
to 0.46% in FY1999, and then more than doubled to 0.97% the following
year (FY2000). The growth rate of this sub-sector between FY1999 and
FY2000 is reported as 113% in the Pakistan Economic Survey (footnote 34).
The forestry sub-sector produces major products such as timber and40firewood, and minor forest products such as, resin, mazri, and ephedra.
The detailed data in the Pakistan Economic Survey show a decline in the
value of major forest products by 22% and a decline in the quantity of
39 Government of Pakistan. 2003. Agricultural Statistics of Pakistan 2001 02.
Islamabad: Ministry of Food, Agriculture and Livestock, Economic Wing.40 According to the national accounts of Pakistan for FY2002, “As no significant
inputs are revealed in this sector, the estimates of output are assumed to be of
gross value-added”. Government of Pakistan. 2003. National Accounts of Pakistan
2001 02. Islamabad: FBS/Statistics Division.
Sources: Government of Pakistan. 2003. Pakistan Economic Survey 2002 03.Islamabad: Economic Advisor's Wing/Finance Division; and author's calculations.
Figure 2: Trend in Growth Rates of Reported and Adjusted Agricultural Value-Added
Trend line: y = 0.043x + 11.60
Trend line: y = 0.031x + 11.62
11.4
11.5
11.6
11.7
11.8
11.9
12.0
12.1
Log
of
Valu
e-A
dded
FY1991 FY1992 FY1993 FY1994 FY1995 FY1996 FY1997 FY1998 FY1999 FY2000
Year
Adjusted Agricultural Value-AddedReported Agricultural Value-Added
Reported Agricultural Value-Added(Linear)
Adjusted Agricultural Value-Added(Linear)
The national
accounts for
FY2000 also
indicate high
growth rates for the
fishery and forestry
sub-sectors.
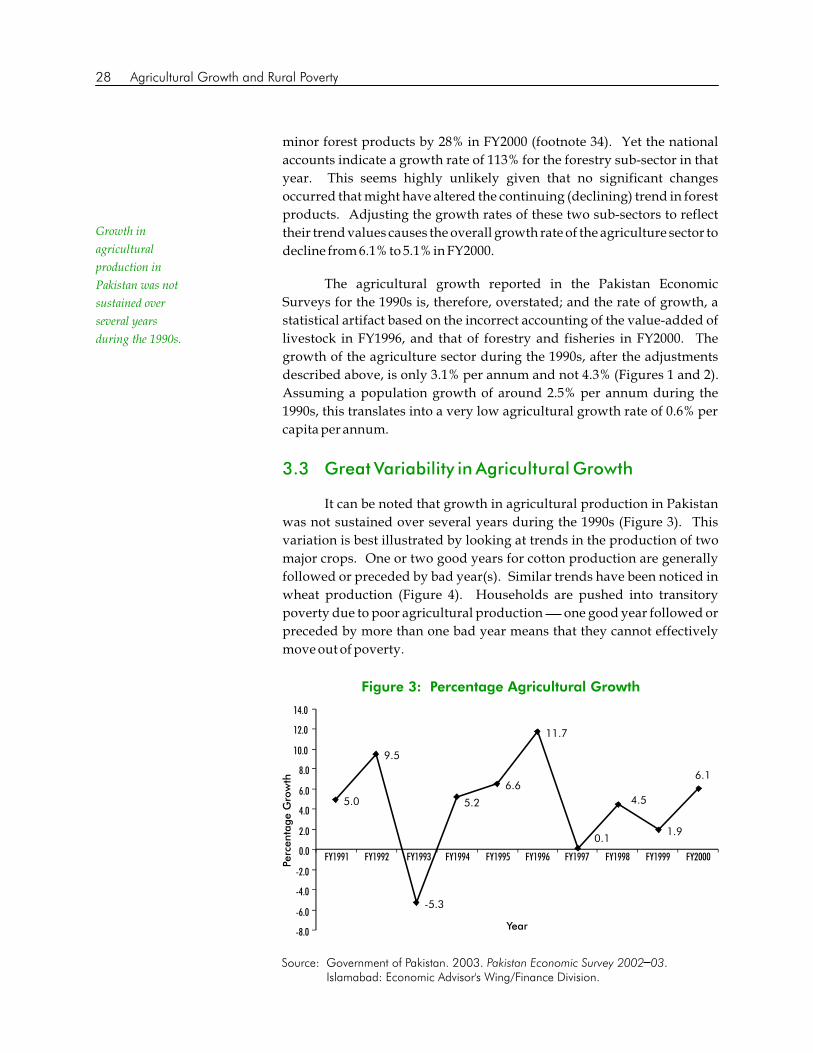
28 Agricultural Growth and Rural Poverty
minor forest products by 28% in FY2000 (footnote 34). Yet the national
accounts indicate a growth rate of 113% for the forestry sub-sector in that
year. This seems highly unlikely given that no significant changes
occurred that might have altered the continuing (declining) trend in forest
products. Adjusting the growth rates of these two sub-sectors to reflect
their trend values causes the overall growth rate of the agriculture sector to
decline from 6.1% to 5.1% in FY2000.
The agricultural growth reported in the Pakistan Economic
Surveys for the 1990s is, therefore, overstated; and the rate of growth, a
statistical artifact based on the incorrect accounting of the value-added of
livestock in FY1996, and that of forestry and fisheries in FY2000. The
growth of the agriculture sector during the 1990s, after the adjustments
described above, is only 3.1% per annum and not 4.3% (Figures 1 and 2).
Assuming a population growth of around 2.5% per annum during the
1990s, this translates into a very low agricultural growth rate of 0.6% per
capita per annum.
It can be noted that growth in agricultural production in Pakistan
was not sustained over several years during the 1990s (Figure 3). This
variation is best illustrated by looking at trends in the production of two
major crops. One or two good years for cotton production are generally
followed or preceded by bad year(s). Similar trends have been noticed in
wheat production (Figure 4). Households are pushed into transitory
poverty due to poor agricultural production one good year followed or
preceded by more than one bad year means that they cannot effectively
move out of poverty.
3.3 Great Variability in Agricultural Growth
Figure 3: Percentage Agricultural Growth
Source: Government of Pakistan. 2003. Pakistan Economic Survey 2002 03. Islamabad: Economic Advisor's Wing/Finance Division.
Perc
enta
ge
Gro
wth
5.0
9.5
-5.3
5.2
6.6
11.7
0.1
4.5
1.9
6.1
-8.0
-6.0
-4.0
-2.0
0.0
2.0
4.0
6.0
8.0
10.0
12.0
14.0
FY1991 FY1992 FY1993 FY1994 FY1995 FY1996 FY1997 FY1998 FY1999 FY2000
Year
Growth in
agricultural
production in
Pakistan was not
sustained over
several years
during the 1990s.

Agricultural Growth and Rural Poverty 29
Moreover, inadequate employment opportunities and the inability
to diversify agricultural production translate into continued and
increased poverty. The variability in production is much larger for cotton
than for wheat, and stems largely from the variability in yields (Table 14).
The area under both crops tends to be much more stable. The coefficient of
variation for yield is much higher than that for area in the case of both
crops, and the variability in yield for cotton is significantly higher than that
for wheat.
41 Villanger (2003) points out that not only do poor households tend to remain poor
in the year during which they experience a shock, but as a result of such shocks,
their chances of moving out of poverty in subsequent years is also reduced. This
study finds that for the households that are subject to a shock in a normal year,
there is a 40% increase in the probability of their remaining poor. This implies
that households are more prone to remaining poor in subsequent years when
they are hit by income shocks.
“Cotton and wheat are the most important crops for all households
irrespective of farm size. In bad years, non-poor small farmers have a
higher probability to fall into poverty. For the small farmers who are
already below the poverty line, the probability of come out of poverty,41even in the following good year, reduces [sic].”
Item
Coefficient of Variation 0.05 0.02 0.15 0.11 0.14 0.09
Table 14: Coefficient of Variation for Area, Production, and Yield of Cotton and Wheat
Cotton Wheat Cotton Wheat
Area Production
Cotton Wheat
Yield/Hectare
Source: Government of Pakistan. 2003. Agricultural Statistics of Pakistan 2001 02.
Islamabad: Ministry of Food, Agriculture and Livestock, Economic Wing.
Figure 4: Annual Growth Rates of Cotton and Wheat
Source: Government of Pakistan. 2003. Pakistan Economic Survey 2002 03. Islamabad: Economic Advisor's Wing/Finance Division.
WheatCotton-40.0
-30.0
-20.0
-10.0
0.0
10.0
20.0
30.0
40.0
FY1992 FY1993 FY1994 FY1995 FY1996 FY1997 FY1998 FY1999 FY2000
Perc
enta
ge
Gro
wth
Rate
Year
Inadequate
employment
opportunities and
the inability to
diversify
agricultural
production
translate into
continued and
increased poverty.

30 Agricultural Growth and Rural Poverty
3.4 High Poverty in Cotton/Wheat Punjab: An
Illustration
3.4.1 Dependence on Cotton and Wheat
The analysis presented in Section 2 revealed that the highest
incidence of rural poverty is in the cotton/wheat zones of rural Pakistan
where the population relies most heavily on crop incomes. As reported
earlier, crop income accounts for 67.30% of total income in cotton/wheat
Sindh and 64.26% of total income in cotton/wheat Punjab. These two
agro-climatic zones account for 33% of the poor (20.13% in cotton/wheat
Punjab and 13.21% in cotton/wheat Sindh), and about 29% of the
population (17.47% in cotton/wheat Punjab and 11.20% in cotton/wheat
Sindh). It is important to analyze the nature of agricultural growth in these
regions to understand the reasons for this high rural poverty. To this end,
a detailed analysis of the cotton/wheat zone in Punjab is presented below.
During the years that agriculture grew significantly in the 1990s
(9.5% in FY1992, 6.6% in FY1995, and 6.1% in FY2000), the growth of cotton42and wheat was an important factor. This is due to the large share of both
crops in the value-added of major crops. For example, the collective share
of cotton and wheat in major crops in these 3 years was 65.98%, 59.16%, and
60.31%, respectively (Table 15). In good years, the growth in production of
these two crops determines the overall growth of the sub-sector's major
crops and, hence, the growth of the overall agriculture sector and vice
versa. In FY1992, cotton production grew by 33% and wheat by 8%; in
FY1995, these growth rates were 8% and 12%, respectively (Figure 4). In
FY1996, the production of major crops grew by 6%, to which cotton alone
contributed 32%. The high growth of cotton (28%) and wheat (18%) in
FY2000 is reflected in the high growth of the major crops' sector (15%), and43thus in high agricultural growth (5.5%).
An examination of the growth rates reported in Table 15 reveals
that the growth of cotton value-added was, in fact, negative over the 1990s,
while that of cotton and wheat combined was only 1.33% per annum. This44low rate is due to the large variation in the growth rate.
42 These two crops contribute on average more than 60% to the value-added of total
major crops and nearly 30% to the total agricultural value-added. Therefore,
high growth in the major crops sector, when it occurs, is driven largely by high
growth in cotton and wheat production. Conversely, poor growth in the
production of these two crops pulls down the overall growth rate for the sector.43 This is after adjusting the growth of the fisheries and forestry sub-sectors. Before
this adjustment, the agricultural growth rate was 6.1%.44 This variability is examined in more detail later in this section.
During the years
that agriculture
grew significantly
in the 1990s, the
growth of cotton
and wheat was an
important factor.

Agricultural Growth and Rural Poverty 31
Most of Pakistan's cotton-producing districts are located in
southern Punjab, which is the country's poorest region. Cotton and wheat45are the most commonly grown crops here. A district-wise analysis shows
that in Lodhran, Bahawalpur, and Rahimyar Khan, 87%, 82%, and 82% of
the total cropped area, respectively, is under cotton and wheat. In
cotton/wheat Punjab, Rahimyar Khan, Muzaffargarh, and Bahawalpur
rank highest in cotton production, while Muzaffargarh, Rahimyar Khan,
and Bahawalnagar rank highest in wheat production (Table 16).
According to the ranking of the Social Policy Development Center
(2001), most of the cotton growing districts in Punjab are classified as
highly deprived overall and have low employment rankings (footnote 33).
Except for Bahawalnagar, the other three districts (Rahimyar Khan,
Muzaffargarh, and Bahawalpur) fall into the category of 'high deprivation'
with national rankings of 63, 72, and 64, respectively.
3.4.2 Inadequate Crop Diversification and Employment
45 Cotton is a kharif crop and wheat is a rabi crop. Nearly 69% of Pakistan's cotton
area is in cotton/wheat Punjab and 22% in cotton/wheat Sindh. Similarly, 31%
of Pakistan's total wheat area is in cotton/wheat Punjab and 10% in
cotton/wheat Sindh.
Year
Share of Agricultural(Value-Added)
Annual Growth Rate(Value-Added)
Wheat CottonWheat CottonCombined
ShareCombined
Share
Table 15: Percentage Share of Major Crops and Agricultural Value-Added andAnnual Growth Rates of Cotton and Wheat
FY1991
FY1992
FY1993
FY1994
FY1995
FY1996
FY1997
FY1998
FY1999
FY2000
Overall
29.18
27.05
31.79
30.03
31.36
28.74
29.41
30.63
29.26
32.13
33.32
38.93
31.37
27.53
27.80
31.57
29.11
26.42
25.21
28.89
62.50
65.98
63.16
57.56
59.16
60.31
58.52
57.05
54.47
61.02
15.92
19.62
14.09
11.90
12.25
13.20
11.63
10.93
10.23
12.75
29.87
33.25
28.37
24.87
26.07
25.21
23.37
23.60
22.10
26.93
2.57
7.05
(0.81)
(4.36)
13.51
(2.90)
(2.10)
12.76
(4.49)
26.74
3.33
24.12
21.91
(31.99)
(11.15)
9.76
20.32
(11.78)
(1.74)
(4.60)
32.27
(0.51)
8.12
16.84
(19.20)
(7.73)
11.71
8.02
(7.17)
5.55
(4.54)
29.30
1.33
13.95
13.63
14.28
12.98
13.82
12.01
11.75
12.67
11.87
14.18
Share of Major Crops(Value-Added)
Wheat CottonCombined
Share
FY = fiscal year.
Note: The overall growth rates in the last row have been estimated from trend regressions.
Source: Government of Pakistan. 2003. Pakistan Economic Survey 2002 03. Islamabad: Economic Advisor's Wing/FinanceDivision.

Table 16: Distribution of Cropped Areas in Cotton/Wheat Punjab and Sindh byImportant Kharif and Rabi Crops
Region
Percentage of Cropped Area Under
Total KharifCrops CottonRice Sugarcane
KharifFodder Vegetables
Total RabiCrops Wheat Oilseed
RabiFodder
100
68.86
31.23
0.30
2.52
1.56
2.73
2.47
3.28
2.81
3.80
1.86
2.07
2.09
3.87
1.87
14.27
9.29
Pakistan
Punjab
Cotton/Wheat Punjab
Cholistan
Multan
Sahiwal
Vehari
Khanewal
Bahawalnagar
Bahawalpur
Rahimyar Khan
Lodhran
Layyah
Dera Ghazi Khan
Muzaffargarh
Rajanpur
Sindh
Cotton/Wheat Sindh
100
66.12
30.72
0.31
2.08
1.77
2.94
2.72
3.52
2.97
3.84
1.96
1.88
1.76
3.54
1.42
21.89
11.59
100
59.03
8.44
0.00
0.45
0.70
0.63
0.68
2.64
0.21
0.55
0.07
0.03
1.07
1.27
0.15
34.40
3.94
100
76.78
68.98
0.81
5.23
2.69
7.01
6.23
5.90
7.86
10.03
5.58
2.18
3.62
7.89
3.95
23.30
22.30
100
58.77
13.60
0.01
0.23
1.38
1.31
0.60
2.74
0.99
2.13
0.22
1.67
0.20
1.97
0.16
26.76
14.66
100
81.37
23.36
0.39
1.44
2.86
2.48
2.93
3.79
2.06
2.07
1.06
2.74
0.95
0.27
0.33
8.42
7.14
100
33.06
14.27
0.06
1.04
0.89
1.47
1.36
1.76
2.97
0.86
0.47
1.88
0.39
0.80
0.32
21.89
15.19
100
69.79
28.97
0.33
2.28
1.61
2.47
2.31
3.11
2.51
3.21
1.62
2.88
1.72
3.38
1.56
14.87
9.27
100
69.79
33.98
3.80
0.00
0.80
3.70
1.16
7.78
6.27
1.60
3.24
1.44
1.72
1.69
0.78
29.74
17.64
100
85.30
32.22
0.26
2.78
3.21
3.29
3.86
4.49
2.79
2.85
1.44
2.24
0.76
3.38
0.86
13.22
9.22
Note: Kharif refers to the summer crop, and rabi to the winter crop.
Source: Government of Pakistan. 2003. Census of Agriculture 2000. Islamabad: Economic Affairs and Statistics Division/Agriculture Census Organization.
32 Agricultural Growth and Rural Poverty
Sugarcane, rice, and fodder are the other important crops grown in
the kharif (summer crop) season, and oilseed and fodder in the rabi (winter
crop) season. Data from the Agricultural Census for 2000 indicate that, as
farm size increases, people tend to grow sugarcane in Muzaffargarh, and46rice and sugarcane in Bahawalpur, Rahimyar Khan, and Bahawalnagar.
However, in Rahimyar Khan, the extent of crop diversification is less than
that in Bahawalnagar, indicating that, in case of crop failure, households in
these districts (especially those with small farms) are more vulnerable.
These households have neither enough resources for crop diversification
nor access to opportunities for off-farm employment (footnote 33). Hence,
there are few alternative opportunities for supplementing their income.
46 Government of Pakistan. 2003. Census of Agriculture 2000. Islamabad: Economic
Affairs and Statistics Division/Agriculture Census Organization.

4 Land Distribution, Tenancy
Arrangements, and Rural Poverty
The skewed distribution of land could be one of the major obstacles
hindering the rapid reduction of rural poverty. Data from the Agricultural
Census Organization confirm the skewed distribution of operated land in
Pakistan. In 2000, more than half the country's total farms were reported
to be smaller than 5 acres in size; these farms occupy 16% of the total farm
area. In contrast, only 5% of farms were 25 acres or more in size, and the
total area under them, 38% in 2000 (Table 17). The number of small farms
(under 5 acres) has increased from 19% in 1960 to 58% in 2000. The area
under these farms has also increased considerably from 3% in 1960 to
16% in 2000. The number of farms in all other farm categories has declined
since 1960, except for medium sized farms (5 to 12.5 acres).
In 1990, 69% of farms in Pakistan were owner-operated, 12% were
operated by owners-cum-tenants, and 19% by tenants. In 2000, the
proportion of owner-operated farms increased to 78% whereas the
proportion of farms operated by owners-cum-tenants (8%) and tenants
(14%) declined (Table 18). It is interesting to note that most owner-
operated farms are smaller than 5 acres (79% in 1990 and 83% in 2000). A
large proportion of farms operated by owners-cum tenants fall in the
category of 25 50 acres (24% in 1990 and 18% in 2000). Tenant-operated
farms were generally less than 12.5 acres in size.
Table 17: Farm Classification by Size
Sources: Government of Pakistan. Census of Agriculture. Various issues. Islamabad: Economic Affairs and Statistics Division/
Agriculture Census Organization.
Size of Farm(Acres) 1960 1972 1980 1990 2000
Farms Area (%)Number of Farms (%)
1960 1972 1980 1990 2000
< 5
5 to < 12.5
12.5 to < 25
25 to < 50
50 to < 150
> 150
Total
19.0
44.3
23.8
9.0
3.3
0.5
100.0
28.2
39.9
21.1
7.7
2.7
0.4
100.0
34.1
39.4
17.3
6.5
2.4
0.3
100.0
47.5
33.4
12.2
4.7
1.8
0.3
100.0
57.6
28.1
8.8
3.9
1.2
0.2
100.0
3.0
23.6
27.0
19.0
16.0
11.5
100.0
5.2
25.2
26.6
18.8
15.1
9.1
100.0
7.1
27.3
24.7
17.8
14.7
8.5
100.0
11.3
27.5
21.5
15.8
13.9
10.1
100.0
15.5
27.9
19.1
16.3
9.6
11.6
100.0
Data from the
Agricultural
Census
Organization
confirm the skewed
distribution of
operated land in
Pakistan.

34 Agricultural Growth and Rural Poverty
Sources: Government of Pakistan. Census of Agriculture. Issues for 1990 and 2000.
Islamabad: Economic Affairs and Statistics Division/Agriculture Census
Organization.
Size of Farm(Acres)
Owner Owner-cum-Tenant Tenant
1990 2000 1990 2000 1990 2000
Table 18: Percentage Distribution of Farms by Size and Typeof Tenure
All Farms
< 5
5 to < 12.5
12.5 to < 25
25 to < 50
50 and >
All Farms
< 5
5 to < 12.5
12.5 to < 25
25 to < 50
50 and >
All Farms
< 5
5 to < 12.5
12.5 to < 25
25 to < 50
50 and >
All Farms
< 5
5 to < 12.5
12.5 to < 25
25 to < 50
50 and >
All Farms
< 5
5 to < 12.5
12.5 to < 25
25 to < 50
50 and >
68.8
78.8
59.0
58.7
62.9
72.7
69.5
81.8
61.0
54.6
56.8
66.4
50.6
55.2
40.5
62.2
75.2
77.2
78.1
80.8
72.8
70.2
67.4
73.6
80.7
93.8
79.0
71.7
75.0
83.4
77.6
83.0
70.1
67.6
73.2
78.7
78.6
86.3
71.4
62.7
63.8
67.9
65.8
61.9
61.8
79.1
89.8
90.8
82.9
85.7
72.9
70.2
74.6
74.1
81.8
85.8
79.9
75.4
85.1
88.4
12.4
5.8
15.8
22.3
23.8
20.5
15.7
6.8
20.4
27.2
29.2
26.4
7.6
2.9
8.5
13.2
13.7
15.9
8.4
5.6
12.4
18.8
23.6
21.9
4.9
0.8
3.5
6.7
9.4
9.6
8.4
4.1
12.4
18.6
17.9
15.4
11.0
5.1
15.6
23.9
25.4
23.1
4.0
1.6
5.5
8.2
6.0
6.0
6.2
3.7
13.6
20.8
19.4
24.2
2.6
0.4
2.4
3.7
4.8
7.0
18.8
17.0
25.2
18.9
13.3
6.8
14.9
11.4
18.6
18.3
14.0
7.1
41.8
42.0
51.0
24.6
11.1
6.9
13.5
13.6
14.8
11.0
9.1
4.6
14.3
5.3
17.5
21.6
15.6
7.0
14.0
12.9
17.5
13.8
8.9
5.9
10.4
8.6
13.0
13.4
10.7
9.0
30.2
36.5
32.7
12.7
4.4
3.2
10.9
10.7
13.5
9.0
6.0
1.7
15.6
13.7
17.8
21.0
10.2
4.6
Pakistan
Punjab
Sindh
North-West FrontierProvince
Balochistan

The pattern of distribution varies across provinces. For example, in
Sindh, owner-operated farms are larger while tenant-operated farms are
smaller. Similarly, in Balochistan, a larger proportion of farms are owner-
operated as compared to other provinces, indicating that a considerable
proportion of farm households are classified as small farmers.
Household surveys indicate significant differences between the
poor and non-poor in terms of land ownership, operated land, and type of
tenure. Marked differences have been found in Sindh and Balochistan
(footnote 35). Recent data from the HIES for FY2002 indicates that, in
Pakistan, 55% of the non-poor and 63% of the poor are landless (footnote
1). A majority of the poor owns less than 5 acres of land. The proportion of
landless households among the poor is highest in central Punjab (74%)
followed by northern Punjab (72%), and Balochistan (71%). According to
the World Bank (2002), the poverty headcount for households owning less
than 1 hectare is 35%, while for the landless, it is 40% (footnote 16).
In the cotton/wheat regions where poverty is highest, the Gini
coefficient for land ownership is also very high. The highest incidence of
land inequality is found in Muzaffargarh (0.70), followed by Multan (0.65).
In addition to these districts, Rahimyar Khan and Vehari, the other cotton-
producing districts, also exhibit highly unequal (0.62 and 0.60) land
distribution (Figure 5).
Land Distribution, Tenancy Arrangements, and Rural Poverty 35
Figure 5: Land Distribution in Selected Cotton-ProducingDistricts of Punjab
1990 2000
Sources: Government of Pakistan. Census of Agriculture. Issues for 1990 and 2000. Islamabad: Economic Affairs and Statistics Division/Agriculture Census Organization.
0.800
0.700
0.600
0.500
0.400
0.300
0.200
0.100
0.000
Land
Gin
i
0.5680.602
0.6090.592
0.6230.619
0.6530.655
0.5990.603
0.6820.701
Bahawalnagar Bahawalpur Rahimyar Khan Multan Vehari Muzaffargarh
District
In the cotton/wheat
regions where
poverty is highest,
the Gini coefficient
for land ownership
is also very high.

36 Agricultural Growth and Rural Poverty
The World Bank (2002) reports that the highly skewed distribution
of land in rural Pakistan results in tenancy arrangements such as
sharecropping that are detrimental to poverty reduction (footnote 16).
The high incidence of sharecropping is confirmed by data from the
Agricultural Census (Appendix 1). Nearly 67% of tenant-operated area
was under sharecropping in 2000. This holds for small and medium sized
farms also, whereas lease arrangements are found to be more common on
large farms. The incidence of sharecropping is very common in Sindh
where nearly 17% of the total operated area was under sharecropping in
2000. The incidence of sharecropping is common on small and medium
sized farms in all the provinces. While in Punjab and Sindh, most large
farms operate under fixed-rent lease agreements, NWFP exhibits a reverse
pattern. In Balochistan, tenancy arrangements other than fixed rent and
sharecropping have increased in recent years.
The available household survey data reveal that the proportion of
sharecroppers is higher among poor households as compared to the non-
poor, especially in Sindh and Balochistan (footnote 35). Fixed-rent
tenancy is found to be common among the poor in central and southern
Punjab and NWFP. A greater proportion of the non-poor are owners or
owners-cum-tenants as compared to poor households. Similar instances
are evident in the ownership of livestock by the poor and non-poor. For
example, the FBS (2001) observes that the average value of animals owned
by the non-poor is considerably higher than that of poor households
(footnote 35). According to data from the HIES for FY2002, the ownership
of livestock among non-farm households is common in most agro-climatic
zones in Pakistan (footnote 1). However, in poorer zones such as the
cotton/wheat zones of Punjab and Sindh, livestock ownership is found to
be higher among farm households as compared to non-farm households.
These highly skewed land distribution patterns and tenancy
arrangements indicate the presence of exploitative power structures in the
rural areas of Pakistan. Given the unequal distribution of land, benefits
arising from increased crop production will continue to accrue primarily
to large farmers.
The proportion of
sharecroppers is
higher among poor
households as
compared to the
non-poor.

5 Poverty and Changes in the Rural
Labor Market
5.1 Decline in Use of Casual Labor
The use of casual labor declined drastically during the 1990s. A
decrease of nearly 9% in the number of farms reported to be using casual
labor in the Agricultural Census of 2000 (footnote 46) was noted as47compared to the 1990 census (Table 19). An increase in family labor and
in the number of owned farms is one reason for the decline in the reported
use of casual labor. Increased mechanization may be another important
factor but this is difficult to substantiate because of the inadequacy of data
on the extent of mechanization. In any case, the decline in the percentage
of farms reporting the use of casual labor is an indicator of the decline in the
alternative employment opportunities so vital for keeping people out of
poverty.
Sources: Government of Pakistan. Census of Agriculture. Issues for
1990 and 2000. Islamabad: Economic Affairs and
Statistics Division/Agriculture Census Organization.
Table 19: Percentage Distribution of FarmsReporting Use of Casual Labor
< 1
1 to < 2.5
2.5 to < 5
5 to < 7.5
7.5 to < 12.5
12.5 to < 25
25 to < 50
50 to < 150
150 and >
All Farms
36.32
44.57
50.28
54.81
55.99
56.15
55.61
54.57
57.80
50.42
27.28
36.32
43.70
46.31
48.03
48.47
49.78
50.38
51.93
41.76
Size of Farm(Acres) 1990 2000
47 Government of Pakistan. 1993. Census of Agriculture 1990. Islamabad: Economic
Affairs and Statistics Division/Agriculture Census Organization.
The decline in the
percentage of farms
reporting the use of
casual labor is an
indicator of the
decline in the
alternative
employment
opportunities so
vital for keeping
people out of
poverty.

38 Agricultural Growth and Rural Poverty
5.2 Decline in Real Wage Rate in the 1990s
According to the Agricultural Census for 2000, the extent of the use
of hired labor on tenant farms is negligible (footnote 46). Unpaid family
helpers constitute a large majority of the rural labor force and are generally
concentrated in the farm sector. In FY2002, almost 35% of the rural labor
force comprised unpaid family helpers. The proportion of permanent
hired labor is quite low in the agriculture sector, while that of casual labor
is even lower. According to the Agricultural Census for 1990, a large
majority of the agricultural labor force consists of family workers (72%)
and tenant farmers (25%); the share of permanent hired labor was only 2%
and that of casual workers was just 0.79% (footnote 47). It is usually at
harvest time that labor is hired; farmers do not tend to hire workers during48cultivation.
As already discussed, the use of casual labor has declined across
farm size as well as different categories of tenure. The available data
indicate that real wages have also declined significantly for regular
workers and only increased marginally for casual workers (Table 20).
Data for the period after FY1997 are not available to evaluate recent trends.
CPI = consumer price index, FY = fiscal year.
Sources: Government of Pakistan. Household Integrated Economic Survey. Various issues.
Islamabad: Federal Bureau of Statistics.
Year
Nominal Wages (PRs) Real Wages (PRs)
CPIFY1991=100
RegularWorkers
CasualWorkers
RegularWorkers
CasualWorkers
FY1991
FY1992
FY1993
FY1994
FY1995
FY1996
FY1997
Growth Rate (%)
per Annum
37.13
39.01
42.43
44.25
52.07
55.93
58.99
9.84
35.81
41.75
41.59
53.21
56.00
62.87
72.3
12.65
37.13
35.28
34.94
32.74
34.09
33.05
31.18
(1.45)
35.81
37.76
34.24
39.37
36.67
37.16
38.22
1.11
100.00
110.58
121.45
135.14
152.73
169.21
189.18
14.86
Table 20: Nominal and Real Daily Wages for AgriculturalLaborers
48 Fafchamps, Marcel, and Agnes R. Quisumbing. 1998. Human Capital,
Productivity, and Labor Allocation in Rural Pakistan. FCND Discussion Paper
No. 48. IFPRI, Washington, DC.
The available data
indicate that real
wages have also
declined
significantly for
regular workers
and only increased
marginally for
casual workers.

However, the proportion of wage workers is quite high in the non-
farm sector. Unpaid family helpers constitute a very small proportion of
the labor force in this sector. Most rural activities in this category,
however, fall under self-employment and small businesses (footnote 17).
The non-farm sector comprises a formal and informal sector. The
informal sector is labor-intensive, and requires little or no formal training
or physical capital. Due to these easy entry requirements, a majority of
uneducated and unskilled workers are absorbed by this sector. Working
conditions are extremely dismal, and although the sector absorbs a large
majority of the labor force, poor working conditions combined with the
absence of any employment benefits do not improve workers' living
standards to any considerable degree. The formal sector comprises
registered firms where employment is provided either on a permanent or
contractual basis. Labor laws apply to such organizations and their
workers enjoy all the benefits that apply accordingly.
Using construction work as a proxy for rural non-farm labor
indicates that nominal wages in the sector have increased considerably,
while real wages declined during the 1990s (Table 21). Falling real wages
among construction workers in the non-farm sector coupled with a high
dependency ratio has worsened living conditions for laborers. On the
other hand, farm wages, too, have declined for permanent labor, while
casual labor wages have increased only marginally.
Poverty and Changes in the Rural Labor Market and Poverty 39
Table 21: Nominal and Real Daily Wages for ConstructionWorkers
FY1991
FY1992
FY1993
FY1994
FY1995
FY1996
FY1997
FY1998
FY1999
FY2000
FY2001
FY2002
Growth Rate
43.20
47.41
52.07
57.94
65.48
72.55
81.11
87.45
92.46
95.78
100.00
103.54
YearCPI
FY2001=100Carpenter Laborer
Nominal Wages (PRs)
121.44
139.86
149.96
159.07
180.00
194.07
210.73
225.28
244.61
244.71
250.77
252.12
6.87
57.81
61.96
70.82
76.32
87.86
100.28
108.73
116.50
125.42
123.81
126.27
129.92
7.64
Carpenter Laborer
Real Wages (PRs)
281.11
294.99
288.00
274.55
274.89
267.49
259.81
257.61
264.56
255.49
250.77
243.50
(1.30)
133.82
130.70
136.01
131.72
134.18
138.22
134.06
133.22
135.65
129.26
126.27
125.48
(0.58)
CPI: consumer price index, FY = fiscal year.
Note: Nominal wages have been calculated as the average of wages in five major cities.
Source: Computed from data in Government of Pakistan. 2003. Pakistan Economic
Survey 2002 03. Islamabad: Economic Advisor's Wing/Finance Division.
Falling real wages
among
construction
workers in the non-
farm sector coupled
with a high
dependency ratio
has worsened
living conditions
for laborers.

40 Agricultural Growth and Rural Poverty
However, existing evidence indicates that the use of casual labor in
agriculture has declined significantly. These negative wage trends in the
farm and non-farm sectors reflect increasing poverty among wage
workers in both sectors.

6 Conclusions and Policy
Recommendations
The agriculture sector in Pakistan is considered a major
determinant of overall economic growth and the well-being of people
because of its significant contribution to GDP, export earnings,
employment, and food availability. Agricultural growth helps reduce
poverty directly through an increase in farmers' income. The indirect
effect of agricultural growth on poverty reduction occurs through the
spending of farmers' income on locally produced non-agricultural goods.
The relevant literature argues that the increased demand for these goods
leads to a much larger increase in employment, which is the main vehicle
for poverty reduction in rural areas. However, in the case of Pakistan, the
reasonable agricultural growth in the 1990s could not be translated into
poverty reduction. Rather, the consensus is that the percentage of rural
persons living below the poverty line has increased over time and
especially since the late 1990s.
It appears that the interplay of several factors caused this paradox.
The growth in agricultural production was not sustained in a number of
years during the 1990s. Poor agricultural production in one year may
push households into transitory poverty, while one good year may not be
sufficient to pull them out. The inability of small farmers to diversify crop
production, particularly in the cotton/wheat belt of Sindh and southern
Punjab where poverty is relatively high, also contributed to an increase in
rural poverty. Moreover, in the presence of a highly skewed land
distribution, the benefits arising from agricultural growth in the 1990s did
not reach small farmers and sharecroppers, instead accruing primarily to
large farmers.
A substantial decline in the use of casual labor and real wages in the
1990s are other important determinants of the persistent high rural
poverty in question. Employment opportunities in the rural non-
agriculture sector are inadequate. Income from this sector is derived from
many diverse activities. The poor tend to be found in low-productivity
activities that demand low levels of skill and little education; whereas
within wage work, the poor are generally involved in unskilled labor in the
construction sector.
In the presence of a
highly skewed land
distribution, the
benefits arising
from agricultural
growth in the
1990s did not reach
small farmers and
sharecroppers.

42 Agricultural Growth and Rural Poverty
The major recommendations of this study are as follows:
Agricultural growth without specific interventions targeting small
farmers and rural non-farm households, may not alleviate poverty
for much of the poor in rural Pakistan. An explicit strategy is
needed for the development of the rural non-agriculture sector,
and is currently lacking in the Government of Pakistan's Poverty
Reduction Strategy Papers as well as development plans.
In view of the relatively high incidence of poverty in the
cotton/wheat zones of Punjab and Sindh, a poverty reduction
strategy focusing on education, skills development, job creation,
and health care needs to be designed for these areas. Given that
land distribution is highly skewed in these zones, it is necessary to
concentrate more on income sources that are independent of land in
order to reduce rural poverty. This suggests providing landless
and small farmers with easy access to credit, technology, and
information.
Transitory poverty can be reduced if policy interventions aim at
leveling out income fluctuations. A reduction in chronic poverty is
possible through large and sustained growth in household
incomes. For the former, the availability of micro-credit would be
an effective tool, while for the latter, targeted public works
programs could help reduce chronic poverty.
Poverty reduction is linked strongly to employment. The
exploitation of labor in situations of poor governance and thin,
inadequate labor markets is a major cause of increasing poverty.
The fact that rural real wages actually declined in Pakistan despite
significant external and internal out-migration during the 1980s
bears testimony to the fact that there is no minimum wage
protection in the rural sector. In addition, the legislative
framework for the protection of workers does not apply, as these
laws do not apply to the agriculture sector. Agricultural labor is
thus deprived of benefits such as social security and old-age
pension benefits. Minimum wage laws need to be set for the
agriculture sector and all legislation, including workers' protection
and non-wage benefits, made applicable to the agriculture sector.
The Government has followed an interventionist pricing policy for
the agriculture sector. Although these pricing policies have been
designed to favor small farmers, studies argue that they achieve the
opposite. Such policies should be revised for the benefit of small
farmers.
The available evidence also shows that increased resource
degradation has led to declining productivity in agriculture. A
(i)
(ii)
(iii)
(iv)
(v)
(vi)
A reduction in
chronic poverty is
possible through
large and sustained
growth in
household incomes.
comparison of Indian and Pakistani Punjab shows that higher
productivity has been achieved in the former, mainly due to greater
efforts to tackle resource degradation. Greater efforts need to be
directed towards the conservation of natural resources. One
measure in this regard would be to educate and encourage farmers
through incentives to move to more sustainable practices such as
diversified crop rotation and the cultivation of legumes.
Finally, research on the linkages between agricultural growth,
rural development, and poverty reduction requires more
disaggregated data at various levels. It is necessary for the
Government to mobilize additional resources for data collection
and to coordinate the existing sources of data collection to
maximize synergies. These data gaps are also reflected in the gaps
in existing and ongoing research (Appendix 2). Key areas requiring
further research include:
A more comprehensive and disaggregated analysis of trends
in rural poverty using region-specific poverty lines estimated
on a scientific basis;
An analysis of the dynamic aspects of rural poverty and its
determinants;
An analysis of the private and public incomes of the poor and
the variations in these;
An evaluation of the efficiency of publicly provided goods
and services in reaching the rural poor, especially the recent
measures addressing the vulnerability of the poor under the
Poverty Reduction Strategy Papers.
(vii)
(a)
(b)
(c)
(d)
Conclusions and Policy Recommendations 43
Research on the
linkages between
agricultural
growth, rural
development, and
poverty reduction
requires more
disaggregated data
at various levels.

References
Adams Jr., Richard H. 1996. Remittances, Income Distribution, and Rural Asset Accumulation.
Food Consumption and Nutrition Division (FCND) Discussion Paper No. 17. International Food Policy
Research Institute (IFPRI), Washington, DC.
Adams Jr., Richard H., and Jane J. He. 1995. Sources of Income Inequality and Poverty in Rural
Pakistan. Research Report 102. IFPRI, Washington, DC.
Ahmad, Bashir. 1993. Decomposition of Agricultural Growth Rates in Pakistan. In Agricultural
Strategies in the 1990s: Issues and Policy edited by Agha Sajjad Haider, Zakir Hussain, Richard McConnen,
and Sohail J. Malik. Islamabad: Pakistan Association of Agricultural Social Scientists.
Ahmad, Munir, and Sarfaraz K. Qureshi. 1999. Recent Evidence on Farm Size and Land
Productivity: Implications for the Public Policy. Pakistan Development Review 38 (4).
Alderman, H., and M. Garcia. 1993. Poverty, Household Security, and Nutrition in Rural Pakistan.
Research Report 96. IFPRI, Washington, DC.
Ali, Mubarak, and Derek Byerlee. 2002. Productivity Growth and Resource Degradation in
Pakistan's Punjab: A Decomposition Analysis. Economic Development and Cultural Change 50 (4).
Ali, Salman Syed, and Sayyid Tahir. 1999. Dynamics of Growth, Poverty and Inequality in Pakistan.
Pakistan Development Review 38 (4).
Amjad, R., and A. R. Kemal. 1997. Macroeconomic Policies and Their Impact on Poverty Alleviation
in Pakistan. Pakistan Development Review 36 (1).
Anwar, Talat, and Sarfraz K. Qureshi. 2002. Trends in Absolute Poverty in Pakistan: 1990 to 2001.
Pakistan Development Review 41 (4).
Arif, G. M., Hina Nazli, and Rashida Haq. 2000. Rural Non-Agricultural Employment and Poverty
in Pakistan. Pakistan Development Review 39 (4).
Arif, G. M., Hina Nazli, and Rashida Haq. 2001. Rural Non-Agricultural Employment and Poverty
in Pakistan (Part II). Pakistan Development Review 39 (4).
Arif, G. M., and Munir Ahmad. 2001. Poverty Across the Agro-Ecological Zones in Rural Pakistan.
Paper presented at the National Workshop on Pro-Poor Intervention Strategies in Irrigated Agriculture in
Asia: Pakistan, International Water Management Institute, Lahore, 12 March.
Asian Development Bank (ADB). 2002. Poverty in Pakistan: Issues, Causes and Institutional Responses.
Islamabad: ADB.
Bane, M. J., and Ellwood, D. 1996. Slipping In and Out of Poverty: The Dynamics of Spells. Journal of
Human Resources 21 (1).

46 Agricultural Growth and Rural Poverty
Baulch, Bob, and John Hoddinott. 1999. Economic Mobility and Poverty Dynamics in Developing
Countries. Journal of Development Studies 36 (6).
Baulch, Bob, and Neil McCulloch. 1998. Being Poor and Becoming Poor: Poverty Status and Poverty
Transitions in Rural Pakistan. Institute of Development Studies (IDS) Working Paper No. 79. IDS, Sussex.
Available http://www.ids.ac.uk/ids/pvty/pvprp.html
Chaudhry, M. Ghaffar, and Ghulam Mustafa Chaudhry. 1997. Pakistan's Agricultural
Development Since Independence: Inter-Temporal Trends and Explanations. Pakistan Development Review
36 (4).
Centre for Research on Poverty Reduction and Income Distribution. 2003. Pakistan Human Condition
Report 2003. United Nations Development Programme/United Nations Office for Project Services/Centre
for Research on Poverty Reduction and Income Distribution, Islamabad.
Datt, G., and M. Ravallion. 1998. Farm Productivity and Rural Poverty in India. Journal of
Development Studies 34 (1).
Dercon, S. 1999. Income Risk, Coping Strategies, and Safety Nets. Background paper for
World Development Report 2000/2001 . The World Bank, Washington, DC. Available
http://www.worldbank.org/poverty/wdrpoverty/background/dercon.pdf
Dercon, S., and P. Krishnan. 2000. Vulnerability, Seasonality and Poverty in Ethiopia. Journal of
Development Studies 36 (6).
Duncan, G. J., and G. Kalton. 1987. Issues of Design and Analysis of Panel Data Across Time. Bulletin
of The International Statistical Institute, Proceedings of the 45th Session 51 (2).
Ercelawn, Aly. 1984. Income Inequality in Rural Pakistan. Pakistan Journal of Applied Economics 3 (1).
Faruqee, Rashid. 1995. Government's Role in Pakistan's Agriculture. Policy Research Working
Paper No. 1468. The World Bank, Washington, DC.
Fafchamps, Marcel, and Agnes R. Quisumbing. 1998. Human Capital, Productivity, and Labor
Allocation in Rural Pakistan. FCND Discussion Paper No. 48. IFPRI, Washington, DC.
Gaiha R. 1989. Are the Chronically Poor Also the Poorest in Rural India? Development and Change
20 (2).
Gaiha, R., and A. B. Deolalikar. 1993. Persistent, Expected and Innate Poverty Estimates for Semi-
Arid Rural South India, 1975 1984. Cambridge Journal of Economics 17 (4).
Government of Pakistan. Household Integrated Economic Survey. Various issues. Islamabad: Federal
Bureau of Statistics (FBS).
. Pakistan Economic Survey. Various issues. Islamabad: Economic Advisor's Wing/Finance
Division.
. 1993. Census of Agriculture 1990. Islamabad: Economic Affairs and Statistics
Division/Agriculture Census Organization.
. 1996. Census of Livestock. Islamabad: Agriculture Census Organization/Statistics Division.
. 2001a. Census of Manufacturing Industries 1995 96. Islamabad: Government of Pakistan.
. 2001b. Labour Force Survey. Islamabad: FBS.
. 2003a. Agricultural Statistics of Pakistan 2001 02. Islamabad: Ministry of Food, Agriculture
and Livestock, Economic Wing.

. 2003b. Census of Agriculture 2000. Islamabad: Economic Affairs and Statistics
Division/Agriculture Census Organization.
. 2003c. National Accounts of Pakistan 2001 02. Islamabad: FBS/Statistics Division.
Goebel, Jan. 2001. Decomposing Permanent and Transitory Poverty. Discussion Paper No. 256.
German Institute for Economic Research, Berlin.
Gunning, J. W., J. Hoddinott, B. Kinsey, and T. Owens. 2000. Revisiting Forever Gained: Income
Dynamics in the Resettlement Areas of Zimbabwe, 1983 96. Journal of Development Studies 36 (6).
Haddad, Lawrence, and Akhter U. Ahmed. 2002. Avoiding Chronic and Transitory Poverty:
Evidence from Egypt, 1997 99. FCND Discussion Paper No. 133. IFPRI, Washington, DC.
Irfan, M., and R. Amjad. 1984. Poverty in Rural Pakistan. In Poverty in Rural Asia edited by Aziz ur R.
Khan and Eddy Lee. International Labour Organisation/Asian Employment Programme.
Jaffri, Younus. 1999. Assessing Poverty in Pakistan. In A Profile of Poverty in Pakistan. Islamabad:
Mahbub ul Haq Centre for Human Development.
Jalan, J., and M. Ravallion. 1997. Are the Poor Less Well-Insured? Evidence on Vulnerability to
Income Risk in Rural China. Policy Research Working Paper No. 1863. The World Bank, Washington, DC.
Available http://econ.worldbank.org/ and Journal of Development Economics 58 (1).
. 1998. Determinants of Transient and Chronic Poverty: Evidence from Rural China. Policy
Research Working Paper No. 1936. The World Bank, Washington, DC. Available
http://econ.worldbank.org/
Kemal, A. R. 2001. Structural Adjustment, Macroeconomic Policies and Poverty Trends in Pakistan.
Paper presented at the Asia and Pacific Forum on Poverty: Reforming Policies and Institutions for Poverty
Reduction, ADB, Manila, 5 9 February.
Kurosaki, Takashi. 2002. Consumption Vulnerability and Dynamic Poverty in the North-West
Frontier Province, Pakistan. Available www.ier.hit-u.ac.jp/~kurosaki
. 2003. Measurement of Chronic and Transient Poverty: Theory and Application to Pakistan.
Discussion Paper Series A, No. 436. Institute of Economic Research at Hitotsubashi University, Tokyo.
Kurosaki, Takashi, and Anwar Hussain. 1999. Poverty, Risk and Human Capital in the Rural North-
West Frontier Province, Pakistan. Available www.ier.hit-u.ac.jp/~kurosaki
Kurosaki, Takashi, and Humayun Khan. 2003. Human Capital, Productivity, and Stratification in
Rural Pakistan. Available www.ier.hit-u.ac.jp/~kurosaki
Lanjouw, Jean O., and Peter Lanjouw. 1997. The Rural Non-Farm Sector: An Update. Mimeo. The
World Bank, Washington, DC.
Levin, Carol, Katherine Ralston, and Lawrence J. Haddad. 1993. Intra-Household Related Policy
Research: Implications for Data Collection. In Data Needs for Food Policy in Developing Countries: New
Directions for Household Surveys edited by Joachim von Braun and Detlev Puetz. Washington, DC: IFPRI.
Malik, M. H. 1988. Some New Evidence on the Incidence of Poverty in Pakistan. Pakistan
Development Review 27 (4).
Malik, S. J. 1992. Rural Poverty in Pakistan: Some Recent Evidence. Pakistan Development Review
31 (4).
References 47

48 Agricultural Growth and Rural Poverty
. 1993. Farm Production Data in Rural Household Surveys. In Data Needs for Food Policy in
Developing Countries: New Directions for Household Surveys edited by Joachim von Braun and Detlev Puetz.
Washington, DC: IFPRI.
. 1994. Poverty in Pakistan, 1984 85, 1987 88 and 1990 91. Washington, DC: IFPRI.
. 2003. Rural Credit Markets in Pakistan: Institutions and Constraints. Background paper
prepared for Pakistan Rural Factor Market Study. The World Bank, Washington, DC.
Malik, S. J., and Hina Nazli. 1998. Rural Poverty and Land Degradation: A Review of the Current
State of Knowledge. Pakistan Development Review 37 (4).
Malik, S. J., Safiya Aftab, and Nargis Sultana. 1994. Pakistan's Economic Performance, 1947 1993.
Lahore: Sure Publishers.
McCulloch, Neil, and Bob Baulch. 1999. Distinguishing the Chronically from the Transitorily Poor:
E v i d e n c e f r o m P a k i s t a n . I D S W o r k i n g P a p e r N o . 9 7 . I D S , S u s s e x . A v a i l a b l e
http://www.ids.ac.uk/ids/pvty/pvprp.html
. 2000. Simulating the Impact of Policy Upon Chronic and Transitory Poverty in Rural
Pakistan. Journal of Development Studies 36 (6).
Mellor, John W. 1988. Lectures on Agricultural Growth and Employment. Edited by Syed Nawab
Haider Naqvi, M. Ghaffar Chaudhry, and Sohail J. Malik. Islamabad: Pakistan Institute of Development
Economics.
. 2001. Employment Multiplier from Agricultural Growth and Poverty Reduction. Pakistan
Development Review 40 (4).
Mundlak, Yair, Donald F. Larson, and Rita Butzer. 2002. Determinants of Agricultural Growth in
Indonesia, the Philippines, and Thailand. World Bank Working Paper 2803. The World Bank, Washington,
DC.
Murgai, Rinku, Mubarik Ali, and Derek Byerlee. 2001. Productivity Growth and Sustainability in
Post-Green Revolution Agriculture: The Case of the Indian and Pakistan Punjabs. World Bank Research
Observer 16 (2).
Nazli, Hina. 2003. Rural Labor Markets in Pakistan: Institutions and Constraints. Background
paper prepared for Pakistan Rural Factor Market Study. The World Bank, Washington, DC.
Pickney, Thomas C. 1989. The Demand for Public Storage of Wheat in Pakistan. Research Report
77. IFPRI, Washington, DC.
Qureshi, Sarfraz K., and G. M. Arif. 1999. Profile of Poverty in Pakistan. Micro Impacts of
Macroeconomic and Adjustment Policies Technical Paper Series, No. 5. Pakistan Institute of Development
Economics, Islamabad.
Rahman, H. Z., and Mahabub Hussain. 1996. Issues in Measuring and Modeling Poverty. Policy
Research Working Paper 1615. The World Bank, Washington, DC.
. 1997. Recent Developments in Bangladesh Rural Economy: Implications for Strategies and
Policies for Alleviation of Poverty. Pakistan Development Review 36 (4).
Ravallion, M. Expected Poverty Under Risk-Induced Welfare Variability. Economic Journal 98 (393).
Rodgers, Joan R., and John L. Rodgers. 1991. The Measurement of Chronic and Transitory Poverty;
with Application to the United States. Working Paper No. 55. University of North Carolina at Greensboro,
North Carolina.

Rosenzweig, Mark R. 2000. The Consequences of Agricultural Productivity Growth for Rural
Landless Households: Findings from Research Based on the Indian Green Revolution Experience. Pakistan
Development Review 39 (4).
Social Policy Development Center. 2001. Annual Review. Karachi: Social Policy Development
Center.
World Bank, the. 2002. Pakistan Poverty Assessment: Poverty in Pakistan Vulnerabilities, Social Gaps,
and Rural Dynamics. Washington, DC: The World Bank.
Villanger, Espen. 2003. The Effects of Disasters on Income Mobility in Rural Pakistan: Bootstrap Inference
and Measurement Error Simulations. Bergen: Norwegian School of Economics.
Yaqub, Shahin. 2000. Poverty Dynamics in Developing Countries. Development Bibliography -16.
IDS, Sussex.
. 2002. Chronic Poverty: Scrutinizing Estimates, Patterns, Correlates, and Explanations.
Working Paper No. 21. Chronic Poverty Research Centre at Sussex University, Sussex.
References 49

APPENDIXES

APPENDIX 1: BACKGROUND ECONOMIC
DATA
Table A1.1: Agro-Climatic Zones of Pakistan
Rice/Wheat Punjab
Mixed Punjab
Cotton/Wheat Punjab
Low-Intensity Punjab
Barani (Rain-Fed) Punjab
Cotton/Wheat Sindh
Rice/Other Sindh
Other North-West
Frontier Province (NWFP)
Other Balochistan
Sialkot, Gujrat, Gujranwala, Sheikhupura, Lahore,
Kasur,Narowal, Mandi Bahauddin, Hafizabad
Sargodha, Khushab, Jhang, Faisalabad/Toba Tek Singh,
Okara
Sahiwal, Bahawalnagar, Bahawalpur, Rahimyar Khan,
Multan, Vehari, Lodhran, Khanewal, Pakpatan
Dera Ghazi Khan/Rajanpur, Muzaffargarh/Layyah,
Mianwali, Bhakkar, Dera Ismail Khan
Attock, Jhelum, Rawalpindi, Islamabad, Chakwal
Sukkur, Khairpur, Nawabshah, Hyderabad, Tharparkar,
Nowshero Feroz, Ghotki, Umerkot, Mirpur Khas, Sanghar
Jacobabad, Larkana, Dadu, Thatta, Badin, Shikarpur,
Karachi
All NWFP except Dera Ismail Khan
All Balochistan
Agro-Climatic Zone Districts
Source: Pickney, Thomas C. 1989. The Demand for Public Storage of Wheat in Pakistan.
Research Report 77. International Food Policy Research Institute, Washington,
DC.
Appendix 1 53

54 Agricultural Growth and Rural Poverty
Table A1.2: Share of Different Agro-Climatic Zones and Households by PovertyStatus and Different Income Sources
Agro-ClimaticZone
PovertyStatus
Wagesand Salaries
TransferIncome
CropIncome
RentalIncome
LivestockIncome
TotalIncome
Rice/Wheat Punjab
Mixed Punjab
Cotton/Wheat Punjab
Low-Intensity Punjab
Barani Punjab
Cotton/Wheat Sindh
Rice/Other Sindh
North-West Frontier Province
Balochistan
Rural Pakistan
Poor
Non-Poor
Total
Poor
Non-Poor
Total
Poor
Non-Poor
Total
Poor
Non-Poor
Total
Poor
Non-Poor
Total
Poor
Non-Poor
Total
Poor
Non-Poor
Total
Poor
Non-Poor
Total
Poor
Non-Poor
Total
Poor
Non-Poor
Total
6.56
10.24
16.80
5.45
6.24
11.69
7.85
5.52
13.37
4.18
3.02
7.19
1.74
5.42
7.16
6.86
6.30
13.16
4.39
5.92
10.31
5.63
7.44
13.07
2.62
4.62
7.24
45.28
54.72
100.00
3.01
15.55
18.56
4.44
10.67
15.11
2.82
5.83
8.65
2.91
3.55
6.47
1.66
10.17
11.83
0.64
1.09
1.73
0.48
1.22
1.70
11.63
22.73
34.36
0.22
1.36
1.59
27.82
72.18
100.00
1.86
12.61
14.47
2.73
6.62
9.35
7.71
15.80
23.50
4.34
4.94
9.28
0.29
0.89
1.18
11.15
10.39
21.54
6.00
5.97
11.97
2.12
2.78
4.90
1.37
2.43
3.80
37.57
62.43
100.00
3.27
30.39
33.66
3.06
12.70
15.76
2.68
15.04
17.72
2.66
8.05
10.71
0.00
0.14
0.14
0.23
5.03
5.26
0.48
2.44
2.92
3.29
9.55
12.83
0.00
1.01
1.01
15.66
84.34
100.00
2.67
11.80
14.47
9.49
10.16
19.65
8.58
13.87
22.44
6.78
5.32
12.10
0.51
1.27
1.78
5.78
4.12
9.90
1.09
3.56
4.66
3.82
4.78
8.60
1.52
4.89
6.41
40.23
59.77
100.00
3.71
12.38
16.09
4.03
7.10
11.13
7.14
10.96
18.10
4.14
4.16
8.30
0.96
3.54
4.50
8.16
7.68
15.84
4.62
5.32
9.94
4.49
6.82
11.31
1.67
3.12
4.79
38.92
61.08
100.00
Source: Computed from data in Government of Pakistan. 2003. Household Integrated Economic Survey 2001 02. Islamabad:
Federal Bureau of Statistics.

Appendix 1 55
No Land
Rice/Wheat Punjab
Mixed Punjab
Cotton/Wheat Punjab
Low-Intensity Punjab
Barani Punjab
Cotton/Wheat Sindh
Rice/Other Sindh
North-West Frontier Province
Balochistan
Rural Pakistan
Up to 1 acre
Rice/Wheat Punjab
Mixed Punjab
Cotton/Wheat Punjab
Low-Intensity Punjab
Barani Punjab
Cotton/Wheat Sindh
Rice/Other Sindh
North-West Frontier Province
Rural Pakistan
Up to 5 acres
Rice/Wheat Punjab
Mixed Punjab
Cotton/Wheat Punjab
Low-Intensity Punjab
Barani Punjab
Cotton/Wheat Sindh
Rice/Other Sindh
North-West Frontier Province
Balochistan
Rural Pakistan
Up to 12.5 acres
Rice/Wheat Punjab
Mixed Punjab
Cotton/Wheat Punjab
Low-Intensity Punjab
Barani Punjab
Cotton/Wheat Sindh
73.75
69.09
83.80
76.31
70.41
90.69
91.79
55.62
89.14
76.25
52.62
47.25
50.90
48.71
60.26
58.87
81.09
37.98
45.46
28.42
22.61
18.80
15.65
38.32
16.32
22.98
29.50
13.59
23.44
9.33
9.63
7.81
7.60
10.38
8.16
20.42
27.16
13.32
21.95
29.11
3.79
4.65
42.06
6.37
20.11
21.38
17.22
10.38
18.62
19.09
0.42
0.00
33.41
24.07
8.98
10.32
3.23
3.35
30.66
1.12
1.59
27.23
0.82
10.31
8.53
2.51
4.01
3.02
34.83
0.13
2.61
0.95
0.76
0.00
0.06
3.30
1.86
0.17
2.43
1.43
23.20
25.22
34.68
29.27
15.65
40.72
18.91
26.16
26.73
55.09
59.27
73.58
72.38
29.83
78.90
73.87
38.32
84.44
61.16
78.47
77.61
83.40
82.37
53.88
90.35
2.00
0.74
0.18
0.00
0.00
0.00
0.22
1.75
0.00
0.74
2.25
3.38
0.00
1.05
0.00
0.00
0.00
0.57
1.00
4.91
1.76
0.82
5.27
0.08
3.27
0.51
3.13
0.00
2.53
1.35
6.04
2.10
3.45
0.34
0.39
1.21
2.07
1.94
1.74
0.42
2.22
1.48
0.40
2.05
1.47
0.55
6.93
4.04
2.35
4.99
0.00
0.00
1.87
2.73
2.61
6.04
3.57
3.35
1.11
0.38
1.05
1.82
1.16
2.56
2.32
4.22
2.68
3.56
0.57
0.96
100.00
100.00
100.00
100.00
100.00
100.00
100.00
100.00
100.00
100.00
100.00
100.00
100.00
100.00
100.00
100.00
100.00
100.00
100.00
100.00
100.00
100.00
100.00
100.00
100.00
100.00
100.00
100.00
100.00
100.00
100.00
100.00
100.00
100.00
100.00
Size of OperatedLand Holding by
Agro-Climatic ZoneWages
and SalariesTransferIncome
CropIncome
RentalIncome
LivestockIncome
Households(%)
MonthlyIncome
Table A1.3: Sources of Income Across Agro-Climatic Zones and Size of Operated
Land Holding
16.95
14.73
16.10
8.66
6.56
11.41
7.29
12.63
5.67
10.30
11.65
17.65
8.89
6.93
1.14
0.16
43.29
14.16
12.25
20.15
8.26
5.54
7.47
10.13
20.94
1.11
13.24
10.55
18.55
12.55
3.15
17.05
100.00 (56.61)
100.00 (5.12)
100.00 (18.01)
Continued on next page
Note: Figures in parentheses represent the proportion of households in that category relative to total rural households.
Source: Computed from data in Government of Pakistan. 2003. Household Integrated Economic Survey 2001 02. Islamabad:
Federal Bureau of Statistics.

56 Agricultural Growth and Rural Poverty
Table... Continued
Size of OperatedLand Holding by
Agro-Climatic ZoneWages
and SalariesTransferIncome
CropIncome
RentalIncome
LivestockIncome
Households(%)
MonthlyIncome
Rice/Other Sindh
North-West Frontier Province
Balochistan
Rural Pakistan
More Than 12.5 acres
Rice/Wheat Punjab
Mixed Punjab
Cotton/Wheat Punjab
Low-Intensity Punjab
Barani Punjab
Cotton/Wheat Sindh
Rice/Other Sindh
North-West Frontier Province
Balochistan
Rural Pakistan
All Households
Rice/Wheat Punjab
Mixed Punjab
Cotton/Wheat Punjab
Low-Intensity Punjab
Barani Punjab
Cotton/Wheat Sindh
Rice/Other Sindh
North-West Frontier Province
Balochistan
Rural Pakistan
12.48
18.25
9.80
9.40
1.89
4.91
3.45
7.40
21.11
3.87
2.97
27.08
7.39
4.54
37.39
37.60
26.45
31.05
56.94
29.76
37.14
41.38
54.16
35.81
0.44
19.59
0.15
4.33
4.63
3.58
1.49
0.19
9.61
0.15
0.18
20.57
0.17
2.06
12.85
15.12
5.33
8.68
29.26
1.22
1.90
33.84
3.69
11.14
86.35
56.67
86.23
82.44
83.84
85.69
90.71
88.07
69.28
95.13
95.23
48.69
87.96
89.10
44.50
41.59
64.26
55.37
13.02
67.30
59.59
21.43
39.33
49.49
0.26
1.13
0.28
1.64
8.49
3.59
3.07
1.87
0.00
0.15
1.29
1.70
1.56
2.95
3.61
2.45
1.69
2.23
0.05
0.57
0.51
1.96
0.36
1.73
0.48
4.36
3.54
2.20
1.15
2.23
1.28
2.47
0.00
0.71
0.33
1.96
2.93
1.35
1.65
3.24
2.28
2.68
0.73
1.15
0.86
1.40
2.46
1.84
100.00
100.00
100.00
100.00
100.00
100.00
100.00
100.00
100.00
100.00
100.00
100.00
100.00
100.00
100.00
100.00
100.00
100.00
100.00
100.00
100.00
100.00
100.00
100.00
100.00 (6.31)
100.00 (100.00)
13.81
6.15
4.96
12.68
12.39
19.57
17.02
2.01
15.26
8.52
3.81
8.74
15.32
13.40
17.47
9.67
5.63
11.20
8.42
14.24
4.65
100.00 (13.95)

Appendix 1 57
Crop FY1992 FY1993 FY1994 FY1995 FY1996 FY1997 FY1998 FY1999 FY2000 FY2001 FY2002
Table A1.4: Percentage Share of Important Crops in Total Major Crops
All Major Crops
Food Crops
Rice
Wheat
Barley
Oats (Jowar)
Millet (Bajra)
Maize
Gram
Fiber Crops
Cotton
Cash Crops
Sugarcane
All Other Crops
Rapeseed and Mustard
Sesamum
Tobacco
100.00
45.67
11.66
27.05
0.28
0.49
0.41
2.67
3.11
38.93
13.08
2.32
0.87
0.19
1.26
100.00
51.32
12.50
31.79
0.36
0.59
0.69
2.99
2.40
31.37
14.61
2.70
0.94
0.26
1.50
100.00
53.02
15.84
30.03
0.33
0.52
0.46
3.03
2.81
27.53
16.86
2.59
0.88
0.25
1.46
100.00
53.17
13.52
31.36
0.34
0.60
0.71
3.08
3.56
27.80
16.71
2.32
0.96
0.26
1.10
100.00
51.23
14.31
28.74
0.34
0.54
0.47
2.79
4.04
31.57
14.93
2.27
0.99
0.26
1.02
100.00
53.76
16.57
29.41
0.31
0.48
0.45
2.86
3.68
29.11
14.45
2.68
1.16
0.31
1.21
100.00
54.08
15.02
30.63
0.33
0.47
0.60
2.63
4.40
26.42
16.93
2.57
1.10
0.27
1.20
100.00
54.65
16.80
29.24
0.26
0.47
0.60
3.49
3.99
25.22
17.54
2.59
1.06
0.20
1.33
100.00
55.55
16.43
32.13
0.20
0.40
0.39
3.10
2.89
28.80
13.20
2.36
0.97
0.20
1.18
100.00
53.96
16.65
30.53
0.18
0.44
0.55
3.38
2.23
30.24
13.61
2.19
0.85
0.32
1.02
100.00
52.42
15.61
29.85
0.17
0.45
0.60
3.44
2.30
30.07
15.09
2.43
0.96
0.44
1.03
FY = fiscal year.
Source: Government of Pakistan. 2003. Pakistan Economic Survey 2002 03. Islamabad: Economic Advisor's Wing/Finance
Division.
Table A1.5: Yield per Hectare of Major Crops(Tons/Hectare)
Year Wheat Rice Sugarcane Cotton Tobacco Millet (Bajra) Oats (Jowar) Maize
FY1991
FY1992
FY1993
FY1994
FY1995
FY1996
FY1997
FY1998
FY1999
FY2000
FY2001
FY2002a
FY2003
1.84
1.99
1.95
1.89
2.08
2.02
2.05
2.24
2.17
2.49
2.33
2.26
2.38
1.54
1.55
1.58
1.83
1.62
1.83
1.91
1.87
1.93
2.05
2.02
1.84
2.01
40.71
43.38
43.00
46.13
46.75
46.97
43.52
50.28
47.78
45.87
45.38
48.04
47.93
0.61
0.77
0.54
0.49
0.56
0.60
0.51
0.53
0.51
0.64
0.62
0.58
0.62
1.70
1.80
1.76
1.75
1.72
1.74
1.88
1.85
1.91
1.93
1.85
1.92
1.92
0.40
0.44
0.42
0.46
0.45
0.40
0.48
0.46
0.46
0.50
0.51
0.52
0.60
0.57
0.59
0.59
0.58
0.60
0.61
0.59
0.59
0.60
0.62
0.62
0.62
0.62
1.40
1.42
1.36
1.38
1.48
1.60
1.61
1.63
1.73
1.72
1.74
1.77
1.81
FY = fiscal year.
a Indicates July March.
Source: Government of Pakistan. 2003. Pakistan Economic Survey 2002 03. Islamabad: Economic Advisor's Wing/Finance
Division.

58 Agricultural Growth and Rural Poverty
1990 2000Size of Farm
(Acres) Sharecropped Area Leased Area Other Area Other AreaLeased AreaSharecropped Area
Pakistan
< 5
5 to < 12.5
12.5 to < 25
25 to < 50
50 to < 150
> 150
Punjab
< 5
5 to < 12.5
12.5 to < 25
25 to < 50
50 to < 150
> 150
Sindh
< 5
5 to < 12.5
12.5 to < 25
25 to < 50
50 to < 150
> 150
North-West Frontier Province
< 5
5 to < 12.5
12.5 to < 25
25 to < 50
50 to < 150
> 150
Balochistan
< 5
5 to < 12.5
12.5 to < 25
25 to < 50
50 to < 150
> 150
66.2
76.6
79.3
72.8
68.4
57.4
42.9
62.6
67.7
74.0
71.5
65.3
53.5
43.6
56.6
95.5
88.5
67.2
46.7
27.4
14.0
80.8
63.8
70.8
79.6
92.0
91.0
87.4
87.6
88.8
95.0
95.1
89.4
82.3
75.1
30.7
21.3
18.9
25.7
29.8
39.3
49.4
34.0
28.2
24.6
27.2
32.7
43.0
48.2
41.3
4.4
9.3
31.0
52.1
69.2
81.5
16.6
31.7
26.9
17.7
7.3
6.9
9.5
8.4
7.7
3.5
3.3
8.8
14.5
12.3
3.0
2.1
1.8
1.5
1.8
3.3
7.5
3.4
4.1
1.4
1.3
2.1
3.5
8.2
2.1
0.2
2.2
1.7
1.2
3.3
3.9
2.6
4.5
2.3
2.8
0.7
2.1
3.1
4.0
3.5
1.5
1.6
1.8
3.1
12.6
67.5
75.3
75.2
71.5
68.0
67.5
47.4
62.9
64.1
66.9
64.2
63.5
64.2
54.6
65.7
72.1
89.3
82.8
66.4
59.6
24.2
80.3
72.3
67.2
70.5
82.5
91.3
98.0
84.3
98.2
93.9
97.5
94.3
69.4
52.2
28.7
23.4
23.5
26.9
29.6
29.7
39.2
35.1
32.9
31.5
34.0
34.6
34.3
43.3
32.1
27.7
10.3
15.2
26.9
37.5
74.6
17.9
25.6
31.4
25.9
15.9
7.3
1.4
6.0
1.7
5.7
1.9
2.9
16.1
7.5
3.8
1.3
1.3
1.6
2.4
2.9
13.4
2.0
3.0
1.5
1.7
2.0
1.5
2.1
2.2
0.2
0.4
2.0
6.8
2.8
1.2
1.8
2.1
1.5
3.6
1.6
1.4
0.6
9.8
0.2
0.4
0.6
2.8
14.5
40.3
Table A1.6: Percentage Distribution of Tenant-Operated AreaUnder Different Tenancy Arrangements
Sources: Government of Pakistan. Census of Agriculture. Issues for 1990 and 2000. Islamabad: Economic Affairs and Statistics
Division/Agriculture Census Organization.

APPENDIX 2: DATA AND RESEARCH
GAPS
As a major sector of the economy, agriculture plays an important
role in providing employment, ensuring food and nutritional security,
increasing foreign exchange earnings, reducing trade deficit, and
enhancing industrial development, thereby improving overall economic
growth and reducing the incidence of poverty. While Mellor (2001)
maintains that agricultural growth is the main engine for rural1development, his emphasis that the most significant impact on rural
poverty occurs through the employment multipliers generated by farm to
non-farm linkages heightens the need for a comprehensive analysis of the
rural development process in Pakistan.
Studies on the non-farm sector in Pakistan are few and far between,
although Alderman and Garcia's study (1993) based on the International
Food Policy Research Institute (IFPRI) panel data found that non-farm
income was, by the late 1980s, the leading source of earnings for rural2households, i.e., those covered by the IFPRI sample. This result implied
that some income diversification had occurred in rural Pakistan, veering
income away from crop income as its major source. This diversification
resulted in different activities with varying rates of return. While some
farmers engaged in low-paying artisan activities, others invested in
transport and business. The study by Alderman and Garcia (1993) is now
10 years old. While the importance of agricultural growth in shaping the
rural economy as well as the rural non-farm sector cannot be understated,
a broader understanding of rural development strategies that include
activities beyond the agricultural domain is urgently needed.
The present study finds that the growth of the agriculture sector has
not been as high during the 1990s as it appears in the official statistics. The
existing data gaps have limited research into finding more precise and
appropriate policy-relevant answers. For example, in Pakistan, high rural
1 Mellor, John W. 2001. Employment Multiplier from Agricultural Growth and
Poverty Reduction. Pakistan Development Review 40 (4).2 Alderman, H., and M. Garcia. 1993. Poverty, Household Security, and Nutrition
in Rural Pakistan. Research Report 96. IFPRI, Washington, DC.
Appendix 2 59

60 Agricultural Growth and Rural Poverty
poverty is the result of a higher incidence of transitory poverty. The
limited research available on chronic and transitory poverty indicates
different determinants for each and, therefore, implies different policy
measures to reduce poverty. Further analysis is limited by the absence of
more recent panel data. With the changes occurring in policy approaches
towards poverty, inequality, and growth, the need for disaggregated and
more in-depth data has increased considerably. The existing data gaps
make it extremely difficult to trace trends in the impact of various
macroeconomic indicators, and even more difficult to juxtapose them with
policy initiatives in order to observe the impact that a particular policy
may have had. The availability of appropriate data is the crux of effective
policy formulation, and analyzing economic or social performance is
impossible without it. Moreover, not only is it necessary to increase the
scope of data collection, but also to improve the quality of the existing
database and surveys.
Although numerous studies cite the lack of data as a major reason
for incomplete analysis, there have been very few studies examining the
scope of data needs itself. Malik (1993) lists numerous discrepancies that
may arise in gathering farm production data from rural household3surveys. He points to the biases that may arise due to “sample selection,
questionnaire design, type of information elicited, how and where
information is collected, and inadequate training of enumerators”. One of
the most important considerations in maintaining consistency in
collecting data from survey-related work is the definition of various
concepts. For instance, what would be defined as the scope of 'farm
activity'? Would it include marketing or be restricted to production? It is
necessary to define clearly such issues in the data sources available.
The available quantitative data sources, and their advantages and
limitations are presented in Table A2.1 below. Among the nationally
representative datasets mentioned, the Household Integrated Economic
Survey (HIES) provides information on the various dimensions of4poverty. This survey, however, lacks detailed information on
agricultural and non-agricultural activities. The Agricultural Census and
Agricultural Statistics, on the other hand, provide detailed information on
agriculture, cropping pattern, input used, irrigation, marketing,
mechanization, credit, etc., but fail to provide measurements of income
and expenditure. Thus, one cannot analyze the characteristics of poor and
Data Gaps
3 Malik, S. J. 1993. Farm Production Data in Rural Household Surveys. In Data
Needs for Food Policy in Developing Countries: New Directions for Household Surveys
edited by Joachim von Braun and Detlev Puetz. Washington, DC: IFPRI.4 Recently, the HIES and Pakistan Integrated Household Surveys were combined
to provide detailed information on income and non-income indicators of
poverty.
Appendix 2 61
non-poor households against the backdrop of a particular trend of
agricultural growth.
The available literature indicates that modern technology in
agriculture resulted in labor displacement and in the absence of non-farm
employment in rural areas, any agricultural growth that occurred could
not be translated into effective poverty reduction. However, in order to
examine comprehensively the agricultural growth-rural poverty-
employment nexus, it is necessary to examine the variables related to
formal and informal employment, the nature of employment, working
hours, and wage rates etc. This information is currently not compiled in
one place in the Income and Expenditure Surveys.
A fuller understanding of the linkages between agricultural
growth and poverty also requires information collated in one source on
various aspects of agricultural growth, including the performance of
major and minor crops as well as livestock, the quality of soil, nature and
type of tenure, and trends in investment and prices, etc., so that
households can be classified by agro-climatic zone, economic activity, and
poverty status. In addition, despite its importance, the land market in
Pakistan is not well developed. Excessive land fragmentation and the sub-
division of landholdings from generation to generation have caused a
persistent decline in agricultural productivity. Security of land tenure is
crucial for the growth of the agriculture sector and affects both potential
and actual production and productivity, as well as the possibilities of
agricultural growth playing its due role in poverty reduction. This
highlights the importance of having appropriate data available on land
disputes, formal land titles, and rights to buy or sell land, etc.
Various studies have found a positive relationship between the
nutritional status of adults and earned income. Poor nutritional status is
directly related to food intake. External shocks and the resulting fall in
incomes are directly related to food insecurity that affects poor households
worse than others. Thus, data on nutritional indicators would provide an
additional insight in understanding the dynamic nature of poverty and its
link with food security and agricultural production.
The following data gaps are particularly noticeable in the data
sources available in Pakistan:
Number of hours worked under different farm and non-farm
activities,
Nature of employment casual or permanent,
Hourly wage rate by activity and nature of employment,
Nature of existing non-farm activities formal and informal,
Land titles,
(i)
(ii)
(iii)
(iv)
(v)

62 Agricultural Growth and Rural Poverty
Table A2.1: Advantages and Limitations of Available Quantitative Data Sources
1
2
3
4
5
6
7
8
9
10
Census of Agriculture
Agricultural Statistics
International Food Policy
Research Institute Panel
Survey
Pakistan Rural Household
Surveys
Household Integrated
Economic Surveys
Pakistan Integrated
Household Surveys
Rural Credit Surveys
Population Census
Labour Force Surveys
Pakistan Economic Surveys
Provides detailed information on number
and size of farms, type of tenure, cropping
patterns, cropping intensity, use of labor,
sources of income, etc.
Provide data on crop production,
mechanization, farm credit, etc.
Provides detailed information on income,
expenditure, farm area, production, input
usage, marketing, credit, and livestock, as
well as disaggregated data on education,
health, nutrition, and employment.
Provide detailed information on farm size
by plot, production, input use, and tenure
type on each plot, tenancy history, land
titling, irrigation, credit, livestock, income,
expenditure, education, health, nutrition,
dowry, and inheritance, etc.
Provide detailed information on income
and expenditure, education, population
welfare, family planning, health, and housing.
Provide detailed information on non-income
measures of poverty such as education,
health, family planning, housing, water and
sanitation, etc.
Provide detailed information on size of farm,
type of tenure, sources of credit, purpose of
loan, duration of loan, mark-up rate, etc.
Provides information on the basic
characteristics of the total population, including
education, occupation, and housing, etc.
Provide information on the labor force,
employment, unemployment, under-
employment, and employment status. All
data is disaggregated on the basis of gender
and rural/urban areas.
Provide time-series data on the aggregated
agricultural sector, including area under the
production of different crops, mechanization,
credit, etc.
Lack of data on income and expenditure
limits the scope of analyzing poverty based
on the different characteristics of farm
households.
Do not provide data on income and
expenditure.
Covers only four districts in all of Pakistan;
spans a short period of only 6 years with
14 visits to the same household.
Access to data is restricted.
Provide only limited data on agricultural
and non-agricultural activities.
Lack of data on income and expenditure
limits the use of poverty measurement and
diagnostics.
Do not provide information on income
and expenditure.
Does not provide information on income,
expenditure, agricultural production, and
employment activities.
Provides very little information on
employment and under-employment in the
informal sector.
Useful only in examining trend analysis.
No. Surveys Advantages Limitations
Source: Author's appraisal.

Appendix 2 63
(vi)
(vii)
Research Gaps
Income mobility elements of chronic and transitory poverty,
Nutrition indicators, such as height and weight.
Apart from the IFPRI Panel Survey and the Pakistan Rural
Household Survey, none of the sources listed in Table A 2.1 provide data
on the number of hours worked on different activities in agriculture and
non-agriculture. The Pakistan Rural Household Survey for the fiscal year
(FY) 2002 made an effort to collect this information, but it has not been
made available to Pakistani researchers as yet.
Ideally, longitudinal socio-economic information should be
collected at the household level from a sample of households selected as
representative of the agro-climatic zones. This information should be
spliced with existing district level incomes to provide detailed poverty
profiles as well as an analysis of the determinants of poverty over time.
Gaps in data translate into gaps in research. Although numerous
studies in Pakistan have determined poverty trends in Pakistan, their
connection with agricultural growth has not been studied in detail. Given
the lack of appropriate data, studies have considered agricultural
productivity and rural poverty as separate issues. For instance, the study
by Ali and Byerlee (2002) computed partial factor productivity for land,
labor, water, and total factor productivity for the crop and livestock sectors5in irrigated Punjab. The growth rates for factor productivities were then
calculated for three periods, namely the 'green revolution',
'intensification', and 'post-green revolution' period. Unfortunately, data
on poverty for every year of this analysis was not available, and the study
failed to establish the crucial linkage between poverty trends in these three
periods and trends in factor productivities.
Most available studies have focused on overall poverty trends in
Pakistan. While this is a useful exercise in itself, there is a noticeable gap in
the literature as far as regional and provincial poverty trends are
concerned. Poverty is a multi-faceted phenomenon and cannot be studied
in its entirety unless regional, agro-climatic, and social differences are
taken into account. Moreover, the more recent studies that disaggregate
poverty by regions or agro-climatic zone use only one poverty line
generally updated from a previous year estimate by using a price
indicator. This seriously biases the estimates of rural poverty and has
serious implications for policymaking. It is illogical to assume that similar
5 Ali, Mubarak, and Derek Byerlee. 2002. Productivity Growth and Resource
Degradation in Pakistan's Punjab: A Decomposition Analysis. Economic
Development and Cultural Change 50 (4).

6 See Yaqub, Shahin. 2000. Poverty Dynamics in Developing Countries.
Development Bibliography-16. Institute of Development Studies (IDS), Sussex;
Rodgers, Joan R., and John L. Rodgers. 1991. The Measurement of Chronic and
Transitory Poverty; with Application to the United States. Working Paper No.
55. University of North Carolina at Greensboro, North Carolina; Goebel, Jan.
2001. Decomposing Permanent and Transitory Poverty. Discussion Paper No.
256. German Institute for Economic Research, Berlin; Haddad, Lawrence, and
Akhter U. Ahmed. 2002. Avoiding Chronic and Transitory Poverty: Evidence
from Egypt, 1997 99. Food Consumption and Nutrition Division Discussion
Paper No. 133. IFPRI, Washington, DC.7 See Baulch, Bob, and Neil McCulloch. 1998. Being Poor and Becoming Poor:
Poverty Status and Poverty Transitions in Rural Pakistan. Institute of
Development Studies (IDS) Working Paper No. 79. IDS, Sussex. Available
http://www.ids.ac.uk/ids/pvty/pvprp.html; McCulloch, Neil, and Bob
Baulch. 1999. Distinguishing the Chronically from the Transitorily Poor:
Evidence from Pakistan. IDS Working Paper No. 97. IDS, Sussex. Available
http://www.ids.ac.uk/ids/pvty/pvprp.html; Baulch, Bob, and Neil
McCulloch. 2000. Simulating the Impact of Policy Upon Chronic and Transitory
Poverty in Rural Pakistan. Journal of Development Studies 36 (6); Kurosaki,
Takashi. 2003. Measurement of Chronic and Transient Poverty: Theory and
Application to Pakistan. Discussion Paper Series A, No. 436. Institute of
Economic Research at Hitotsubashi University, Tokyo; Villanger, Espen. 2003.The Effects of Disasters on Income Mobility in Rural Pakistan: Bootstrap Inference and
Measurement Error Simulations. Bergen: Norwegian School of Economics.
policy initiatives would be equally applicable to all the regions of the
country. In fact, what might be a favorable policy in one area may have
quite the opposite effect in another. Unless policy is informed by
indigenous realities, poverty alleviation will be neither effective nor
efficient.
The recent literature indicates a growing recognition of the
dynamic nature of poverty. Numerous studies have highlighted the
differences between chronic and transitory poverty at the international6level. In the context of Pakistan, however, only a few studies have
7explored this concept. The lack of research in these areas in the Pakistani
context is mainly due to the absence of more recent panel data.
64 Agricultural Growth and Rural Poverty


