PALAEOECOLOGICAL STUDIES OF SELECTED MIRES IN THE CRAVEN DISTRICT OF WEST YORKSHIRE WITH SPECIAL REFERENCE TO THE LATE DEVENSIAN PERIOD AND THE ULMUS DECLINE Submitted in accordance with the requirements for the degree of Doctor of Philosophy by Ernel Oybak L..- Department of Pure and Applied Biology The University of Leeds March 1993
Transcript
PALAEOECOLOGICAL STUDIES OF SELECTED MIRES IN THE CRAVEN
DISTRICT OF WEST YORKSHIRE WITH SPECIAL REFERENCE TO
THE LATE DEVENSIAN PERIOD AND THE ULMUS DECLINE
Submitted in accordance with the requirements for
the degree of Doctor of Philosophy
by
Ernel Oybak L..-
Department of Pure and Applied Biology
The University of Leeds
March 1993
PALAEOECOLOGICAL STUDIES OF SELECTED MIRES IN THE CRAVEN
DISTRICT OF WEST YORKSHIRE WITH SPECIAL REFERENCE TO
THE LATE DEVENSIAN PERIOD AND THE ULMUS DECLINE
Submitted in accordance with the requirements for
the degree of Doctor of Philosophy
by
Emel Oybak -,:...-
Department of Pure and Applied Biology
The University of Leeds
March 1993
Summary
Figures
Plates
Tables
CONTENTS
Tables and diagrams enclosed in pocket
Acknowledgements
1. INTRODUCTION
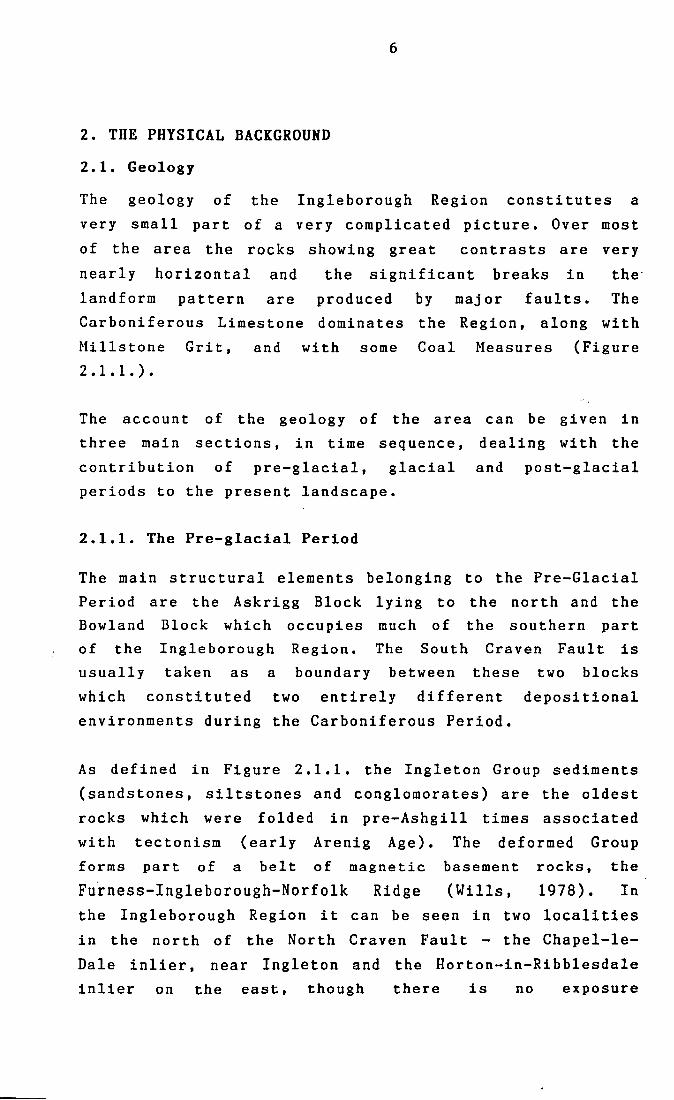
2. THE PHYSICAL BACKGROUND
2.1. Geology
2.1.1. The Pre-glacial Period
2.1.2. The Glacial Period
2.1.3. The Postglacial Period and the Present
Landscape
2.2. Climate
2.3. Soil 2.4. Vegetation
3. THE HISTORICAL BACKGROUND
4. MATERIALS AND METHODS
4.1. Collection and storage of samples
4.2. Macrofossil analyses
4.2.1. Determination of macrofossils
4.2.2. Presentation of macrofossils
4.3. Microfossil analyses
4.3.1. Preparation of samples for pollen counts
4.3.2. Counting procedure
4.3.3. Radiocarbon dates
4.3.4. Calculations and construction of the
pollen diagrams
4.4.4. Zonation of the pollen diagrams 5. SNIDDLE MOSS
5.1. Description of site
5.2. Stratigraphy
5.3. Macroscopic fossils
5.4. Microscopic fossils and local pollen
assemblage zones
i
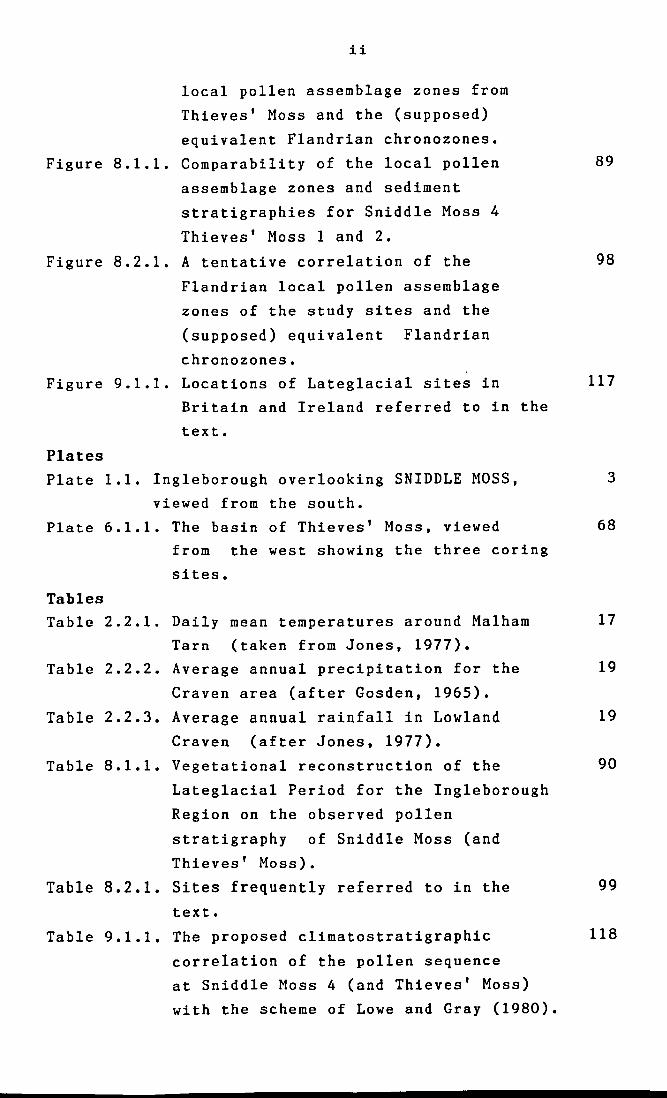
ii
ii
iii
v
1
6
6
6
10
14
16
20
22
25
33
33 33
34
35
35
35
36
36
37
38
39
39
39 42
42
5.5. A tentative correlation of the local pollen
assemblage zones for the three cores from
Sniddle Moss
5.6. A reconstruction of the local vegetational
succession at Sniddle Moss
6. THIEVES' MOSS
6.1. Description of site
6.2. Stratigraphy
6.3. Macroscopic fossils
6.4. Microscopic fossils and local pollen
assemblage zones
6.4. A tentative correlation of the local pollen
assemblage zones for the three cores from
Thieves' Moss
6.6. A reconstruction of the local vegetational
succession at Thieves' Moss
7. SUNSET HOLE
7.1. Description of site
7.2. Stratigraphy
7.3. Macroscopic fossils
7.4. Microscopic fossils and local pollen
assemblage zones
7.5. A reconstruction of the local vegetational
succession at Sunset Hole
8. A RECONSTRUCTION OF THE REGIONAL VEGETATIONAL
SUCCESSION AND ENVIRONMENT
8.1. Lateglacial
8.2. Flandrian (Postglacial)
9. DISCUSSION
9.1. Lateglacial
9.2. Flandrian (Postglacial)
10 Conclusion
APPENDIX 1
APPENDIX 2
APPENDIX 3
APPENDIX 4
APPENDIX 5
APPENDIX 6
APPENDIX 7
56
60
67
67
67
71
71
76
78
82
82
82
83
83
85
88
88
97
116
116
124
136
139
140
142
143
146
147
148
APPENDIX 8 APPENDIX 9 APPENDIX 10 REFERENCES
149
150 152 169
Summary
(1) Percentage and absolute pollen diagrams are presented for a lowland si te, Sniddle Moss, and two upland si tes, Thieves' Moss and Sunset Hole, in the Ingleborough Region, the Craven District, north-west Yorkshire.
(2) The analysis of the earliest sediments of Sniddle Moss and Thieves' Moss suggests the existence of a Lateglacial sequence. A reconstruction of the regional vegetational succession mainly based on the Sniddle Moss 4 data reveals that at first a very open vegetation and a species-rich calcareous grassland were formed. The spread of juniper scrub preceded the expansion of tree birches. It is tentatively inferred that the early part of the Lateglacial is interrupted by a phase of deteriorating climate and that the relative warmth of the Lateglacial Interstadial gives way to a further and more prolonged deterioration. The climatic deterioration of the Younger Dryas Period is clearly registered by the decline of thermophilous taxa and the local severity of conditions demonstrated by the increased abundance of chianophilous taxa and other montane herbs in the profile of both Sniddle Moss (4) and Thieves' Moss (2).
(3) The ensuing amelioration in climate at the beginning of the Flandrian (early and middle) is traced.
(4) It is suggested that the woodland vegetation was being managed by the local Mesolithic and early Neolithic population prior to the first classical elm decline of the Atlantic/Sub-Boreal transition (c. 5000 BP).
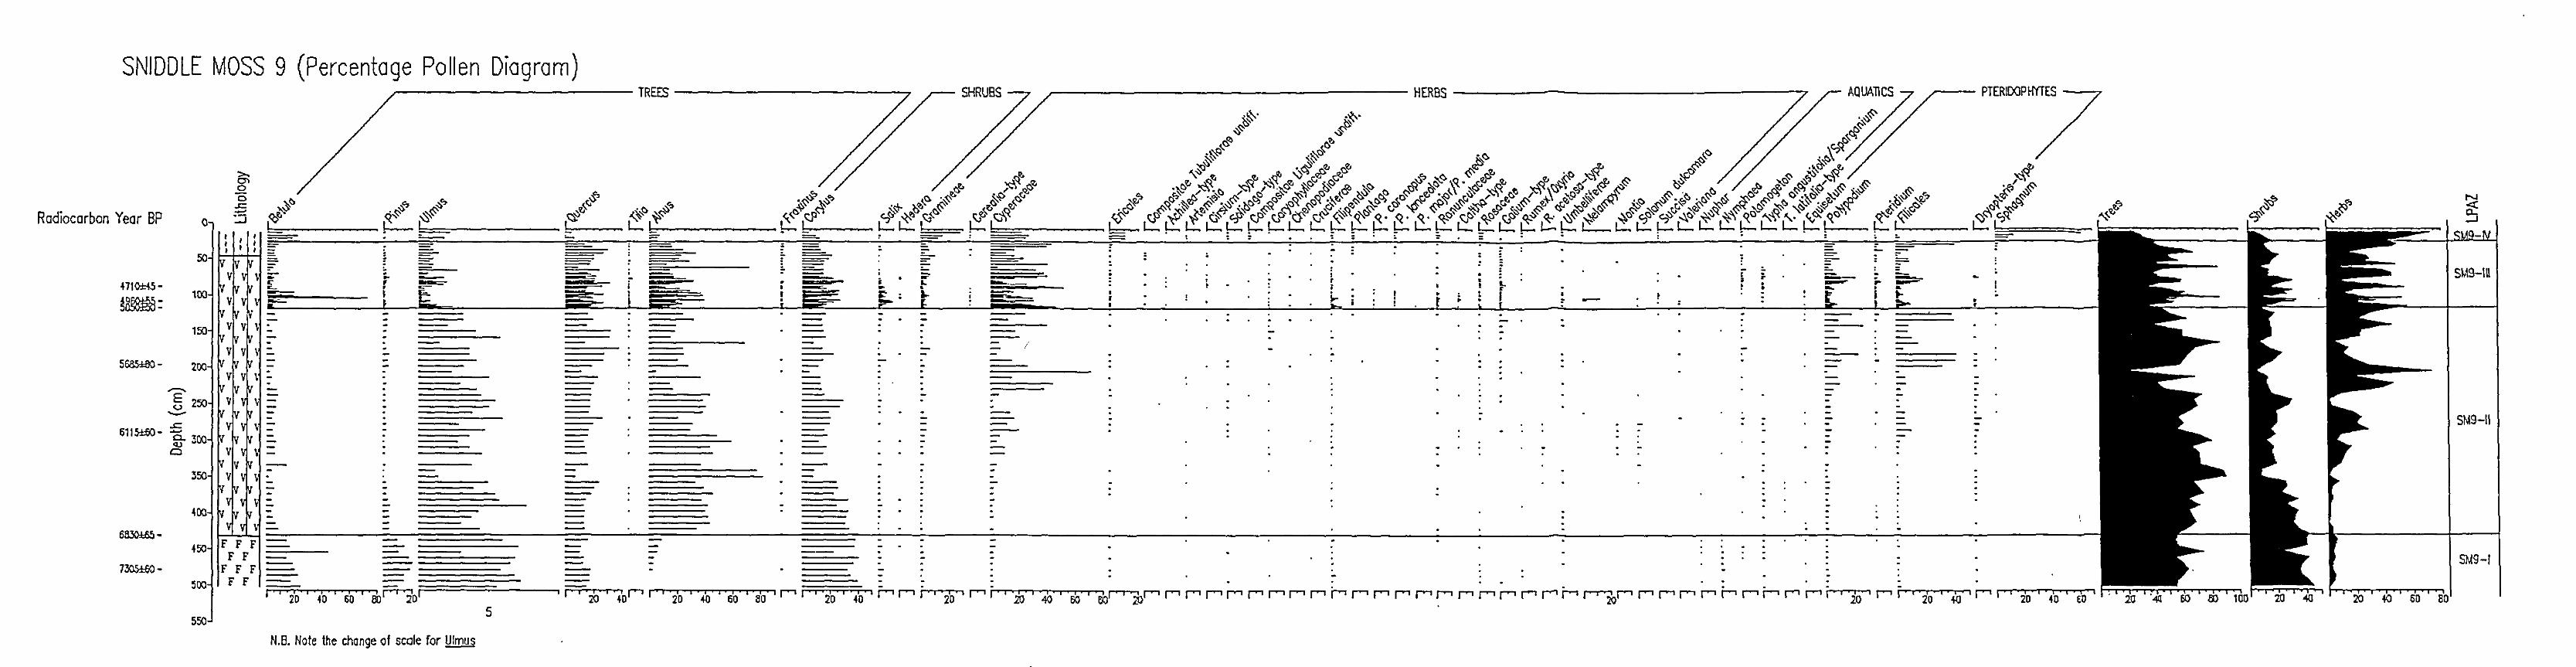
(5) Pollen analysis involving continuous sampling across the elm decline at Sniddle Moss (9) and Sunset Hole permitted a detailed reconstruction of the vegetational changes and the observation of the nature of the elm curve. A chronology for Sniddle Moss (9) is provided by radiocarbon dating. The initial recovery of elms is dated to 4710±45 BP and the second elm decline to about 4520 BP. The possible factors contributing to the first classical elm decline and the changes in the elm curve immediately following the first decline are considered.
i
Figures
Figure 1.1. Map of the Craven District showing
the location of the study sites.
Figure 2.1.1. Geological sketch map of the
district around Ingleborough
(modified from Dunham et al., 1953).
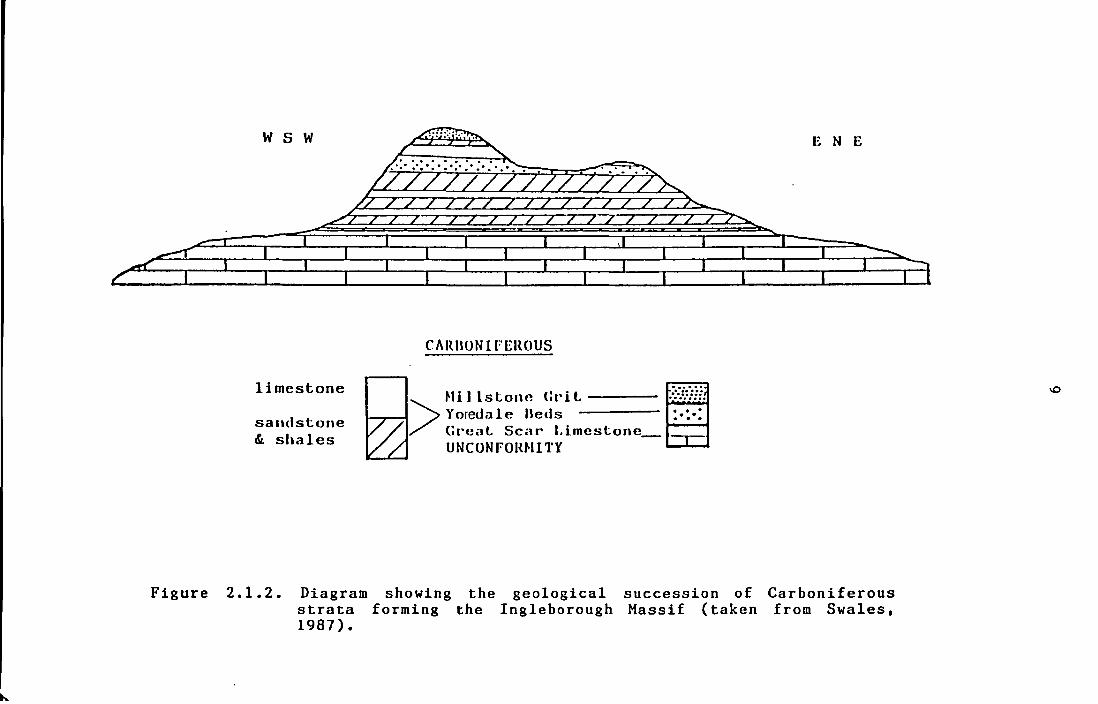
Figure 2.1.2. Diagram showing the geological
succession of Carboniferous strata
forming the Ingleborough Massif
(taken from Swales, 1987).
Figure 2.1.3. Glacial features of the Settle
District (Source: Arthurton et al.,
1988).
Figure 2.1.4. Drumlins in the Ribble-Aire Valleys
(Source: Raistrick, 1930).
Page
2
7
9
12
13
Figure 2.2.1. Mean monthly precipitation, Malham 18
(1881-1915) (taken from Jones, 1977).
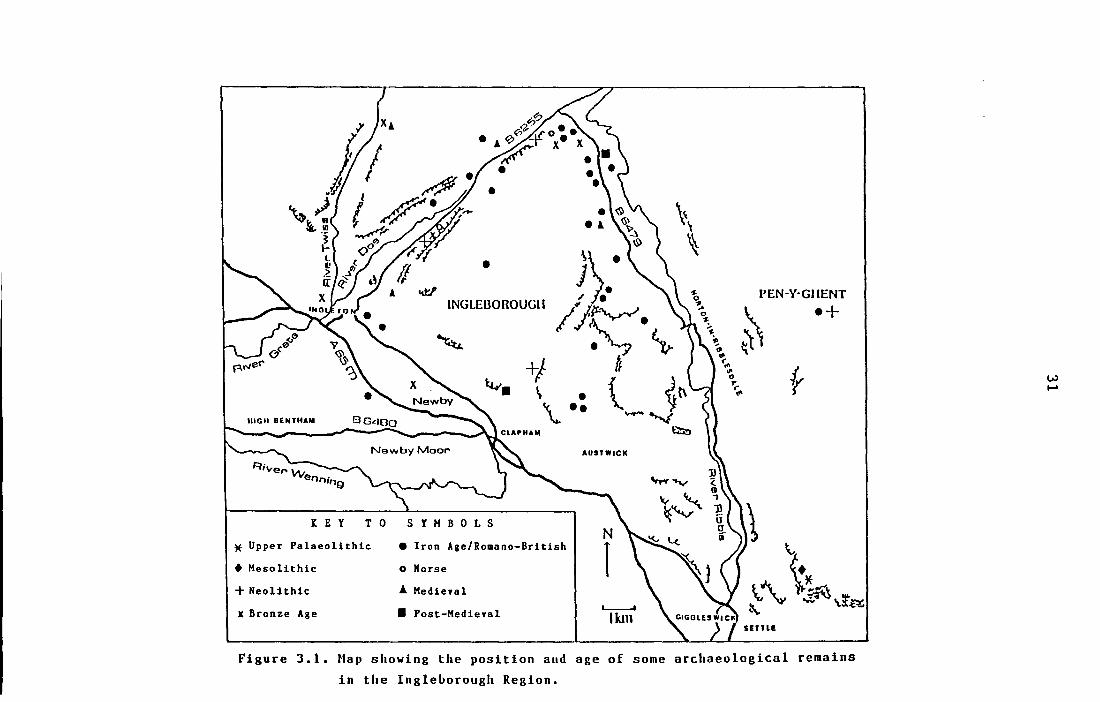
Figure 3.1. Map showing the position and age of 31
some archaeological remains in the
Ingleborough Region.
Figure 5.2.1. Stratigraphy across Sniddle Moss. 40
Figure 5.4.1. Deposition time (yr cm- 1 ) for Sniddle 51
I am indebted to Dr D. D. Bartley, who is the supervisor
of this study, for his sustained interest, advice and
unlimited patience, and for his untiring help in field
work.
My thanks are due to Mr Paul Field for his invaluable
assistance in the field and in running the "Ti1ia Software
Package"; to Professor C. D. Pigott and M. E. Pigott
for bringing the Snidd1e Moss site to my attention and
access to the preliminary 1ihto10gica1 and pollen
analytical da ta; to Mr Tom B10ckee1 and Dr J. H. Dickson
for their help in identifying the mosses from Snidd1e
Moss; to Mr Albert Henderson for his encouragement during
the study of the fossil oospores of Characeae from the
study sites; to J. A. Moore and D. M. John of the British
Museum (Natural History) for useful discussions
and giving of their advice concerning Characeae oospores;
to Mr Adrian Hick for his invaluable assistance
in the SEM; to Cem Sara~ who drew Figure 5.2.1.; to the
Natural Environment Research Council, Dr D. D. Harkness
for the determination of the radiocarbon ages; to Mr
Peter Haw who allowed access to his land (Crummack Farm);
to my parents and friends for their psychological support
throughout, and to the University of Hacettepe (Ankara,
Turkey) for its sponsorship.
I N G L E B 0 R 0 UGH
1
1. INTRODUCTION
The Ingleborough Region, in which the study areas lie,
forms the western margin of the Craven District (Figure
1.1.). It displays strongly contrasting scenery with
a wide variety of geological formations and structures
due to the various geological events, which have shaped
the landscape over the years. The area to the north-east
dominated by the peaks of Whernside (NGR SD 7381), Pen
y-ghent (NGR SD 8373), and Ingleborough (NGR SD 7474)
shows an abundant limestone cliff scenery. The limestone
country is cut off abruptly by the dislocation of the
Craven Faults running north-west to south-east. South
of the faults lies the western part of the Craven
Lowlands which is mainly undulating pastoral country
shrouded in thick glaCial deposits, with the very minimum
of rock features.
The si tes selected for this study, wi th the exception
of Sniddle Moss, lie on the Ingleborough Massif within
the limestone upland. The Ingleborough Massif is situated
in the Yorkshire Dales National Park (NGR SD 77). It 2 spreads over an area of about 65 km • Above the plateau,
Ingleborough hill rises to 723 m (MSL), extending south
west and overlooking the lowlands e. g. Sniddle Moss
on Newby Moor near Clapham in the south of the
Ingleborough Region (Plate 1.1.).
Previous palaeobotanical investigations undertaken in
Upland Craven (Pigott & Pigot t, 1959 and 1963), in the
lowlands (Jones, 1977; Bartley et al., 1990) and on the
Ingleborough Massif (Gosden, 1965; Swales, 1987) have
provided data relating to the vegetational history of
parts of the Craven District, which has encompassed mainly
Flandrian events. It is particularly noticeable in most
of the diagrams from the region that there is a lack
of clear lithological evidence for deposits of Devensian
WHERNSIDE.
N t
tiT TON U Hat R S
Pl,ott , Pl •• tt. 1959 ond 1963 t. Tar" Ho •• C .. d ... 1965 Z. Halw1th Ko •• l. Ho~r.k. Rock. 4. "o •• hton r.ll 5. Scar Clo •• 6. Thi., •• ' Mo •• Jo •••• 1977; 8a.cl., ££ £1 .. 1990 7. Eahto. Tar. 8. Lhton Il1r .. 9. Marton. BO'b
Deposits above 14 cm were not available for pollen
analyses because for the reason mentioned previously
for the uppermost layers of SM4.
56
5.5. A tentative correlation of the local pollen
cores from Sniddle assemblage zones for the three
Moss
As seen in Figure 5.5.1., SM4 and the studied sequence
of SM4a have comparable assemblages, except for SM4a-II.
The differences in the pollen record between the two
sites are slight. In SM4-VIIIb Pinus pollen rises up
to 15.5%, whereas in SM4a-I it varies from 14.3% to 28.7%
of TLP. However, both zones represent similar
concentrations for Pinus up to 9.1x10³ grains cm-3 at 3 -3 SM4 and up to 7.2xlO grains cm at SM4a. In addition,
Corylus has higher values in SM4-VIIlb than in SM4a-I.
Quercus pollen never exceeds 5% of TLP in SM4-VIIIb,
whilst in SM4a-I it is slightly higher than in SM4-VIIIb,
bu t not over 10% of TLP. The following zone, presenting
high Pinus pollen values at SM4a is considered not to
have an equivalent at SM4. At first glance, fluctuations
in Pinus pollen concentrations, rising up to c. 18xl03
grains cm-3 in subzone SM4-VllIa might question this
assumption. A
fluctuations
concentrations,
rather than
Juniperus and
closer look however suggests
show a good coincidence
that these
with TLP
possibly indicating sedimentological
floristic changes. The persistence of
the absence of Alnus pollen in subzone
SM4-VlIIa may show that it is earlier than any part of
SM4a. In SM4a-II, Pinus pollen reaches about 47% of TLP
and 25xl03 grains cm-3 , while Corylus falls to a minimum
value of 15.4%. The maximum Pinus pollen marks the Late
Boreal Period of the Flandrian (before c. 7000 BP).
The base of the studied sequence of SM9 shows a section
between 430-502 cm with Corylus, Betula and Pinus pollen
predominant. The initial rise of Alnus pollen dated to
7305±60 BP and Quercus pollen up to 17.4% evidence that
SM9-I corresponds to the beginning of the Atlantic Period.
SM4 SM4a
LPAZ LPAZ
SM4-X
SM4-IXb SM4a-III
SM4-IXa 1------ r-----.-
HIATUS HIATUS
r-----SM4a-II
r-----SM-VlIIb SM4a-I
SM4-VIIIa
SM4-VII
SM4-VI
SH4-V
SM4-IVd
SM4-IVc
SM4-IVb
SH4-IVa
SM4-IIIc
SM4-IIIb
SM4-IIIa
SM4-II
SM4-1
57
Srt9 Radiocarbon
years(BP)
LPAZ
f-- ---
HIATUS
r-------SM9-IV
SM9-III
SM9-II
SM9-1
c tronozon
4710±45 4960±55 5050:1:50 6115:1:58 6830±65
7305:1:60
9130:1:65
F13
Fl2
Fll
De.,enslan Late
glacial
Figure 5.5.1. A tentative correlation of the local pollen assemblage zones from Sniddle Moss and the (supposed) equivalent Flandrian chronozones. ( •••• ) similarity; (----) the assumed hiatus boundary; (.) direct comparison
s
58
A considerable part of SM9-I1 is characterized by high
Alnus pollen quantities (the Atlantic Period), with a
range of dates between about 6830 BP and 5000 BP, which
do not appear at the two other sites. SM9 also records
the first classical elm decline at 118 cm dated to 5050±50
BP (the Atlantic/Sub-Boreal transition).
When using ·the estimated time scale based on the peat
growth rate for SM9-IV (12 yr cm- I ), the age of the peat
at 14 cm would be c. 3770 BP. A hiatus in peat growth
appears to have occurred so that the record in the profile
of SM9 is likely to be missing from the beginning of
the Sub-Boreal Period onwards (Figure 5.2.2.). However,
to-day there are no signs of erosion and the peat seems
to be acti vely growing. Since there
dates from the deposits above 78
observed sequence of SM4a above 90
are no radiocarbon
cm at SM4 and the
cm, it is difficult
to make a direc t comparison between the three profiles.
But it is obvious that there is an increase in NAP with
corresponding peaks in sedge, grass and ericaceous pollen
and Sphagnum spores in all sequences. Equally, there
is a fall in values of the formerly important tree
species, with the exception of Betula in SM9-II1 reaching
over 25% of TLP. The sudden changes in the pollen curves
in SM4-IX and SM4a-III support the possi bili ty of gaps
in the sequences of SM4 and SM4a and suggest that the
upper samples of these two si tes are post-Ulmus decline
and, conseq uen tly younger than 5000 BP. Both may
correspond to a period of forest clearance activities
in more intense form, culminating in more open landscape
near Sniddle Moss and in the Craven District as a whole.
SM4-X clearly represents the open habitat which exists
at the present day. A feature common to the upper parts
of the three profiles is that there is a rise in the
concentrations of indeterminable pollen, probably due
to poor pollen preservation.
Recent works based on multiple core approaches have shown
spatial variability in past vegetation and pollen
59
0
~
100
150
QJ In 0 200 -C ..... 0 QJ
Q.. 250 E e -
- 300 E u '-'
:[ 350 Q)
CI
400
450
500 2000 4000 8000
550
Radiocarbon Year BP
Figure 5.5.2. Graph of peat growth rates for the Sniddle
Moss 9 diagram (between 14-502 em).
60
dispersion pathways in a single basin (e.g. Edwards &
Thompson, 1984 ; Whit tington ~ al., 1991a). A synthesis
of the pollen histories of the studied Flandrian sequences
of Sniddle Moss profiles also reveals local variations
in the sediment record and pollen catchment area
processes. Al though SM4a is adj acen t to SM4, it displays
a marked difference - zone SM4a-II whose correspondence
is not identified in the profile of SM4 - possibly related
to variations in peat growth affected by the
micro-topography of the mire surface (cf. Turner et al.,
1989). The pollen record of the Atlantic Period, in
particular, seems to be missing at SM4 and SM4a near
the margin of the basin. The phenomenon of the occurrence
of hiatuses in the deposits of the Atlantic Period is
widespread in northern Europe (Rybnicek & Rybnickova,
1987; Bartley & Morgan, 1990). The preservation of such
deposits at SM9 suggest that erosion was not so severe
in the centre of the mire during the Atlantic Period.
5.6. A reconstruction of the local vegetational succession
at Sniddle Moss
Four main phases of the hydroseral succession
distinguished for the Sniddle Moss site as follows:
1. A lake with fringing swamp phase,
2. A rich (eutrophic) fen/swamp phase,
3. A mesotrophic fen/swamp carr phase,
4. A bog-heathland phase.
1. A lake with fringing swamp phase
SM4 zones from SM4-1 to SM4-V
SM9 the upper lake clay (642-548 cm)
may be
The local deposition of a grey clay (SM4) indicates that
there was a lake, on the spot, which originated in a
deep basin after the retreat stages of a glaciation •.
Abundant desmids, in particular, imply meso- to eutrophic
conditions (cf. Coesel, 1979a and b). Frequent moss
61
fragments in the basal clay suggest that immature and
base-rich soil profiles were colonized by bryophytes,
amongst which Homalotheci um sericeum and H. ni tens were
present. It appears that erosion was severe and
minerogenic material along with moss fragments washed
in to the lake from the unstable slopes surrounding it.
Macrophyte vegetation in the immediate area must have
been very sparse, wi th grasses and other herbs of open
areas (such as Chenopodiaceae, Helianthemum, Rumex/Oxyria
Geranium, Saxifraga granulata-type and .§.. oppositifolia
type), and receiving Pinus pollen through long-distance
transport. The regular occurrence of Artemisia pollen
completes the well known palynological reflection of
the vegetation of the early Lateglacial period (cf.
Iversen, 1954). Scattered grains of Filipendula and Ilex
must have been secondary pollen from the older deposits
over which the ice had passed.
Organic material then began to accumulate in the lake,
suggesting a distinct change in environmental conditions.
This was accompanied by a gradual diversification in
the flora. Potamogeton (a maximum of 20% of TLP) and
algae (*) (including Characeae) in abundance imply a rich
aquatic vegetation with Myriophyllum alterniflorum and
Typha angustifolia/Sparganium. The rise in Cyperaceae
pollen and Equisetum spores may point to the beginning
of the hydroseral invasion of the open water by the
lake-side vegetation. Gali um-type, Ranunculaceae and
Thalictrum were also present in this sedge-dominated
stand. Away from the lake itself, the ground seems to
have remained sparsely vegetated. Sphagna (spores)
tolerant of basic conditions may have occurred
sporadically on damper parts of the locality. Salix
(*) Pediastrum and Tetraedron were also recorded but
they have not been plotted in pollen diagrams due to
their scarcity.
62
(probably dwarf willow) may have become important in
the pioneer shrub-heath vegetation. A fruit of Betula
sp. found at 302 cm indicates the local presence of the
taxon at this time. Unfortunately, specific identification
is very difficult because of its poor preservation.
The clay (300-296 cm) overlying the organic mud in the
profile of SM4 does not show any marked change in the
local plant life. There is no strong evidence pointing
to the presence of retrogressive environmental factors
such as any climatic deterioration (see also discussion).
The lithology of local pollen assemblage zones SM4-II1
and SM4-IV is chiefly a highly calcareous organic mud
or marl which is often considered to be suggestive of
more stable conditions in and around the lake. The
macroscopic finds of Cratoneuron commutatum
this calcicole
occurrence of
species was present at this
Drepanocladus revolvens,
show that
time. The
Hy10comium
splendens and Racomi trium sp. was also ascertained. The
pollen spectra illustrate that on damper parts of the
site, sedges and willow carr may have expanded along
with tall herbs such as Filipendula cf. ulmaria, Caltha
palustris and Urtica with Eguisetum. On drier parts a
mosaic of species of base-rich areas was widespread
including Centaurea nigra-type, Epilobium, Helianthemum,
Plantago major/Po media, Succisa and other herbs. Female
catkin scales of Betula pubescens at 278 cm confirm its
local occurrence.
The composition of the local flora and vegetation
gradually began to change. The dominance of Gramineae
and Rumex/Oxyria is coupled with the deposition of
mineral-rich sediments in the lake, predominantly silty
organic mud with clay, which are suggestive of erosion.
In zone SM4-V and in the profile of SM9 (642-548 cm)
a clay was deposi ted as a resul t of solifluc tion and
slopewash from the surrounding land under severe climatic
63
conditions. The onset of climatic deterioration is most
likely to have led to the drastic decline of thermophilous
species. Aquatic vegetation became rare, with Menyanthes
t ri folia ta, Myriophyllum al terni florum, Potamogeton-type
and P. natans, but algae were of importance in the lake.
The sporadic occurrence of aquatic pollen during this
last stage of the Lateglacial is regarded as the result
of the freezing of the lake for long periods of time
under extreme climatic condi tions (Gray & Lowe, 1977) •
At almost all sampling points near the edges of the former
lake Calliergon giganteum, Drepanocladus exannulatus,
D. ? fluitans and Scorpidium scorpioides leaves first
appear in the upper clay. It might be inferred that the
margins of the lake were dominated by these aquatic brown
mosses. Dickson (1973) records these above-mentioned
taxa among the most frequently encountered species from
Lateglacial sites (Godwin zones II and III) in Britain.
A similar assemblage of species in Lateglacial/early
Holocene deposits were also shown from other parts of
Europe and North America (Vi t t & Kuhry, 1992). Sedges
wi th freq uen t Ranunculaceae (including Ranuncul us Sect.
Batrachium) and some Salix persisted around the lake
at this time. On the ground grasses expanded more widely
wi th a variety of taxa of open areas such as Armeria,
Artemisia, Rumex/Oxyria and Selaginella.
2. A rich (eutrophic) fen/swamp phase
SM4 zones from SM4-VI to SM4-VIII (and SM4a; zones
SM4a-I and -II)
SM9 organic mud (548-500 cm) and zone SM9-I
The deposits of this phase consisting largely of organic
material are made up of fragments of a fen/swamp
vegetation. The diminution of the mineral content suggests
reduced erosion, probably reflecting the development
of a more closed vegetation on the surrounding slopes
wi th the onset of climatic amelioration. In this phase
64
aquatic vegetation became rich with Menyanthes trifoliata,
Myriophyllum alterniflorum, M. spicatum, M. verticillatum,
Nymphaea alba, Typha angustifolia/Sparganium, T.
latifolia, Sparganium minimum, Potamogeton-type, P.
natans, P. praelongus and P. cf. zizii, pointing to an
increased producti vi ty in the lake. The margins of the
lake supported a sedge-dominated community, including
Cladium mariscus, Ranunculaceae and Thalictrum minus
along with willow carr. Caltha palustris, Filipendula,
Potentilla palustris, Sanguisorba officinalis and Solanum
dulcamara may have been part of a tall herb community
in damp grassland. It appears that Betula spp. (B. pendula
and B. pubescens) and Populus tremula were the principal
trees on the spot. Thus Anti trichia curtipendula,
Eurhynchium praelongum and Hypnum cupressiforme agg.
could have grown on the tree bases. Amblystegium ?
riparium, A. varium and Sphagna (S. Sect. Acutifolia
and S. Sect. Cuspida ta) may have been present in damp
habitats.
This phase also saw the spread of Fontinalis antipyretica.
The stratigraphic section reveals that this aquatic
species did not colonize the northern side of the lake.
Only occasional leaves were recorded from SM4 and the
adjacent
in the
sampling
aquatic
points. Calliergon
bryoflora. Alisma
Ceratophyllum demersum, Hippuris
Potamogeton perfoliatus, P. pusillus
joined the rich-aquatic vegetation.
or decreased in numbers, probably
giganteum existed
plantago-aquatica,
vulgaris, Nuphar,
and P. obtusifolius
Algae disappeared
as a result of a
decrease in water level through strong evaporation under
warm and dry climatic condi tions in the early Flandrian
Period (the Boreal Period).
65
3. A meso trophic fen/swamp carr phase
SM4 zones SM4-VIII and SM4-IX (and SM4a; zone SM4a
III)
SM9 zones SM9-I1 and SM9-II1
This phase is characterized by a decline in the eutrophic
aquatic plant taxa and a rise in pollen and macrofossils
of monocots. There can be no doubt that the lake was
gradually filled with vegetation. The appearance of Care x
diandra, C" echinata, C. Sect. Extensae, C. flava-type,
C. Sect. Paniculata, C. vesicaria and Eriophorum supports
the idea that marginal communities spread towards the
middle of the lake (terrestrialization) and the
accumulation of organic deposits (peat formation) took
place. This may have eventually resulted in the
establishment of Alnus glutinosa and Salix sp., and the
expansion of fen and fen carr species, such as Angelica
NAP shows a further rise and becomes more important than
in the preceding subzone while Betula declines.
Rumex/Oxyria and Ranunculaceae pollen increases before
falling at the top of the subzone where Filipendula peaks
and Empetrum rises slightly.
The terminal boundary: Betula pollen increases.
74
TM2-II1 (182-142 cm)
This zone is divided into two subzones on the basis of
the Juniperus curve.
TM2-IIIa Betula-Juniperus LPAZ
(182-162 cm)
There is a rise in total pollen concentrations. Betula
and Juniperus pollen dominates this zone as NAP exhibits
a gradual fall throughout. Filipendula is well-represented
The terminal boundary: Juniperus pollen decreases.
TM2-IIIb Betula-Gramineae LPAZ
(164-142 cm)
NAP falls to 11.6% of TLP for the first time. Corylus
and Quercus first appear in this subzone. Betula pollen
is the main type (up to c.73%) though it decreases towards
the top, whilst Cory Ius values progressively rise.
Juniperus pollen declines by mid-zone and disappears
completely.
The terminal boundary: Corylus pollen rises.
TM2-IV Cory Ius-Betula LPAZ (Cory Ius Phase)
(142-126 cm)
Total pollen concentrations of this zone are higher than
in the preceding subzone. The expansion of Corylus which
began in the underlying zone continues and reaches 58%
of TLP. Betula declines steeply towards the top.
TM3
TM3-1 Corylus-Betula LPAZ (Corylus Phase)
(218-182 cm)
Corylus is the dominant type though it decreases towards
the top of the zone. Filicales peaks at the end.
The terminal boundary: Pinus pollen rises.
75
TM3-II (182-50 cm)
This zone is divided into two subzones, mainly on the
basis of Pinus pollen values.
TM3-IIa Corylus-Pinus-Cyperaceae LPAZ
(182-106 cm)
This subzone is characterized by a fall in total pollen
concentrations.
rises. After
Corylus percentages decline, whilst Pinus
an initial increase Cyperaceae pollen
exhibits fluctuations as does Eguisetum.
The terminal boundary: Pinus pollen shows a further rise.
TM3-IIb Pinus-Cory Ius LPAZ
(106-50 cm)
There is a conside'rable decrease in total land pollen
concentrations. Pinus is the major tree pollen. Cyperaceae
peaks nearly in the mid-zone, while Ericales and Sphagnum
become significant towards the end of this zone. Filicales
spores assume an importance.
The terminal boundary: Pinus pollen declines.
TM3-II1 (50-2 cm)
This zone is characterized by an increase in total land
pollen concentrations. Two subzones are defined, on the
basis of the Ericales curve.
TM3-IIIa Corylus-Ericales LPAZ
(50-6 cm)
Pinus pollen shows an abrupt decline. Corylus pollen
values rise, reaching a maximum value of c. 69% of TLP,
but then its values fall towards the top of the zone
as do those of non-herbaceous taxa, e. g. Alnus, Ulmus
and Quercus. Ericales becomes more significant, almost
throughout, while Gramineae and Cyperaceae start to
increase towards the end.
76
The terminal boundary: Ericales pollen rises.
TH3-IIIb Ericales-Corylus LPAZ
(6-2 cm)
A further rise in total land pollen concentrations and
Ericales values marks this subzone. Corylus pollen is
still the dominant non-herbaceous type, whereas NAP
increases considerably, con tri bu ting up to c. 54% of
TLP.
6.5. A tentative correlation of the local pollen
assemblage zones for the three cores from Thieves'
Hoss
It is suggested that the three cores from Thieves' Moss
provide almost a continuous pollen record from the
Lateglacial Period to the beginning of
2 (Figure 6.5.1.). Even though the profile
from con tamina tion, it appears that
the Flandrian
of TMl suffers
its uppermost
(sub)zone TMl-IId has similar features with the lowermost
zones of TM2, TM2-I and TM2-IIa. It is, however, difficult
to make a direct comparison between TMI-IId and either
of TM2-I and TM2-IIa because TMl-IId presents a mixture
of pollen characters of the main types from each zone.
The possible problems arising from contamination at TMl
and the absence of radiocarbon dates also influence
confident correlation. But, it appears that TMl-IId has
some features of the Younger Dryas Period more similar
to those in TM2-IIa than in TM2-I - lower Juniperus pollen
quantities and more significant Pinus, Caryophyllaceae
and Selaginella.
Another correlation has been made between TM2-IV and
TM3-I. There seem to be similar patterns in the pollen
curves of the zones, bu t higher pollen values of the
major tree taxa - particularly Betula, Quercus and Ulmus
at TM3 than those at TM2 make a direct comparison
difficult. Gradually increasing values of Quercus and
Ulmus in TM2-IV may indicate the beginning of the
TH1 TM2
LPAZ LPAZ
-
. . . TM2-IV .
TM2-IIIb
TM2-IIIa
TM2-IIb
.. TM2-IIa .. .
77
TM3
LPAZ
TM3-IIIb
TM3-IIIa
TM3-lIb
TM3-IIa
TM3-I
Radiocarbon years (BP)
c tlronozone .-
F12
6200±60
672S±70
7830±80 Fll
Devensian
s
TlU-IId . . . . . . TM2-I
TM1-IIb
TM1-llc
Tf<ll-IIa
TM1-I
Figure 6.5.1.
Late
glacial
A ten ta t i ve correlation 0 f the local pollen assemblage zones from Thieves' Moss and the (supposed) equivalent Flandrian chronozones. ( •••••• ) similarity; (------) end of deposition
78
establishment of these thermophilous taxa in the area
in the early stages of Flandrian 1. TM3-I might, on the
other hand, reflect a further expansion of deciduous
trees, corresponding to a later stage of Fl1.
6.6. A reconstruction of the local vegetational succession
at Thieyes' Hoss
Four main phases of development can be distinguished
for the Thieves' Moss site:
1. A lake with fringing swamp,
2. A fen/swamp phase,
3. A raised S12hagnum bog phase,
4. A heathland phase.
1. A lake with fringing swamp
Zones from TM1-I to TM2-IV (and TM3-I)
It appears that a lake occupied the site in the early
stages of development, probably at the close of the Late-
Devensian Glaciation. There is no organic matter preservation in
151 cm. However,
the profile of sampling point TM1
towards the upper part of the
below
basal
clay organiC content gradually increases. In this phase
a community of aquatic plants inhabited the lake,
including microscopic algae, Myrio12hyllum alterniflorum,
M. s12icatum, Nym12haea, Potamogeton-type, TY12ha
angustifolia/S12arganium and T. latifolia-type. The edge
of the basin was probably occupied by a sedge stand with
heliophytes began to assume importance. At this time,
deglaciated raw soils were rich in lime and slope
instability was common.
Very high percentages of particular taxa (e.g. Pinus
and Gramineae) are certainly the result of statistical
artefacts due to very low pollen deposition as seen in
the concentration diagram. Pennington (1970) stresses
the fact that Pinus pollen has been shown to be over
represented in many deposits of periods where local pollen
was sparse. Bartley (1967) reports the presence of Pinus
pollen grains from the surface samples of Arctic Quebec,
in an area some 885 km north of the forest. Where local
pollen production is low, as on ridge tops, the proportion
of coniferous pollen rises up to 16.6% of total pollen.
The low concentration values for Pinus in zones SM4-1
and TMI-I, in particular, indicate that this profilic
pollen producer cannot have been contributing materially
to the regional vegetation and its grains were merely
the product of long-distance transport. Both tree and
dwarf birch (the majority of Betula pollen grains belong
to tree birches) may have been present, but very sparse,
probably in shel tered locali ties. Juniperus and Empetrum
pollen can imply areas of a pioneer shrub-heath, perhaps
including dwarf birch and dwarf willow. The pollen of
Ephedra types (E. distachya and E. ? fragilis) is likely
to have been derived from long-distance dispersal from
the south, as shown by Birks (1973) at the present day.
PHASE 2. Open grassland (a transitional phase)
In the beginning of SM4-II a rise in total pollen
concentration values and organic content of the lake
sediment suggest an increase in biomass
of the ecosystem which resulted
and productivity
in soil humus
accumulation. The vegetation represented by this zone
wi th grasses,
Rumex/Oxyria
sedges, Salix (probably dwarf willow) and
pollen prominent was evidently open. Dwarf
willow in combination with Saxifraga types points to
92
a - light but never heavy snow cover during the winter
(Kolstrup, 1980). This may mean that the climate was
a limiting factor in this early phase of the regional
vegetational succession. However, an increase in the
productivity of aquatic vegetation with Potamogeton might
indicate that the climate was not severely limiting.
The pollen spectra, in fact, seem to represent a
transitional phase in vegetation development and soil
maturation, involving a gradual establishment of juniper
dominated scrub.
PHASE 3. Interrupted Juniperus phase
The beginning of this succeeding phase (SM4-IIIa) records
an initial development of juniper, along with a rise
in birch. But herbaceous taxa, predominantly grasses,
appear to have retained their importance. Salix and Rumex/
Oxyria were present, though there is a marked decline
in the latter. It is probable that the initial development
of juniper was interrupted by a climatic recession during
subzone SM4-IIIb. A drop in juniper pollen is accompanied
by a clay band along with increases in open- and
disturbed-ground taxa including Rumex/Oxyria, Artemisia,
Helianthemum and Thalictrum. The reduction in total land
pollen concentration values is marked, due probably to
a combination of reduced local pollen production and
increased sedimentation rate. It is -difficult to explain
the rise in Betula pollen at the time of the Juniperus
minimum. Betula nana perhaps comprises a reasonable
proportion of birch pollen. But this question will remain
uncertain unless dwarf birch pollen could be separated
quantitatively.
Pollen changes do not indicate major changes in vegetation
(both local and regional) but the presence of clay and
of taxa of open- ground suggest a change in vegetation
which allowed the erosion of mineral soils, i. e. a more
open vegetation with perhaps less scrub and grass.
93
Although the succeeding subzone SM4-IIIc also has abundant
grass pollen, its contrasting pollen flora and sediment
type with those of subzone SM4-IIIb provide strong
evidence for ecological changes. After a temporary
decline, juniper is likely to have colonized the
landscape. Hippophae and Empetrum also played a role
in the' scrub, the latter being less significant. As the
abundance of shrubs intolerant of shade demonstrates
an open landscape with some trees, so the presence of
many light-demanding herbs shows that the shrubs did
not form a complete cover. It seems that the climate
during this subzone became more favourable for
thermophilous juniper and Hippophae than in SM4-IIIa
and SM4-IIIb. According to Iversen (1954) these typical
heliophytes of pioneer woodlands demand a minimum July
temperature above 10 0 e. A rise in juniper and Hippophae
also indicate the presence of the tree-line and the
expansion of woodlands in the following phase when tree
birches spread over much of the region.
PHASE 4. Betula phase
Zone SM4-IV throughout demonstrates great fluctuations
in the birch curve along with the curves for other major
taxa. Pennington (1986) notices the close relationship
between the success of tree birches and the fluctuating
temperatures of the north-European Lateglacial. Tree
birch is generally considered to be sensitive to high
winds and low average temperatures. Sniddle Moss at low
altitude is an exposed site. In the light of these views,
it can be postulated that strong variations particularly
in tree birch values mirror the response of birch woods
to changes in temperature. Fluctuations in maj or taxa
frequencies in SM4-IV make interpretation difficult.
However, the sub zones of this zone chiefly based on birch
pollen values may allow one to draw a general picture
of the vegetation succession in the area during the birch
woodland phase.
--
94
It appears that a woodland dominated by tree Betula
(most Betula pollen are tree birch and the macroscopic
find of ~. pubescens at 278 cm at SM4 makes its presence
certain) developed in the beginning of this phase
(SM4-IVa). The frequent statoblasts of Cristatella mucedo
recovered support this context as .,g,. mucedo is absent
north of the timberline in Europe (Van Geel et al., 1980).
Juniper could have been suppressed due to the fact that
it became shaded out as tree density increased. At the
same time Filipendula assumed an importance in the tall
herb communi ties. This suggests a mean JUly temperature
of not less than 8-9 0 C (Kolstrup, 1979).
The following subzone SM4-IVb suggests that warmth-
demanding birch and Filipendula
and open-ground herbs showed an
in the vegetation cover is,
significantly reflected in the
became less important
expansion. This change
in fact, not very
pollen record and the
sedimentological change from marl to silty organic mud
does not help very much, though it might indicate lower
temperatures.
In subzone SM4-IVc birch and juniper appear to have
behaved in the way that Pennington (1975) suggested " •••
an interplay between birch and juniper wi thin a
fluctuating environment ••• " (p. 163). It is likely that
a temporary decline of birch trees in the previous subzone
introduced conditions in favour of juniper. Thus, juniper
could have penetrated into the open parts of the woodland.
But it would not have been able to flower freely as tree
birches spread widely at the end of this subzone.
Filipendula, on the other hand, became abundant in damper
areas.
It is thought that zone TM2-1 has, in general, similar
pollen features to much of subzone SM4-IVd. Both can
be interpreted as reflecting a transitional phase in
which warmth-demanding species began to decline as the
climate became more severe. This was coupled with an
95
increase in minerogenic material content. Open communities
became established gradually with an abundance of grasses,
sedges, Rumex/Oxyria and Artemisia. At Thieves' Moss
the Tha1ictrum representation is higher than at Sniddle
Moss, while Caryophy1laceae appears to have expanded
earlier at Sniddle Moss than at Thieves' Moss.
PHASE 5. Open grassland with abundant heliophytes
A fall in total land pollen concentration values in zone
SM4-V and subzones TM2-IIa and -lIb suggests a sparse
vegetation cover, although the lower concentration values
may, in part, have resul ted from rapid sediment
accumulation rates due to extensive inwashing of
minerogenic material. The significant reduction in the
thermophilous taxa (Betula, Juniperus, Hippophae and
Fi1ipendu1a) and further dominance of herb communities,
including cold-tolerant species such as Armeria and
Se1aginel1a, support the picture of the onset of climatic
deterioration.
The birch woods of the preceding phase may have contracted
considerably. However, some patches of birch woodland
may have survived in favoured localities, but they were
apparently of a more open nature. A reduced frequency
of Filipendula and Hippophae may indicate summer
temperature maxima somewhat below IOoC. An increase in
Artemisia pollen at both sites is noteworthy. This
increase appears to be a real rise since the
concentrations of this genus are higher in this
phase than in the preceding phase (4), in spite of low
local pollen deposition during the cold period. Iversen
(1954) says that species of Artemisia are usually
associated with dry and frost-disturbed soils. It is
less sensi ti ve to winter temperatures but it does not
to1era te much snow cover. Manley (1959), however, writes
of the local re-estab1ishment of small glaciers, which
must have required precipitation as snow, on Whernside
and Ing1eborough in the last episode of the Lateg1acla1
96
climatic oscillation. An increase in
of Artemisia in the lowlands is not
pollen deposition
so surprising but
in the Thieves' Moss area which is closer to the
re-established small glaciers of the Lateglacial Period
a rise in Artemisia pollen is particularly interesting.
This might be attributed to variations in snow cover,
even within very restricted area, probably related to
topography. Pennington (1980) considers the present
distribution of Artemisia in continental West Greenland.
She says "The parts of the mosaic where Artemisia borealis
grows today in Region 1 are relatively snow-free because
situated either on south-facing slopes or on ridges ••• "
(p. 197). In the Thieves' Moss area on well-drained scree
slopes facing south Artemisia may have assumed some
importance whereas the Ingleborough glaciers were probably
in the Arks above Sunset Hole, facing north.
Local differences in vegetation pattern between the study
areas during this cold phase appear to have been slight
and quanti ta ti ve rather than q uali ta ti ve. Both supported
a mosaic of vegetation types rich in species. In the
Sniddle Moss area Ranunculaceae along with Salix may
have been more significant than in the Thieves' Moss
area. Thalictrum was still more important at Thieves'
Moss than at Sniddle Moss. These small differences can
be at tri bu ted to variations in local en vi ronmen tal
conditions, competition and timing of population change.
97
8.2. Flandrian (Postglacial)
As explained in the Introduction palaeobotanical
investigations already carried out in the region have
provided da ta mainly on Flandrian events. Recent pollen
diagrams with associated radiocarbon dates from lowland
Craven particularly reveal variations in the vegetation.
Bartley et al. (1990) compare the vegetation sequences
from various locali ties in Craven in detail and discuss
the varying roles of climate, soil and human interference.
Swales (1987) gives some information about the
vegetational history of the Ingleborough Massif in
conj unction wi th archaeological evidence and radiocarbon
dates, Hence, a general picture of the Flandrian
vegetation development of the region is available. In
this study, the Flandrian pollen sequences of Sniddle
Moss and Thieves' Moss and the Sunset Hole pollen diagram
are used
to this
to add some complementary and compara ti ve data
picture. A brief account of the regional
vegetational succession with special reference to the
patterns of the Ulmus decline is presented below.
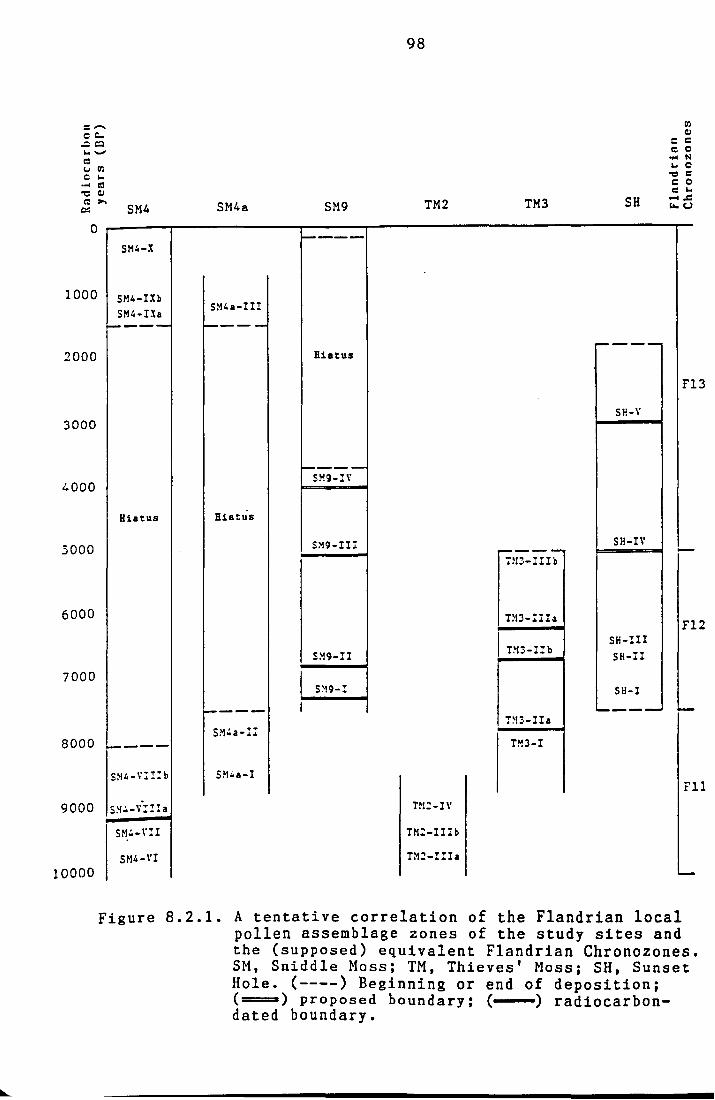
Tentative correlations of the Flandrian local pollen
assemblage zones from the study sites are summarized
in Figure 8.2.1. Sites frequently referred to in the
text are listed in Table 8.2.1.
Flandrian 1
The changes in the pollen curves show that the opening
of the Flandrian Period (c. 10,000 BP) corresponds to
the zones SM4-VI and TM2-IIIa. These curves demonstrate
that a more continuous vegetation cover consisting mainly
of juniper and grasses re-developed in the region. The
Sniddle Moss 4 pollen spectra show that the age of the
juniper maximum dated to 12,020±90 BP at 181 cm (Appendix
1) is too old because of the hard-water effect and it
is discounted. The continuing high values of total
herbaceous pollen in both zones mentioned above support
= ...... cc.. .:c:I w...., r: U fIl C w
.... til '; CU
~.... SM4
o SM4-X
1000 SM4-IXb SM4-IXa
..... ---2000
3000
4000
Hiatus
3000
6000
7000
8000 P-----
5~14-V:!:b
9000 S~l':' - \::!! a
S~14-r:::I
S~14-\'I
10000
SM4a
SM4a-!!!
~---
Hiatus
f-----
5M42-:!
S~14a-I
98
SM9 TM2 TM3
r-.---
Hiatus
f-----5119- IV
Sl19-II:i:
~---':'~13-!IIb
T!1.3-!!!a
S~!9-II I nIS-I!b
I S~19-1 I
!~13-IIa
TM3-I
nl::-Iv
TM:-IIIb
TM::-I!Ia
SH
----
SH-\'
SH-I\'
SH-III
SH-!!
SH-I
----
O'l CJ = C
c::I C ... N w C -cC c C = w .... .c "-u
F 13
-
F 12
~
F 11
L.-
Figure 8.2.1. A tentative correlation of the Flandrian local pollen assemblage zones of the study sites and the (supposed) equivalent Flandrian Chronozones. SM, Sniddle Moss; TM, Thieves' Moss; SH, Sunset Hole. (----) Beginning or end of deposition; (====) proposed boundary: ( ) radiocarbon-dated boundary.
Table 8.2.1. Sites frequently referred to in the text.
SITE ALTITUDE AUTHOR and DATE (MSL)
Helwith Moss (Ingleborough) 244 m Gosden 1963
Allotment Shooting Box (Ingleborough) 434 m
Arks (Ingleborough) 533 m
Braithwaite Wife Hole (Ingleborough) 354 m
Simon Fell (Ingleborough) 617 m
Tarn Moss (Malham, Craven) 381 m
Eshton Tarn (Lowland Craven) 144 m
Linton Mires (Lowland Craven) 190 m
Threshfield Moor (Lowland Craven) 282 m
White Moss (Lowland Craven) 190 m
Swales 1987
Swales 1987
Swales 1987
Swales 1987
Pigott & Pigott 1959 and 1963
Jones 1977; Bartley et a!. 1990
Jones 1977; Bartley et a!. 1990
Jones 1977; Bartley et a!. 1990
Jones 1977; Bartley et a!. 1990
\0 \0
100
the idea that the previous vegetation was only partially
replaced by pioneer woodland (open woodland). Many taxa
common during the preceding zones declined or disappeared
(e.g. Artemisia and Hippophae). However, some of the
members of the Lateglacial herbaceous flora such as
Helianthemum, Saxifraga types and Thalictrum persisted
into these zones. Saxifraga oppositifolia and ~. aizoides
are still growing on the limestone cliffs of Ingleborough
(Bartley & Clark, 1979). Penning ton (1964) also reports
the persistence of several Lateglacial herbs from the
Postglacial layers of Red Tarn in Langdale in the Lake
District. She concludes that this was the result of the
continuing active solifluction,
The organic sediments of zone
this implies the presence of
keeping the forest open.
SM4-VI contain clay and
erosion and inwashing of
minerogenic material. The range of species growing around
the study si tes is similar to those indicated by other
site localities, e.g. Arks II on Ingleborough, Ma1ham
Tarn Moss, Linton Mires and Threshfield Moor in the Craven
area. Clearly, there are also variations in the earliest
Flandrian vegetation pattern. For example, grasses appear
to have expanded more widely at Snidd1e Moss in the
boulder clay than at Thieves' Moss on the limestone.
In the succeeding zones SM4-VII and TM2-IIIb tree birches
spread and replaced the juniper-dominated scrub. At this
time both si tes saw the arrival and early expansion of
Corylus, as in much of the Craven area. Hazel may have
formed scrub or woodland in areas that Betula did not
colonize since it is intolerant of heavy shade and does
not flower effectively when light penetration is impaired
(Rackham, 1980). As at the Arks on the north-north-west
side of the Ingleborough Massif, at Thieves' Moss juniper
declines and disappears completely before Cory Ius rises
considerably in the following zone TM2-IV, whereas at
Sniddle Moss it persists into the Corylus-dominated
subzone SM4-Vllla. The coverage of birch woodland at
Thieves' Moss (birch pollen rises up to 80% of TLP) seems
to have been more dense than at Sniddle Moss, so juniper
101
scrub in the Thieves' Moss area may have thinned out
more rapidly due to dense shade cast by birch woods.
It is of special interest that scattered juniper bushes
can be found today on Mough ton, a bou t 1.5 km south-east
of Thieves' Moss.
According to Bartley ~ ale (1990) Pinus migrated into
the region and formed local stands in various parts of
Cra ven, especially on the well-drained limestone soils,
at least as early as 9430 BP. The very early establishment
of the Pinus before the Corylus phase has also been
identified at Helwith Moss situated on the eastern side
of the Ingleborough Massif. Bartley et ale make the point
that the early appearance of pine occurred in climatically
and edaphically fa voura ble sites. In addition to these
variables competition from birch woods may also have
been an important factor in the expansion of Pinus. For
ins tance, in the Thieves' Moss area, only c. 4.5 km from
Helwith Moss, Pinus pollen reaches only up to 20% (TM2-
IIIb). It appears that Pinus was unable to penetrate
into early Postglacial Betula woodland
sufficiently closed forest at Thieves' Moss.
forming a
At Sniddle Moss the last appearance of juniper is dated
at 9130±65 BP. This compares with the dates for the final
disappearance of juniper from the Arks (9240±90 BP) on
the Ingleborough Massif and Din Moss (9270±170 BP) lying
close to the Northumberland-Roxburghshire (Hibbert & Switsur, 1976). The Corylus expansion associated with
the fall in juniper is also synchronous at both Sniddle
Moss and Din Moss and the rational limit of Corylus has
been dated to 9120±170 BP at the latter site. As at
Thieves' Moss, at the Arks juniper declines before Corylus
increases. This trend suggests that hazel expanded later
in the upland areas than in the lowlands of the
Ingleborough Region.
In zones SM4-VIII, TM2-IV and TM3-1 Corylus becomes a
relatively important element of the woodland in the Boreal
102
Period. Although the percentages of Betula pollen decrease
at both sites, the concentrations do not, suggesting
that the' fall in pollen percentage is an artefact of
the percentage method due to the massive expansion of
Corylus pollen. Rackham (1980) says that Cory Ius pollen
dominance is likely to have emanated from Corylus canopy
woodland in the early Flandrian period. Thus in the region
birch and hazel may have been segregated, pro ba bly in
relation to the nutrient status of the soils. The
thermophilo~s Quercus and Ulmus could have gained a
foothold in suitable localities under warmer climatic
conditions,
at first,
landscape,
with Ulmus establishing itself more widely
possibly in better drained parts of the
e.g. at Eshton Tarn. Subzone SM4-Vlllb and
zones SM4a-I and TM3-1 record the arrival and sporadic
occurrence of Alnus. It must have begun to colonize wetter
places. The first appearance of alder at values of at
least 1% is dated to 7830±80 BP at Thieves' Moss 3 (TM
IIa). This date conforms well wi th the beginning of a
continuous curve for Alnus at an estimated date of c.
8000 BP at Crose Mere, Shropshire (Beales, 1980) and
White Moss, Craven.
In subzones SM4-Vlllb and TM3-IIa fluctuations in the
major taxa curves coincide with sedimentological and
consequent hydrological changes in the study site
localities. Additionally, there appear to have been
changes in the woodland cover. This is seen particularly
well in TM3-IIa with a number of conspicuous oscillations
in Pinus and Corylus pollen. These oscillations may point
to an interplay between pine and hazel in the forest.
With the beginning of subzones SM4a-II and TM3-IIb Pinus
assumes importance, after the rise in Corylus, following
the characteristic pattern of the Boreal Period in the
north and the west of England (Beales, 1980). Huntley
and Birks (1983) point out that values of pine pollen
> 25% probably reflect local presence of small areas
of pine in a forested landscape. Therefore. at both
103
Sniddle Moss and Thieves' Moss
to 50% would imply
The
at
maj or expansion
Thieves' Moss.
pine pollen rising up
local stands of pine.
place at 6725±70 BP
the spread of
of pine took
Other evidence from limestone areas
in the region also shows that pine was abundant on
limestone soils, e.g. at Tarn Moss (Malham), Linton Mires
and Threshfield Moor. According to Bennett (1984) such
soils may be too extreme for most deciduous species,
but Pinus syl vestris which is tolerant of such extreme
condi tions, would be favoured. Though Sniddle Moss lies
on poorly-drained soil, high pollen values of pine may
indicate that Pinus was established, perhaps on the slopes
of Newby. It is probable that soils around the Sniddle
Moss area became so dry that it was less favourable
to other trees and pine was able to colonize
Corylus-dominated woodland.
Flandrian 2
In the Atlantic Period the behaviour of Pinus and Alnus
in the study areas varies according to soil type as
described for the lowlands of Craven by Bartley ~ al.
(1990). At Thieves' Moss on drier (limestone) soil pine
declined by 6200±60 BP and it was (first) replaced by
Corylus (TM3-III) with a slight increase in Alnus, whereas
at Sniddle Moss on heavier soil it disappeared earlier,
at 6830±65 BP and Alnus rises to 20% (SM9-II) and then
to 40% or more with the increasing wetness of the Atlantic
Period. The beginning of a continuous curve for Alnus
is dated to 7305±60 BP at Sniddle Moss 9 (SM9-I). At
Thieves' Moss it dates from 7830±80 BP, and it seems
that alder grew very sparsely in the Thieves' Moss area,
for a long time before its main rise associated wi th
the increase in Corylus at c. 6200 BP. Well-drained soils
around Thieves' Moss are unlikely to have become wet
enough for Alnus and there was a long delay before it
increased to significant amounts. At Sniddle Moss in
the boulder clay the major expansion of Alnus, on the
104
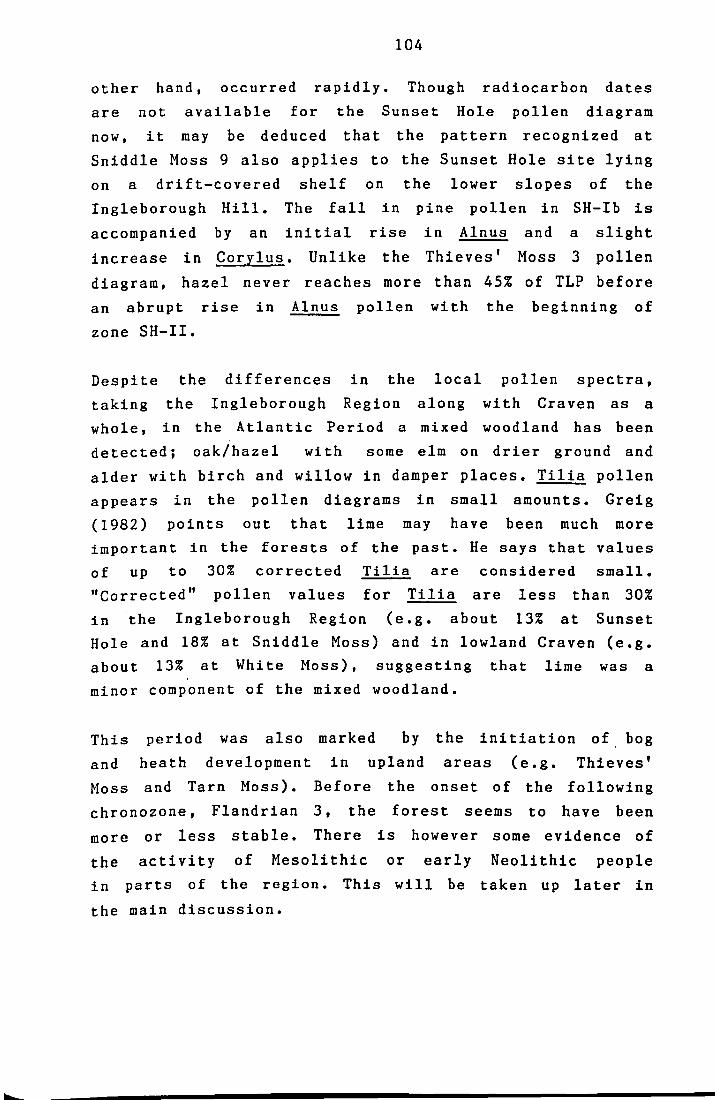
other hand, occurred rapidly. Though radiocarbon dates
are not available for the Sunset Hole pollen diagram
now, it may be deduced that the pattern recognized at
Sniddle Moss 9 also applies to the Sunset Hole site lying
on a drift-covered shelf on the lower slopes of the
Ingleborough Hill. The fall in pine pollen in SH-Ib is
accompanied by an ini tial rise in Alnus and a slight
increase in Corylus. Unlike the Thieves' Moss 3 pollen
diagram, hazel never reaches more than 45% of TLP before
an abrupt rise in Alnus pollen with the beginning of
zone SH-II.
Despite the differences in the local pollen spectra,
taking the Ingle borough Region along wi th Craven as a
whole, in the Atlantic Period a mixed woodland has been
detec ted; oak/hazel wi th some elm on drier ground and
alder with birch and willow in damper places. Tilia pollen
appears in the pollen diagrams in small amounts. Greig
(1982) pOints out that lime may have been much more
important in the forests of the past. He says that values
of up to 30% corrected Tilia are considered small.
"Corrected" pollen values for Tilia are less than 30%
in the Ingleborough Region (e.g. about 13% at Sunset
Hole and 18% at Sniddle Moss) and in lowland Craven (e.g.
a bou t 13% at Whi te Moss), suggesting tha t lime was a
minor component of the mixed woodland.
This period was also marked by the initiation of bog
and heath development in upland areas (e.g. Thieves'
Moss and Tarn Moss). Before the onset of the following
chronozone, Flandrian 3, the forest seems to have been
more or less stable. There is however some evidence of
the activity of Mesolithic or early Neolithic people
in parts of the region. This will be taken up later in
the main discussion.
105
Flandrian 3 (Vegetational history in relation to human
interference)
The beginning of Flandrian 3 is conventionally defined
by the elm decline at a bou t 5000 BP. In this study, the
elm decline could be traced only at Sniddle Moss 9 and
Sunset Hole and it is dated at the former site. At
Thieves' Moss the elm decline is very close to the top
of the sediments and there is the possibility of erosion
and peat cutting. The date of 5050±50 from Sniddle Moss
9 is in good agreement with the dates obtained for the
first fall in elm pollen from other si tes in the region
- Arks I (5030±50 BP), Allotment Shooting Box (5160±60
BP), Eshton Tarn (5010±110) and White Moss (SOS8±100
BP). The pollen diagrams presenting the elm decline from
the site localities will be considered in relation to
changes in vegetation after the first classical elm
decline.
(a) From c. 5000-4000 BP
At Arks I zone AI3 (S030±SO - 3960±SO BP) and at Allotment
Shooting Box zone ASB2 (5160±60 4440±60 BP) are
characterized by a permanent decline in elm pollen
associated with increased representation of Corylus and
indicator species (Plantago 1anceolata, Rumex acetosa/
acetosella-type and Urtica) indicating pastoral farming.
At both sites at the elm decline level, there is a rise
in total pollen influx and concentration values. In zone
Arks .13 major changes in the composition of the woodland
are recorded. These changes include a temporary reduction
in birch and oak trees. At Allotment Shooting Box the
elm decline coincides with a decrease in arboreal pollen
percentages. The succeeding zone ASB3 of the Allotment
Shooting Box site marks a regeneration phase with a sharp
rise in non-herbaceous taxa percentages (up to 70% of
TLP) and a reduced number of clearance indicators. Swales
(1987) regards the increase in elm pollen dated to 4440±60
BP as a slight recovery of Ulmus which lasted c. 790
years. The end of zone ASB3 (3650±60 BP) shows a renewed
106
fall in elm pollen.
Bartley et al. (1990) recognize a series of clearance
phases in the Eshton Tarn zone ET5b, between the elm
decline (5010±10 BP) and the upper boundary of the zone
(3600±100 BP). Plantago lanceolata pollen appears
immediately after the elm decline and cereal pollen first
occurs in considerable amounts at an estimated date of
4500 BP. The same authors describe only low-level
interference in the woodland around Whi te Moss with
high values of non-herbaceous pollen (about 80% of TLP),
occasional grains of Plantago lanceolata and an
interrupted curve for cereal-type pollen (until c. 1470
BP). At Eshton Tarn in the limestone area Corylus appears
to be the dominant pollen type whereas at White Moss
in the boulder clay Alnus assumes greater importance
and Betula is more significant.
The descriptions of vegetational phases whose boundaries
are defined in respect of Ulmus pollen representation
for Sniddle Moss (zone SM9-III) and Sunset Hole (zone
SH-IV) have been given in Chap ters 5 and 7. Here, these
descriptions for each study site are interpreted and
then a brief comparison between the two sites is
presented. It should be emphasized that a proper
comparison can be given when radiocarbon dates are
available for the Sunset Hole site.
SHIDDLE MOSS (Diagrams 5.4.10. and 5.4.11.)
Phase 1. A first elm decline (From 118 cm to 108 cm)
The start of this phase is marked by the first classical
elm decline (dated to 5050±50 BP) at which there is a
rise in total pollen concentration and influx values.
Since total non-herbaceous pollen values (both
rela ti ve and a bsolu te)
pollen values, it
are still higher than herbaceous
may be inferred that openings
were of 1imi ted extent around Sniddle Moss. Both Alnus
and Quercus seem to have been the main elements of the
107
local forest. However, increased representation ofCory1us
reflects higher pollen production, probably due to a
(slightly) more open woodland structure. Tilia and
Fraxinus may also have benefi ted from such small-scale
clearances, possibly on the southern pavements of the
Ingleborough Massif. The first occurrence of Cerea1ia
type and Plantago lanceolata pollen is roughly dated
to 5010 BP. These types along wi th abundant Pteridium
may point to both arable
rise in the frequency of
and pastoral agriculture. A
Cyperaceae, Fi1ipendu1a and
Salix may merely indicate a wetter mire surface.
Phase 2. (From 107 cm to 90 cm)
Ulmus trees seem to have declined considerably by about
4935 BP (estimated) at 107 cm where elm pollen is absent.
Great fluctuations in total pollen influx values might
be the result ·of sedimentological changes rather than
instability in vegetation in this early period of forest
clearance. Abundant birch suggests that this
light-demanding species became important in damper areas.
However, it should be stated here that high percentages
of Betula pollen at 102 cm (47%) and at 104 cm (c. 73%)
are probably due to birch catkins, which also account
for an increase in total pollen influx values. The
occurrence of Cerea1ia-type pollen and other cultural
indicators such as Plantago lanceolata, Succisa and
Pteridium and weeds including Artemisia and Cirsium-type
might be taken as indicative of increased farming
practice. On the mire Fi1ipendula appears to have been
replaced by Melampyrum. Godwin (1975) cites that high
Me1ampyrum pollen frequencies are associated with
disturbance of the vegetation by fire (Mamakowa, 1968).
Since there is no charcoal at or around the Me1ampyrum
maximum levels, as mentioned previously it is probable
tha tit was only an element of a mesotrophic fen-carr
community.
108
Phase 3. A partial recovery of elm (From 88 cm to 76
cm)
A . partial recovery of the elm pollen commencing at 88
cm is dated to 4710±45 BP. At 86 cm total pollen influx
values decline, but elm pollen exhibits a rise, suggesting
a real increase and regeneration of elm trees at c. 4670
BP. However, during this phase elm pollen never fully
recovers nor regains its former proportions. An increase
in . pollen of non-herbaceous taxa and the disappearance
of Cerealia-type and Plantago lanceolata pollen can be
interpreted as the abandonment of agricultural areas.
But frequent Pteridium spores may signify that pastoral
farming continued or at least that there were openings
in the woodland cover, as indicated by the presence of
weeds (e.g. Cirsium-type and Cruciferae).
Phase 4. A secondary fall in elm (From 74 cm to 70, cm)
A secondary elm decline at about 4520 BP, in which other
trees also diminish, can be regarded as a clearance phase.
There is, in fact, nothing to suggest that this represents
a further forest clearance because there is no increase
in cultural indicators and weed species. The rise of
Cyperaceae and corresponding drop in alder pollen may
ha ve been caused by changes in mire hydrology. This may
also be affecting the percentage values of Ulmus.
Phase 5. A renewed recovery of elm (From 66 cm to 26
cm)
A renewed recovery of elm pollen is dated to about 4420
BP at 66 cm. Ulmus never again attains its former values
but it appears to
phase 3, but only
show abetter recovery than that in
for one sample. This is paralleled
by a rise in non-herbaceous taxa pOinting to forest
regeneration. The decline in farming (until almost mid-
phase) might have promoted the expansion of trees such
as birch which regenerates and flowers quickly. Alder
would have colonized damper ground. On drier places.
109
have played a role and
as deterioration
then
in
it was
soil
replaced
fertility
hazel may
by oak,
increased
perhaps
in the Sniddle Moss area. Elm along with ash
and lime probably took some part on base-rich soils upon
the limestone pavements. The absence of most cultural
indicators supports the idea that agricultural land was
abandoned. However, towards the top, a gradual decline
in non-herbaceous taxa and reappearance of Plantago
lanceolata and Cerealia-type pollen and frequent Pteridium
spores may demonstrate that forest destruction started
again, at about 4200 BP.
SUNSET HOLE (Diagrams 7.4.3. and 7.4.4.)
Phase 1. A first elm decline (From 149.5 cm to 144 cm)
The first classical elm decline is recognized at 149.5
cm. Since the elm decline is apparently a synchronous
event for various parts of the Craven District, it is
thought that it may also date from about 5000 BP at the
Sunset Hole site. Other associated changes include a
rise in Corylus. Hazel may have spread into areas
previously occupied by Ulmus. Ilex pollen appears at
147 cm. Woodland of open structure may have facilitated
the establishment and flowering of Ilex. The occurrence
of Cerealia-type pollen in combination wi th other
disturbance-indicator species such as Plantago spp.,
Urtica, Rumex/Oxyria and Pteridium suggests clearance
for pastoral and arable agriculture close to the Sunset
Hole site. There is abundant charcoal in the peat
around the level of the elm decline. Though Ericales
(Calluna) shows a slight increase at this time, its rise
might be taken as an indication of its response to fire
(Odgaard, 1992).
Phase 2. (From 143 cm to 137 cm)
This phase records a further fall in elm pollen and its
absence at 140 cm accompanied by a further rise in Corylus
pollen reaching 50% of TLP. It is likely that hazel became
the dominant species in the woodland. Cultural indicators
110
show the continuation of pastoral farming.
Phase 3.
cm)
A partial
in total
decreased
A partial recovery of elm (From 136 cm to 131
recovery of elm pollen coincides wi th a rise
land pollen concentrations due to either
sedimentation rates or increased pollen
production. The Ulmus curve shows a slight recovery and
it might be postulated that elm trees may have started
to occupy their former places with Corylus gradually
being shaded out by elm trees on the better quality soils.
It is also noteworthy that species associated with various
aspects of man's farming activities become sparse. All
these may suggest a regeneration phase. A fall in both
birch and alder pollen matched by abundant Ericales pollen
might be explained by a change to more heathy, and
presumably drier, condi tions on slopes as well as on
the bog surface.
I
Phase 4. (From 130 cm to 120 cm) and Phase 5. (From 118.5
cm to 60 cm)
These following phases record low values of cultural
indicators and weeds reflecting decreased farming activity
and allowing the forest to recover. During much of phase
4 Ulmus pollen shows a further rise. At this time elm
trees may have expanded in the hazel-dominated woodland.
Again, during phase 4 increased representation of birch
and alder could be connected with wetter conditions in
the vicini ty of the Sunset Hole si te. In the beginning
of phase 5 a considerable rise in elm (up to 5% of TLP)
represents a real increase in elm pollen reaching the
bog. Although there is little evidence of forest clearance
in the Sunset Hole area, a conspicuous rise in ash pollen
along with the presence of Ti1ia and I1ex pollen in phase
5 may suggest their expansion onto limestone pavements.
111
A brief comparison between Sniddle Moss and Sunset Hole:
(a) The general pa t tern of elm pollen changes in phases
1, 2 and 3 seems to be the same at both sites.
(b) The decline of elm in phase 4 at Sniddle Moss may
be correlated with minimum values of Ulmus pollen at
132 cm in SH3 (Sunset Hole - phase 3) and at 122 cm in
SH4 (phase 4).
(c) SHS shows fluctuating values of elm pollen, which
are not as high as at pre-elm decline times, but much
higher than in phase 5 at Sniddle Moss.
(d) Betula and Salix are. temporarily very conspicuous
at Sniddle Moss. It is probable that both taxa assumed
some importance on the damper soils in the Sniddle Moss
area. At Sunset Hole Salix, in particular, is not very
conspicuous. This would be attributed to lack of suitable
soils in the Sunset Hole area.
(e) At Sniddle Moss Fraxinus becomes important after
the elm decline whereas at Sunset Hole it is present
before the elm decline. Later, in phase 5 ash is better
represented at Sunset Hole than at Sniddle Moss. There
is no doubt that ash was more successful on limestone
pavements in the uplands than in the boulder clay in
the lowlands.
(f) The very conspicuous spread of heath at Sunset Hole
could be local and it may partly reflect the elm decline
because of acidification of soils. Unlike Sunset Hole,
the Sniddle Moss site shows little spread of heath. This
may go with the much slighter evidence for forest
clearance in that area.
(g) Melampyrum is more abundant at Sunset Hole than at
Sniddle Moss, suggesting an open woodland in the vicinity
of Sunset Hole.
112
(h) Polypodium is more important at Sniddle Moss than
at Sunset Hole. This may point to denser forest in the
lowlands. To-day Polypodium grows on the ground and on
the branches of oak trees in the damp woods of the
Ingleton Gorges, a short distance from Sniddle Moss
(Bartley, personal communication).
(b) From c. 4000 BP - present day
The growth rate of the uppermost zone of Sniddle Moss
9 (SM9-IV) has been used to estimate the range of the
age for the peat from 26 cm to 14 cm, this being
between c. 3920 BP and 3770 BP (see Figure 5.5.2.). Zone
SM9-IV reveals that on the sampling site and its immediate
surrounding birch carr took over from the alder carr
with conditions becoming more acid. Birch along with
Sphagnum may have colonized the wetter ground while
Ericales (Ca lluna) would have spread over drier areas.
Other trees may have retreated due partly to increased
acidification of soils around the Sniddle Moss site.
There are signs of continuous pastoral farming with
Selected rare * pollen and spore types from SNIDDLE MOSS 9
TAXON
Trees
Fagus
? Populus tremula-type
Herbs
Cladium mariscus
Centaurea nigra-type
Vicia cracca-type
Humulus lupulus-type
Potentilla-type
Sanguisorba minor
S. officinalis
Thalictrum
Epilobium-type
Geranium
Mercurialis
Viburnum
Aquatics
Myriophyllum spicatum
Pteridophytes
Lycopodium
DEPTH (cm)
101
406
438
18,
14
30
100
206
198,
462
100,
438
278
158
30,206,
46, 118
470, 494
398
30
270
* less than 1% of total land pollen
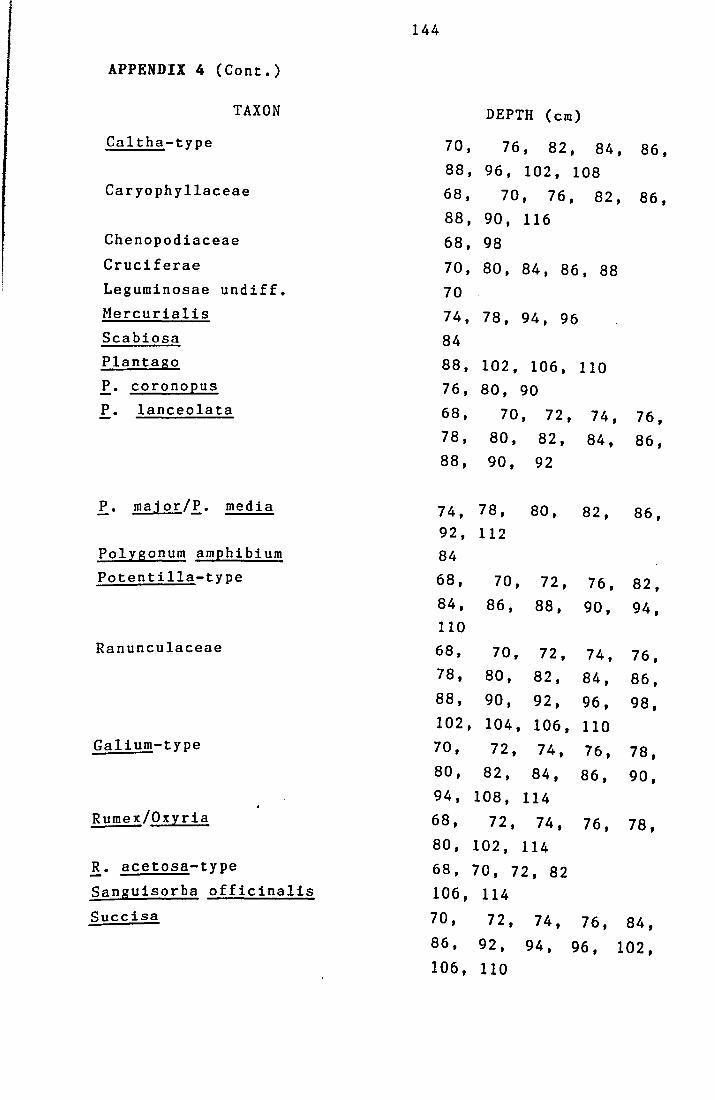
APPENDIX 6
Selected rare pollen and spore
TAXON
Herbs
Epilobium-type
Plantago coronopus
P. maritima
Polygonum aviculare-type
Succisa
Valeriana
Valleriane1la
Viburnum
Viola palustris-type
Aquatics
Myriophyllum verticillatum
Typha latifolia-type
Pteridophytes
Cryptogramma
Eguisetum
Polypodium
147
* types from THIEVES' MOSS 1
DEPTH (em)
122
132
132, 136
145
124, 138
145
134
120, 124
130
120
149
124
126, 130, 134
134
* less than 1% of total land pollen
I
I 148
APPENDIX 7
Selected
MOSS 2 rare pollen and spore * types from THIEVES'
TAXON
Herbs
Cornus sueeica
Epilobium-type
Leguminosae undiff.
Mercurialis
Rumex aquaticus-type
Urtica
Valeriana
Viburnum
Pteridophytes
Polypodium
DEPTH (em)
142, 194
186, 196
196
208
202
126, 130
142
130, 146, 154, 162
126, 178, 186
* less than 0.5% of total land pollen
149
APPENDIX 8
Selected
MOSS 3
rare pollen and spore
TAXON
Herbs
Compositae Tubuliflorae undiff.
Cirsium-type
Compositae Liguliflorae undiff.
Armeria
Epilobium-type
Leguminosae undiff.
Trifolium
Vicia cracca-type
Potentilla-type
Linum catharticum-type
Humulus lupulus-type
Geranium
Thalictrum
Urtica
Valeriana
Viburnum
Aquatics
Myriophyllum verticillatum
Nuphar
Pteridophytes
Lycopodium
L. annotinum
* types from THIEVES'
DEPTH (em)
114
98
2, 18
70, 106
154,
174
2
130
202
2
14
78
198
102
62
202,
198
210
74
154 .
202
210
* less than 0.5% of total land pollen
150
APPENDIX 9
Selected
HOLE
rare pollen and spore * types from SUNSET
Trees
Carpinus
Shrubs
Ilex --Herbs
Achillea-type
Solidago-type
TAXON
Compositae Liguliflorae undiff.
Leguminosae undiff.
Trifolium montanum-type
Vicia-type
V. cracca-type
Caltha-type
Galium-type
Humulus lupulus-type
Droseraceae
Geranium
Mentha-type
Mercurialis
Lonicera
Prunella-type
Sueeisa
Teucrium
Valeriana
Viburnum
Viola palustris-type
DEPTH (em)
131, 155
70, 93.5, 147
144
146, 153, 155, 163.5, 190
64, 250
122, 160, 180, 230, 277
157, 180
49.5, 180
49.5, 180
141
20, 118.5, 260 142, 143
138, 140, 141, 158 128, 230
270
25, 40, 45, 49.5, 120, 149.5
180
145
62, 82, 103
180
230, 250, 270 151, 277
106.5
APPENDIX 9 (Cont.)
TAXON
Aquatics
Hydrocotyle
Myriophyllum spicatum
Potamogeton
Pteridophytes
Equisetum
Lycopodium
Dryopteris-type
151
* less than 2% of total land pollen
99
20
49.5,
146
DEPTH (cm)
70, 99, 136,
78, 115, 135, 151,
152, 153, 154
277
82, 88, 90, 103, 118.5,
156, 161.5, 180, 190, 199
152
APPENDIX 10
Characeae oospores
The oospores of Characeae were abundant in the Lateg1acia1
and early Flandrian deposi ts of both Sniddle Moss and
Thieves' Moss. Consequently, an attempt has been made
to make specific identifications
microscope (LM) and the scanning
(SEM).
by using
electron
the light
microscope
Nomenclature follows Groves and Bullock-Webster (1920
and 1924).
LH study
Some important characters of the fossil oospores were
firstly used to distinguish the two genera, Ni te1la and
Chara. The oospores of Ni tel1a recovered from Snidd1e
Moss (Nitella-type A) and Thieves' Moss (Nitella-type
C) were
Nitella
at the
Nitella
(Tables
compared with the modern oospores of British
species of G. R. Bu110ck-Webster's specimens
herbarium of Leeds University. Type A fitted into
flexilis while type C was determined as !. opaca
1 and 4).
It is assumed that there may have been at least two
species of Chara growing in the former lake in the area
of Sniddle Moss since two morphologically distinct types
(type B1 and B2) have been recovered (Tables 2 .and 3).
Chara oospores found in the profile of Thieves' Moss
were named as type D (Table 5). Although herbarium samples
of various species of Chara have been examined to compare
wi th those from Sniddle Moss and Thieves' Moss it seems
difficult to be certain about the determination under
the LM because the oospores of available material show
great similarity to one another.
SEM study
Recent works show that the
to improve knowledge of the
(e.g. Caceres, 1975; Frame,
& Moore, 1987; John II al.,
153
SEM investigation appears
nature of the oospore wall
1977; Leitch, 1986; John
1990; Leitch et al., 1990).
It also provides taxonomically more important characters
of both modern and fossil representatives of the group
(Characeae) • Therefore, in this study the scanning
electron microscope was employed to understand the exact
structure of the wall of oospores found. The SEM technique
applied is as follows:
After washing in distilled water, selected fossil oospores
were mounted on aluminium stubs with double-sided tape
and coated wi th a gold layer of 50 nm using a POLARON
sputter coater. Photographs were taken using a CAM SCAN
SERIES 3 scanning electron microscope.
Notes on Characeae oospores recovered
Sniddle Hoss
(1) Type A (Table 1; Plate I, Figs 1 and 2)
Nitella flexilis
The SEM study by Frame (1977) demonstrate that in various
forms of modern Nitella flexilis there are highly variable
oospore wall patterns, either smooth, pitted, finely
spongy or scabrous. The comparison between his study
(see Frame, 1977; p. 47; Plate III,' Figs, 19 and 20)
and the SEM photographs of the oospore wall of type A
with spongy pattern allowed for intraspecific
determination and suggested that it is Nitella flexilis
var. flexilis f. flexilis.
(2) Type Bl (Table 2; Plate II, Figs 1 and 2 )
Chara sp. (C. ? aspera)
The SEM photographs of this type were compared with those
of modern Chara oospores in John II a1. (1990). In
154
general, the
nature and
oospore wall of Chara shows a conservative
this makes further determination difficult.
Consequently, the grouping of the Chara taxa based on
the morphology of the outer fossa wall given by John
~ al. (1990) has been considered and type B1 has been
placed in group {I)-B. The group includes Chara aspera,
C. bal tica, C. capensis and C. strigosa characterized
by either relatively
of numerous
smooth or
small pits,
roughened (due to the
pores and depressions) presence
oospore wall
elements on
in the fossa region and low, fused, nodulated
the surface of the ribbon-like structure.
Detailed examination suggests that the fossil type has
some features more similar to Chara aspera than other
species in the group - the fossa wall has pores varying
in size; larger ones range from 0.05-1 pm in diam.
(3) Type B2 (Table 3; Plate III, Figs 1 and 2)
Chara sp.
This type has been placed in group {I)-A-iii (John et
~., 1990) whose members (Chara cora1lina, C. desmacantha
and C. rusbyana) have pusticular projections and low
domes wi th or wi thout an opening on the fossa wall. It
resembles Chara rusbyana (see John ~ al., 1990; Fig.
51) and the fossil oospores recovered by John Foster
from deposits about 25,000 years old found near Hatfield
(Hertfordshire) (D. M. John & J. A. Moore, personal
communication). Chara rusbyana is unknown in Britain
and mainland Europe.
Thieves' Hoss
(4) Type C (Table 4; Plate IV, Figs 1 and 2)
Nite1la opaca
The taxonomic posi tion of modern Ni tel1a opaca and its
relationship with N. flexi1is are still controversial
since they display a range of morphological characters
tha t could fall wi thin both taxa (Moore, 1986). When
only oospore features are taken into consideration,
Nitella opaca has smaller oospores than N. flexilis
155
(Groves & Bullock-Webster, 1920). In this study, it was
possi ble to distinguish Ni tella oospores (type C)
recovered from Thieves' Moss from those (type A) found
in the profile of Sniddle Moss under the binocular
microscope type
than type A. The
also displays a
C being smaller and more compressed
oospore wall of type C (Nitella opaca)
different character under the SEM
there are very small granules and pits giving a roughened
surface.
(5) Type D (Table 5; Plate V, Figs 1 and 2)
Chara vulgaris
The specific determination of this type is based on the
comparison with the outer wall structure of Chara vulgaris
specimens seen with the SEM (see John ~ al., 1990; Figs
60-62) - granules or papillae in the fossa region, their
number being five along a 10 pm wid th across the fossa;
low, fused nodular elements on the surface of the ribbon
like structure.
Palaeoecological significance of fossil Characeae at the
study sites
Snidd1e Moss
Characeae oospores appear to be more abundant in the
uppermost part of the lower lake clay than in overlying
and underlying sediments. The types recovered may have
been the pioneering elements in the newly created lake
of the Sniddle Moss site in the beginning of the
Lateglacial Period. Later, they may have been replaced
by aquatic angiosperms as climate showed further
improvement. However, the presence
in the upper Lateglacial and early
of their oospores
Flandrian sediments
suggests that these types may have continued to assume
some importance in the aquatic vegetation.
Nitella flexilis tolerates a wide range of pH levels
156
while Chara aspera demands a pH range of c. 6 to 9 (Moore,
1986) • Nitella flexilis oospores were found together
with Chara-type B1 (C. ? aspera) at various depths of
the Sniddle Moss lake. This may indicate that the pH
level of the lake was not below 6.
Chara-type B2 which is thought to resemble C. rusbyana
would be regarded as an extinct type in Britain. It may
have been highly sensitive to local and environmental
changes.
Thieyes' Hoss
Since only a part
sediments could be
of contamination-free Lateglacial
extracted from the sampling point
TM2, it is now impossible to draw a complete picture
of the (La teglacial) aquatic vegetational history,
including charophytes. It is however noteworthy that
in minerogenic sediments (the upper lake clay) Ni tella
opaca is the dominant type whereas Chara vulgaris oospores
become abundant in the organic mud of the early Flandrian
Period. A similar pattern has been reported by several
authors (e.g. Vasari & Vasari, 1968; Berglund &
Digerfeldt, 1970; Birks & Mathewes, 1978) worked on the
Lateglacial sites, though there is no specific
determination for Chara in these papers.
Nitella opaca grows
conditions.
in diverse habitats under a wide
range of Langangen (1974) says that this
species shows optimal development in
characterized by low production and
in Norway. During the Younger Dryas
(Lobelia) lakes,
dense charophytes,
Period, a decline
in vigorous aquatic angiosperms may have created
conditions favourable for Nitella opaca. Thus it may
have flourished the former lake of the Thieves' Moss
si te, even it may have formed almost a pure charophyte
community. With the climatic improvement, Chara vulgaris
seems to have replaced Ni tella opaca. Ei ther competi tion
or nutrient status of the lake, or both, would have been
157
of great importance in the expansion of Chara vulgaris.
Conclusion
Ecological information available
help in the palaeoecological
Characeae oospore types found
appears to be of little
interpretation of some
in deposits of Snidd1e
Moss and Thieves' Moss. Further ecological studies of
this group, possibly involving detailed analysis of
chemistry and other features of lakes, are essential.
These might help pa1aeoeco10gists to draw more definite
conclusions. This study presents a limited
palaeoecological interpretation but it may be a part
of an index for fossil Characeae oospores in Quaternary
deposits.
References (for Appendix 10)
Berglund B. E. & Digerfe1dt G. (1970) "A palaeoecological
study of the Late-Glacial lake at Torreberga Scania,
South Sweden", Oikos, 21, 98-128.
Birks H. H. & Mathewes R. W. (1978) "Studies in the
vegetational history of Scotland", New Phyto10gist,
80, 455-484.
Caceres E. J. (1975) "Novedades Caro10gicas Argentinas
I. Una Nueva Especie de Ni te1la y tres Adiciones
a1 Genero Para La Flora Argentina", Kurtziana, 8,
105-125.
Frame P. (1977) "Fine Structural Studies of Oospore
Ornamentation and Bu1bi1 Development in Charophytes",
PhD ThesiS, University of Toronto.
Groves J. & Bullock-Webster G. R. (1920) "The Bri tish
Charophyta Volume I Nite11eae", Ray Society, London.
158
Groves J. & Bullock-Webster G. R. (1924) "The British
Charophyta Volume II Chareae", Ray Society, London.
John D. M. & Moore J. A. (1987) "An SEM study of the
oospore of some Nitella species (Charales,
Chlorophyta) with descriptions of wall ornamentation
and an assessment its taxonomic importance",
Phycologia, 26/3, 334-355.
John D. M.,· Moore J. A. & Green D. R. (1990) "Preliminary
observations on the structure and ornamentation
wall in Chara (Charales, of the oosporangial
Chlorophyta)", British
1-24.
Phycological Journal, 25,
Langangen A. (1974) "Ecology and distribution of Norwegian
charophytes", Norwegian Journal of Botany, 21, 31-
52.
Leitch A. R. (1986) "Studies on Living and Fossil
Charophyte Oosporangia", PhD TheSis, University
of Bristol.
Leitch A. R., John D. M. & Moore J. A. (1990) "The
oosporangium of the Characeae (Chlorophyta,
Charales)", (In "Progress in Phycological Research",
Vol. 7, ed. by F. E. Round & D. J. Chapman), pp.
213-268. Biopress Ltd.
Moore J. A. (1986) "Charophytes of Great Bri tain and
Ireland", Botanical Society of the British Isles,
London, No 5.
Vasari Y. & Vasari A. (1968) "Late- and
macrophytic vegetation in the lochs
post-glacial
of northern
Scotland", Acta Botanica Fennica, 80, 4-120.
'fable 1. Some characters' of Nitella (type A) oospore from Sniddle Moss under the LM and SEM and their comparison wi th the records of earlier workers on Nitella flexilis.
Groves & Bullock-Webster Frame Nitella (type A) LM
Some characters
LPA (Length of ~he polar axis)
LED (Largest equatorial diameter)
Shape
AND (Anisopolar distance: distance from the apical pole to the largest equatorial diameter)
ANI (Anisopolar index: AND/LPAdOO)
The maximum width of the segmented basal pore
The number of convolutions of the fassules (in lateral view)
The number of convolutions of the spirals (in lateral view)
Ornamentation on the fossa wall
(1920) Nitella flexilis
500-575 pm
425-500 pm
5-7
(1977 ) Nitella flexilis
Highly variable: smooth, pitted, finely spongy or scabrous
(pm)
520-640
450-520
Subpralate
300
53 (Ellipsoidal)
80-140
6-7
6-7
verrucatereticulate
SEM
spongy with mesh size c. 1.2 p.
...... l/1 \0
Table 2. Some characters of Chara (type B1) oospore from Sniddle Moss under the LM and SEM and their comparison with the records of earlier workers on Chara aspera.
Some characters Groves & Bullock-Webster
(1924) John et al.
(1990-) Chara (type Bl) LM SEM
LPA LED
Shape AND ANI
The height of the basal claw
The maximum width of the pore
The number of convol. of the fossules
The number of the spirals
Ornamentation on the fossa wall
Surface of the ribbon
The width of the ribbon
* excluding basal cage
Chara aspera
400-600 pm 250-375 pm
12-14
Chara aspera
roughened
(pm)
664-840 633 430-550
Perprolate 300-400 333
44 (Ellipsoidal)
40-100
100-160
12-13
12-14
".
roughened (pits and pores)
low, fused nodulated elements
c. 20 pm
low t fused t
nodulated elements c. 30
..... Q\ o
Ta ble 3. Some characters of Chara (type B2) oospore from Sniddle Moss under the LM and SEM.
Some characters
LPA LED
Shape
AND ANI The height of the basal claw
The maximum width of the pore
The number of convol. of the fossules
The number of the spirals
Ornamentation on the fossa wall
* including basal claws
LM (pm)
620-700 320-390
Prolate
300-360
SEM (pm)
* 770
50 (Ellipsoidal)
20-50 60
100-120
12-14
13
Foveolate Low pustular elevations with pores
~
0'1 ~
Table 4. Some characters of Nitella (type C) oospore recovered from Thieves' Moss under the LM and SEM and their comparison with the records of Groves & Bullock-Webster (1917) on Nitella opaca.
Some characters
LPA LED Shape
AND ANI
The numb. of convol. of the fossules
The numb. of convol. of the spirals
Ornamentation on the fossa wall
Groves & Bullock-Webster
(1920)
Nitella opaca
375-425 pm 350-400 pm Spheroidal/broader than long
Nitella (type C)
(Thieves' Moss)
LM (pm) SEM (pm)
420 302 360 258
Subprolate
200 162
48
(Ellipsoidal)
6
7
roughened
..-0'\ N
Table 5. Some characters of Chara (type D) oospore from Thieves t Moss under the LM and SEM and their comparison wi th the records of earlier workers on Chara vulgaris.
Some characters Groves & Bullock-Webster
(1924 ) John et a1.
(1990-) Chara (type D)
LPA LED
Shape AND ANI
The height of the basal claw
The maximum width of the pore
The number of convo1. of the fossules
The number of the spirals
Ornamentation on the fossa wall
Surface of the ribbon
* excluding basal cage
Chara vulgaris Chara vulgaris LM SEM (pm)
* w 425-675 pm 225-400 pm
12-15
630-740 370-550
Prolate
567 367
300-400 300-400 48
(Ellipsoidal)
roughened/granulate
low, fused, nodulated elements
50-70
70
11-14
11-14
granules/ papillae
low, fused nodulated elements
.... 0\ (..)
164
Plate I. Figs 1-2. SEM of Nitella (type A) (Nilclla flexilis) oospore from Sniddle Mo ss (SM9 458-460 em peat). Fig. 1. Oospore in lateral view. Fig. 2. Fossa wall showing s pongy ornamentation .
165
Plate II. Figs 1-2 . SEM of Chara (typ B1) (Char ?
aspera) oospore from Sniddle Mo ss (SM6 217-219 m - marl ). Fig. l . Oospore with some debri s in lateral vj w. P"g.2. Surface o[ the fossa wall covered by num ero us pit s , por es (arrowed) and depre ssio ns and broken ribbon s hroudin g the fossa wall; note the dif fe rence in the nature of its surface compared to the adjacent wall area (fo ssa ).
166
Plate III. Figs \-2 . SEM or Char (type B2) oospore from Sniddle Moss (SM3 226-228 cm - marl). ~ig. l. Oospore with basal claws (arrowed) in later 1 view. Fig.2. Oospore wall showing low pustular 1 vations wiLh perforations extending towards Lhe lower par of th ridge (arrowed).
167
Plate IV. Figs 1-2 . SEM of Nit l1a CLype C) CNLL 11 opaca) oospore from Thiev s ' Moss (TM2 204 . 5-205 . 5 m _ organic clay). Fig.l . Oospore with some debri s in lateral view. Pig .2. Fossa wall roughened du La presence of very small granules and piLS.
168
Plate V. Figs 1-2 . SEM of Chara (type D) (Chara vulgaris) oospore from Thieves' Moss (TM2 184 em - org ' nic mud). Fig. l . Oospore in lateral view. Fig.2 . Fossa wall COy r d by irregularly shaped projections and s urfac e of he ribbon showing a dense covering of low, fused nodular clem n s .
169
References
Arthurton R. S., Johnson E. W. & Mundy D. J. C. (1988)
"Geology of the country around Settle", BGS (British
Geological Survey), London.
Atkinson T. C., Briffa K. R. & Coope G. R. (1987)
"Seasonal temperatures in Britain during the past
22,000 . years, reconstructed using beetle remains",
Nature, 325, 587-592.
Barra t t B. C. (1960 ) "An in ves tiga tion of the morphology
and development of some grassland humus forms",
PhD Thesis, University School of Agriculture, King's
College, University of Durham.
Bartley D. D. (1962) "The stratigraphy and pollen analysis
of lake deposits near Tadcaster, Yorkshire", New
Phytologist, 61, 277-287.
Bartley D. D. (1967) "Pollen analysis of surface samples
of vegetation from Arctic Quebec", Pollen et Spores,
9, 101-105.
Bartley D. D. & Clark S. C. (1979)
of the Ing1eborough", S.S.S.I.,
Industrial Services Ltd. (ULIS),
"A vegetation survey
Uni versi ty of Leeds
Leeds.
Bartley D. D., Jones I. P. & Smith R. T. (1990) "Studies
in the Flandrian vegetational history of the Craven
District of Yorkshire: The lowlands", Journal of
Ecology, 78, 611-632.
Bartley D. D. & Morgan A. V. (1990) "The palynological
record of the King's Pool, Stafford, England", New
Phytologist, 116, 177-194.
170
Beales P. w. (1980) "The Late Devensian and Flandrian
vegetational history of Crose Mere, Shropshire",
New Phytologist, 85, 133-161.
Becket t S. C. (1981) "Pollen diagrams from Holderness,
North Humberside", Journal of Biogeography, 8, 177-
198.
Beijerinck W. (1947) "Zadenatlas Der Nederlandsche Flora",
H. Veenman & Zonen, Wageningen.
Bellamy D. J., Bradshaw M. E., Millington G. R. &
Simmons I. G.· (1966) "Two Qua ternary deposi ts in
the Lower Tees Basin", New Phytologist, 65, 429-442.
Bennett W. (1936) "Giants' Graves, Pen-y-Ghent", The j
Yorkshire Archaeological Journal, 33, 318-319.
Bennett W. (1938) "Iron Age Settlements'in Penigent Gill",
The Yorkshire Archaeological Journal, 34, 413-419.
Bennett K. D. (1983) "Devensian Late-glacial and Flandrian
vegeta tional history at Hockham Mere, Norfolk,
England", New Phytologist, 95, 457-487.
Bennet t K. D. (1984) "The Post-glacial history of Pinus.
sylvestris in the British Isles", Quaternary Science . Reviews, 3, 133-155.
Berggren G. (1969) "Atlas of Seeds, Part 2, Cyperaceae",
Swedish Natural Science Research. Council.
Berggren G. (1981) "Atlas of Seeds, "art 3, Salicaceae
Cruciferae" Swedish Museum of Natural History.
Birks H. J. B. (1965) "Late-glacial deposits at Bagmere,
Cheshire and Chat Moss, Lancashire", New Phytologist,
64, 270-281.
171
Birks H. J. B. (1973) "Past and Pres en t Vegetation of
the Isle of Skye A Palaeoecological Study",
Cambridge University Press, Cambridge.
Birks H. J. B. (1990) "Late-Quaternary biotic changes
in terrestrial and
particular
"Handbook
reference
lacustrine environments,
to north-west Europe",
with
(In
of Holocene Palaeoecology and
Palaeohydrology", ed.
John Wiley & Sons Ltd.
by B. E. Berglund) pp. 3-65.
Bjorck S., Berglund B. E. & Digerfeldt G. (1988) "New
aspects on the deglaciation chronology of south
Sweden", Geographica Polonica, 55, 37-49.
Broecker W. S., Andree M., Bonani G., Wolfli W., Oeschger
H. & Klas M. (1988) "Can the Greenland climatic
jumps be identified in records from ocean and
land ?", Quaternary Research, 30, 1-6.
Bullock P. (1964) "A study of the origin and development
of soils over Carboniferous Limestone in the Malham
District of Yorkshire",
of Leeds.
MSc TheSiS, University
Bullock P. (1971) "The soils of the Malham Tarn Area",
Field Studies, 3, 381-408.
Clapham A. R., Tutin T. G. & Moore D. M. (1989) "Flora
of the British Isles", 3rd ed., Cambridge University
Press, London.
Coesel P. F. M. (1979a) "Desmids 0 f the broads area
of N. W. Overjissel (The Netherlands) I", Acta
Botanica Neerlandica, 28, 257-279.
Coesel P. F. M. (1979 b) "Desmids of the broads area
of N. W. Overjissel (The Netherlands) II", Acta
Botanica Neerland1ca, 28, 385-423.
172
Conway
of
V. M. (1954) "Stratigraphy
Southern Pennine blanket
and pollen analysis
peats", Journal of
Ecology, 42, 117-147.
Coope G. R. (1977) "Fossil coleopteran
sensitive indicators of climatic
the Devensian (Last) cold stage",
Transactions of the Royal Society
280, 313-340.
assemblages as
changes during
Philosophical
of London B,
Crompton A. (1961) "A brief account of the soils of
Yorkshire" I Journal of Yorkshire Grassland Society,
3, 27-35.
Cunliffe B. (1978) "Iron Age communities in Britain",
Routledge & Kegan Paul, London & Boston.
Dickson J. H. (1973) "Bryophytes of the Pleistocene.
The British record and its chronological and
ecological implications", Cambridge University Press,
London.
Dixon H. N. (1954) "The Students Handbook of British
Mosses", Sumfield & Day Ltd.
Dunham K. C.,
Wilcockson
Hemingway J.
W. H. (1953)
E. Versey H. C. &
"A guide to the geology
of the district round Ingleborough", Proceedings
of the Yorkshire Geological Society 29, 77-115.
Edwards K. J. (1988) "The hunter-gatherer/agricultural
transition and the pollen record in the British
Isles", (In "The Cultural Landscape - Past, Present
and Future", ed. by H. H. Birks, H. J. B. Birks,
P. E. Kaland & D. Moe) pp. 255-266. Cambridge
University Press.
Edwards K. J. (1990) "Fire and Scottish Mesolithic:
evidence from microscopic charcoal", (In
173
"Contributions to the Mesolithic in Europe", edt
by P. M. Vermeersch & P. Van Peer) pp. 71-79.
Leuven University Press, Leuven.
Edwards K. J. & Hirons K. R. (1984) "Cereal pollen grains
in pre-elm decline deposits: Implications for the
earliest agriculture in Britain and Ireland", Journal
of Archaeological Science, 11, 71-80.
Edwards K. J. & MacDonald G. M. (1991) "Holocene
palynology: II
change", Progress
391.
human influence and vegetation
in Physical Geography, 15, 364-
Ed wards K. J. & McIntosh C. J. (1988) "Improving the
detection rate of cereal-type pollen grains in Ulmus
decline and earlier deposits from Scotland", Pollen
et Spores, 30, 179-188.
Edwards K. J. & Thompson R. (1984) "Magneti~
palynological and radiocarbon correlation and dating
comparisons in long cores from a Northern Irish
lake", Catena, 11, 83-89.
Faegri K. & Iversen J. (1989) "Textbook of Pollen
Analysis", (IV Edition by K. Faegri, P. E. Kaland
& K. Krzywinski), John Wiley & Sons.
Garbett G. G. (1981) "The elm decline: the depletion
of a source", New Phytologist, 88, 573-585.
Gilks J. A. (1973) "The Neolithic and early Bronze Age
pottery from Elbolton Cave, Wharfedale", The
Yorkshire Archaeological Journal, 45, 41-54.
Gilks J. A. (1981) "Ingleton, Ra venscar Cave, SD 730757"
in "Yorkshire Archaeological Register: 1981", The
Yorkshire Archaeological Journal, 54, 171-172.
174
Gilks J. A. & Lord T. (1985 ) "A late Neoli thic crevice
burial from Selside, Ribblesdale, North Yorkshire",
The Yorkshire Archaeological Journal, 57, 1-5.
Godwin, H. (1975) "History of the British Flora",
Cambridge University Press.
Gosden, M. S. (1965) "An investigation in to the origin
and nature of some organic deposits of the
Ingleborough Region", PhD Thesis, University of
Leeds.
Gray J. M. & Lowe J. J. (1977) "The Scottish Late Glacial
environment: a synthesis" (In "Studies in the
Scottish Lateglacial environment", ed. by J. M. Gray & J. J. Lowe) pp. 163-181. Pergamon Press,
Oxford.
Greig J. (In
ed.
(1982) "Past and present lime woods of Europe",
"Archaeological Aspects of Woodland Ecology", by M. Bell & S. Limbrey) pp. 23-55. Symposia
of the Association for Environmental Archaeology
No.2 BAR International Series 146.
Groenman-van Waateringe W. (1983) "The early agricultural
utilization of the Irish landscape: the last word
on the elm decline 7", British Archaeological Report
British Series, 116, 217-232.
Hi b bert F. A. & Swi tsur V. R. (1976) "Radiocarbon dating
of Flandrian pollen zones in Wales and Northern
England", New Phytologist, 77, 793-807.
Hirons K. R. & Edwards K. J. (1986) "Events at and around
the first and second Ulmus declines: Palaeoecological
investigations in Co. Tyrone, Northern Ireland",
New Phytologist, 104, 131-153.
175
Hirons K. R. & Edwards K. J. (1990) "Pollen and related
studies at Kinloch, Isle of Rhum, Scotland, with
particular reference to possible early human impacts
on vegetation", New Phytologist, 116, 715-727.
Huntley B. & Birks H. J. B. (1983) "An Atlas of Past
and Present Pollen Maps for Europe: 0-13000 years
ago", Cambridge University Press, Cambridge.
Hybroek, H. M. (1963) "Diseases and lopping for fodder
as possible causes of a prehistoric decline of
Ulmus", Acta Botanica Neerlandica, 12, 1-11.
Iversen J. (1954) "The Late-glacial flora of Denmark
and its relation to climate and soil", Danmarks
Geologiske Underspgelse, II, 80, 87-119.
Iversen, J. (1956) "Forest clearance in the Stone Age",
Scientific American, 194, 36-41.
Iversen, J. (1973) "The development of Denmark's nature
since the 'last-glacial" , Danmarks Geologiske
Unders~gelse, V, 7-C, 126 pp., Copenhagen.
Jacobi R. M., Tallis J. H. & Mellars P. A. (1976)
"The southern Pennine Mesolithic and the ecological
record", Journal of Archaeological Science, 3, 307-
320.
Jessen K. (1955) "Key to subfossil Potamogeton", Botanisk
Tiddskriff, 52, 1-6.
Jones I. P. (1977) "Studies in the Flandrian vegetational
history of the Craven District of Yorkshire", PhD
Thesis, University of Leeds.
Jones R. L. (1977) "Late Devensian deposits from Kildale,
Northeast Yorkshire", proceedings of the Yorkshire
Geological Society, 41, 185-188.
I 176
Katz N. Ja., Katz S. V. & Kipiani M. G. (1965) "Atlas
and Keys of fruits and seeds occuring in the
Quaternary Deposits of the USSR", Moscow.
Keen D. H., Jones R. L., Evans R. A. & Robinson J. E.
(1988) "Faunal and floral assemblages from Bingley
Bog, West Yorkshire, and their significance for
Late Devensian and early Flandrian environmental
changes", Proceedings of the Yorkshire Geological
Society, 47, 125-138.
Kendall P. F. & Wroot
Yorkshire", Vienna.
H. E. (1924) "The Geology of
King A. (1969) "A study of early settlement in Upper
Ri b blesdale and adj acen t uplands", MA Dissertation,
University of Liverpool.
King A. (1970) "Early Pennine settlement", Dalesman,
Clapham.
King A. (1978a) "Apron Full of Stones, a prehistoric
cairn, Thornton in Londsdale, North Yorkshire",
The Yorkshire Archaeological Journal, 50, 25-30.
King A. (1978b) "Gauber High Pasture, Ribblehead - an
interim report", (In "Viking Age York and the North"
ed. by R. A. Hall) pp. 21-25. CBA Research Report,
No. 27.
Kolstrup E. (1979) "Herbs as July tempera ture indica tors
for parts of the pleniglacial and Late-glacial in
the Netherlands", Geologie En Mijnbouw, 58(3),
377-380.
Kolstrup E. (1980) "Climate and stratigraphy in
northwestern
b.p., \¥ith
Mededelingen
Europe
special
R1jks
between 30,000 b.p. and 13,000 reference to the Netherlands",
Geologische Dienst, 32-15,
I
177
181-253.
Korber-Grohne U. (1964) "Probleme der kustenforchung
im sudlichen nordseege biet. 7. Bestimmungsschlussel
fur subfossile. Juncus-Samen und Graminen-Fruchte",
Hildesheim: August Lax.
Leeder M. R. (1982) "Upper Palaeozoic basins of the
British Isles Caledonide inheritance versus
Hercynian plate margin processes", Journal of
Geological Society, London, 139, 479-491.
Lockwood J. G. (1967) "Climate", (In "Leeds and its
region", ed. by M. W. Beresford & G. R. J. Jones)
pp. 30-43. Bri tish Association for the Ad vancement
of Science. Leeds Local Executive Committee.
Longworth I. (1965) "Yorkshire", Cory, Adams & Mackay.
Lotter A. F., Eicher U., Siegenthaler U. & Birks H. J.
B. (1992) "Late-glacial climatic oscillations as recorded in Swiss lake sediments", Journal of
Quaternary Science, 7(3), 187-204.
Lowe J. J. & Gray J. M. (1980) "The stratigraphic
subdivision of the Lateglacial of North-west Europe"
(In "Studies in the Lateglacial of Northwest Europe",
ed. by J. J. Lowe, J. M. Gray & E. Robinson) pp.
157-175. Pergamon Press, Oxford.
Lowe J. J. & Lowe S. (1989) "Interpretation of the pollen
stratigraphy of Late Devensian Lateglacial and early
Flandrian sediments at Llyn Gwernan, near Cader
Idris, North Wales", New Phytologist, 113, 391-408.
Lowe J. J. & Walker M. J. C. (1986) "La teglacial and
early Flandrian environmental history of the Isle
of Mull, Inner Hebrides", Transactions of the Royal
Society of Edinburgh: Earth Science, 77, 1-20.
178
Mangerud J., Andersen S. Th., Berglund B. E. & Donner
J. J. (1974) "Quaternary stratigraphy of Norden,
a proposal for terminology and classification",
Boreas, 3, 109-126.
Manley G. (1957) "The climate at Malham Tarn", Field
Manley G. (1959) "The late-glacial climate of North-west
England", The Liverpool and Manchester Geological
Journal, 2, 188-215.
Megaw J. V. S. & Simpson D. D. A. (1979) "Introduction
to British prehistory", Leicester University Press.
Mellars P. A. (1976) "Fire, ecology, animal po pula tions
and man; a study of some ecological relationships
in prehistory" , Proceedings of the Prehistoric
Society, 42, 15-46.
Moore P. D. (1984) "Hampstead Heath clue to historical
decline of elms", Nature, 312, 103.
Moore P. D., Webb J. A. & Collinson M. E. (1991) "Pollen
Analysis", second edi tion, Blackwell Scientific
Publications.
0' Connell M. (1980) "The developmental history of Scragh
Bog, Co. Westmeath and the vegetational history
of its hinterland", New Phytologist, 85, 301-319.
Odgaard B. V. (1992) "The fire history of Danish heathland
areas as reflected by pollen and charred particles
in lake sediments", The Holocene, 2, 3, 218-226.
Peglar S. M. (1993) "The mid-Holocene Ulmus decline at
Diss Mere, Norfolk, UK: a year-by-year pollen
stratigraphy from annual laminations", The Holocene,
3, 1, 1-13.
179
Pennington W. (1964) "Pollen analysis from the deposits
of six upland tarns in the Lake District",
Philosophical Transactions of the Royal SOCiety
London B, 248, 205-244.
Pennington W. (1970) "Vegetation history in the north
west of England: a regional synthesis", (In "Studies
in the vegetational history of the British Isles",
ed. by D. Walker & R. G. West) pp. 141-158. London:
Cambridge University Press.
Pennington W. (1975) "A chronostratigraphic comparison
of Late-Weichselian and Late-Devensian subdivisions,
illustrated by two radiocarbon-dated profiles from
western Britain", Boreas, 4, 157-171.
Pennington W. (1977) "The Late Devensian flora and
vegetation of Britain", Philosophical Transactions
of the Royal Society of London B, 280, 247-271.
Pennington W. (1980) "Modern
and the interpretation
British Late-Glacial
Phytologist, 84, 171-201.
samples from west Greenland
of pollen data from the
(LATE DEVENSIAN)", New
Pennington W. (1986) "Lags in adjustment of vegetation
to climate caused by the pace of soil development:
evidence from Britain", Vegetatio, 67, 105-118.
Pennington W. (1991) "Palaeolimnology in the English
lakes - some questions and answers over fifty years",
Hydrobiologia, 214, 9-24.
Pennington W. & Lishman J. P. (1971)" Iodine in lake
sediments in Northern England
Biological Reviews, 46, 279-313.
and Scotland",
Perry I. & Moore P. D. (1987) "Dutch elm disease as
an analogue of Neolithic elm decline", Nature,
180
326, 72-73.
Pigott M. E. & Pigott C. D. (1959) "Stratigraphy and
pollen analysis of Malham Tarn and Tarn Moss", Field
Studies, 1, 1-18.
Pigott C. D. & Pigott M. E. (1963) Late-glacial and Post-
glacial deposits at Malham,
Phytologist, 62, 317-334.
Yorkshire", New
Pun t W. & Malotaux M. (1984) "Canna baceae, Moraceae and
Urticaceae" (In "The Northwest European Pollen Flora
IV", ed. by W. Punt & G. C. S. Clarke) pp. 23-
44. Elsevier.
Rackham o. (1980) "Ancient Woodland: its history,
vegetation and uses in England", Edward Arnold,
London.
Rackham O. (1986) "The History of the Countryside", Dent, London.
Rackham O. (1988) "Trees and woodland in a crowded
landscape the cultural landscape of the British
Isles", (In "The Cultural Landscape - Past, Pres en t
and Future", ed. by H. H. Birks, H. J. B. Birks,
P. E. Kaland & D. Moe) pp. 53-77. Cambridge
Univesity Press, Cambridge.
Raistrick A. (1930) "Some glacial features of the Set tIe
District, Yorkshire", Proceedings of the University
of Durham, 8, part 3, (1929-1930).
Raistrick A.
Grassington,
Journal, 33,
(1936) "Prehistoric cultivation at
Yorkshire", The Yorkshire Archaeological
166-174.
Raistrick A. (1939) "Iron-age settlements in West
Yorkshire", The Yorkshire Archaeological Journal,
181
34, 115-150.
Raistrick A. & Holmes P. F. (1962) "Archaeology of Malham
Moor", Field Studies, 1, 73-96.
Raistrick ·'A. & Illingworth J. I. (1959) "The face of
North-West Yorkshire", The Dalesman Publishing
Company.
Rybnicek K., & Rybnickova E. (1987) "Palaeogeobotanical
evidence of Middle Holocene stratigraphic hiatuses
in Czechoslovakia and their explanation", Folia
Geobotanica et Phytotaxonomica, 22, 313-327.
Schweingruber F. H. (1990) "Anatomy of European woods";
Paul Haupt Berne and Stuttgart Publishers.
Simmons I. G. (1969) "Pollen diagrams from the North
York Moors", New Phytologist, 68, 807-827.
Simmons I. G~ (1975) "The ecological setting of Mesolithic
man in the Highland Zone", (In "The Effect of Man
on the Landscape: The Highland Zone",
G. Evans, S. Limbrey & H. Cleere)
CBA Research Report No. 11.
Simmons I. G. Dimbleby G. W. & Grigson
"The mesolithic", (In "The Environment
Prehistory", ed. by I. G. Simmons & M.
pp. 82-124. Duckworth, London.
ed. by J. pp. 57-63.
C. (1981)
in British
J. Tooley)
Simmons I. G. & Innes J. B. (1981) "Tree remains in
a North York Moors peat profile", Nature, 294,
76-78.
Simmons I. G. & Innes J. B. (1987) "Mid-Holocene
adaptations and later Mesolithic forest disturbance
in northern England", Journal of Archaeological
Science, 14, 385-403.
182
Sissons J. B. (1974) "The Quaternary in Scotland: a
review", Scottish Journal of Geology, 10, 311-337.
Sissons J. B. (1976) "A remarkable protalus rampart in
Wester Ross", The Scottish Geographical Magazine,
92, 182-190.
Smi th A. G. (1970) "The influence of Mesolithic and
Neolithic Man on British vegetation: a discussion",
(In "Studies in the vegetational history of the
British Isles", ed. by D. Walker & R. G. West)
pp. 81-96. Cambridge University Press, Cambridge.
Smith A. G. (1984) "Newferry and the Boreal-Atlantic
transition", New Phytologist, 98, 35-55.
Smith A. G. & Cloutman E. W. (1988) "Reconstruction of
Holocene vegetation history in three dimensions
at Waun-Fignen-Felen, an upland site in South Wales",
Philosophical Transcations of the Royal Society
of London B, 322, 159-219.
Smith A. G. & Goddard I. C. (1991) "A 12500 year record
of vegetational history at Sluggan Bog, Co. Antrim,
N. Ireland (incorporating a pollen zone scheme for
the non-specialist)", New Phytologist, 118, 167-
187.
Smi th A. J. E. (1978) "The Moss Flora of Bri tain and
Ireland", Cambridge University Press.
Smith R. T. (1986) "Aspects of the soil and vegetation
history of the Craven District of Yorkshire", (In
"Archaeology in the Pennines", ed. by T. G. Manby
& P. Turn bull) pp. 3-28. British Archaeological
Reviews, British Series 158.
183
Stockmarr J. (1971) "Tablets with spores used in absolute
pollen analysis", Pollen et Spores, 13, 615-621.
Stui ver M. & Polach H. A. (1977) "Discussion: reporting
of 14C data", Radiocarbon, 19, 355-363.
Sturludot tir S. A. & Turner J. (1985) "The elm decline
at Pawlaw Mire: an anthropogenic interpretation",
New Phytologist, 99, 323-329.
Swales S. (1987) "The Vegetational and Archaeological
History of the Ingleborough Massif, North Yorkshire",
PhD TheSiS, University of Leeds.
Syers J. K. (1964) "A Study of soil formation on
Carboniferous Limestone with particular reference
to lichens as pedogenic agents", PhD Thesis,
University School of Agriculture, King's College,
University of Durham.
Ten Hove H. A. (1968) "The Ulmus fall at the transition
Atlanticum-Subboreal in pollen
Palaeogeography,
5, 359-369.
Palaeoclimatology,
diagrams",
Palaeoecology,
Tipping R. (1991) "The clima tostratigraphic su bdi vision
of the Devensian Lateglacial: evidence from a pollen
site near Oban, western Scotland", Journal of
Biogeography, 18, 89-101.
Troels-Smith J. (1960) "Ivy, mistletoe and elm climatic
indicators fodder plants", Danmarks Geologiske
Unders~gelse, IV, 4(4), 32 pp.
Turner J., Innes J. B. & Simmons I. G. (1989) "Two pollen
diagrams from the same site", New Phytologist, 113.
409-416.
184
Van Geel B., Bohncke S. J. P. & Dee H. (1980) "A
study of an upper Late Glacial palaeoecological
and Holocene seq uence from 'De Borchert' the
Review of Palaeobotany and Palynology, Netherlands",
31, 367-448.
Vi t t D. H. & Kuhry P. (1992) "Changes in moss-domina ted
wetland ecosystems", (In "Bryophytes and Lichens
in a changing Environment", ed. by J. Bates & A.
M. Farmer) pp. 178-210. Clarendon Press, Oxford.
Walker D. (1956) "A site at Stump Cross near Grassington,
Yorkshire and the age of the Pennine microlithic
industry", Proceedings of the Prehistoric Society,
22, 23-28.
Walker M. J. C. & Harkness D. D. (1990) "Radiocarbon
dating the Devensian Lateglacial in Britain: new
evidence from Llanilid, South Wales", Journal of
Quaternary Science, 5(2), 135-144.
Wa t ts W. A. (1977) "The Late Devensian vegetation· of
Ireland", Philosophical Transactions of the Royal
Society of London B, 280, 273-293.
Wa t ts W. A. (1980) "Regional variation in the response
of vegetation to Lateglacial climatic events in
Europe", (In "Studies in the Lateglacial of Northwest
Europe", ed. by J. J. Lowe J. M. Gray & J. E.
Robinson), pp. 1-22. Pergamon Press, Oxford.
Watts W. A. (1982) "Response of biotic populations to
rapid environmental and climatic changes", Abstracts
Seventh AMQUA Conference, 19-21.
Whittington G., Edwards K. J. & Cundill P. R. (1991a)
"Late- and Post-glacial vegetational changa at Black
Loch, Fife, eastern Scotland a mUltiple core
approach", New Phytologist, 118, 147-166.
I 185
Whittington G., Edwards K. J. & Cundill P. R. (1991b)
"Palaeoecological investigations of multiple elm
declines at a site in north Fife, Scotland", Journal
of Biogeography, 18, 71-87.
Wi lIs L. J. (1978) "A palaeogeographic map of the Lower
Palaeozoic floor below the cover of Upper Devonian
Carboniferous and later formations", Memoir
Geological Society of London, 8, 36 pp.
Wood T. G. (1963) "The Fauna of Certain Moorland Soils
Developed on Limestone and Non-calcareous Drift",
PhD Thesis, University of Nottingham.
Table 53.1. Macroscopic fossils from SNIDDLE MOSS 4
E ~
a
50
100
150
:5 200 c. .,
Q
250
JOO
JSO
«10
E;l o
<5 ..r::: :5 Co
-
· · · · · · · · · · · · · · · · · · · · · l
r
Co C. ~ t..:.. t..:..
-------
· •
·
. •
· · · · · . · · · · ·
r r r II r
t..:.. t..:.. t..:.. t..:.. t..:.. Co C. t..:..
· · · ·
-------------· · . ·
• • • · · . • · · · . · • · · .
r r r r r r r r
~ t..:..
.
--
•
r r
t..:.. I t..:.. Co t..:..
.
----
. ,
· · · . · r I r r r
,r------- BRYOPIifTES (Ivs) -------,
t..:.. ~ C. ~ C. Co L.:.. t..:..
· ------- -
.
· • . · · · · · • . · :
• · · .
r r r r r r r r
L.:.. L.:.. L::..
•
. -
• . .
-
r r r
<:1ILY
9.lH(
-
SM4-\o111
;'M'I-YII ;'M'I-YI
SU4-V
SM4-l\I
SI.4HII
-
SI.4H
. present
Abbreviations:
b-bud
cp-capsule
ep-epidermia
f c s-female catkin scale
fr-fruit
fr-st-fruit-stone
lva-leavea
n-nut
oosp-oospore
a-seed
sh-shoot
stat-statoblast
Table 5.3.2. Macroscopic fossils from SNIDDLE MOSS 9
>-. O'l 0
"0 ...r::: ....... :.:J
0 L:.. L:.. L L L ~ L L t..:.. L.::... L.::... L.::... L L:.. L t..:.. L L:.. L.::... t..:.. L:.. L L L.::... t..:.. L.::... t..:.. L L..:... L:.: t..:.. ~ L..:...
.. - .. - ... -j"7I'20' , '40' , J ' , '2'0' , '{'a' , '6'0' , r ~j' i 'to' , '{'a' i r r r I ' i '2'0' i '40' , 'dol' , '~' , '4br i'-r> r r r I ' , '20r ,..., ,..., r r r r r r ~or r r f""'T2or r r r r r-r-'2or r-o rn ,..., r r r r r ,..., r-r-'2or r r-r-'2ar r r r r-'2or r t' , 'io' , '40' , 'ro' , <"1-r-1-'-0-a ~-200'--"""":!O:J
1 5'0 150 1 '2'01 ' 201 '2D '401 '20' 4'0 ' 60 '8'0 1 10D 150 1 'I ' 20 4'0 ' 60 ' 80 ' lOa 1 50 100 150 200 I io ' 4D 601 I I 200 WO 600 BOO
x1000 grains em-3
SNIDDLE MOSS 4a (Percentage Pollen Diagram)
/ N
c:f .....J
70
-75 --80
SM4a-1I1
85
90 ..--. E u .........
..r::: 95 ...... - - - S~l4a-1I a.. Q)
Cl -100 -
--105 - - - SM4a-1 110
-115 _ _ _ _ _ _ _ a ~ • __
I ' I , ii' Iii , iii , i ~ I i I • iii iii Iii iii i • i ~ Iii i i r i , i , iii I ' i , i r' ~ ~ Iii ii' I j-r-,......., t-T""1.......,......,"""T""T'"T""T'T"'T'"""" hr-rr"T"T'",.-T-, j--,-,,......,. ........ .,.......,...,....,...., 20 20 +0 20 2.0 20 40 2ll 20 40 2ll 2ll
j' , I ( ; iii' l I 'it i • , r f i , • , • i I I I 'i; i' i • I j7 i • i ' i • iii' i I r i; i I I' I ; i ' I I' I ' , I I ii' i • I • Iii' I Iii' I ' I ' iii i' iii: I 'ii I r ,;=-""-"" -"--r, ~ • ..,.,-.-• .." 20 40 20 20 40 20 40 20 4{J £0 20 40 20 «l 60 80 20 4{J 20 40 100 200 300 4D0
Fi:r-T~f""""1 r'"' r r f""""1 r f""""1 f""""1 r'"' r r r'"' r f""""1 :' r .., .., r'"' r r ~r r r r r'"' r r r r f""""1 ;..j ""'1""'0"'" r ;"1 "'-''''io''''''-w''' .-" r 1 ED
SM9-!I1
SM9-11
SM9-1
SNIDDLE MOSS 9 (Influx Pollen Diagram)
Radiocarbon Year BP o
50
471~5-
t3~: 100
150
56B5±!lO - 200
6115±&l-
730&±S0 -
..s:: -o-J
0.. 300 cu Q
350
400
450
500
550
-
-
-
-
-
.
, , , , , , , , , , ,
~~ ~r:, "> ~~ <¢~ -:s-~
L 0 ! " " 0 0 0 0 0 0 0 0 0 0 I
-l V V V V V
rv v v v v v
rv v v
- -i I t-. -
~ i::. t i f
v v v ~ v W v v v
~ v W v v v
W v w v v v
W v ~ v v v
v v v v v v
v v v v v v
v v v
/ v v v v
v v v v v v v v V
F F F F F F
F F F F F F
r=::;="-"---T' --00--'1 Iii iii I • iii • i • I I 100 200 300 20 40 60
i
2'0
x100 groins cm-2 Year-I N.B. Nole the change of scale for Ulmus
J> ">
"'~<:> y.~",r:, .~o ~;§>
cfr~ ~ x\~CJ~~ ~ 0 l 0 I-,:..,! 0 0 0 b-, Lo I " " :
I I I I I I I I I I I I I I I I I I I I I I I I I I I I I I I I I I I I I I I
V V V
vV V ~ V v
'r;V v v v v
v v v ~ v v v v v
~v v v v v
v v v v v v
v v v v v
v v v v v v
~~ v v v v
rr v v v v v
~ v v ~ v v
~ v v V V V
~ ,:? ~~ <$-'?; ~.r:;
~. ~ ~ ~~ ~~ (J'l> £!. ~~ ~o t;-Q<:i.. ~.f
.~r;;; en
.~J> " ~ ~o • <:)\ ~'4# ~r§< 11.)
~.§> .~rv ~~ ~& (sf:; ~~lS ~<:,<>; l-.Cl G ~OV;; '" ~ en
;'tS :,,~ ~ ~ vO ,<:'1 :b ~c.- <:> !U ,<,-& ~~<::> ,~rv ..s::: ~,~ "Q S<::> c;p cP "::,,,"'1.., <.SG ~~<:i.. ~. ~. ~. ,\0 "\."l a.. L I I I , l ,L L I L l ,L ' I ,I , , l ' ,,~ I
1M2-I , ' I 'io' I '40' I 60 I '00 I r .-, ~-50"T'~--.,00~..--,1bo I' , 'I 20ri -~--'I , ' I '20' ' I 'io;"" -~--'I ;::., -~--'I ;::., =--~--'I ;:'I-~-"""I ;::, =-~--'I r i' "iol 200
v v v 1""1""1"" ••••••••••••••••••••••••••• ......,..., ••••••••••• ::::: .. ; ....................... ~ ................................................. ,.. ...................................................................... . ;::.I .•••.••...••••.•.•.•••••.••••••• ~ .•.••••.•.• 1"": ••••••••••••••••••••••••••••••••••••••••••••••••••••••••••• ~ ............................................................................. ~ ••••••••••• ~ ••••••••••••••••••••••••••••••••••••
SH-ia - . r-I ~--,5'0-~IT6o----.1501 ' "io I r-I ...;;;;;;..~--"T-~-20T""1 -~--'I I I 2'0 I r"1 ----~------" I -360 rl ----~------" I io 'I '2'0" '4'0 I