81
Fact Book 2019-2020 Palatine, Illinois

Fact Book2019-2020
Palatine, Illinois
MISSION
Harper College enriches its diverse communities by providing quality, affordable, and accessible education. Harper College, in collaboration with its partners, inspires the transformation of individual lives, the workforce, and society.
VISION STATEMENT
We will be an innovative and inclusive institution, the community’s first choice, and a national leader for student success.
PHILOSOPHY STATEMENT
We, at Harper College, believe that our charge is to facilitate active learning and foster the knowledge, critical thinking and life/work skills required for participation in our global society. We work with our community partners to enrich the intellectual, cultural and economic fabric of our district. We believe that excellence in education must occur in an ethical climate of integrity and respect. We hold that the strength of our society is rooted in our diversity and that it is through synergy that we achieve excellence.
CORE VALUES
We value Respect, Integrity, Collaboration and Excellence.
We guide our work and support our philosophy, mission and vision by these core values.
RESPECTWe demonstrate Respect by interacting with and caring for others in a way that adds dignity to ourselves, our relationships and our organization by:
• valuing and celebrating the uniqueness of individuals and their strengths;• expressing appreciation for our colleagues’ time, efforts and contributions;• encouraging multiple perspectives.
INTEGRITYWe demonstrate Integrity by supporting an honest and ethical environment by:
• respecting confidentiality and acting in a trustworthy manner;• being accountable for our actions and adhering to policies and procedures;• making decisions that are fiscally and socially responsible.
COLLABORATIONWe demonstrate Collaboration by working internally and externally toward shared goals to create a more positive outcome by:
• actively listening, responding to others with empathy;• practicing open and honest communication and sharing information that is essential for success;• using positive humor to foster a healthy and enjoyable environment.
EXCELLENCEWe demonstrate Excellence by setting and pursuing high standards of professionalism and competency by:
• providing exceptional service to all while demonstrating pride in our work;• welcoming new challenges and seeking opportunities for growth and development;• encouraging and empowering each of us to achieve our best.
2019-2020
Fact Book
Avis Proctor, Ed.D.
President Fall 2019
William Rainey Harper College
Institutional Research
Katherine Coy Ph.D., Director
1200 West Algonquin Road
Palatine, Illinois 60067-7398
Phone: 847.925.6950
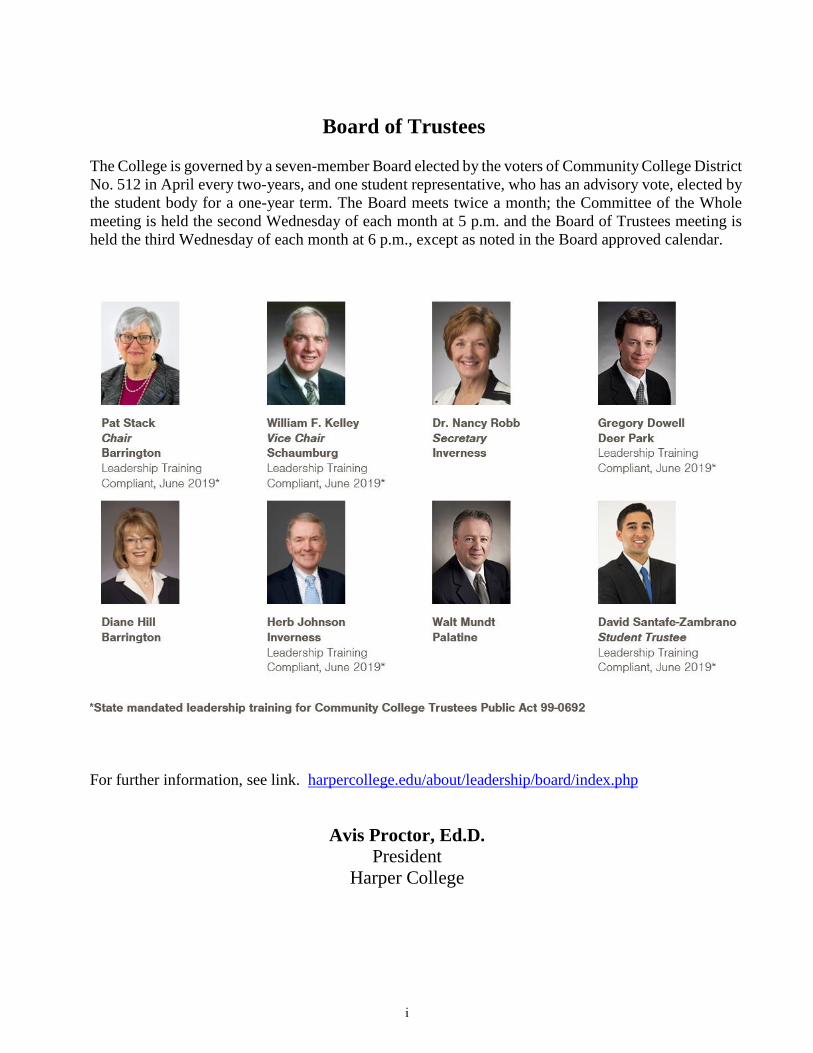
Board of Trustees
The College is governed by a seven-member Board elected by the voters of Community College District
No. 512 in April every two-years, and one student representative, who has an advisory vote, elected by
the student body for a one-year term. The Board meets twice a month; the Committee of the Whole
meeting is held the second Wednesday of each month at 5 p.m. and the Board of Trustees meeting is
held the third Wednesday of each month at 6 p.m., except as noted in the Board approved calendar.
For further information, see link. harpercollege.edu/about/leadership/board/index.php
Avis Proctor, Ed.D.
President
Harper College
i
Preface
The Fact Book is designed to provide easy access to commonly asked questions about Harper
College. It contains n i n e chapters: General Information, Organization and Administration,
Credit Students, Workforce Solutions, Finances, Facilities, Human Resources, Support Services,
and Recognitions. Individuals from every area of the College provided information contained in
sections of the Fact Book and The Office of Institutional Research would like to acknowledge and
thank all the individuals and units of the College for their cooperation and assistance.
Questions and comments regarding the Fact Book are encouraged, as we want to continually
improve the Fact Book. Please e-mail your comments and suggestions to [email protected] or
call us at 847.925.6950.
ii
Table of Contents Board of Trustees ......................................................................................................................................... i
Preface .......................................................................................................................................................... ii
Table of Contents ....................................................................................................................................... iii
Chapter I General Information ................................................................................................................. 1
Harper College Institutional Profile ........................................................................................................ 1
Community College District 512 Map.................................................................................................... 5
Exhibit 1.1. Gender by Age for Harper's District .......................................................................... 6
Exhibit 1.2. Percent District Residents by Age Group Served by Harper ..................................... 7
Exhibit 1.3. Race/Ethnicity of Harper District by High School District ....................................... 7
Exhibit 1.4a. Educational Attainment (25 years and over) Average Salaries ............................... 8
Exhibit 1.4b. Educational Attainment (25 years and over) by Category ....................................... 8
Exhibit 1.5. Status of Housing Units in Harper District by High School District ......................... 9
Exhibit 1.6. Household Information of Harper District Residents .............................................. 10
Exhibit 1.7. Population Estimates of Harper District Municipalities .......................................... 11
Exhibit 1.8. Unemployment Rate ................................................................................................ 12
Exhibit 1.9. Income and Benefits by High School Districts in Harper District .......................... 13
Exhibit 1.10. Poverty Levels in Harper District by High School District ................................... 14
Accreditations, Affiliations, Certifications ........................................................................................... 15
Harper College Educational Foundation ............................................................................................... 15
Illinois Community College System Overview .................................................................................... 16
Federal Legislators in Harper College District ..................................................................................... 16
State Legislators in Harper College District ......................................................................................... 16
Chapter II Organization and Administration ....................................................................................... 17
Harper College Executive Council ....................................................................................................... 17
Administrative Organization Chart FY20 ............................................................................................. 18
Chapter III Credit Students .................................................................................................................... 19
Fall Semester 10th Day Profiles of Enrolled Credit Students ................................................................ 19
Exhibit 3.1. Number of Fall Credit Students by Full-Time/Part-Time Status ............................. 19
Exhibit 3.2. Number of Fall Credit Students by Residency Status.............................................. 20
Exhibit 3.3. Number of Fall Credit Students by Student Enrollment Status ............................... 21
Exhibit 3.4. Gender of Fall Credit Students ................................................................................ 22
Exhibit 3.5. Age Groups of Fall Credit Students......................................................................... 23
iii

Exhibit 3.6. Race/Ethnicity of Fall Credit Students .................................................................... 24
Exhibit 3.7. Credit Students from In-District High Schools ....................................................... 25
Exhibit 3.8. Credit Students from Top 10 Out-of-District High Schools .................................... 25
Fiscal Year Profiles of Enrolled Credit Students ...................................................................................... 26
Exhibit 3.9 Annual Credit Student Haedcounts by Fiscal Year and Semester ............................ 26
Exhibit 3.10. Full-Time Equivalent (FTE) by Fiscal Year and Semester ................................... 27
Exhibit 3.11. Number of Credit Students by Age Group and Fiscal Year .................................. 28
Exhibit 3.12. Number of Full-Time/Part-Time Credit Students by Fiscal Year ......................... 29
Exhibit 3.13. Gender of Credit Students by Fiscal Year ............................................................. 30
Exhibit 3.14. Race/Ethnicity of Credit Students by Fiscal Year ................................................. 31
Exhibit 3.15. Degrees and Certificates Awarded by Fiscal Year ................................................ 32
Exhibit 3.16. Types of Degrees Awarded by Fiscal Year ........................................................... 32
Exhibit 3.17. Associates in Applied Sciences Degrees Awarded ............................................... 33
Exhibit 3.18. Certificates Awarded in Fiscal Year 2019 ............................................................ 35
Exhibit 3.19. Gender of Students Awarded Degrees or Certificates ........................................... 38
Exhibit 3.20. Race/Ethnicity of Students Awarded Degrees or Certificates ............................... 39
Exhibit 3.21. Top Ten Transfer Choices for Harper 2019 Graduates ......................................... 40
Credits by Modality .................................................................................................................................. 41
Exhibit 3.22. FY Credit Hours by Modality ................................................................................ 41
Exhibit 3.23. Fall Credit Hours by Modality ............................................................................... 41
Exhibit 3.24. Spring Credit Hours by Modality .......................................................................... 41
Chapter IV Workforce Solutions............................................................................................................. 42
Continuing Education and Business Outreach ........................................................................................ 42
Exhibit 4.1. Enrollment of CE Students by Program by Fiscal Year (Duplicated) ..................... 43
Exhibit 4.2. Gender of CE Students by Fiscal Year (Unduplicated) ........................................... 44
Exhibit 4.3. Age Groups of CE Students by Fiscal Year (Unduplicated) ................................... 44
Exhibit 4.4. Race/Ethnicity of CE Students by Fiscal Year (Unduplicated) ............................... 44
Exhibit 4.5. Gender of Career Training Students (CE) Annual (Unduplicated) ......................... 45
Exhibit 4.6. Age Group of Career Training Students (CE) Annual (Unduplicated) ................... 45
Exhibit 4.7. Gender of Personal Enrichment Students CE Annual (Unduplicated) .................... 45
Exhibit 4.8. Age Group of Personal Enrichment Students CE Annual (Unduplicated) .............. 46
Exhibit 4.9. Annual New Course Creation Ratio ........................................................................ 46
iv
Workforce Certification Center ................................................................................................................. 47
Exhibit 4.10. Workforce Certification Center Highlights ........................................................... 47
Harper Business Solutions ...................................................................................................................... 48
Exhibit 4.11. Harper Business Solutions (HBS) ......................................................................... 48
Illinois Small Business Development Center .......................................................................................... 49
Exhibit 4.12. Small Business Development Center (SBDC) ...................................................... 49
Harper College Job Placement Resource Center .................................................................................... 50
Exhibit 4.13. Job Placement Resource Center (JPRC) ................................................................ 50
Chapter V Finances .................................................................................................................................. 51
Exhibit 5.1. Tuition Rates per Credit Hour by Residency Status ................................................ 51
Exhibit 5.2. Operating Funds Revenues ...................................................................................... 52
Harper College, Community College District No. 512 Operating Funds Revenues ................... 53
Exhibit 5.3. Operating Funds Expenditures ................................................................................ 54
Harper College, Community College District No. 512 Operating Funds Expenditures ............. 55
Exhibit 5.4. Historical Assessed Valuations and Taxes Extended .............................................. 56
Harper College Comprehensive Annual Financial Report ......................................................... 56
Chapter VI Facilities ................................................................................................................................. 57
Harper College Campus Map ................................................................................................................ 57
Extension Center Locations & Additional Service Locations ............................................................... 58
Life Long Learning Locations ............................................................................................................... 59
Exhibit 6.1. Campus Buildings and Acceptance Dates and Gross Square Feet .......................... 60
Exhibit 6.2. Gross Square Footage of Facilities .......................................................................... 61
Exhibit 6.3. Land and Parking Summary .................................................................................... 61
Chapter VII Human Resources ............................................................................................................... 62
Exhibit 7.1. Employee Headcount and Full-Time Equivalent (FTE) at Fall Census .................. 62
Exhibit 7.2. Full-Time and Part-Time Employee Status by Occupational Category and FY ..... 62
Exhibit 7.3. Full-Time Equivalent by Occupational Category at Fall Census ............................ 63
Exhibit 7.4. Full-Time and Part-Time Employees by Employee Type at Fall Census ............... 63
Exhibit 7.5. Fall 2019 Employee Census by Employee Type and Full-Time/Part-Time Status . 64
Exhibit 7.6. Fall 2019 Employee Census by Employee Type and Gender ................................. 64
Exhibit 7.7. Fall 2019 Employee Census by Employee Type and Race/Ethnicity...................... 65
Exhibit 7.8. Fall 2019 Employee Census by Employee Type and Highest Credential Earned .. 66
v
Chapter VIII Support Services ................................................................................................................ 67
Academic Support Services .................................................................................................................... 67
Exhibit 8.1. Resources for Learning ............................................................................................ 67
Exhibit 8.2. Innovative Instruction .............................................................................................. 68
Exhibit 8.3. Academic Support Center ........................................................................................ 68
Student Support Services ........................................................................................................................ 69
Exhibit 8.4. Student Support Services ......................................................................................... 69
Financial Aid ........................................................................................................................................... 70
Exhibit 8.5. Federal and State Financial Aid Support to Students .............................................. 70
Exhibit 8.6. Race/Ethnicity of Financial Aid for All Recipients ................................................. 70
Chapter IX Recognitions and Awards .................................................................................................... 71
vi
Harper College Fact Book 2019-2020
Chapter I: General Information
Chapter I
General Information
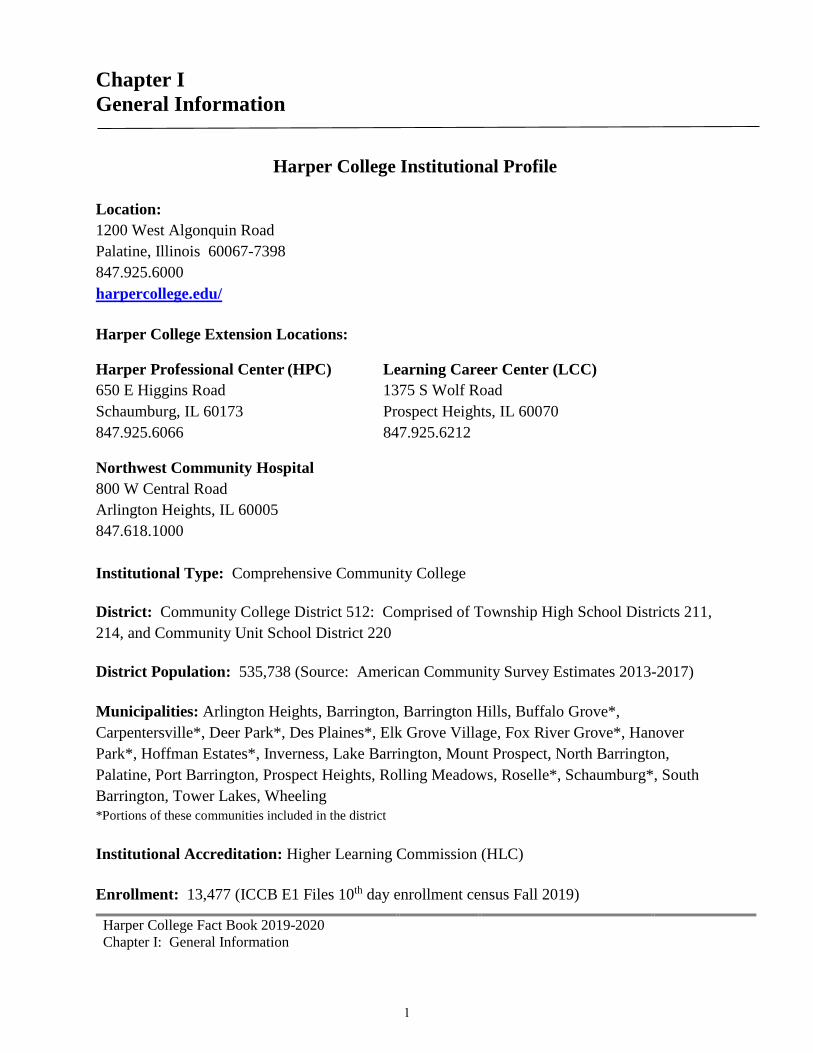
Harper College Institutional Profile
Location:
1200 West Algonquin Road
Palatine, Illinois 60067-7398
847.925.6000
harpercollege.edu/
Harper College Extension Locations:
Harper Professional Center (HPC) Learning Career Center (LCC)
650 E Higgins Road 1375 S Wolf Road
Schaumburg, IL 60173 Prospect Heights, IL 60070
847.925.6066 847.925.6212
Northwest Community Hospital
800 W Central Road
Arlington Heights, IL 60005
847.618.1000
Institutional Type: Comprehensive Community College
District: Community College District 512: Comprised of Township High School Districts 211,
214, and Community Unit School District 220
District Population: 535,738 (Source: American Community Survey Estimates 2013-2017)
Municipalities: Arlington Heights, Barrington, Barrington Hills, Buffalo Grove*,
Carpentersville*, Deer Park*, Des Plaines*, Elk Grove Village, Fox River Grove*, Hanover
Park*, Hoffman Estates*, Inverness, Lake Barrington, Mount Prospect, North Barrington,
Palatine, Port Barrington, Prospect Heights, Rolling Meadows, Roselle*, Schaumburg*, South
Barrington, Tower Lakes, Wheeling
*Portions of these communities included in the district
Institutional Accreditation: Higher Learning Commission (HLC)
Enrollment: 13,477 (ICCB E1 Files 10th day enrollment census Fall 2019)
1

Harper College Fact Book 2019-2020
Chapter I: General Information
Harper College Institutional Profile (continued)
Student Characteristics: Fall 2019 Enrollment
Gender:
55% Female
45% Male
Race/Ethnicity:
14% Asian
4% Black or African American
26% Hispanic or Latino
49% White
6% Other
Residency status:
86% In-district
13% Out-of-district
<1% Out-of-state
Age Groups:
17% 18 & under
52% 19-24
31 % >25
Student Success: 33% graduation rate; 25% transfer rate (2015 IPEDS cohort, 2018 IPEDS
Graduation Rate Component Data Summary)
Employees: 1,495 (Fall 2019)
Faculty (Instructional Staff): 638 (201 Full-Time; 437 Part-Time)
Non-Faculty: 857 (528 Full-Time; 329 Part-Time)
Academic Calendar: Semester – Fall/Spring/Summer
Finances: $118,608,453 Total Revenue, $106,308,947 Total Operating Expenditures for the year
ending June 30, 2019
Tuition Per Credit Hour, 2018-19: In-District: $133.50 per credit hour, Out-of-District: $390.50 per
credit hour, Out-of-State: $466.00 per credit hour, International Student: $466.00 per credit hour,
Required fees: $570 required fees annually for full-time attendance
Students Awarded Financial Aid: 24% Pell grants; 6% Federal Student Loans, and 29% other grants
or scholarships (Source: 2018-19 IPEDS Financial Aid Survey)
2

Harper College Fact Book 2019-2020
Chapter I: General Information
Harper College Institutional Profile (continued)
Degrees/Certificates Awarded:
Associate in Arts (AA)
Associate in Applied Science (AAS)
Associate in Engineering Science (AES)
Associate in Fine Arts – Art (AFA-A)
Associate in Fine Arts – Music (AFA-M)
Associate of General Studies (AGS)
Associate in Science (AS)
Certificates (Various)
Academic Divisions:
Business and Social Science
Career and Technical Programs
Enrollment Services
Health Careers
Liberal Arts
Mathematics and Science
Resources for Learning/Library Services
Student Engagement
Student Development
3
Harper College Fact Book 2019-2020
Chapter I: General Information
Harper College Institutional Profile (continued)
History of Harper College
The story of Harper College parallels the history of the community college movement in Illinois, an
educational phenomenon in the 1960s. In 1967, Harper's first faculty members were hired, and classes
for 1,725 students were begun in temporary facilities in September. harpercollege.edu/about/history
Harper College Mission
Harper College enriches its diverse communities by providing quality, affordable, and accessible
education. Harper College, in collaboration with its partners, inspires the transformation of individual
lives, the workforce, and society. harpercollege.edu/about/leadership/mission.php
Harper College Philosophy
We, at Harper College, believe that our charge is to facilitate active learning and foster the knowledge,
critical thinking and life/work skills required for participation in our global society. We work with our
community partners to enrich the intellectual, cultural and economic fabric of our district. We believe
that excellence in education must occur in an ethical climate of integrity and respect. We hold that the
strength of our society is rooted in our diversity and that it is through synergy that we achieve
excellence. harpercollege.edu/about/leadership/mission.php
Harper College Core Values
We value Respect, Integrity, Collaboration and Excellence. We guide our work and support our philosophy,
mission and vision by these core values. harpercollege.edu/about/leadership/mission.php
4

Harper College Fact Book 2019-2020
Chapter I: General Information
Community College District 512 Map
Source: 2019-2020 College Plan
5

Harper College Fact Book 2019-2020
Chapter I: General Information
Exhibit 1.1. Gender by Age for Harper's District
Census Age Groups
Male Female Total Population
N % N % N %
Under 5 16,797 6.4% 16,075 5.9% 32,872 6.1%
5-9 17,381 6.6% 16,059 5.9% 33,440 6.2%
10-14 17,472 6.6% 16,798 6.2% 34,270 6.4%
15-17 11,286 4.3% 9,784 3.6% 21,070 3.9%
18-19 5,234 2.0% 4,396 1.6% 9,630 1.8%
20 2,302 0.9% 1,732 0.6% 4,034 0.8%
21 2,152 0.8% 2,080 0.8% 4,232 0.8%
22-24 8,391 3.2% 8,020 3.0% 16,411 3.1%
25-29 18,279 6.9% 16,663 6.1% 34,942 6.5%
30-34 20,020 7.6% 20,139 7.4% 40,159 7.5%
35-39 18,780 7.1% 17,507 6.5% 36,287 6.8%
40-44 17,860 6.8% 17,332 6.4% 35,192 6.6%
45-49 18,310 6.9% 18,699 6.9% 37,009 6.9%
50-54 19,270 7.3% 21,074 7.8% 40,344 7.5%
55-59 18,651 7.1% 19,701 7.3% 38,352 7.2%
60-61 7,315 2.8% 7,904 2.9% 15,219 2.8%
62-64 9,414 3.6% 9,846 3.6% 19,260 3.6%
65-66 5,506 2.1% 5,996 2.2% 11,502 2.1%
67-69 6,899 2.6% 8,651 3.2% 15,550 2.9%
70-74 8,810 3.3% 10,562 3.9% 19,372 3.6%
75-79 5,818 2.2% 8,354 3.1% 14,172 2.6%
80-84 4,813 1.8% 6,415 2.4% 11,228 2.1%
85+ 3,672 1.4% 7,519 2.8% 11,191 2.1%
Total Gender 264,432 100% 271,306 100% 535,738 100%
Source: American Community Survey Estimates (2013-2017)
Composite Margin of Error: +/- 1,472
Due to the timeline of the Census Data release, the most currently available data for this table is from 2013-2017.
6
Harper College Fact Book 2010-2020
Chapter I: General Information
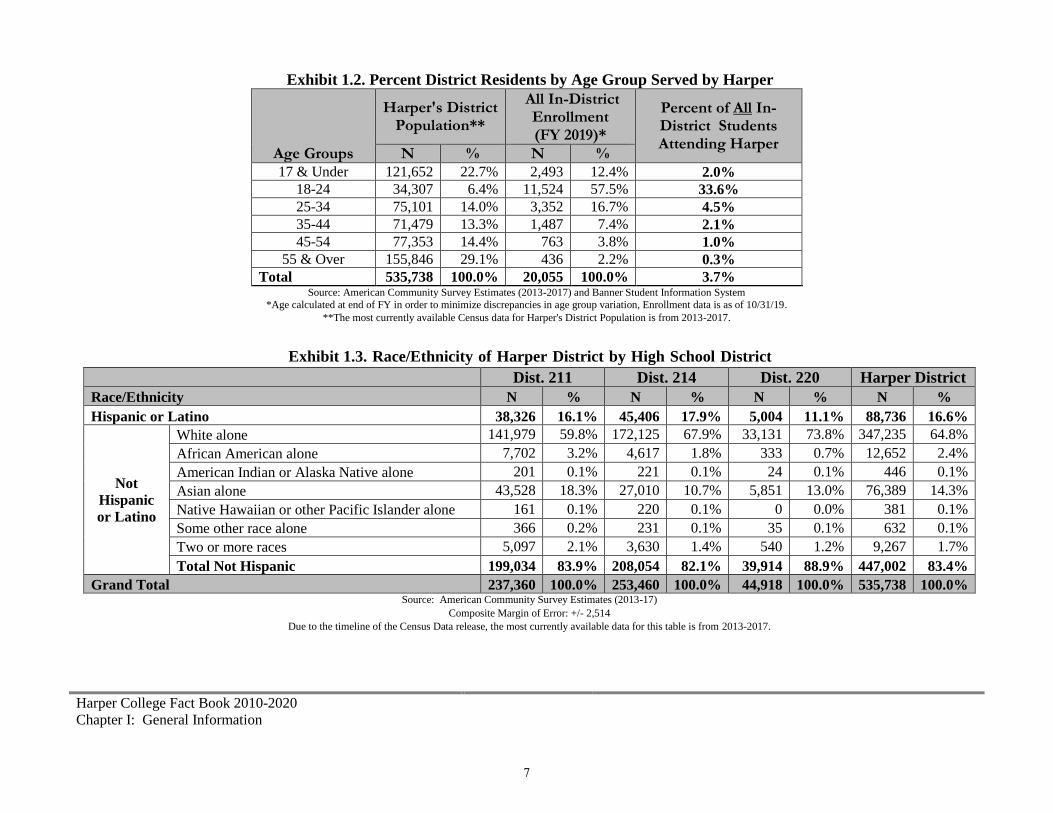
Exhibit 1.2. Percent District Residents by Age Group Served by Harper
Age Groups
Harper's District Population**
All In-District Enrollment (FY 2019)*
Percent of All In-District Students Attending Harper
N % N % 17 & Under 121,652 22.7% 2,493 12.4% 2.0%
18-24 34,307 6.4% 11,524 57.5% 33.6%
25-34 75,101 14.0% 3,352 16.7% 4.5%
35-44 71,479 13.3% 1,487 7.4% 2.1%
45-54 77,353 14.4% 763 3.8% 1.0%
55 & Over 155,846 29.1% 436 2.2% 0.3%
Total 535,738 100.0% 20,055 100.0% 3.7% Source: American Community Survey Estimates (2013-2017) and Banner Student Information System
*Age calculated at end of FY in order to minimize discrepancies in age group variation, Enrollment data is as of 10/31/19.
**The most currently available Census data for Harper's District Population is from 2013-2017.
Exhibit 1.3. Race/Ethnicity of Harper District by High School District
Dist. 211 Dist. 214 Dist. 220 Harper District
Race/Ethnicity N % N % N % N %
Hispanic or Latino 38,326 16.1% 45,406 17.9% 5,004 11.1% 88,736 16.6%
Not
Hispanic
or Latino
White alone 141,979 59.8% 172,125 67.9% 33,131 73.8% 347,235 64.8%
African American alone 7,702 3.2% 4,617 1.8% 333 0.7% 12,652 2.4%
American Indian or Alaska Native alone 201 0.1% 221 0.1% 24 0.1% 446 0.1%
Asian alone 43,528 18.3% 27,010 10.7% 5,851 13.0% 76,389 14.3%
Native Hawaiian or other Pacific Islander alone 161 0.1% 220 0.1% 0 0.0% 381 0.1%
Some other race alone 366 0.2% 231 0.1% 35 0.1% 632 0.1%
Two or more races 5,097 2.1% 3,630 1.4% 540 1.2% 9,267 1.7%
Total Not Hispanic 199,034 83.9% 208,054 82.1% 39,914 88.9% 447,002 83.4%
Grand Total 237,360 100.0% 253,460 100.0% 44,918 100.0% 535,738 100.0% Source: American Community Survey Estimates (2013-17)
Composite Margin of Error: +/- 2,514
Due to the timeline of the Census Data release, the most currently available data for this table is from 2013-2017.
7

Harper College Fact Book 2019-2020
Chapter I: General Information
Exhibit 1.4.a Educational Attainment (25 years and over) Average Salaries
District 211 District 214 District 220
Education Level
Estimate
Average
Salary Margin of
Error
Estimate
Average
Salary Margin
of Error
Estimate
Average
Salary Margin
of Error
Total: 47,857 +/-1,378 44,789 +/-1,055 58,573 +/-4,567
Less than high school graduate 24,756 +/-1,605 23,317 +/-1,657 24,837 +/-8,175
High school graduate (includes equivalency) 33,479 +/-2,686 32,855 +/-1,540 23,684 +/-10,930
Some college or associate's degree 41,324 +/-1,040 40,242 +/-954 42,679 +/-4,005
Bachelor's degree 58,074 +/-2,351 58,581 +/-2,546 69,146 +/-8,508
Graduate or professional degree 78,256 +/-4,069 73,369 +/-2,677 105,771 +/-3,031 Source: American Community Survey Estimates (2013-17); B20004 (Calculated in 2017 inflation-adjusted dollars)
Due to the timeline of the Census Data release, the most currently available data for this table is from 2013-2017.
Exhibit 1.4.b Educational Attainment (25 years and over) by Category
Category Counts Percent
District Population aged 25 and over 379,779
Some college, less than 1 year* 21,311 5.60%
Some college, 1 or more years, no degree* 49,375 13.00%
Associate's degree 27,933 7.40%
Bachelor's degree 109,816 28.90%
Master's degree 51,569 13.60%
Professional school degree 9,229 2.40%
Doctorate degree 4,245 1.10%
*Approximately 10% of those with some college have earned an educational certificate.
Source: American Community Survey Estimates (2013-2017); B15003
Due to the timeline of the Census Data release, the most currently available data for this table is from 2013-2017.
8

Harper College Fact Book 2019-2020
Chapter I: General Information
Exhibit 1.5. Status of Housing Units in Harper District by High School District
Housing Status N %
District 211 Housing Units 94,630 44.2%
Owner Occupied 61,583 65.1%
Renter Occupied 28,182 29.8%
Vacant 4,865 5.1%
District 214 Housing Units 102,603 48.0%
Owner Occupied 69,507 67.7%
Renter Occupied 28,187 27.5%
Vacant 4,909 4.8%
District 220 Housing Units 16,655 7.8%
Owner Occupied 13,657 82.0%
Renter Occupied 1,916 11.5%
Vacant 1,082 6.5%
Total Housing Units in Harper District* 213,888 100.0%
Owner Occupied 144,747 67.7%
Renter Occupied 58,285 27.3%
Vacant 10,856 5.1% Source: American Community Survey Estimates (2013-17)
Composite Margin of Error: +/- 1,108
*Total Housing Units in Harper District excludes the small number of housing units from HS District 155 (Cary Grove High School)
Due to the timeline of the Census Data release, the most currently available data for this table
is from 2013-2017.
9

Harper College Fact Book 2019-2020
Chapter I: General Information
Exhibit 1.6. Household Information of Harper District Residents
Household Size, Household Type, and Presence of Children N %
1 Person
Household
Male Householder 28,287 12.4%
Female Householder 35,718 15.7%
Sub-Total 64,005 28.1%
2 or More
Person
Household
Family
Households
Married
Couple
Family
With Own Children Under 18 49,087 21.5%
No Own Children Under 18 64,938 28.5%
Sub-Total 114,025 50.0%
Other
Family
Male Householder,
No Wife Present
No Own Children
Under 18 4,531 2.0%
With Own Children
Under 18 2,953 1.3%
Sub-Total 7,484 3.3%
Female
Householder, No
Husband Present
No Own Children
Under 18 8,887 3.9%
With Own Children
Under 18 8,631 3.8%
Sub-Total 17,518 7.7%
Sub-Total 25,002 11.0%
Sub-Total 139,027 61.0%
Non-Family
Households
Male Householder 7,484 3.3%
Female Householder 17,518 7.7%
Sub-Total 25,002 11.0%
Sub-Total 164,029 71.9%
Total Households 228,034 100.0% Source: American Community Survey Estimates (2013-2017) HS Districts. 211, 214, 220
Composite Margin of Error: +/- 1,128
Due to the timeline of the Census Data release, the most currently available data for this table is from 2013-2017
10

Harper College Fact Book 2019-2020
Chapter I: General Information
Exhibit 1.7. Population Estimates of Harper District Municipalities
Geography
Total
Population in
2010
(Number)
Total
Population in
2018
(Number)*
Change in
Population
2010-2018
(Percent)
Illinois 12,830,632 12,741,080 -0.70
Arlington Heights 75,101 75,249 0.20
Barrington 10,327 10,274 -0.51
Barrington Hills 4,209 4,207 -0.05
Elk Grove Village 33,127 32,458 -2.02
Hoffman Estates 51,895 51,197 -1.35
Inverness 7,399 7,438 0.53
Lake Barrington 4,973 4,879 -1.89
Mount Prospect 54,167 54,198 0.06
North Barrington 3,047 2,970 -2.53
Palatine 68,557 68,053 -0.74
Prospect Heights 16,256 16,014 -1.49
Rolling Meadows 24,099 23,748 -1.46
Schaumburg 74,227 73,509 -0.97
South Barrington 4,565 4,993 9.38
Tower Lakes 1,283 1,235 -3.74
Wheeling 37,648 38,878 3.27 Source: 2010 Census and 2018 Population Estimates, Illinois Subcounty Population Dataset
*Due to the timeline of the Census Data release, the most currently available data for this table is as of July 1, 2018.
11
Harper College Fact Book 2019-2020
Chapter I: General Information
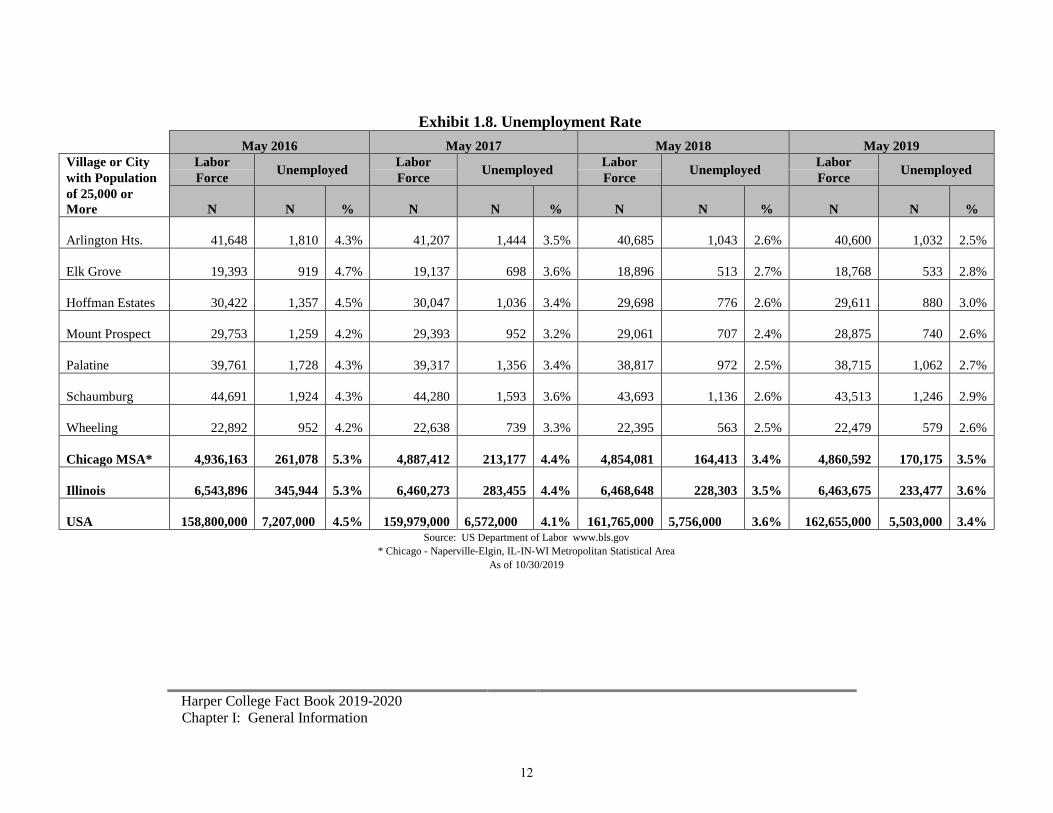
Exhibit 1.8. Unemployment Rate
May 2016 May 2017 May 2018 May 2019
Village or City Labor Unemployed
Labor Unemployed
Labor Unemployed
Labor Unemployed
with Population Force Force Force Force
of 25,000 or
More N N % N N % N N % N N %
Arlington Hts.
41,648
1,810 4.3%
41,207
1,444 3.5%
40,685
1,043 2.6%
40,600
1,032 2.5%
Elk Grove
19,393
919 4.7%
19,137
698 3.6%
18,896
513 2.7%
18,768
533 2.8%
Hoffman Estates
30,422
1,357 4.5%
30,047
1,036 3.4%
29,698
776 2.6%
29,611
880 3.0%
Mount Prospect
29,753
1,259 4.2%
29,393
952 3.2%
29,061
707 2.4%
28,875
740 2.6%
Palatine
39,761
1,728 4.3%
39,317
1,356 3.4%
38,817
972 2.5%
38,715
1,062 2.7%
Schaumburg
44,691
1,924 4.3%
44,280
1,593 3.6%
43,693
1,136 2.6%
43,513
1,246 2.9%
Wheeling
22,892
952 4.2%
22,638
739 3.3%
22,395
563 2.5%
22,479
579 2.6%
Chicago MSA* 4,936,163
261,078 5.3%
4,887,412
213,177 4.4%
4,854,081
164,413 3.4% 4,860,592 170,175 3.5%
Illinois 6,543,896
345,944 5.3%
6,460,273
283,455 4.4%
6,468,648
228,303 3.5% 6,463,675 233,477 3.6%
USA 158,800,000
7,207,000 4.5%
159,979,000
6,572,000 4.1%
161,765,000
5,756,000 3.6% 162,655,000 5,503,000 3.4%
Source: US Department of Labor www.bls.gov
* Chicago - Naperville-Elgin, IL-IN-WI Metropolitan Statistical Area
As of 10/30/2019
12

Harper College Fact Book 2019-2020
Chapter I: General Information
Exhibit 1.9. Income and Benefits by High School Districts in Harper District
Income Level Dist. 211 Dist. 214 Dist. 220 Harper
N % N % N % N %
Less than $10,000 3,046 3.4% 3,669 3.8% 594 3.8% 7,309 3.6%
$10,000 to $14,999 1,769 2.0% 2,821 2.9% 280 1.8% 4,870 2.4%
$15,000 to $24,999 5,550 6.2% 7,520 7.7% 522 3.4% 13,592 6.7%
$25,000 to $34,999 6,039 6.7% 7,982 8.2% 694 4.5% 14,715 7.2%
$35,000 to $49,999 10,531 11.7% 10,989 11.2% 1,207 7.8% 22,727 11.2%
$50,000 to $74,999 16,360 18.2% 17,319 17.7% 1,830 11.8% 35,509 17.5%
$75,000 to $99,999 12,403 13.8% 13,387 13.7% 1,327 8.5% 27,117 13.4%
$100,000 to $149,999 17,672 19.7% 17,647 18.1% 2,872 18.4% 38,191 18.8%
$150,000 to $199,999 8,385 9.3% 8,243 8.4% 1,618 10.4% 18,246 9.0%
$200,000 or more 8,010 8.9% 8,117 8.3% 4,629 29.7% 20,756 10.2%
Total households 89,765 100.0% 97,694 100.0% 15,573 100.0% 203,032 100.0%
Median household
income (dollars) 78,037 72,483 124,433 N/A
Mean household income
(dollars) 100,402 94,357 177,341 N/A
Source: American Community Survey Estimates (2013-17)
(Calculated in 2017 inflation-adjusted dollars; benefits defined as Social Security, retirement pensions, Supplemental Security, and public assistance)
Due to the timeline of the Census Data release, the most currently available data for this table is from 2013-2017.
13
Harper College Fact Book 2019-2020
Chapter I: General Information
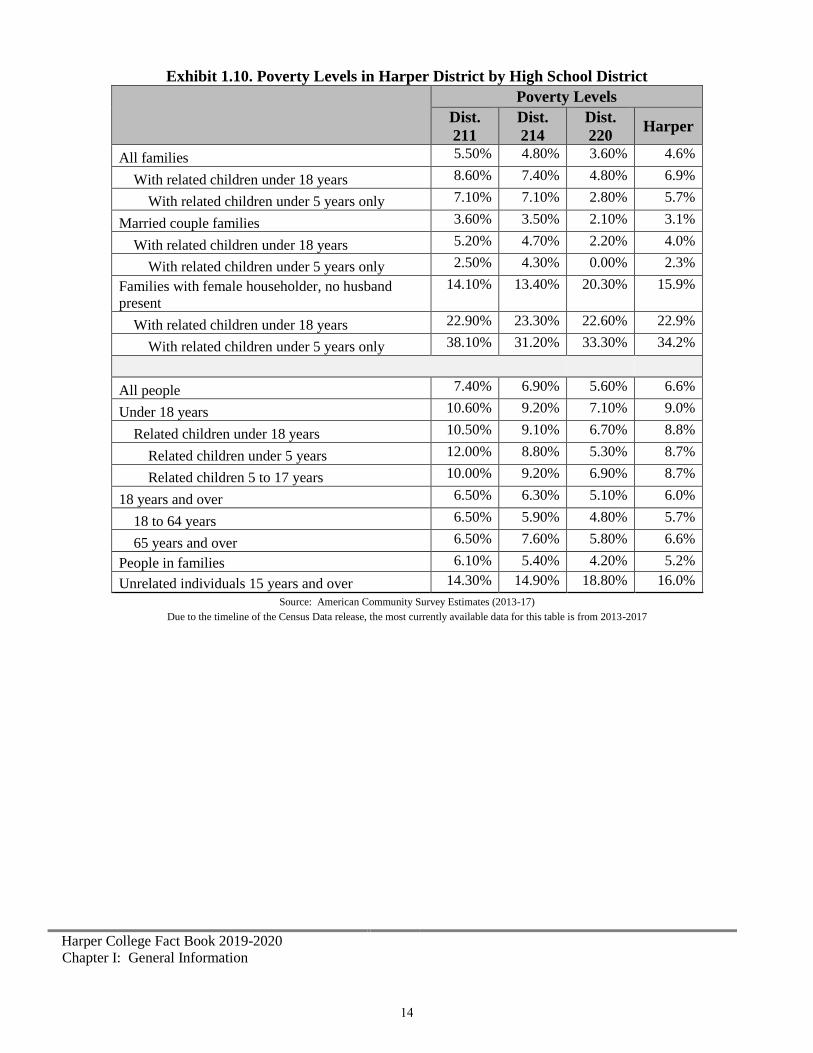
Exhibit 1.10. Poverty Levels in Harper District by High School District
Poverty Levels
Dist.
211
Dist.
214
Dist.
220 Harper
All families 5.50% 4.80% 3.60% 4.6%
With related children under 18 years 8.60% 7.40% 4.80% 6.9%
With related children under 5 years only 7.10% 7.10% 2.80% 5.7%
Married couple families 3.60% 3.50% 2.10% 3.1%
With related children under 18 years 5.20% 4.70% 2.20% 4.0%
With related children under 5 years only 2.50% 4.30% 0.00% 2.3%
Families with female householder, no husband
present
14.10% 13.40% 20.30% 15.9%
With related children under 18 years 22.90% 23.30% 22.60% 22.9%
With related children under 5 years only 38.10% 31.20% 33.30% 34.2%
All people 7.40% 6.90% 5.60% 6.6%
Under 18 years 10.60% 9.20% 7.10% 9.0%
Related children under 18 years 10.50% 9.10% 6.70% 8.8%
Related children under 5 years 12.00% 8.80% 5.30% 8.7%
Related children 5 to 17 years 10.00% 9.20% 6.90% 8.7%
18 years and over 6.50% 6.30% 5.10% 6.0%
18 to 64 years 6.50% 5.90% 4.80% 5.7%
65 years and over 6.50% 7.60% 5.80% 6.6%
People in families 6.10% 5.40% 4.20% 5.2%
Unrelated individuals 15 years and over 14.30% 14.90% 18.80% 16.0%
Source: American Community Survey Estimates (2013-17)
Due to the timeline of the Census Data release, the most currently available data for this table is from 2013-2017
14

Harper College Fact Book 2019-2020
Chapter I: General Information
Accreditations, Affiliations, Certifications
Accreditations
Harper College is fully accredited by the Higher Learning Commission, 230 South LaSalle Street, Suite
7-500, Chicago, IL, 60604; 800.621.7440
harpercollege.edu/about/consumerinfo/accreditation.php
Affiliations
The Harper College division offices are members of many different associations. Please refer to the list
at: harpercollege.edu/catalog/current/a_handbook/affiliations
Certifications
Harper College has many third-party certifications, including the Autodesk, Amazon, Cisco, CompTIA
Learning Alliance, Intuit QuickBooks, Microsoft Partner for Learning Solutions, Oracle Workforce
Development Program, Project Management, VMware, and more. A complete list is available in the
Harper College Catalog: harpercollege.edu/catalog/current/a_handbook/thirdpartycert.php
Harper College Educational Foundation
Harper College Educational Foundation
The Harper College Educational Foundation was established in 1973. Since its inception, the
Foundation’s mission has been to support the educational service of William Rainey Harper College
and, to this end, to receive, invest and steward contributions for the financial support and benefit of the
College in accordance with the Foundation’s policy and donor specifications.
Through the years, the Foundation has matured into a not-for-profit organization that has instituted best
practices for foundations affiliated with public community colleges. Its Board of Directors continues to
monitor those practices and procedures in order to improve continually the operations of the Foundation.
By forging strong relationships with community and corporate leaders, the Foundation has helped to
create a nationally recognized community college and a strong foundation for the future.
harpercollege.edu/foundation/about/index.php
Harper College Scholarships
Over 9,700 students were awarded $27 million in scholarships, grants and tuition waivers through
Harper College in 2018-2019. For a list of the different types of scholarships, see link below.
harpercollege.edu/registration/financialaid/scholarships/
15

Harper College Fact Book 2019-2020
Chapter I: General Information
Illinois Community College System Overview
Illinois Community College System
The Illinois Community College Board, as the state coordinating board for community colleges,
administers the Public Community College Act in a manner that maximizes the ability of the community
colleges to serve their communities. For further information, see link. iccb.org/iccb/
Illinois Community College System Overview
Harper College is one of the colleges in the Illinois Community College System. For further
information, see link. iccb.org/iccb/system-information/
Federal Legislators in Harper College District
U.S Senators
Richard Durbin (D) durbin.senate.gov
Tammy Duckworth (D) duckworth.senate.gov
U.S Representatives
Sean Casten (D) Congressional District 6 casten.house.gov
Raja Krishnamoorthi (D) Congressional District 8 krishnamoorthi.house.gov
Jan Schakowsky (D) Congressional District 9 schakowsky.house.gov
Brad Schneider (D) Congressional District 10 schneider.house.gov
State Legislators in Harper College District
Illinois State Senators
Cristina Castro (D) Senate District 22 senatorcristinacastro.com/
Dan McConchie (R) Senate District 26 senatormcconchie.com/
Ann Gillespie (D) Senate District 27 senatoranngillespie.org/
Laura M. Murphy (D) Senate District 28 senatorlauramurphy.com/
Julie A. Morrison (D) Senate District 29 senatorjuliemorrison.com/
Terry Link (D) Senate District 30 senatorlink.com/
Illinois State Representatives
House District 44 ilhousedems.com/project/rep-fred-crespo
House District 51 repedlyallen.com
House District 52 davidmcsweeney.com/
House District 53 ilhousedems.com/project/rep-mark-walker
House District 54 repmorrison54.com
House District 55 staterepmoylan55.com
House District 56 https://ilhousedems.com/project/rep-michelle-mussman/
House District 57 https://repjonathancarroll.com/
Fred Crespo (D)
Mary Edly-Allen (D)
David McSweeney (R)
Mark Walker (D)Tom Morrison (R)
Martin Moylan (D)
Michelle Mussman (D)
Jonathan Carroll (D)
Daniel Didech (D) House District 59 https://ilhousedems.com/project/rep-daniel-didech/
16
*Rep. Kathleen Willis (D) House District 77 has a small area of the southeastern part of our district. http://repwillis77.com/

Harper College Fact Book 2019-2020
Chapter II: Organization and Administration
Chapter II
Organization and Administration
Harper College Executive Council
Dr. Avis Proctor, President
Dr. Ronald Ally, Executive Vice President of Finance and Administrative Services
Laura Brown, Vice President and Chief Advancement Officer
Dr. Maria Coons, Interim Provost
Jeff Julian, Interim Chief of Staff/Board Liaison
Darlene Schlenbecker, Interim Vice President of Institutional Planning and Strategic Alliances
Michelé Smith, Vice President of Workforce Solutions
17

Harper College Fact Book 2019-2020
Chapter II: Organization and Administration
Administrative Organization Chart FY20
18

Harper College Fact Book 2019-2020
Chapter III: Credit Students
Chapter III
Credit Students
Fall Semester (10th Day) Profiles of Enrolled Credit Students
Exhibit 3.1. Number of Fall Credit Students by Full-Time/Part-Time Status
Enrollment Status Fall 2015 Fall 2016 Fall 2017 Fall 2018 Fall 2019
N % N % N % N % N %
Full-Time: 12 or more hours 5,056 34.8% 4,836 34.2% 4,882 35.5% 4,606 34.0% 4,519 33.5%
Part-Time: 6 to Less Than 12 hours 5,158 35.5% 5,197 36.7% 4,762 34.6% 4,965 36.7% 4,983 37.0%
Part-Time: Less Than 6 Hours 4,318 29.7% 4,109 29.1% 4,105 29.9% 3,959 29.3% 3,975 29.5%
Total Part-Time 9,476 65.2% 9,306 65.8% 8,867 64.5% 8,924 66.0% 8,958 66.5%
Total Headcount (100%) 14,532 14,142 13,749 13,530 13,477
FTE 8,353 8,131 7,908 7,740 7,713
Source: ICCB E1 Files (10th Day Enrollment) Official counts submitted to ICCB may differ from counts reported by Enrollment Services (Registrar) due to different reporting requirements.
35%
34%
36%
34%
34%
36%
37%
35%
37%
37%
30%
29%
30%
29%
29%
Fall 2015
Fall 2016
Fall 2017
Fall 2018
Fall 2019
Full-Time: 12 or more hours Part-Time: 6 to Less Than 12 hours Part-Time: Less Than 6 Hours
19

Harper College Fact Book 2019-2020
Chapter III: Credit Students
Exhibit 3.2. Number of Fall Credit Students by Residency Status
Residency
Status
Fall 2015 Fall 2016 Fall 2017 Fall 2018 Fall 2019
N % N % N % N % N %
In-District 12,689 87.3% 12,230 86.5% 11,859 86.3% 11,693 86.4% 11,580 85.9%
Out-of-District 1,728 11.9% 1,788 12.6% 1,763 12.8% 1,747 12.9% 1,795 13.3%
Out-of-State 12 0.1% 21 0.1% 12 0.1% 13 0.1% 10 0.1%
Foreign Country 103 0.7% 103 0.7% 115 0.8% 77 0.6% 92 0.7%
Total (100%)* 14,532 14,142 13,749 13,530 13,477
Source: ICCB E1 Files (10th Day Enrollment)
Official counts submitted to ICCB may differ from counts reported by Enrollment Services (Registrar) due to different reporting requirements. Columns may not add up to 100% due to rounding.
20

Harper College Fact Book 2019-2020
Chapter III: Credit Students
Exhibit 3.3. Number of Fall Credit Students by Student Enrollment Status
Student Category
Fall 2015 Fall 2016 Fall 2017 Fall 2018 Fall 2019
Full
Time
Part
Time
Full
Time
Part
Time
Full
Time
Part
Time
Full
Time
Part
Time
Full
Time
Part
Time
First-time Student in College-
Level Coursework
1,775 835 1,730 954 1,571 719 1,493 886 1,778 880
35.1% 8.8% 35.8% 10.3% 32.2% 8.1% 32.4% 9.9% 39.3% 9.8%
New Pre-College Student 54 347 33 291 17 244 50 244 42 199
1.1% 3.7% 0.7% 3.1% 0.4% 2.8% 1.1% 2.7% 0.9% 2.2%
Transfer Student 639 1,503 575 1,253 318 367 415 388 236 374
12.6% 15.9% 11.9% 13.5% 6.5% 4.1% 9.1% 4.4% 5.2% 4.2%
Pre-College to College 857 1,856 392 1,033 60 207 51 188 50 195
17.0% 19.6% 8.1% 11.1% 1.2% 2.3% 1.1% 2.1% 1.1% 2.2%
Previous Degree 86 765 102 742 227 1,361 209 1,304 176 1,279
1.7% 8.1% 2.1% 8.0% 4.7% 15.4% 4.5% 14.6% 3.9% 14.3%
Returning Student 205 1,127 127 732 383 1,249 158 937 142 854
4.1% 11.9% 2.6% 7.9% 7.9% 14.1% 3.4% 10.5% 3.1% 9.5%
Continuing Student 1,440 2,382 1,877 3,428 2,304 3,806 2,223 3,897 2,074 3,898
28.5% 25.1% 38.8% 36.8% 47.2% 42.9% 48.3% 43.7% 45.9% 43.5%
New General/Vocational
Student
0 81 0 94 0 77 0 72 9 61
0.0% 0.9% 0.0% 1.0% 0.0% 0.9% 0.0% 0.8% 0.2% 0.7%
High School Student 0 580 0 779 2 837 7 1,008 12 1,218
0.0% 6.1% 0.0% 8.4% 0.0% 9.4% 0.2% 11.3% 0.3% 13.6%
Total 5,056 9,476 4,836 9,306 4,882 8,867 4,606 8,924 4,519 8,958
Source: ICCB E1 Files (10th Day Enrollment)
Official counts submitted to ICCB may differ from counts reported by Enrollment Services (Registrar) due to different reporting requirements.
Columns may not add up to 100% due to rounding.
21

Harper College Fact Book 2019-2020
Chapter III: Credit Students
Exhibit 3.4. Gender of Fall Credit Students
Gender Fall 2015 Fall 2016 Fall 2017 Fall 2018 Fall 2019
N % N % N % N % N %
Male 6,635 45.7% 6,403 45.3% 6,226 45.3% 6,130 45.3% 6,118 45.4%
Female 7,897 54.3% 7,739 54.7% 7,523 54.7% 7,400 54.7% 7,359 54.6%
Total 14,532 14,142 13,749 13,530 13,477
Source: ICCB E1 Files (10th Day Enrollment)
Official counts submitted to ICCB may differ from counts reported by Enrollment Services (Registrar) due to different reporting requirements. Columns may not add up to 100% due to rounding.
22
Harper College Fact Book 2019-2020
Chapter III: Credit Students
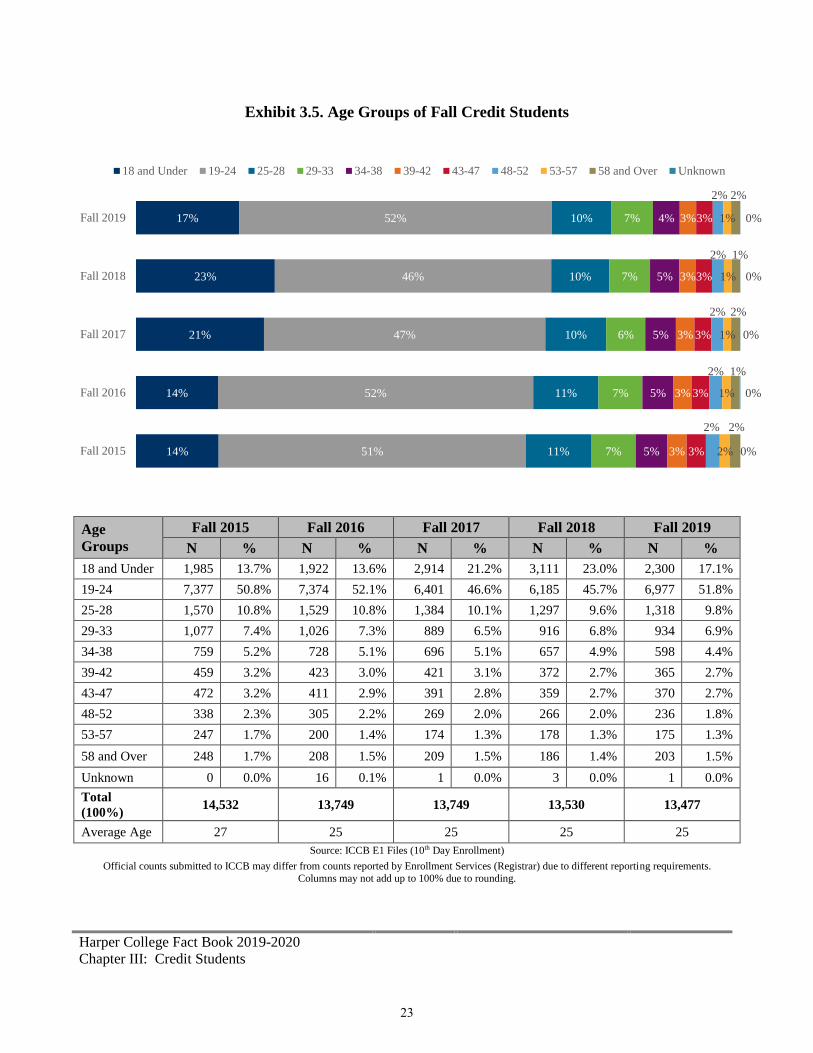
Exhibit 3.5. Age Groups of Fall Credit Students
Age
Groups
Fall 2015 Fall 2016 Fall 2017 Fall 2018 Fall 2019
N % N % N % N % N %
18 and Under 1,985 13.7% 1,922 13.6% 2,914 21.2% 3,111 23.0% 2,300 17.1%
19-24 7,377 50.8% 7,374 52.1% 6,401 46.6% 6,185 45.7% 6,977 51.8%
25-28 1,570 10.8% 1,529 10.8% 1,384 10.1% 1,297 9.6% 1,318 9.8%
29-33 1,077 7.4% 1,026 7.3% 889 6.5% 916 6.8% 934 6.9%
34-38 759 5.2% 728 5.1% 696 5.1% 657 4.9% 598 4.4%
39-42 459 3.2% 423 3.0% 421 3.1% 372 2.7% 365 2.7%
43-47 472 3.2% 411 2.9% 391 2.8% 359 2.7% 370 2.7%
48-52 338 2.3% 305 2.2% 269 2.0% 266 2.0% 236 1.8%
53-57 247 1.7% 200 1.4% 174 1.3% 178 1.3% 175 1.3%
58 and Over 248 1.7% 208 1.5% 209 1.5% 186 1.4% 203 1.5%
Unknown 0 0.0% 16 0.1% 1 0.0% 3 0.0% 1 0.0%
Total
(100%) 14,532 13,749 13,749 13,530 13,477
Average Age 27 25 25 25 25
Source: ICCB E1 Files (10th Day Enrollment)
Official counts submitted to ICCB may differ from counts reported by Enrollment Services (Registrar) due to different reporting requirements.
Columns may not add up to 100% due to rounding.
14%
14%
21%
23%
17%
51%
52%
47%
46%
52%
11%
11%
10%
10%
10%
7%
7%
6%
7%
7%
5%
5%
5%
5%
4%
3%
3%
3%
3%
3%
3%
3%
3%
3%
3%
2%
2%
2%
2%
2%
2%
1%
1%
1%
1%
2%
1%
2%
1%
2%
0%
0%
0%
0%
0%
Fall 2015
Fall 2016
Fall 2017
Fall 2018
Fall 2019
18 and Under 19-24 25-28 29-33 34-38 39-42 43-47 48-52 53-57 58 and Over Unknown
23

Harper College Fact Book 2019-2020
Chapter III: Credit Students
Exhibit 3.6. Race/Ethnicity of Fall Credit Students
Race/Ethnicity Fall 2015 Fall 2016 Fall 2017 Fall 2018 Fall 2019
N % N % N % N % N %
American Indian
or Alaskan Native 17 0.1% 14 0.1% 19 0.1% 28 0.2% 30 0.2%
Asian 1,519 10.5% 1,498 10.6% 1,669 12.1% 1,743 12.9% 1,665 12.4%
Black or African
American 573 3.9% 587 4.2% 536 3.9% 546 4.0% 551 4.1%
Hispanic or
Latino 3,767 25.9% 3,816 27.0% 3,708 27.0% 3,824 28.3% 3,946 29.3%
Native Hawaiian
or Other Pacific
Islander
67 0.5% 25 0.2% 11 0.1% 4 0.0% 5 0.0%
White 7,819 53.8% 7,410 52.4% 7,037 51.2% 6,704 49.5% 6,560 48.7%
Multi-Racial 351 2.4% 364 2.6% 278 2.0% 301 2.2% 309 2.3%
International 91 0.6% 108 0.8% 126 0.9% 91 0.7% 101 0.7%
Unknown 328 2.3% 320 2.3% 365 2.7% 289 2.1% 310 2.3%
Total (100%) 14,532 14,142 13,749 13,530 13,477
Source: ICCB E1 Files (10th Day Enrollment)
Official counts submitted to ICCB may differ from counts reported by Enrollment Services (Registrar) due to different reporting requirements.
Columns may not add up to 100% due to rounding.
10%
11%
12%
13%
12.4%
4%
4%
4%
4%
4.1%
26%
27%
27%
28%
29.3%
0%
54%
52%
51%
50%
48.7%
2%
3%
2%
2%
2.3%
1%
1%
1%
0.7%
2%
2%
3%
2%
2.3%
Fall 2015
Fall 2016
Fall 2017
Fall 2018
Fall 2019
American Indian or Alaskan Native Asian Black or African AmericanHispanic or Latino Native Hawaiian or Other Pacific Islander WhiteMulti-Racial International Unknown
24

Harper College Fact Book 2019-2020
Chapter III: Credit Students
Exhibit 3.7. Credit Students from In-District High Schools
Rank In-District High School Fall 2019
Enrollment
Percent of
Harper’s Total
Fall 2019
Enrollment
1 Palatine High School 936 6.9%
2 James B Conant High School 875 6.5%
3 Schaumburg High School 814 6.0%
4 Hoffman Estates High School 701 5.2%
5 Elk Grove High School 671 5.0%
6 Barrington Community High School 637 4.7%
7 Rolling Meadows High School 602 4.4%
8 Wheeling High School 597 4.4%
9 William Fremd High School 584 4.3%
10 Buffalo Grove High School 570 4.2%
11 Prospect High School 498 3.7%
12 John Hersey High School 494 3.7%
13 Cary Grove High School* 90 0.7%
14 Saint Viator High School 56 0.4%
Total 8,125 60.1% Source: ICCB E1 Files & Banner System
*There is a small number of Cary Grove students who live in Harper's district.
Official counts submitted to ICCB may differ from counts reported by Enrollment Services due to different reporting
requirements.
Exhibit 3.8. Credit Students from Top 10 Out-of-District High Schools
Rank Out-of-District High School Fall 2019
Enrollment
Percent of
Harper’s Total
Fall 2019
Enrollment
1 Streamwood High School 166 1.2%
2 Lake Zurich Senior High School 135 1.0%
3 Huntley High School 109 0.8%
4 Dundee-Crown High School 98 0.7%
5 Adlai E Stevenson High School 85 0.6%
6 Maine West High School 84 0.6%
7 Harry D Jacobs High School 79 0.6%
8 Lake Park High School 108 64 0.5%
9 Bartlett High School 57 0.4%
10 Maine Township High School East 56 0.4%
Total 933 6.9%
Source: ICCB E1 Files & Banner System
Official counts submitted to ICCB may differ from counts reported by Enrollment Services due to different reporting requirements.
.
25

Harper College Fact Book 2019-2020
Chapter III: Credit Students
Fiscal Year Profiles of Enrolled Credit Students
Exhibit 3.9. Annual Credit Student Headcounts by Fiscal Year and Semester
2014-15 2015-16 2016-17 2017-18 2018-19
Annual Number of Students 25,060 25,409 25,158 23,618 23,591
Number of Students by
Semester
Summer 8,930 8,730 8,018 7,688 7,435
Fall 15,797 15,270 14,893 14,433 14,175
Spring 16,341 16,662 16,890 15,804 15,988 Source: ICCB A1 Files
Official counts submitted to ICCB may differ from counts reported by Enrollment Services due to different reporting requirements.
A1 files represent end of term enrollment. Annual count is unduplicated. Semester counts are duplicative.
8,930
15,79716,341
25,060
8,730
15,270
16,662
25,409
8,018
14,893
16,890
25,158
7,688
14,433
15,804
23,618
7,435
14,175
15,988
23,591
Summer Fall Spring Annual
2014-15 2015-16 2016-17 2017-18 2018-19
26

Harper College Fact Book 2019-2020
Chapter III: Credit Students
Exhibit 3.10. Full-Time Equivalent (FTE) by Fiscal Year and Semester
2014-15 2015-16 2016-17 2017-18 2018-19
Credit
Hours FTE
Credit
Hours FTE
Credit
Hours FTE
Credit
Hours FTE
Credit
Hours FTE
Annual
Number of
FTE Students
306,703
10,223
298,527
9,951
290,038
9,668
281,149
9,372
274,815
9,161
Summer
39,770
6,628
38,430
6,405
35,072
5,845
33,674
5,612
33,009
5,501
Fall
136,257
9,084
131,125
8,742
127,003
8,467
123,632
8,242
120,227
8,015
Spring
130,676
8,711
128,973
8,598
127,963
8,531
123,844
8,256
121,580
8,105 Source: ICCB AC Files
Official counts submitted to ICCB may differ from counts reported by Enrollment Services due to different reporting requirements.
Full Time Equivalent (FTE) for Fall and Spring is the number of credit hours divided by 15; for Summer, FTE is the number of credit hours divided by 6.
Annualized FTE is calculated as the sum of credit hours divided by 30.
306,703298,527
290,038281,149 274,815
10,2239,951
9,6689,372 9,161
0
2,000
4,000
6,000
8,000
10,000
12,000
0
50,000
100,000
150,000
200,000
250,000
300,000
350,000
2014-15 2015-16 2016-17 2017-18 2018-19
Credit Hours FTE
27
Harper College Fact Book 2019-2020
Chapter III: Credit Students
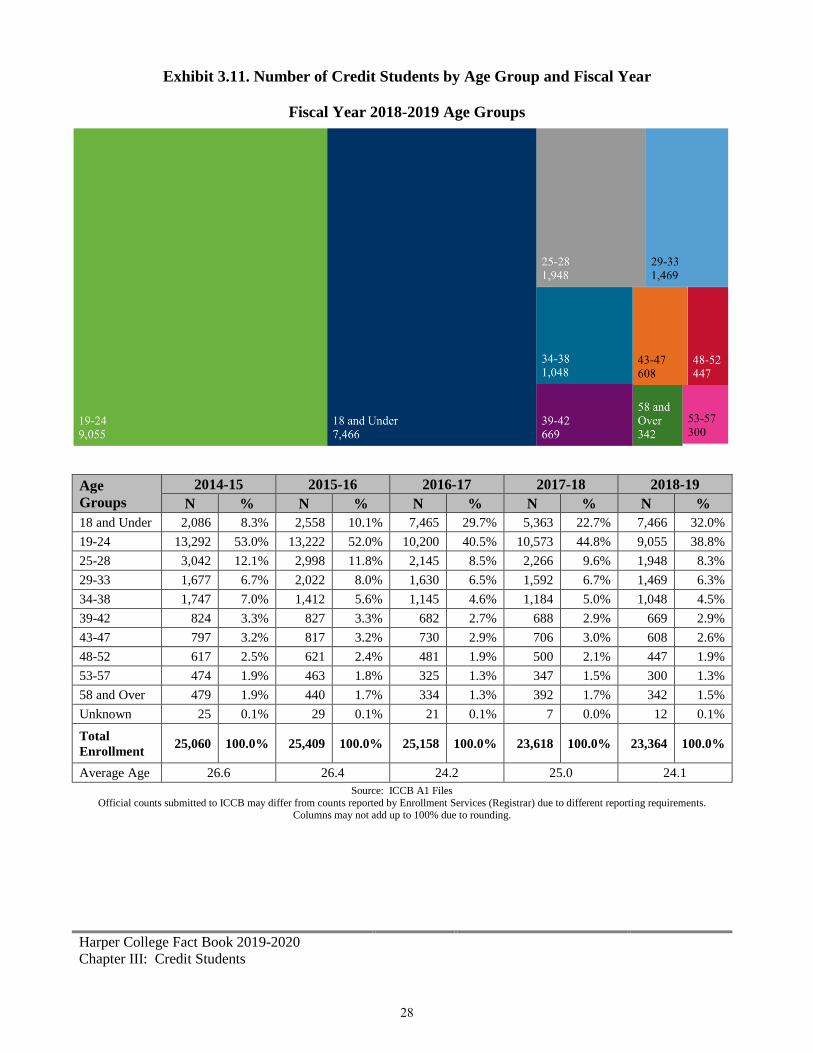
Exhibit 3.11. Number of Credit Students by Age Group and Fiscal Year
Fiscal Year 2018-2019 Age Groups
Age
Groups
2014-15 2015-16 2016-17 2017-18 2018-19
N % N % N % N % N %
18 and Under 2,086 8.3% 2,558 10.1% 7,465 29.7% 5,363 22.7% 7,466 32.0%
19-24 13,292 53.0% 13,222 52.0% 10,200 40.5% 10,573 44.8% 9,055 38.8%
25-28 3,042 12.1% 2,998 11.8% 2,145 8.5% 2,266 9.6% 1,948 8.3%
29-33 1,677 6.7% 2,022 8.0% 1,630 6.5% 1,592 6.7% 1,469 6.3%
34-38 1,747 7.0% 1,412 5.6% 1,145 4.6% 1,184 5.0% 1,048 4.5%
39-42 824 3.3% 827 3.3% 682 2.7% 688 2.9% 669 2.9%
43-47 797 3.2% 817 3.2% 730 2.9% 706 3.0% 608 2.6%
48-52 617 2.5% 621 2.4% 481 1.9% 500 2.1% 447 1.9%
53-57 474 1.9% 463 1.8% 325 1.3% 347 1.5% 300 1.3%
58 and Over 479 1.9% 440 1.7% 334 1.3% 392 1.7% 342 1.5%
Unknown 25 0.1% 29 0.1% 21 0.1% 7 0.0% 12 0.1%
Total
Enrollment 25,060 100.0% 25,409 100.0% 25,158 100.0% 23,618 100.0% 23,364 100.0%
Average Age 26.6 26.4 24.2 25.0 24.1
Source: ICCB A1 Files
Official counts submitted to ICCB may differ from counts reported by Enrollment Services (Registrar) due to different reporting requirements. Columns may not add up to 100% due to rounding.
28
Harper College Fact Book 2019-2020
Chapter III: Credit Students
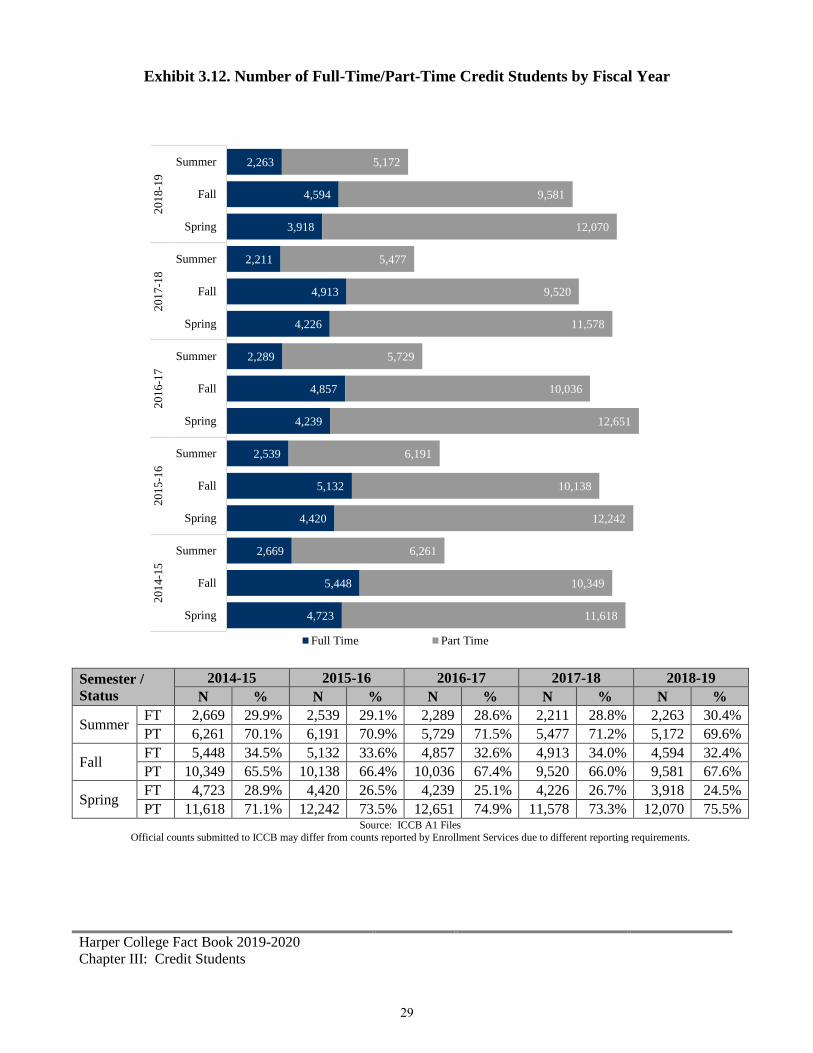
Exhibit 3.12. Number of Full-Time/Part-Time Credit Students by Fiscal Year
Semester /
Status
2014-15 2015-16 2016-17 2017-18 2018-19
N % N % N % N % N %
Summer FT 2,669 29.9% 2,539 29.1% 2,289 28.6% 2,211 28.8% 2,263 30.4%
PT 6,261 70.1% 6,191 70.9% 5,729 71.5% 5,477 71.2% 5,172 69.6%
Fall FT 5,448 34.5% 5,132 33.6% 4,857 32.6% 4,913 34.0% 4,594 32.4%
PT 10,349 65.5% 10,138 66.4% 10,036 67.4% 9,520 66.0% 9,581 67.6%
Spring FT 4,723 28.9% 4,420 26.5% 4,239 25.1% 4,226 26.7% 3,918 24.5%
PT 11,618 71.1% 12,242 73.5% 12,651 74.9% 11,578 73.3% 12,070 75.5% Source: ICCB A1 Files
Official counts submitted to ICCB may differ from counts reported by Enrollment Services due to different reporting requirements.
4,723
5,448
2,669
4,420
5,132
2,539
4,239
4,857
2,289
4,226
4,913
2,211
3,918
4,594
2,263
11,618
10,349
6,261
12,242
10,138
6,191
12,651
10,036
5,729
11,578
9,520
5,477
12,070
9,581
5,172
Spring
Fall
Summer
Spring
Fall
Summer
Spring
Fall
Summer
Spring
Fall
Summer
Spring
Fall
Summer2
01
4-1
52
01
5-1
62
01
6-1
72
01
7-1
82
01
8-1
9
Full Time Part Time
29
Harper College Fact Book 2019-2020
Chapter III: Credit Students
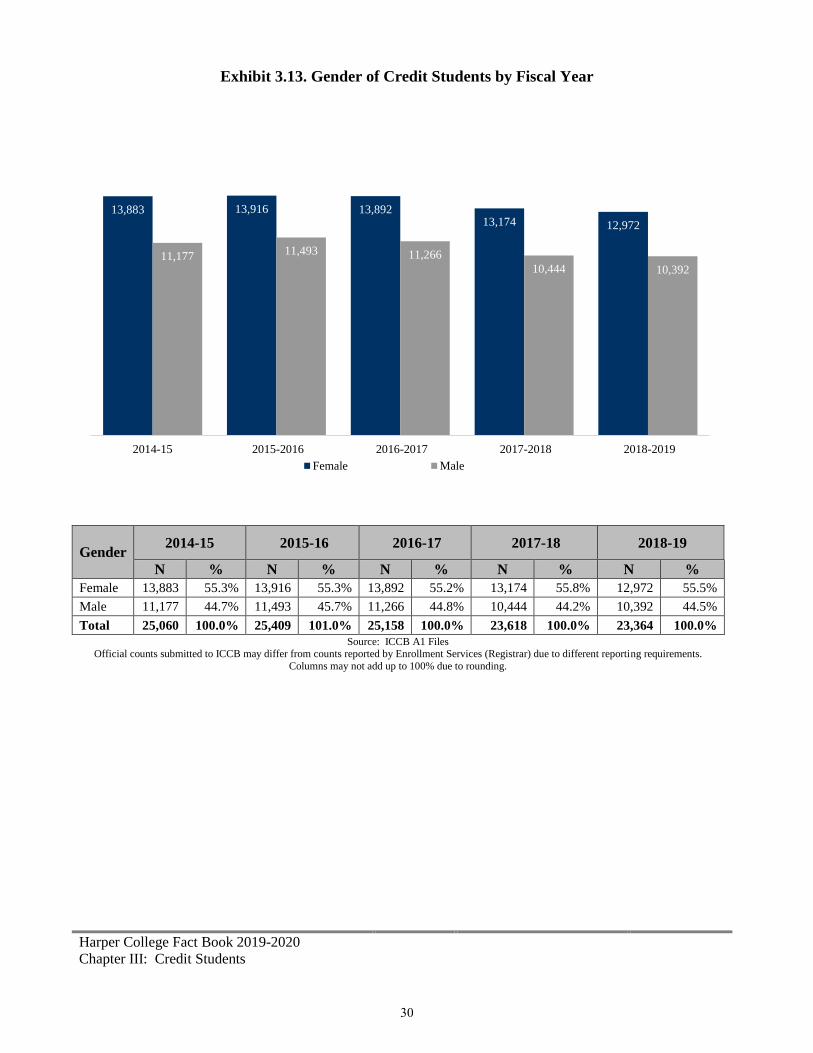
Exhibit 3.13. Gender of Credit Students by Fiscal Year
Gender 2014-15 2015-16 2016-17 2017-18 2018-19
N % N % N % N % N %
Female 13,883 55.3% 13,916 55.3% 13,892 55.2% 13,174 55.8% 12,972 55.5%
Male 11,177 44.7% 11,493 45.7% 11,266 44.8% 10,444 44.2% 10,392 44.5%
Total 25,060 100.0% 25,409 101.0% 25,158 100.0% 23,618 100.0% 23,364 100.0%
Source: ICCB A1 Files Official counts submitted to ICCB may differ from counts reported by Enrollment Services (Registrar) due to different reporting requirements.
Columns may not add up to 100% due to rounding.
13,883 13,916 13,89213,174 12,972
11,17711,493 11,266
10,444 10,392
2014-15 2015-2016 2016-2017 2017-2018 2018-2019
Female Male
30

Harper College Fact Book 2019-2020
Chapter III: Credit Students
Exhibit 3.14. Race/Ethnicity of Credit Students by Fiscal Year
Race/Ethnicity 2014-15 2015-16 2016-17 2017-18 2018-19
N % N % N % N % N % American Indian
or Alaskan Native
41 0.2%
38 0.1%
41 0.2%
45 0.2%
47 0.2%
Asian
2,633 10.5%
2,845 11.2%
3,017 12.0%
3,047 12.9%
3,274 14.0%
Black or African
American
980 3.9%
1,007 4.0%
1,022 4.1%
962 4.1%
979 4.2%
Hispanic or Latino
5,776 23.0%
6,335 24.9%
6,243 24.8%
5,938 25.1%
6,144 26.3%
Native Hawaiian
or Other Pacific
Islander
67 0.3%
48 0.2%
27 0.1%
16 0.1%
12 0.1%
White
14,072 56.2%
13,687 53.9%
13,251 52.7%
12,074 51.1%
11,564 49.5%
Multi-Racial
558 2.2%
501 2.0%
541 2.2%
523 2.2%
525 2.2%
International
148 0.6%
135 0.5%
148 0.6%
157 0.7%
126 0.5%
Unknown
785 3.1%
813 3.2%
868 3.5%
856 3.6%
693 3.0%
Total 25,060 100.0% 25,409 100.0% 25,158 100.0% 23,618 100.0% 23,364 100.0% Source: ICCB A1 Files
Official counts submitted to ICCB may differ from counts reported by Enrollment Services due to different reporting requirements.
Columns may not add up to 100% due to rounding.
11%
11%
12%
13%
14%
4%
4%
4%
4%
4%
23%
25%
25%
25%
26%
56%
54%
53%
51%
49%
2%
2%
2%
2%
2%
1%
1%
1%
1%
3%
3%
3%
4%
3%
2014-15
2015-16
2016-17
2017-18
2018-19
American Indian or Alaskan Native Asian Black or African American
Hispanic or Latino Native Hawaiian or Other Pacific Islander White
Multi-Racial International Unknown
31

Harper College Fact Book 2019-2020
Chapter III: Credit Students
Exhibit 3.15. Degrees and Certificates Awarded by Fiscal Year
FY15 FY16 FY17 FY18 FY19
Degrees 1,620 1,611 1,789 1,754 1,944
Certificates 2,037 1,845 1,818 1,757 2,172
Total 3,657 3,456 3,607 3,511 4,116
Source: ICCB A2 Files for FY16, FY17, FY18, and FY19; previous years were based on A1 Files Official counts submitted to ICCB may differ from counts reported by Enrollment Services due to different reporting requirements.
Exhibit 3.16. Types of Degrees Awarded by Fiscal Year
Degrees 2014-15 2015-16 2016-17 2017-18 2018-19
Associate in Arts (AA) 892 921 944 863 865
Associate in Applied Science (AAS) 485 417 466 467 537
Associate in Engineering Science (AES) 9 15 22 43 37
Associate in Fine Arts - Art (AFA-A) 7 1 2 3 2
Associate in Fine Arts - Music (AFA-M) 0 5 7 2 4
Associate of General Studies (AGS) 68 86 133 89 112
Associate in Science (AS) 159 166 215 287 387
Total 1,620 1,611 1,789 1,754 1,944
Source: ICCB A2 Files for FY16, FY17, FY18, and FY19; previous years were based on A1 Files requirements
Official counts submitted to ICCB may differ from counts reported by Enrollment Services due to different reporting requirements.
55%
57%
53%
49%
44%
30%
26%
26%
27%
28%
1%
1%
1%
2%
2…
0%
0%
0%
0%
0…
0%
0%
0…
4%
5%
7%
5%
6%
10%
10%
12%
16%
20%
2014-
15
2015-
16
2016-
17
2017-
18
2018-
19
Associate in Arts (AA) Associate in Applied Science (AAS) Associate in Engineering Science (AES)Associate in Fine Arts - Art (AFA-A) Associate in Fine Arts - Music (AFA-M) Associate of General Studies (AGS)Associate in Science (AS)
32
Harper College Fact Book 2019-2020
Chapter III: Credit Students
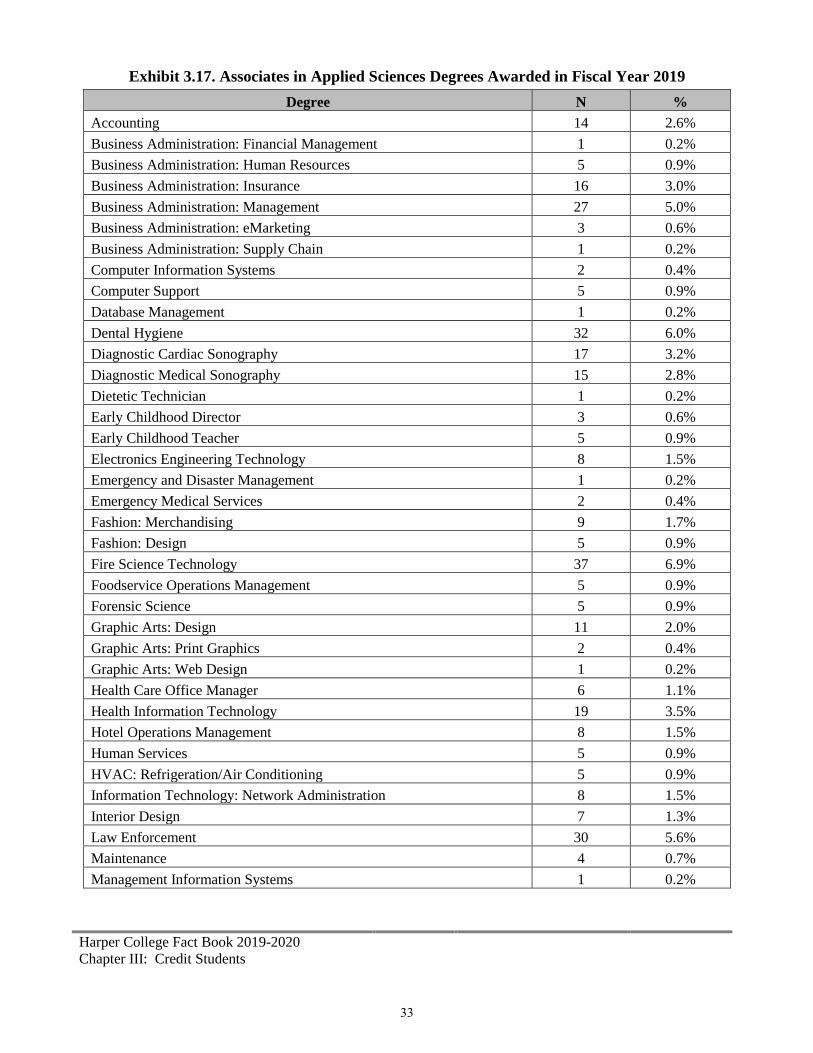
Exhibit 3.17. Associates in Applied Sciences Degrees Awarded in Fiscal Year 2019
Degree N %
Accounting 14 2.6%
Business Administration: Financial Management 1 0.2%
Business Administration: Human Resources 5 0.9%
Business Administration: Insurance 16 3.0%
Business Administration: Management 27 5.0%
Business Administration: eMarketing 3 0.6%
Business Administration: Supply Chain 1 0.2%
Computer Information Systems 2 0.4%
Computer Support 5 0.9%
Database Management 1 0.2%
Dental Hygiene 32 6.0%
Diagnostic Cardiac Sonography 17 3.2%
Diagnostic Medical Sonography 15 2.8%
Dietetic Technician 1 0.2%
Early Childhood Director 3 0.6%
Early Childhood Teacher 5 0.9%
Electronics Engineering Technology 8 1.5%
Emergency and Disaster Management 1 0.2%
Emergency Medical Services 2 0.4%
Fashion: Merchandising 9 1.7%
Fashion: Design 5 0.9%
Fire Science Technology 37 6.9%
Foodservice Operations Management 5 0.9%
Forensic Science 5 0.9%
Graphic Arts: Design 11 2.0%
Graphic Arts: Print Graphics 2 0.4%
Graphic Arts: Web Design 1 0.2%
Health Care Office Manager 6 1.1%
Health Information Technology 19 3.5%
Hotel Operations Management 8 1.5%
Human Services 5 0.9%
HVAC: Refrigeration/Air Conditioning 5 0.9%
Information Technology: Network Administration 8 1.5%
Interior Design 7 1.3%
Law Enforcement 30 5.6%
Maintenance 4 0.7%
Management Information Systems 1 0.2%
33
Harper College Fact Book 2019-2020
Chapter III: Credit Students
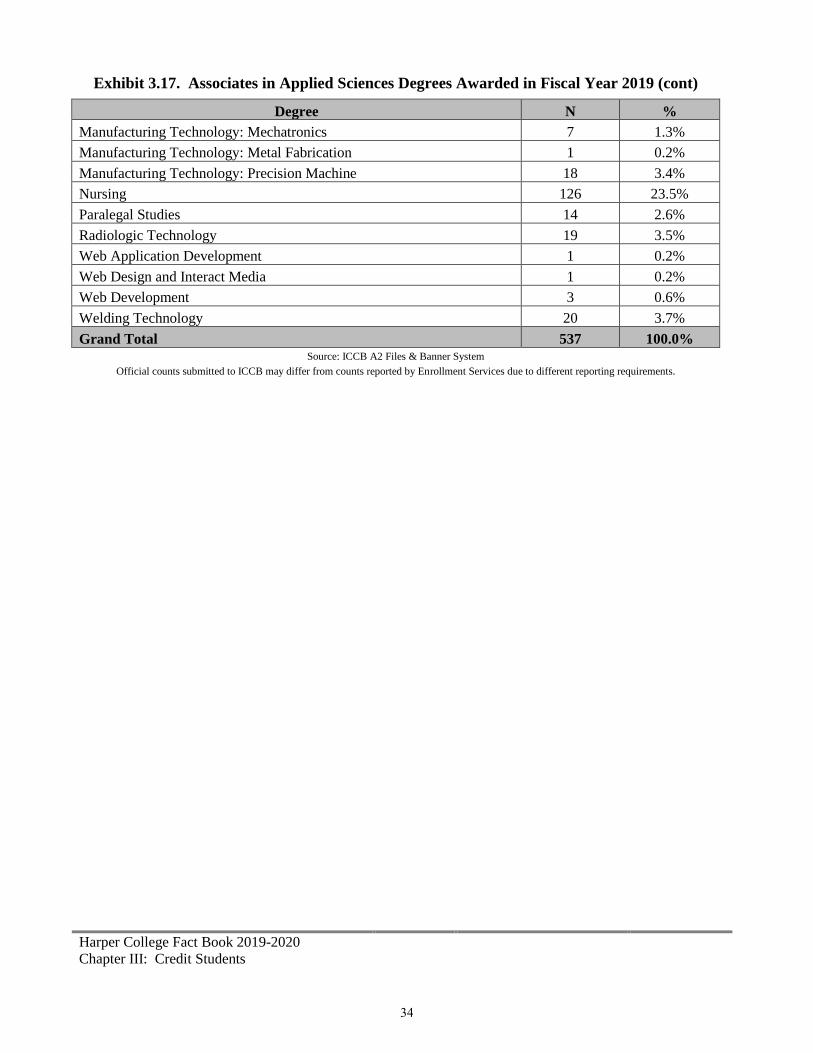
Exhibit 3.17. Associates in Applied Sciences Degrees Awarded in Fiscal Year 2019 (cont)
Degree N %
Manufacturing Technology: Mechatronics 7 1.3%
Manufacturing Technology: Metal Fabrication 1 0.2%
Manufacturing Technology: Precision Machine 18 3.4%
Nursing 126 23.5%
Paralegal Studies 14 2.6%
Radiologic Technology 19 3.5%
Web Application Development 1 0.2%
Web Design and Interact Media 1 0.2%
Web Development 3 0.6%
Welding Technology 20 3.7%
Grand Total 537 100.0% Source: ICCB A2 Files & Banner System
Official counts submitted to ICCB may differ from counts reported by Enrollment Services due to different reporting requirements.
34
Harper College Fact Book 2019-2020
Chapter III: Credit Students
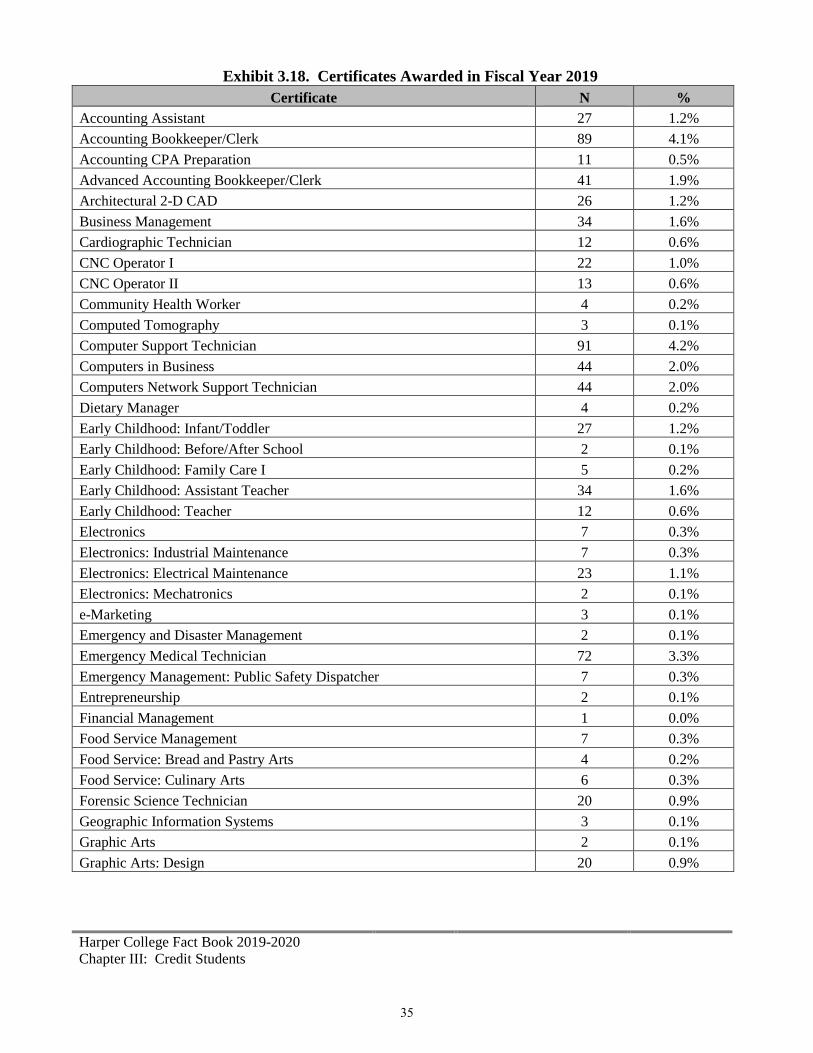
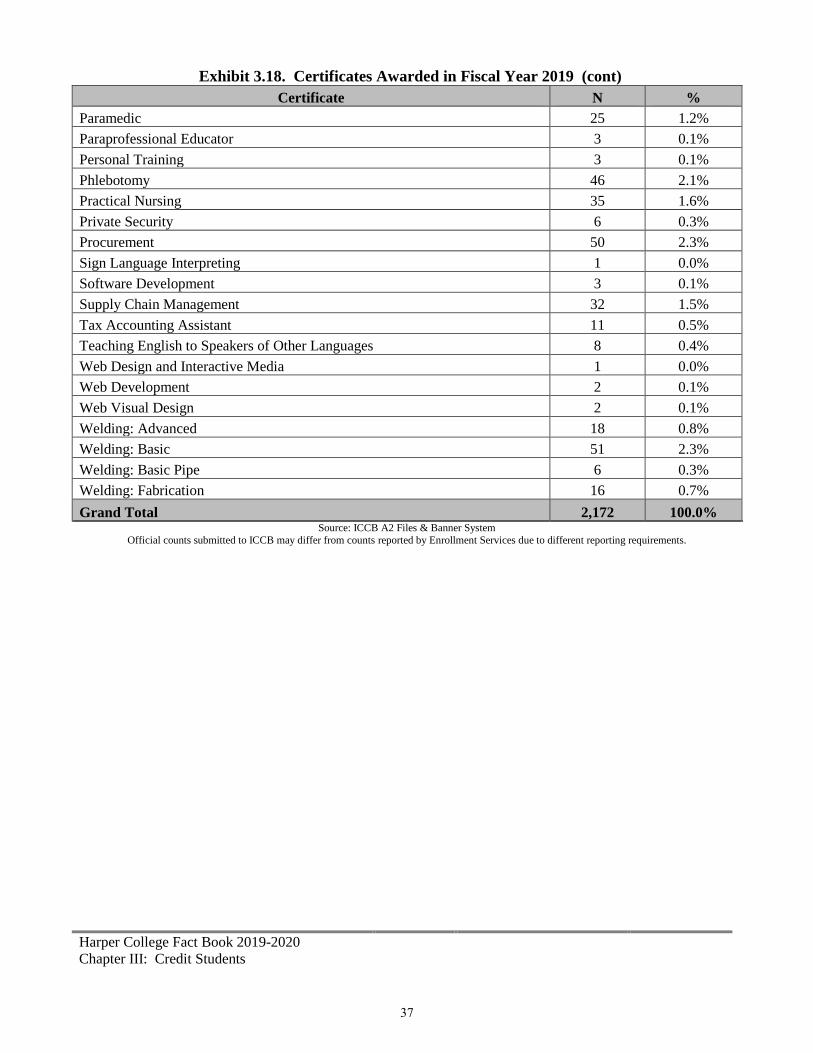
Exhibit 3.18. Certificates Awarded in Fiscal Year 2019
Certificate N %
Accounting Assistant 27 1.2%
Accounting Bookkeeper/Clerk 89 4.1%
Accounting CPA Preparation 11 0.5%
Advanced Accounting Bookkeeper/Clerk 41 1.9%
Architectural 2-D CAD 26 1.2%
Business Management 34 1.6%
Cardiographic Technician 12 0.6%
CNC Operator I 22 1.0%
CNC Operator II 13 0.6%
Community Health Worker 4 0.2%
Computed Tomography 3 0.1%
Computer Support Technician 91 4.2%
Computers in Business 44 2.0%
Computers Network Support Technician 44 2.0%
Dietary Manager 4 0.2%
Early Childhood: Infant/Toddler 27 1.2%
Early Childhood: Before/After School 2 0.1%
Early Childhood: Family Care I 5 0.2%
Early Childhood: Assistant Teacher 34 1.6%
Early Childhood: Teacher 12 0.6%
Electronics 7 0.3%
Electronics: Industrial Maintenance 7 0.3%
Electronics: Electrical Maintenance 23 1.1%
Electronics: Mechatronics 2 0.1%
e-Marketing 3 0.1%
Emergency and Disaster Management 2 0.1%
Emergency Medical Technician 72 3.3%
Emergency Management: Public Safety Dispatcher 7 0.3%
Entrepreneurship 2 0.1%
Financial Management 1 0.0%
Food Service Management 7 0.3%
Food Service: Bread and Pastry Arts 4 0.2%
Food Service: Culinary Arts 6 0.3%
Forensic Science Technician 20 0.9%
Geographic Information Systems 3 0.1%
Graphic Arts 2 0.1%
Graphic Arts: Design 20 0.9%
35
Harper College Fact Book 2019-2020
Chapter III: Credit Students
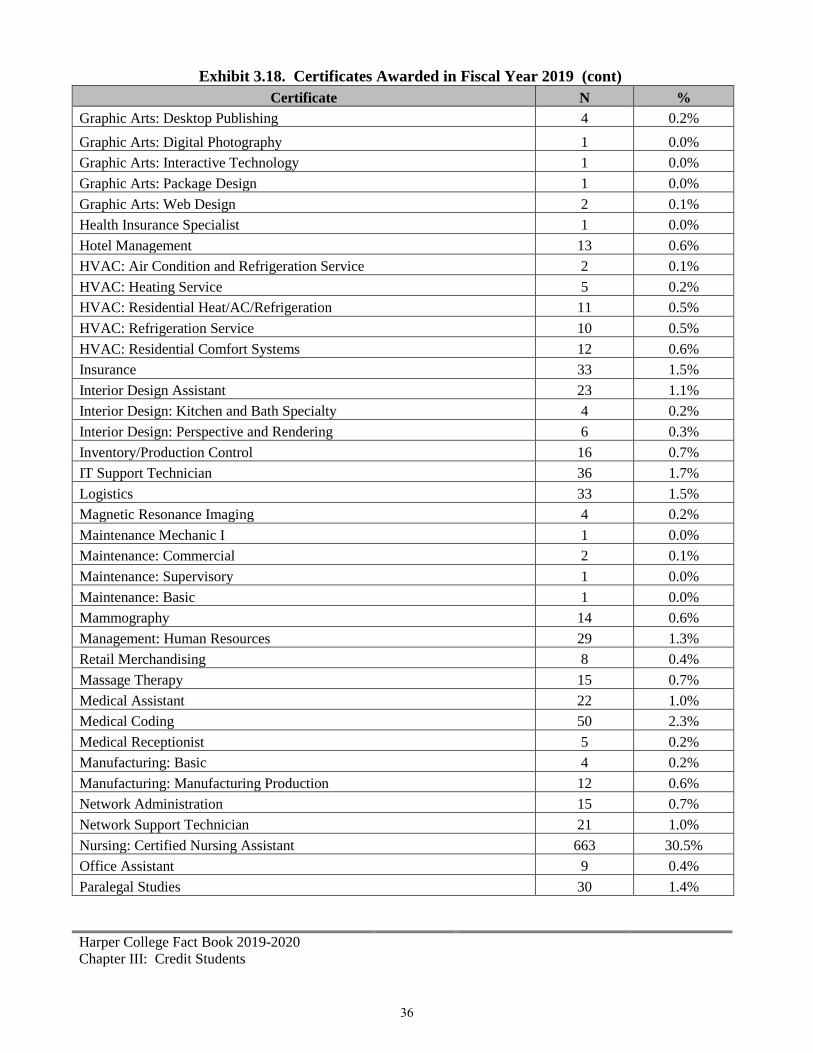
Exhibit 3.18. Certificates Awarded in Fiscal Year 2019 (cont)
Certificate N %
Graphic Arts: Desktop Publishing 4 0.2%
Graphic Arts: Digital Photography 1 0.0%
Graphic Arts: Interactive Technology 1 0.0%
Graphic Arts: Package Design 1 0.0%
Graphic Arts: Web Design 2 0.1%
Health Insurance Specialist 1 0.0%
Hotel Management 13 0.6%
HVAC: Air Condition and Refrigeration Service 2 0.1%
HVAC: Heating Service 5 0.2%
HVAC: Residential Heat/AC/Refrigeration 11 0.5%
HVAC: Refrigeration Service 10 0.5%
HVAC: Residential Comfort Systems 12 0.6%
Insurance 33 1.5%
Interior Design Assistant 23 1.1%
Interior Design: Kitchen and Bath Specialty 4 0.2%
Interior Design: Perspective and Rendering 6 0.3%
Inventory/Production Control 16 0.7%
IT Support Technician 36 1.7%
Logistics 33 1.5%
Magnetic Resonance Imaging 4 0.2%
Maintenance Mechanic I 1 0.0%
Maintenance: Commercial 2 0.1%
Maintenance: Supervisory 1 0.0%
Maintenance: Basic 1 0.0%
Mammography 14 0.6%
Management: Human Resources 29 1.3%
Retail Merchandising 8 0.4%
Massage Therapy 15 0.7%
Medical Assistant 22 1.0%
Medical Coding 50 2.3%
Medical Receptionist 5 0.2%
Manufacturing: Basic 4 0.2%
Manufacturing: Manufacturing Production 12 0.6%
Network Administration 15 0.7%
Network Support Technician 21 1.0%
Nursing: Certified Nursing Assistant 663 30.5%
Office Assistant 9 0.4%
Paralegal Studies 30 1.4%
36
Harper College Fact Book 2019-2020
Chapter III: Credit Students
Exhibit 3.18. Certificates Awarded in Fiscal Year 2019 (cont)
Certificate N %
Paramedic 25 1.2%
Paraprofessional Educator 3 0.1%
Personal Training 3 0.1%
Phlebotomy 46 2.1%
Practical Nursing 35 1.6%
Private Security 6 0.3%
Procurement 50 2.3%
Sign Language Interpreting 1 0.0%
Software Development 3 0.1%
Supply Chain Management 32 1.5%
Tax Accounting Assistant 11 0.5%
Teaching English to Speakers of Other Languages 8 0.4%
Web Design and Interactive Media 1 0.0%
Web Development 2 0.1%
Web Visual Design 2 0.1%
Welding: Advanced 18 0.8%
Welding: Basic 51 2.3%
Welding: Basic Pipe 6 0.3%
Welding: Fabrication 16 0.7%
Grand Total 2,172 100.0% Source: ICCB A2 Files & Banner System
Official counts submitted to ICCB may differ from counts reported by Enrollment Services due to different reporting requirements.
37

Harper College Fact Book 2019-2020
Chapter III: Credit Students
Exhibit 3.19. Gender of Students Awarded Degrees or Certificates
FY15 FY16 FY17 FY18 FY19
N % N % N % N % N %
Female 1,860 59.0% 1,853 60.2% 1,992 63.4% 1,953 63.6% 2,041 59.8%
Male 1,282 41.0% 1,223 39.8% 1,151 36.6% 1,119 36.4% 1,370 40.2%
Unknown 0 0.0% 0 0.0% 0 0.0% 0 0.0% 0 0.0%
Total 3,142 100.0% 3,076 100.0% 3,143 100.0% 3,072 100.0% 3,411 100.0%
Source: ICCB A2 Files for FY16, FY17, FY18, and FY19; previous years were based on A1 Files
Columns may not add up to 100% due to rounding. Official counts submitted to ICCB may differ from counts reported by Enrollment Services due to different reporting requirements.
59% 60%63% 64%
60%
41% 40%37% 36%
40%
FY15 FY16 FY17 FY18 FY19
Female Male
38

Harper College Fact Book 2019-2020
Chapter III: Credit Students
Exhibit 3.20. Race/Ethnicity of Students Awarded Degrees or Certificates
FY15 FY16 FY17 FY18 FY19
Race/Ethnicity N % N % N % N % N %
American Indian or
Alaskan Native 4 0.1% 2 0.1% 5 0.2% 6 0.2% 9 0.3%
Asian 251 8.0% 281 9.1% 353 11.2% 378 12.3% 423 12.4%
Black or African-American 109 3.5% 99 3.2% 111 3.5% 99 3.2% 109 3.2%
Hispanic or Latino 526 16.7% 535 17.4% 656 20.9% 659 21.5% 780 22.9%
Native Hawaiian or Other
Pacific Islander 10 0.3% 7 0.2% 2 0.1% 1 0.0% 1 0.0%
White 2,088 66.5% 1,717 55.8% 1,854 59.0% 1,781 58.0% 1,934 56.7%
Multi-Racial 60 1.9% 61 2.0% 61 1.9% 65 2.1% 70 2.1%
International 23 0.7% 25 0.8% 27 0.9% 17 0.6% 22 0.6%
Unknown 71 2.3% 349 11.3% 74 2.4% 66 2.1% 63 1.8%
Total 3,142 100.0% 3,076 100.0% 3,143 100.0% 3,072 100.0% 3,411 100.0%
Source: ICCB A2 Files for FY16, FY17, FY18, and FY19; previous years were based on A1 Files
Columns may not add up to 100% due to rounding.
Official counts submitted to ICCB may differ from counts reported by Enrollment Services due to different reporting requirements.
8%
9%
11%
12%
Asian, 12%
3%
3%
4%
3%
Black or African-American,
3%
17%
17%
21%
21%
Hispanic or Latino, 23%
0%
0%
0%
0%
Native Hawaiian or Other
Pacific Islander, 0%
66%
56%
59%
58%
White, 57%
2%
2%
2%
2%
Multi-Racial, 2%
1%
1%
1%
1%
International, 1%
2%
11%
2%
2%
Unknown
, 2%
FY15
FY16
FY17
FY18
FY19
39
Harper College Fact Book 2019-2020
Chapter III: Credit Students
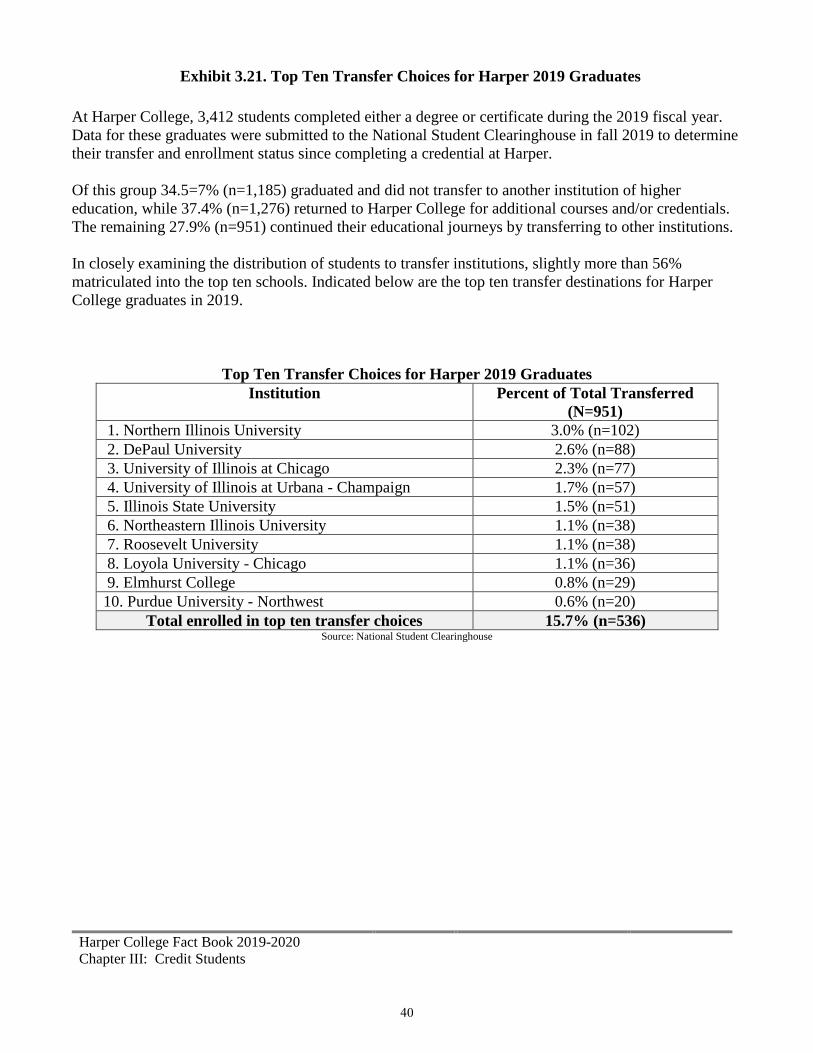
Exhibit 3.21. Top Ten Transfer Choices for Harper 2019 Graduates
At Harper College, 3,412 students completed either a degree or certificate during the 2019 fiscal year.
Data for these graduates were submitted to the National Student Clearinghouse in fall 2019 to determine
their transfer and enrollment status since completing a credential at Harper.
Of this group 34.5=7% (n=1,185) graduated and did not transfer to another institution of higher
education, while 37.4% (n=1,276) returned to Harper College for additional courses and/or credentials.
The remaining 27.9% (n=951) continued their educational journeys by transferring to other institutions.
In closely examining the distribution of students to transfer institutions, slightly more than 56%
matriculated into the top ten schools. Indicated below are the top ten transfer destinations for Harper
College graduates in 2019.
Top Ten Transfer Choices for Harper 2019 Graduates
Institution Percent of Total Transferred
(N=951)
1. Northern Illinois University 3.0% (n=102)
2. DePaul University 2.6% (n=88)
3. University of Illinois at Chicago 2.3% (n=77)
4. University of Illinois at Urbana - Champaign 1.7% (n=57)
5. Illinois State University 1.5% (n=51)
6. Northeastern Illinois University 1.1% (n=38)
7. Roosevelt University 1.1% (n=38)
8. Loyola University - Chicago 1.1% (n=36)
9. Elmhurst College 0.8% (n=29)
10. Purdue University - Northwest 0.6% (n=20)
Total enrolled in top ten transfer choices 15.7% (n=536) Source: National Student Clearinghouse
40

Harper College Fact Book 2019-2020
Chapter III: Credit Students
Credits by Modality
Exhibit 3.22. FY Credit Hours by Modality
Modality FY15 FY16 FY17 FY18 FY19 FY15-19
5 Year Change
Dual-Credit 10,328.0 13,467.0 18,170.5 15,701.0 18,074.5 75.0%
Online 27,693.0 29,450.0 31,943.0 33,578.0 34,902.0 26.0%
Blended 10,629.0 11,391.5 11,867.5 11,023.0 10,924.0 2.8%
All Other 257,161.5 243,361.5 228,054.5 220,847.0 210,914.5 -18.0%
Grand Total 305,811.5 297,670.0 290,035.5 281,149.0 274,815.0 -10.1% Source: ICCB AC Files
Exhibit 3.23. Fall Credit Hours by Modality
Modality Fall 2014 Fall 2015 Fall 2016 Fall 2017 Fall 2018 2014-18
5 Year Change
Dual-Credit 2,148.0 2,273.5 2,793.5 2,584.5 3,448.0 60.5%
Online 9,429.0 10,198.0 11,715.0 11,934.0 12,338.0 30.9%
Blended 3,886.0 4,090.0 4,327.5 3,867.0 3,809.0 -2.0%
All Other 120,661.5 114,512.0 108,166.0 105,246.0 100,632.0 -16.6%
Grand
Total 136,124.5 131,073.5 127,002.0 123,631.5 120,227.0 -11.7%
Source: ICCB AC Files
Exhibit 3.24. Spring Credit Hours by Modality
Modality Spring 2015 Spring 2016 Spring 2017 Spring 2018 Spring 2019 2015-19
5 Year Change
Dual-Credit 8,170.0 11,096.5 15,320.0 13,116.5 14,557.0 60.5%
Online 10,436.0 11,290.0 11,992.0 13,046.0 13,574.0 25.0%
Blended 4,432.0 4,475.5 4,561.0 4,671.0 4,634.0 5.4%
All Other 106,920.0 101,351.5 96,089.0 93,010.0 88,814.5 -13.0%
Grand
Total 129,958.0 128,213.5 127,962.0 123,843.5 121,579.5 -4.7%
Source: ICCB AC Files
41
Harper College Fact Book 2018-2019
Chapter IV: Workforce Solutions
Chapter IV
Workforce Solutions
Continuing Education and Business Outreach
The Workforce Solutions Division section presents a brief description of the division, which is
comprised of Continuing Education, which offers open enrollment courses to the community in career
training and personal enrichment; the Workforce Certification Center; Harper Business Solutions,
which serves local businesses with customized training solutions; Illinois Small Business
Development Center; the Job Placement Resource Center, and the Office of Apprenticeships.
Continuing Education
The Continuing Education Department offers classes designed to promote personal growth and
provide professional development. This unit of the College responds quickly to needs for new
professional skills, trends in leisure activities and advances in technology by providing non-credit and
non-degree credit classes and certificates. Students of all ages, from children through older adults, are
offered classes that enrich and enhance their lives. Day and evening classes are offered at the main
campus and several extension sites within the College’s district.
The following section describes Continuing Education students by program, gender, age group and
ethnicity. Additional tables describe the same characteristics segmented by career training and
personal enrichment, and the new course creation ratio.
42

Harper College Fact Book 2019-2020
Chapter IV: Workforce Solutions
Exhibit 4.1. Enrollment of CE Students by Program by Fiscal Year (Duplicated)
Program Area
NC CSC Total NC CSC Total NC CSC Total NC CSC Total NC CSC Total
Career Training 3,483 386 3869 3,254 866 4120 2,811 951 3,762 3,106 788 3,894 1,504 510 2,014
Business Professional
Development 383 386 769 671 317 988 522 466 988 414 345 759 281 261 542
Career Development 17 17 0 0 0 - - 0 - - - - - -
Online Training 147 147 425 425 363 363 455 455 168 - 168
Computer Training 865 247 1,112 648 171 819 591 184 775 470 183 653 350 130 480
Faculty Development 707 67 774 378 55 433 235 99 334 490 109 599 - - -
Harper Business Solutions 75 131 206 110 110 65 65 49 49 - 42 42
Health Care Professionals 1,289 229 1,518 1,127 213 1,340 1,095 137 1,232 1,267 102 1,369 646 77 723
Safety Awareness Training 18 - 18
Small Business Dev. Center 0 0 0 0 0 0 - - 0 - - - - - -
Workforce Certification Center 0 22 22 5 0 5 5 - 5 10 - 10 41 - 41
Personal Cultural Enrichment 19,228 56 19,284 18,496 59 18,555 18,854 49 18,903 18,953 47 19,000 18,167 52 18,219
Community Music and Art
Center1,107 0 1,107 1,800 1,800 1,834 1,834 1,897 - 1,897 1,786 - 1,786
Driver's Education 18 - 18
Healthy Living Exercise Program 174 0 174 61 61 - - 0 - - - - - -
Lifelong Learning Institute 931 - 931
Motorcycle Safety Training 9,140 - 9,140
Personal Enrichment 9,742 56 9,798 8,844 59 8,903 10,959 49 11,008 11,471 47 11,518 780 - 780
Students with Intellectual
Disabilities30 52 82
Mind/Body 524 0 524 550 550 485 485 430 430 419 - 419
Writing Studio 21 - 21
Youth 7,681 0 7,681 7,241 7,241 5,576 5,576 5,155 5,155 5,042 - 5,042
Total 22,711 1,133 23,844 21,750 925 22,675 21,665 1,000 22,665 22,059 835 22,894 19671 562 20,233
Source: Destiny
NC = noncredit CSC = career skills credit (non-degree credit); Career skills credit enrollments are also counted with the general credit student enrollment information in Chapter III;
The enrollments are duplicated in this chapter to give a more complete view of the activities of Continuing Education.
2017-20182015-2016 2016-20172014-15 2018-2019
43

Harper College Fact Book 2019-2020
Chapter IV: Workforce Solutions
Exhibit 4.2. Gender of CE Students by Fiscal Year (Unduplicated)`
Exhibit 4.3. Age Groups of CE Students by Fiscal Year (Unduplicated)
Exhibit 4.4. Race/Ethnicity of CE Students by Fiscal Year (Unduplicated)
N % N % N % N % N %
Female 5,296 43.7% 4,892 41.4% 5,330 39.7% 5,191 37.5% 1,365 10.6%
Male 5,482 45.2% 5,185 43.9% 6,538 48.7% 7,199 52.0% 1,267 9.9%
Unknown 1,353 11.2% 1,744 14.8% 1,567 11.7% 1,452 10.5% 10,213 79.5%
Total 12,131 100.0% 11,821 100.0% 13,435 100.0% 13,842 100.0% 12,845 100.0%
Source: Destiny
2018-20192017-2018Gender
2014-15 2015-2016 2016-2017
N % N % N % N % N %
17 and under 1,722 14.2% 1,722 14.6% 1,539 11.5% 1,272 9.2% 1,355 10.5%
18 106 0.9% 149 1.3% 223 1.7% 232 1.7% 218 1.7%
19-24 1,674 13.8% 1,665 14.1% 2,379 17.7% 2,395 17.3% 2,287 17.8%
25-34 2,603 21.5% 2,608 22.1% 3,363 25.0% 3,621 26.2% 3,404 26.5%
35-44 1,771 14.6% 1,745 14.8% 1,879 14.0% 2,050 14.8% 1,880 14.6%
45-54 1,614 13.3% 1,575 13.3% 1,763 13.1% 1,878 13.6% 1,596 12.4%
55-64 1,330 11.0% 1,183 10.0% 1,193 8.9% 1,337 9.7% 1,168 9.1%
65 and over 1,131 9.3% 958 8.1% 994 7.4% 986 7.1% 911 7.1%
Unknown 180 1.5% 216 1.8% 102 0.8% 71 0.5% 26 0.2%
Total 12,131 100.0% 11,821 100.0% 13,435 100.0% 13,842 100.0% 12,845 100.0%
Source: Destiny
2018-192017-18Age Group
2014-15 2015-16 2016-17
N % N % N % N % N %
American Indian or Alaskan Native 10 0.1% 11 0.1% 4 0.0% 5 0.0% 28 0.2%
Asian 447 3.7% 374 3.2% 312 2.3% 292 2.1% 1,029 8.0%
Black 131 1.1% 115 1.0% 110 0.8% 98 0.7% 975 7.6%
Hispanic 309 2.5% 285 2.4% 303 2.3% 273 2.0% 1,608 12.5%
Multiple N/A N/A N/A N/A N/A N/A N/A N/A 266 2.1%
Native Hawaiian or Other Pacific
Islander 10 0.1% 8 0.1% 10 0.1% 10 0.1% 7 0.1%
Other N/A N/A 567 4.8% 487 3.6% 469 3.4% 783 6.1%
White 2,584 21.3% 2,110 17.8% 1,890 14.1% 1,690 12.2% 5,566 43.3%
Unknown 8,640 71.2% 8,351 70.6% 10,319 76.8% 11,005 79.5% 2,583 20.1%
Total 12,131 100.0% 11,821 100.0% 13,435 100.0% 13,842 100.0% 12,845 100.0%
Source: Destiny
2018-192017-18Race/Ethnicity
2014-15 2015-16 2016-17
44
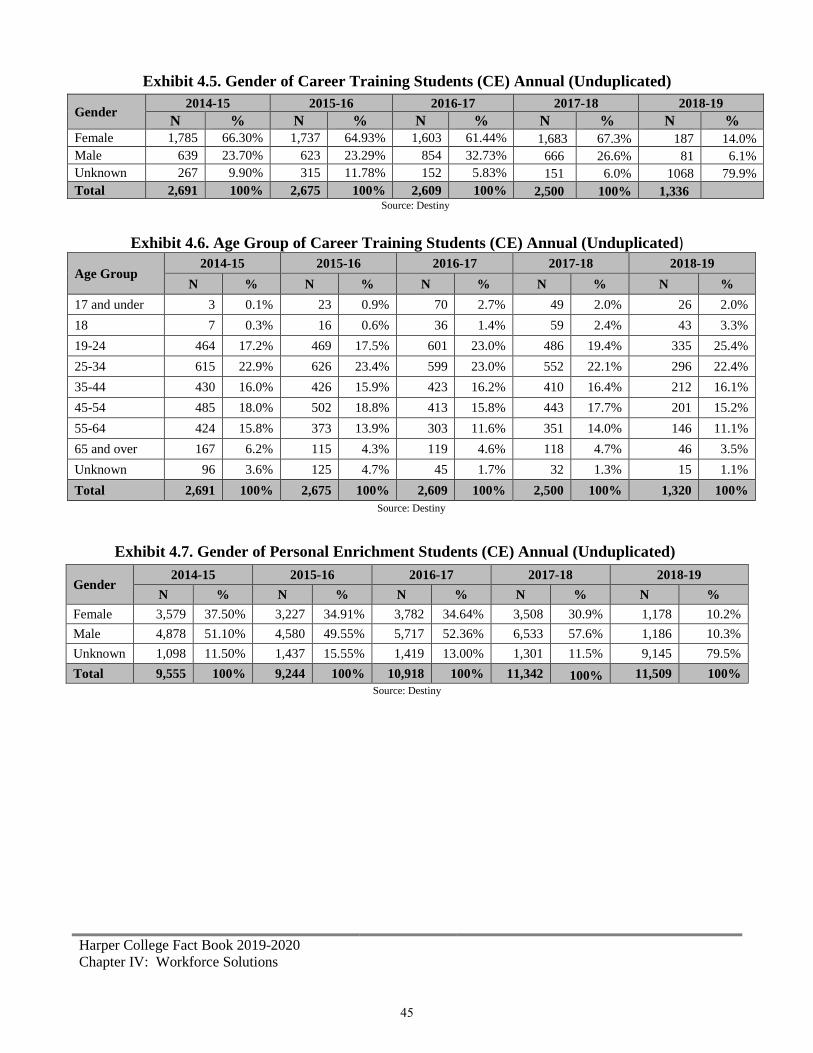
Harper College Fact Book 2019-2020
Chapter IV: Workforce Solutions
Exhibit 4.5. Gender of Career Training Students (CE) Annual (Unduplicated)
Gender 2014-15 2015-16 2016-17 2017-18 2018-19
N % N % N % N % N %
Female 1,785 66.30% 1,737 64.93% 1,603 61.44% 1,683 67.3% 187 14.0%
Male 639 23.70% 623 23.29% 854 32.73% 666 26.6% 81 6.1%
Unknown 267 9.90% 315 11.78% 152 5.83% 151 6.0% 1068 79.9%
Total 2,691 100% 2,675 100% 2,609 100% 2,500 100% 1,336 Source: Destiny
Exhibit 4.6. Age Group of Career Training Students (CE) Annual (Unduplicated)
Age Group 2014-15 2015-16 2016-17 2017-18 2018-19
N % N % N % N % N %
17 and under 3 0.1% 23 0.9% 70 2.7% 49 2.0% 26 2.0%
18 7 0.3% 16 0.6% 36 1.4% 59 2.4% 43 3.3%
19-24 464 17.2% 469 17.5% 601 23.0% 486 19.4% 335 25.4%
25-34 615 22.9% 626 23.4% 599 23.0% 552 22.1% 296 22.4%
35-44 430 16.0% 426 15.9% 423 16.2% 410 16.4% 212 16.1%
45-54 485 18.0% 502 18.8% 413 15.8% 443 17.7% 201 15.2%
55-64 424 15.8% 373 13.9% 303 11.6% 351 14.0% 146 11.1%
65 and over 167 6.2% 115 4.3% 119 4.6% 118 4.7% 46 3.5%
Unknown 96 3.6% 125 4.7% 45 1.7% 32 1.3% 15 1.1%
Total 2,691 100% 2,675 100% 2,609 100% 2,500 100% 1,320 100%
Source: Destiny
Exhibit 4.7. Gender of Personal Enrichment Students (CE) Annual (Unduplicated)
Gender 2014-15 2015-16 2016-17 2017-18 2018-19
N % N % N % N % N %
Female 3,579 37.50% 3,227 34.91% 3,782 34.64% 3,508 30.9% 1,178 10.2%
Male 4,878 51.10% 4,580 49.55% 5,717 52.36% 6,533 57.6% 1,186 10.3%
Unknown 1,098 11.50% 1,437 15.55% 1,419 13.00% 1,301 11.5% 9,145 79.5%
Total 9,555 100% 9,244 100% 10,918 100% 11,342 100% 11,509 100%
Source: Destiny
45

Harper College Fact Book 2019-2020
Chapter IV: Workforce Solutions
Exhibit 4.8. Age Group of Personal Enrichment Students (CE) Annual (Unduplicated)
Age Group 2014-15 2015-16 2016-17 2017-18 2018-19
N % N % N % N % N %
17 and under 1,720 18.0% 1,699 18.4% 1,470 13.5%
1,223 10.8%
1,329 11.5%
18 99 1.0% 134 1.4% 187 1.7%
173 1.5%
175 1.5%
19-24 1,218 12.7% 1,209 13.1% 1,786 16.4%
1,909 16.8%
1,952 16.9%
25-34 2,006 21.0% 2,003 21.7% 2,777 25.4%
3,069 27.1%
3,108 27.0%
35-44 1,359 14.2% 1,325 14.3% 1,472 13.5%
1,640 14.5%
1,668 14.5%
45-54 1,144 12.0% 1,089 11.8% 1,363 12.5%
1,435 12.7%
1,395 12.1%
55-64 928 9.7% 825 8.9% 909 8.3%
986 8.7%
1,022 8.9%
65 and over 991 10.4% 864 9.3% 897 8.2%
868 7.7%
865 7.5%
Unknown 90 0.9% 96 1.0% 57 0.5%
39 0.3%
11 0.1%
Total 9,555 100.0% 9,244 100.0% 10,918 100.0%
11,342 100.0%
11,525 100.0% Source: Destiny
Exhibit 4.9. Annual New Course Creation Ratio
Program Area 2014-15 2015-16 2016-17 2017-18 2018-19
Career Training 285 342 342 367 287
Business Professional Development 88 65 67 71 90
Computer Training 111 118 116 118 64
Faculty Development 46 31 32 27 4
Harper Business Solutions 10 5 1 1 1
Health Care Professionals 30 35 29 26 13
Online Courses 53 93 119 111
Safety Awareness 1
Workforce Certification Center 0 35 4 5 3
Personal Cultural Enrichment 713 773 752 753 568
Community Music and Art Center 178 186 214 243 135
Driver Education 7
Lifelong Learning Institute 92
Harper College Library 9
Healthy Living Exercise Program 1 1 0 0 0
Personal Enrichment 337 384 342 321 70
Mind/Body 27 23 24 22 14
Motorcycle Safety Training 40
Students with Intellectual Disabilities 7
Writing Studio 5
Youth 170 179 172 167 189
Total 998 1,115 1,094 1,120 855 Source: Beginning with 2018-19, the source is Destiny; prior years the source is Banner
46
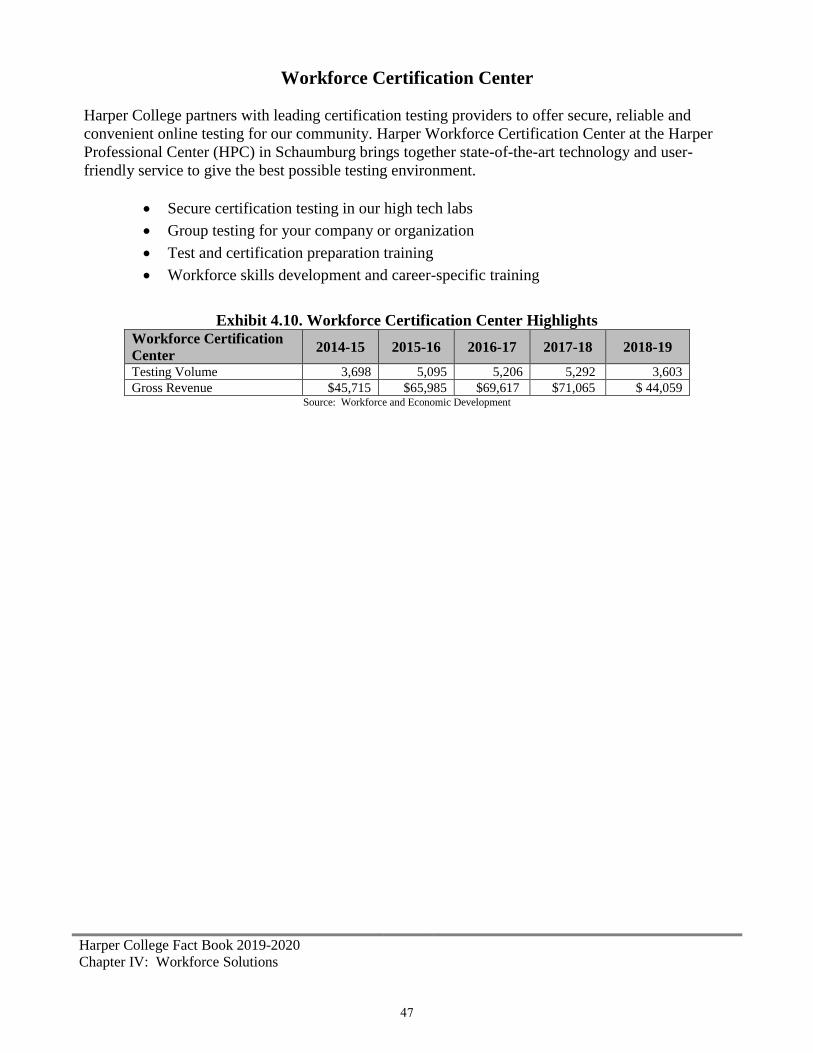
Harper College Fact Book 2019-2020
Chapter IV: Workforce Solutions
Workforce Certification Center
Harper College partners with leading certification testing providers to offer secure, reliable and
convenient online testing for our community. Harper Workforce Certification Center at the Harper
Professional Center (HPC) in Schaumburg brings together state-of-the-art technology and user-
friendly service to give the best possible testing environment.
Secure certification testing in our high tech labs
Group testing for your company or organization
Test and certification preparation training
Workforce skills development and career-specific training
Exhibit 4.10. Workforce Certification Center Highlights
Workforce Certification
Center 2014-15 2015-16 2016-17 2017-18 2018-19
Testing Volume 3,698 5,095 5,206 5,292 3,603
Gross Revenue $45,715 $65,985 $69,617 $71,065 $ 44,059 Source: Workforce and Economic Development
47

Harper College Fact Book 2019-2020
Chapter IV: Workforce Solutions
Harper Business Solutions Harper Business Solutions brings quality customized training solutions to organizations. Training can
be provided at the company’s location, at times and days convenient for the company and its
employees. Tailored and customized classes (credit or non-credit) are available in a wide range of
content areas including Leadership Development, IT/Computer Skills, Staff Professional Development,
and Specialized Industrial Skills.
Exhibit 4.11. Harper Business Solutions (HBS)
Harper Business Solutions (HBS)
Revenue/Participants 2014-2015 2015-2016 2016-2017 2017-2018 2018-2019
HBS Revenue $638,766 $631,740 $406,104 $314,190 $246,092
State Grant Funds
(included in HCT Revenue amount) $23,650 $0 $0 $0 $0
Businesses Served (unduplicated) 36 33 29 26 26
New Businesses Served
(incl. those not served in last 3 FY) 17 7 6 9 11
Number of Training Classes (all) 346 304 265 228 212
Classes for Harper employees only 27 17 9 10 10
Number of Courses
(unduplicated, not included in class count) 10 7 16 8 5
1.6 Courses Delivered 9 7 9 6 5
Credit Courses Delivered 1 0 7 2 0
Employees Trained
(classes and courses, duplicated) 4,215 3,414 3,297 2,341 1,934
Harper employees in Harper only classes 321 174 124 111 81
1.6 Students 88 65 70 48 37
Credit Students 25 0 7 16 0 Source: Workforce and Economic Development
48
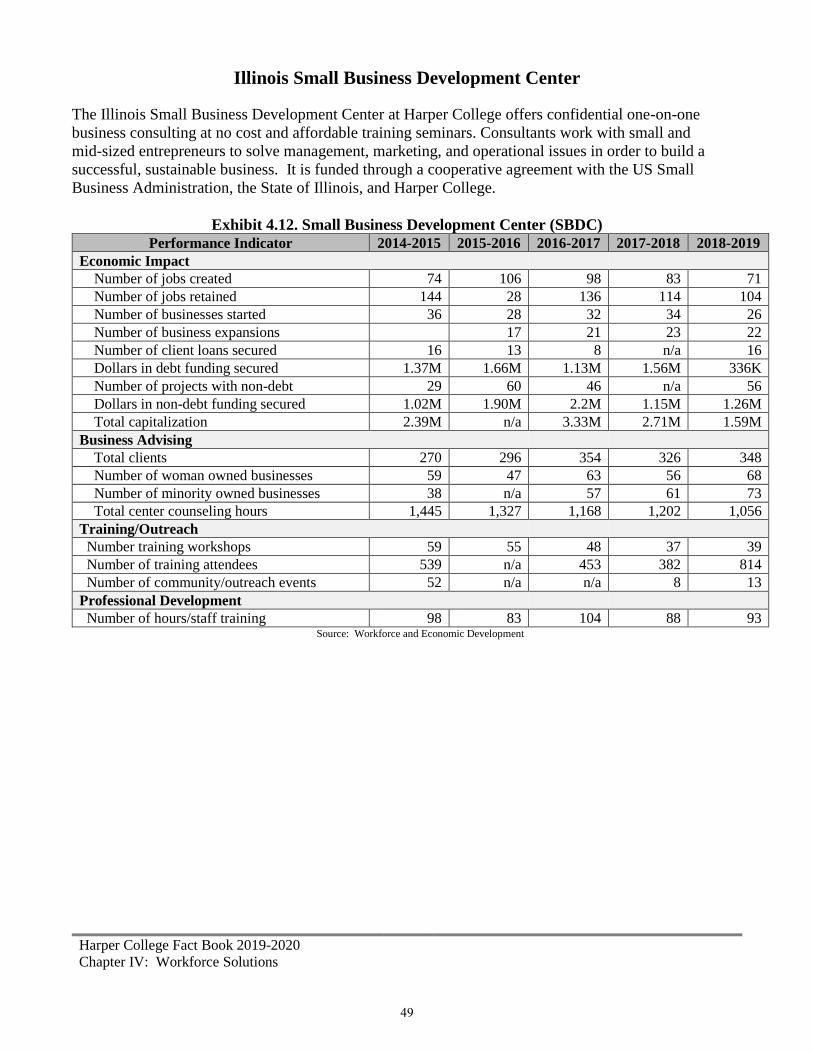
Harper College Fact Book 2019-2020
Chapter IV: Workforce Solutions
Illinois Small Business Development Center
The Illinois Small Business Development Center at Harper College offers confidential one-on-one
business consulting at no cost and affordable training seminars. Consultants work with small and
mid-sized entrepreneurs to solve management, marketing, and operational issues in order to build a
successful, sustainable business. It is funded through a cooperative agreement with the US Small
Business Administration, the State of Illinois, and Harper College.
Exhibit 4.12. Small Business Development Center (SBDC)
Performance Indicator 2014-2015 2015-2016 2016-2017 2017-2018 2018-2019
Economic Impact
Number of jobs created 74 106 98 83 71
Number of jobs retained 144 28 136 114 104
Number of businesses started 36 28 32 34 26
Number of business expansions 17 21 23 22
Number of client loans secured 16 13 8 n/a 16
Dollars in debt funding secured 1.37M 1.66M 1.13M 1.56M 336K
Number of projects with non-debt 29 60 46 n/a 56
Dollars in non-debt funding secured 1.02M 1.90M 2.2M 1.15M 1.26M
Total capitalization 2.39M n/a 3.33M 2.71M 1.59M
Business Advising
Total clients 270 296 354 326 348
Number of woman owned businesses 59 47 63 56 68
Number of minority owned businesses 38 n/a 57 61 73
Total center counseling hours 1,445 1,327 1,168 1,202 1,056
Training/Outreach
Number training workshops 59 55 48 37 39
Number of training attendees 539 n/a 453 382 814
Number of community/outreach events 52 n/a n/a 8 13
Professional Development
Number of hours/staff training 98 83 104 88 93 Source: Workforce and Economic Development
49

Harper College Fact Book 2019-2020
Chapter IV: Workforce Solutions
Harper College Job Placement Resource Center
The Job Placement Resource Center (JPRC) is committed to helping Harper students and alumni
become job search ready. Resources include assistance with resumes, interviewing, soft or essential
skills employers want and job search. Over 400 jobs are available on the job management system each
month for part-time, full-time, internships/co-ops and seasonal jobs. In addition, there are additional
resources available on the JPRC website.
Exhibit 4.13. Job Placement Resource Center (JPRC)
Job Placement Resource
Center
FY 2016-2017 FY 2017–2018** FY 2018-2019
Number of students served* 1,154 1,057 1,161
Email appointments n/a n/a 1,025
Number of employers listed
on online job board*
2,695 1,041 1,014
Number of jobs by job target* 4,118 4,761 4,420
Top five requested jobs Customer Service,
Sales, Health Careers,
Food Service, Office
& Administrative
Customer Service,
Sales, Food Service,
Health Care, Early
Childhood Education
Customer Service,
Health Careers, Sales,
Food Service, Early
Childhood Education
Number of employers for on-
campus recruiting*
67 77 66
Number of student outreach
activities/number of students
served*
211 / 5,180 212 / 4,470 228 / 4,845
Number of students reported
placed in jobs
154 170 129
Cumulative total since JPRC
inception FY14
460 630 770
Source: Workforce and Economic Development *duplicated
** staff reduction
50

Harper College Fact Book 2019-2020
Chapter V: Finances
Chapter V
Finances
Exhibit 5.1. Tuition Rates per Credit Hour by Residency Status
2015-16 2016-17 2017-18 2018-19 2019-20
Resident $113.75 $119.25 $125.00 $129.75 $133.50
Non Residents $370.75 $376.25 $382.00 $386.75 $390.50
Out-of-State $446.25 $451.75 $457.50 $462.25 $466.00
International Students $446.25 $451.75 $457.50 $462.25 $466.00 Source: Harper College Website
51
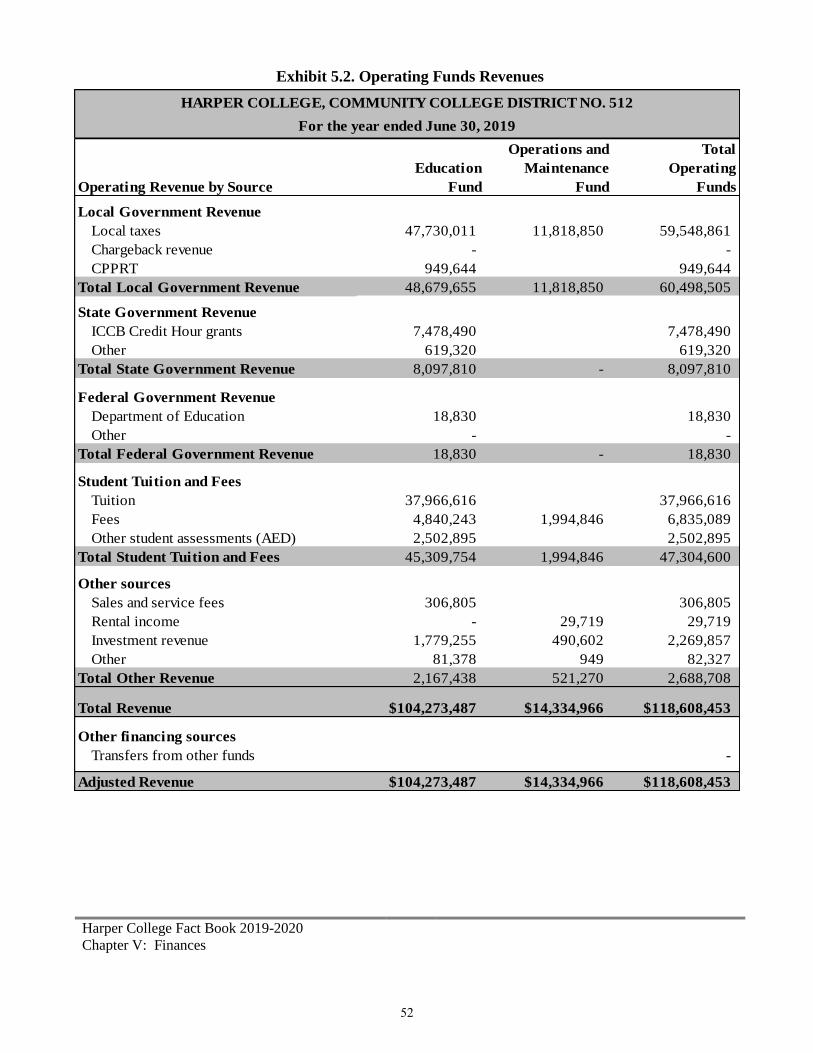
Harper College Fact Book 2019-2020
Chapter V: Finances
Exhibit 5.2. Operating Funds Revenues
Operations and Total
Education Maintenance Operating
Fund Fund Funds
Local taxes 47,730,011 11,818,850 59,548,861
Chargeback revenue - -
CPPRT 949,644 949,644
48,679,655 11,818,850 60,498,505
ICCB Credit Hour grants 7,478,490 7,478,490
Other 619,320 619,320
8,097,810 - 8,097,810
Department of Education 18,830 18,830
Other - -
18,830 - 18,830
Tuition 37,966,616 37,966,616
Fees 4,840,243 1,994,846 6,835,089
Other student assessments (AED) 2,502,895 2,502,895
45,309,754 1,994,846 47,304,600
Sales and service fees 306,805 306,805
Rental income - 29,719 29,719
Investment revenue 1,779,255 490,602 2,269,857
Other 81,378 949 82,327
2,167,438 521,270 2,688,708
$104,273,487 $14,334,966 $118,608,453
Other financing sources
Transfers from other funds -
$104,273,487 $14,334,966 $118,608,453
HARPER COLLEGE, COMMUNITY COLLEGE DISTRICT NO. 512
For the year ended June 30, 2019
Operating Revenue by Source
Federal Government Revenue
State Government Revenue
Local Government Revenue
Total State Government Revenue
Total Local Government Revenue
Adjusted Revenue
Total Federal Government Revenue
Total Student Tuition and Fees
Other sources
Total Other Revenue
Total Revenue
Student Tuition and Fees
52
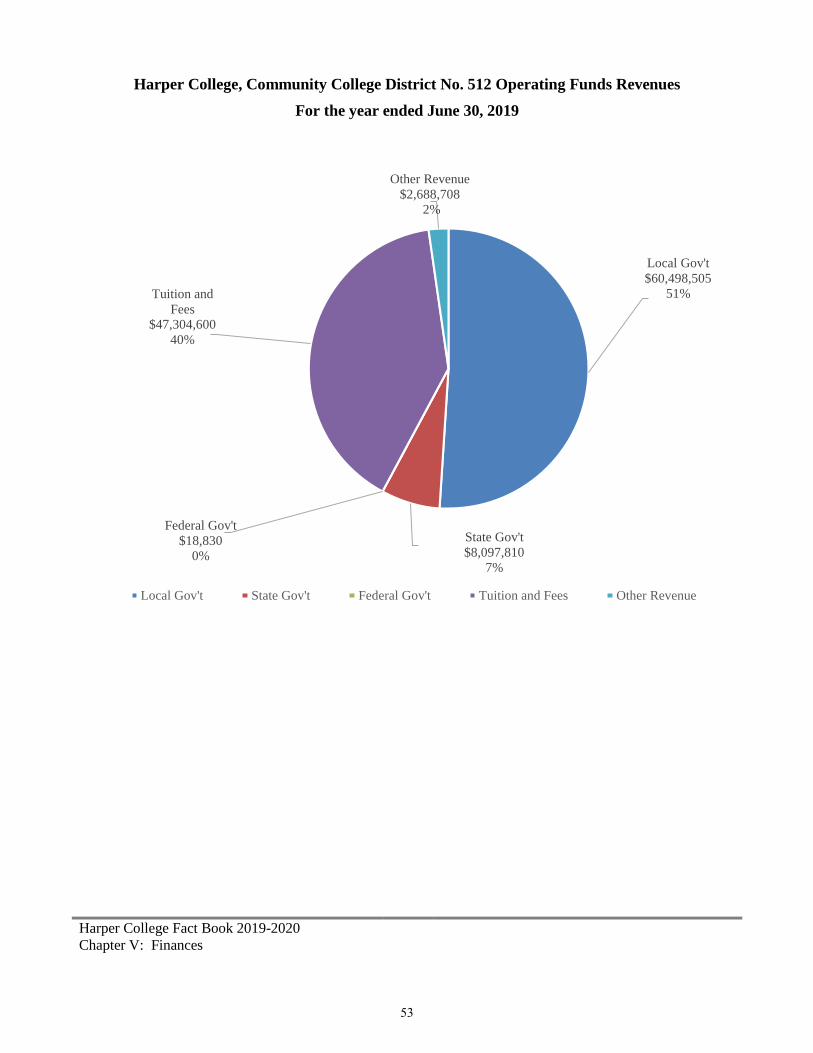
Harper College Fact Book 2019-2020
Chapter V: Finances
Harper College, Community College District No. 512 Operating Funds Revenues
For the year ended June 30, 2019
Local Gov't
$60,498,505
51%
State Gov't
$8,097,810
7%
Federal Gov't
$18,830
0%
Tuition and
Fees
$47,304,600
40%
Other Revenue
$2,688,708
2%
Local Gov't State Gov't Federal Gov't Tuition and Fees Other Revenue
53

Harper College Fact Book 2019-2020
Chapter V: Finances
Exhibit 5.3. Operating Funds Expenditures
Operations and Total
Education Maintenance Operating
Fund Fund Funds
Instruction 37,430,265 - 37,430,265
Academic support 8,953,791 - 8,953,791
Student services 12,263,283 - 12,263,283
Public service / continuing education 104,334 - 104,334
Operations and maintenance - $13,029,063 13,029,063
Institutional support 26,600,602 2,236,464 28,837,066
Scholarships/grants/waivers 6,191,145 - 6,191,145
91,543,420 15,265,527 106,808,947
Other financing uses
Transfers to other funds 11,263,246 - 11,263,246
102,806,666 15,265,527 118,072,193
Salaries 61,208,635 6,144,978 67,353,613
Employee benefits 12,203,147 1,663,172 13,866,319
Contractual services 4,477,664 2,690,863 7,168,527
General materials and supplies 3,790,596 803,926 4,594,522
Conference and meeting expense 1,003,219 21,837 1,025,056
Fixed charges 338,144 239,035 577,179
Utilities 1,260 3,015,422 3,016,682
Capital outlay 1,721,281 686,000 2,407,281
Other 6,799,474 294 6,799,768
$91,543,420 $15,265,527 $106,808,947
Other financing uses
Transfers to other funds 11,263,246 - 11,263,246
$102,806,666 $15,265,527 $118,072,193
Total Operating Expenditures
HARPER COLLEGE, COMMUNITY COLLEGE DISTRICT NO. 512
For the year ended June 30, 2019
Operating Expenditures By Program
Adjusted Operating Expenditures
Operating Expenditures By Object
Adjusted Operating Expenditures
Total Operating Expenditures
54

Harper College Fact Book 2019-2020
Chapter V: Finances
Harper College, Community College District No. 512 Operating Funds Expenditures
For the year ended June 30, 2019
Instruction
$37,430,265
32%
Academic
support
$8,953,791
8%
Student services
$12,263,283
10%Public
service/continuing
education
$104,334
0%
Operations
and
maintenance
$13,029,063
11%
Institutional support
$28,837,066
24%
Scholarships/grants/
waivers
$6,191,145
5%
Transfers
$11,263,246
10%
Instruction Academic supportStudent services Public service/continuing educationOperations and maintenance Institutional supportScholarships/grants/waivers Transfers
55
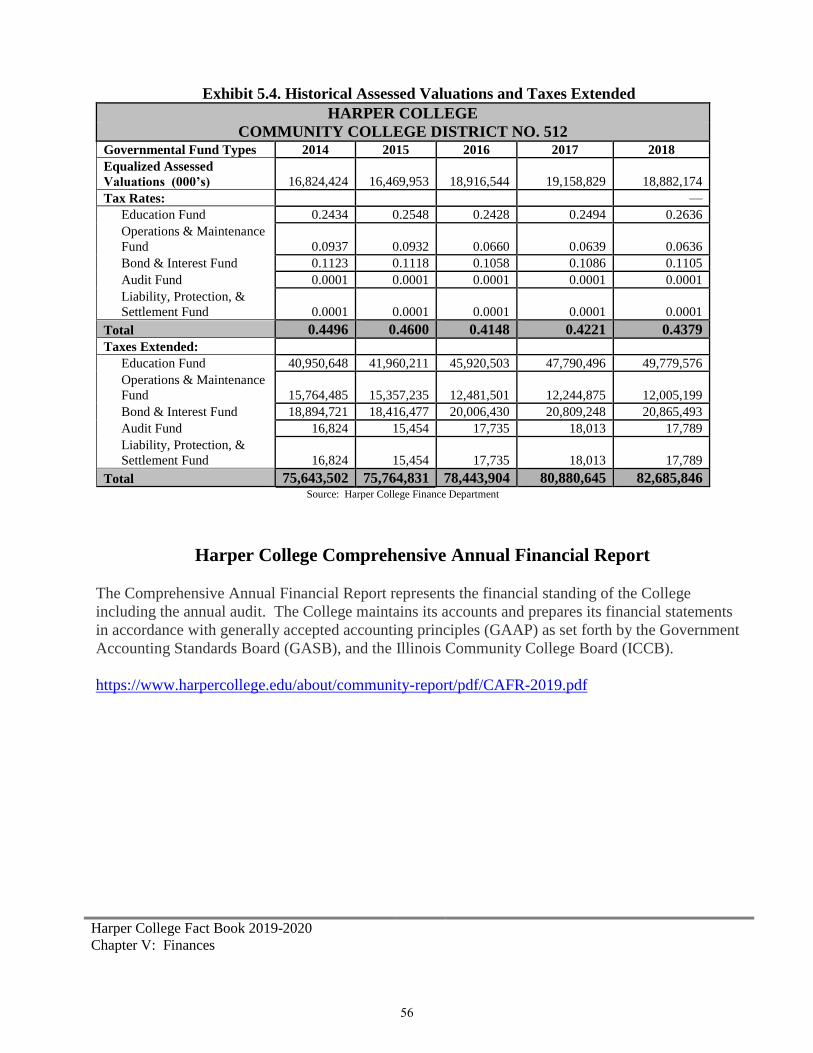
Harper College Fact Book 2019-2020
Chapter V: Finances
Exhibit 5.4. Historical Assessed Valuations and Taxes Extended
HARPER COLLEGE
COMMUNITY COLLEGE DISTRICT NO. 512 Governmental Fund Types 2014 2015 2016 2017 2018
Equalized Assessed
Valuations (000’s) 16,824,424 16,469,953 18,916,544 19,158,829 18,882,174
Tax Rates: —
Education Fund 0.2434 0.2548 0.2428 0.2494 0.2636
Operations & Maintenance
Fund 0.0937 0.0932 0.0660 0.0639 0.0636
Bond & Interest Fund 0.1123 0.1118 0.1058 0.1086 0.1105
Audit Fund 0.0001 0.0001 0.0001 0.0001 0.0001
Liability, Protection, &
Settlement Fund 0.0001 0.0001 0.0001 0.0001 0.0001
Total 0.4496 0.4600 0.4148 0.4221 0.4379
Taxes Extended:
Education Fund 40,950,648 41,960,211 45,920,503 47,790,496 49,779,576
Operations & Maintenance
Fund 15,764,485 15,357,235 12,481,501 12,244,875 12,005,199
Bond & Interest Fund 18,894,721 18,416,477 20,006,430 20,809,248 20,865,493
Audit Fund 16,824 15,454 17,735 18,013 17,789
Liability, Protection, &
Settlement Fund 16,824 15,454 17,735 18,013 17,789
Total 75,643,502 75,764,831 78,443,904 80,880,645 82,685,846 Source: Harper College Finance Department
Harper College Comprehensive Annual Financial Report
The Comprehensive Annual Financial Report represents the financial standing of the College
including the annual audit. The College maintains its accounts and prepares its financial statements
in accordance with generally accepted accounting principles (GAAP) as set forth by the Government
Accounting Standards Board (GASB), and the Illinois Community College Board (ICCB).
https://www.harpercollege.edu/about/community-report/pdf/CAFR-2019.pdf
56

Harper College Fact Book 2019-2020
Chapter VI: Facilities
Chapter VI
Facilities
Harper College Campus Map
57

Harper College Fact Book 2019-2020
Chapter VI: Facilities
Extension Center Locations and Additional Service Locations
Harper College Extension Center Locations
Harper Professional Center (HPC)
650 E. Higgins Road
Schaumburg, IL 60173
847.925.6066
Learning and Career Center (LCC)
1375 S. Wolf Road
Prospect Heights, IL 60070
847.925.6212
Northwest Community Hospital
800 W. Central Road
Arlington Heights, IL 60005
847.618.1000
Additional Service Locations
Capelli Academy
333 E. Rand Road
Arlington Heights, IL 60004
847.749.1416
CLEC Enterprises, Inc.
5105 Tollview Drive, Suite 270
Rolling Meadows, IL 60008
779.220.1343
Chicago Botanic Garden
1000 Lake Cook Road
Glencoe, IL 60022
847.256.3200
Eagle Training Services
1095 Pingree Rd, Suite 217
Crystal Lake, IL 60014
847.854.3218
Education and Work Center (EWC)
6704 Barrington Road
Hanover Park, IL 60133
630.634.7400
Elgin Community College
(ECC)
1700 Spartan Drive
Elgin, IL 60123
847.697.1000
Higgins Educational Center (HEC)
1030 W. Higgins Road
Hoffman Estates, IL 60169
847.755.6640
Highland Woods Golf Course
(HWGC)
2775 N. Ela Rd.
Hoffman Estates, IL
847.359.5850
Forest View Educational Center
2121 S. Goebbert Road
Arlington Heights, IL
(Enter at Door #2)
847.718.7600
The Grooming Lodge of Arlington
Heights
1551 W Campbell Street
Arlington Heights IL 60005
847.398.9171
Illinois workNet Center
723 W. Algonquin
Arlington Heights, IL 60005
847.758.2371
John Hersey High School
1900 E. Thomas St.
Arlington Heights, IL 60004
847.718.4800
Palatine Opportunity Center
1585 N. Rand Road
Room 230
Palatine, IL 60067
Spring Valley Nature Sanctuary
1111 E. Schaumburg Road
Schaumburg, IL 60194
847.985.2100
Suevel Studios
870 S. Arthur Avenue
Arlington Heights, IL 60005
224.735.2376
3 Monkeys & Aardvark Studios
(TMAS)
1244 Remington Rd, Suite A
Schaumburg, IL 60173
630.283.3621
58

Harper College Fact Book 2019-2020
Chapter VI: Facilities
Lifelong Learning Locations
Lifelong Learning Locations
Addolorata Villa
555 McHenry Road
Wheeling, IL 60090
847.537.2900
Friendship Village
350 West Schaumburg Road
Schaumburg, IL 60194
847.884.5000
The Garlands
1000 Garlands Lane
Barrington, IL 60010
847.304.1996
Lutheran Home (LHA)
800 West Oakton
Arlington Heights, IL 60004
847.368.7461
For information on the motorcycle training site locations, see link below:
harpercollege.edu/ce/mse/motorcycle_locations.php
59

Harper College Fact Book 2019-2020
Chapter VI: Facilities
Exhibit 6.1. Campus Buildings and Acceptance Dates and Gross Square Feet
Building Name Acceptance Dates Gross Square
Footage
Building A 1969 132,035
Building B 1969 (additions 1984, 2005;
remodel 2018) 27,557
Building C 1969 23,244
Building D 1969 (additions 1974, 1985;
remodel 2016) 140,236
Building E 1969 14,741
Building F 1969 (remodel 2018) 104,017
Building G (Parking Garage) 2015 284,933
Building H 1977 (additions 2015, 2018) 99,434
Buildings I, J 1980 94,458
Building L 1994 89,675
Building M (Wellness and Sports Center) 1980 (remodel 2018) 145,675
Building O (Observatory) 1990 910
Building P 1974 25,871
Building R (Performing Arts Center) 2002 44,805
Building S 1993 13,690
Building T 1973 5,576
Building U 1974 3,007
Building V 1974 13,694
Building W (Wojcik Conference Center) 2002 51,861
Building X (Health Careers Center) 2004 97,395
Building Y (Center for Emerging Technology) 2004 52,792
Building Z (Science Center) 2004 141,583
(HPC) Harper Professional Center 1982 (purchased in 2001) 41,536
(LCC) Learning & Career Center 1973 (purchased in 1994) 54,516
Total Square Feet (Owned) 1,703,241 Source: Physical Plant Department (Dec 2018)
60

Harper College Fact Book 2019-2020
Chapter VI: Facilities
Exhibit 6.2. Square Footage of Facilities
Fiscal Years 2018-2019
Room Use Square
Feet
Classroom 241,959
Laboratory 167,157
Office 151,914
Study 38,429
Special Use
Athletic/P.E. 70,530
All Other Special
Use Facilities 6,829
General Use 95,183
Supporting Facilities 335,418
Health Care 1,425
Unclassified Facilities 5,333
Total Net Assignable Square Footage 1,114,117
NASF/GSF Ratio 65%
Total Gross Square Footage (Overall) 1,703,241 Source: Physical Plant Department (Sep 2018)
Exhibit 6.3. Land and Parking Summary
Fiscal Years 2018-2019
Category Acres
Landscaped Grounds 74.1
Physical Education and Athletic Fields 12.8
Building and Attached Structure 16.5
Experimental Plots 7.5
Other Instructional Areas 0
Parking Lots 39.1
- Total Number of Parking Spaces on Campus: 5,463
- Number of Parking Spaces Listed on “Parking Lots” in which
the State Participated : 2,579
Roadways 12.9
Pond Retention and Drainage 12.3
Other 12.9
Total Assigned Area 188.2
Currently Unassigned 0
Total Acres 188.2
Number of Acres Paid by the State 90.6
Source: Physical Plant Department (Dec 2018)
61

Harper College Fact Book 2019-2020
Chapter VII: Human Resources
Chapter VII
Human Resources
Exhibit 7.1. Employee Headcount and Full-Time Equivalent (FTE) at Fall Census
Group Headcount Full-Time Equivalent (FTE)
2015 2016 2017 2018 2019 2015 2016 2017 2018 2019
Teaching Faculty 742 695 671 646 638 387.3 370.3 359.7 352.0 346.7
Staff 875 813 810 819 857 633.7 596.3 608.7 617.0 637.7
Total 1,617 1,508 1,481 1,465 1,495 1,021.0 966.7 968.3 969.0 984.4 Source: Fall Human Resources Census - ICCB C1 File and IPEDS Human Resources Survey
Exhibit 7.2. Full-Time and Part-Time Employee Status by Occupational Category at Fall Census
Occupational Category Full-Time Headcount Part-Time Headcount
2015 2016 2017 2018 2019 2015 2016 2017 2018 2019
Instructional Staff 210 208 204 205 201 532 487 467 441 437
Librarians 17 15 14 16 15 20 12 13 13 14
Student and Academic Affairs and
Other Education Services 34 28 29 35 43 83 43 37 76 80
Management 38 30 36 25 38 0 0 0 0 0
Business and Financial Operations 52 49 48 48 49 27 9 6 6 4
Computer, Engineering, and Science 72 77 76 81 76 14 12 12 13 10
Community Service, Legal, Arts,&
Media 83 103 121 128 124 70 106 91 52 72
Healthcare Practitioners and
Technical 3 2 1 1 2 92 93 94 102 109
Service Occupations 116 107 106 107 104 12 10 8 9 10
Sales and Related Occupations 24 19 22 20 20 5 5 5 5 6
Office and Administrative Support 74 58 55 55 57 39 35 36 27 24
Total 723 696 712 721 729 894 812 769 744 766 Source: Fall Human Resources Census - ICCB C1 File and IPEDS Human Resources Survey
62
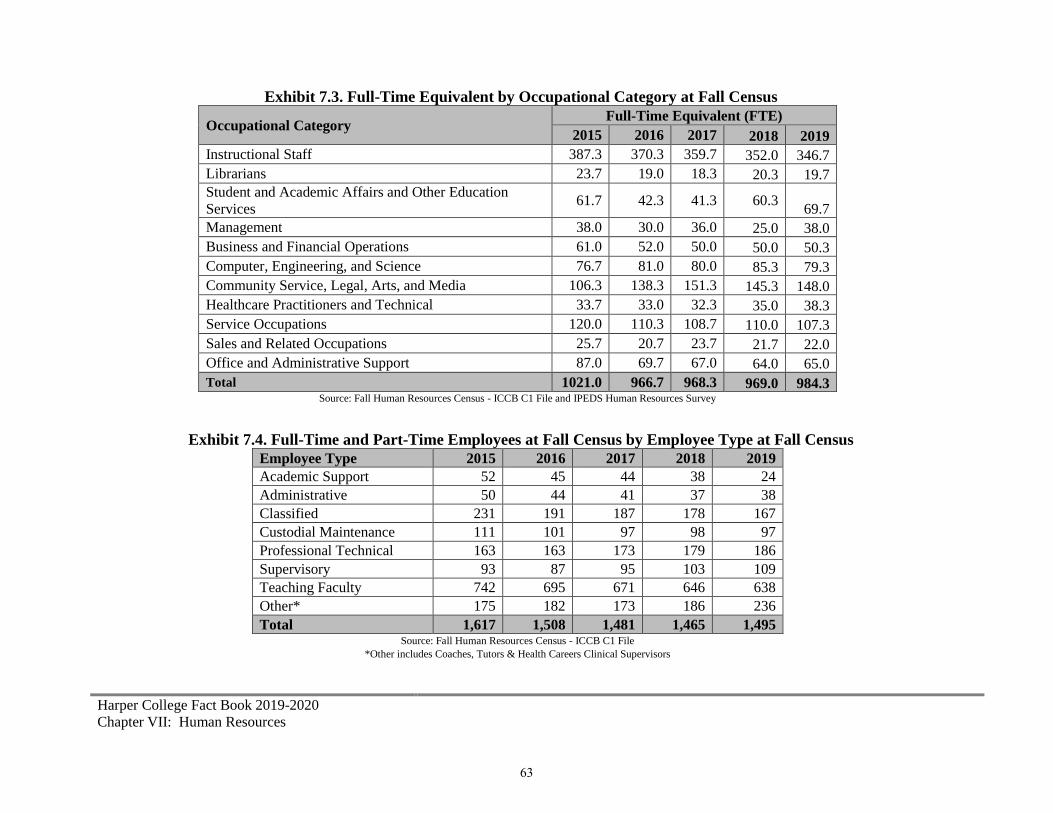
Harper College Fact Book 2019-2020
Chapter VII: Human Resources
Exhibit 7.3. Full-Time Equivalent by Occupational Category at Fall Census
Occupational Category Full-Time Equivalent (FTE)
2015 2016 2017 2018 2019
Instructional Staff 387.3 370.3 359.7 352.0 346.7
Librarians 23.7 19.0 18.3 20.3 19.7
Student and Academic Affairs and Other Education
Services 61.7 42.3 41.3 60.3
69.7
Management 38.0 30.0 36.0 25.0 38.0
Business and Financial Operations 61.0 52.0 50.0 50.0 50.3
Computer, Engineering, and Science 76.7 81.0 80.0 85.3 79.3
Community Service, Legal, Arts, and Media 106.3 138.3 151.3 145.3 148.0
Healthcare Practitioners and Technical 33.7 33.0 32.3 35.0 38.3
Service Occupations 120.0 110.3 108.7 110.0 107.3
Sales and Related Occupations 25.7 20.7 23.7 21.7 22.0
Office and Administrative Support 87.0 69.7 67.0 64.0 65.0
Total 1021.0 966.7 968.3 969.0 984.3 Source: Fall Human Resources Census - ICCB C1 File and IPEDS Human Resources Survey
Exhibit 7.4. Full-Time and Part-Time Employees at Fall Census by Employee Type at Fall Census
Employee Type 2015 2016 2017 2018 2019
Academic Support 52 45 44 38 24
Administrative 50 44 41 37 38
Classified 231 191 187 178 167
Custodial Maintenance 111 101 97 98 97
Professional Technical 163 163 173 179 186
Supervisory 93 87 95 103 109
Teaching Faculty 742 695 671 646 638
Other* 175 182 173 186 236
Total 1,617 1,508 1,481 1,465 1,495 Source: Fall Human Resources Census - ICCB C1 File
*Other includes Coaches, Tutors & Health Careers Clinical Supervisors
63

Harper College Fact Book 2019-2020
Chapter VII: Human Resources
Exhibit 7.5. Fall 2019 Employee Census by Employee Type and Full-Time/Part-Time Status
Employee Type Full-Time Part-Time Total
N % N % N
Academic Support 14 58.3% 10 41.7% 24
Administrative 38 100.0% 0 0.0% 38
Classified 118 70.7% 49 29.3% 167
Custodial Maintenance 87 89.7% 10 10.3% 97
Professional Technical 164 88.2% 22 11.8% 186
Supervisory 107 98.2% 2 1.8% 109
Teaching Faculty 201 31.5% 437 68.5% 638
Other 0 0.0% 236 100.0% 236
Total 729 48.8% 766 51.2% 1,495
Source: Fall Human Resources Census - ICCB C1 File
*Other includes Coaches, Tutors & Health Careers Clinical Supervisors
Exhibit 7.6. Fall 2019 Employee Census by Employee Type and Gender
Employee Type Male Female Total
N % N % N
Academic Support 7 29.2% 17 70.8% 24
Administrative 13 34.2% 25 65.8% 38
Classified 33 19.8% 134 80.2% 167
Custodial Maintenance 68 70.1% 29 29.9% 97
Professional Technical 74 39.8% 112 60.2% 186
Supervisory 41 37.6% 68 62.4% 109
Teaching Faculty 325 50.9% 313 49.1% 638
Other 74 31.4% 162 68.6% 236
Total 635 860 1,495 Source: Fall Human Resources Census - ICCB C1 File
*Other includes Coaches, Tutors & Health Careers Clinical Supervisors
64
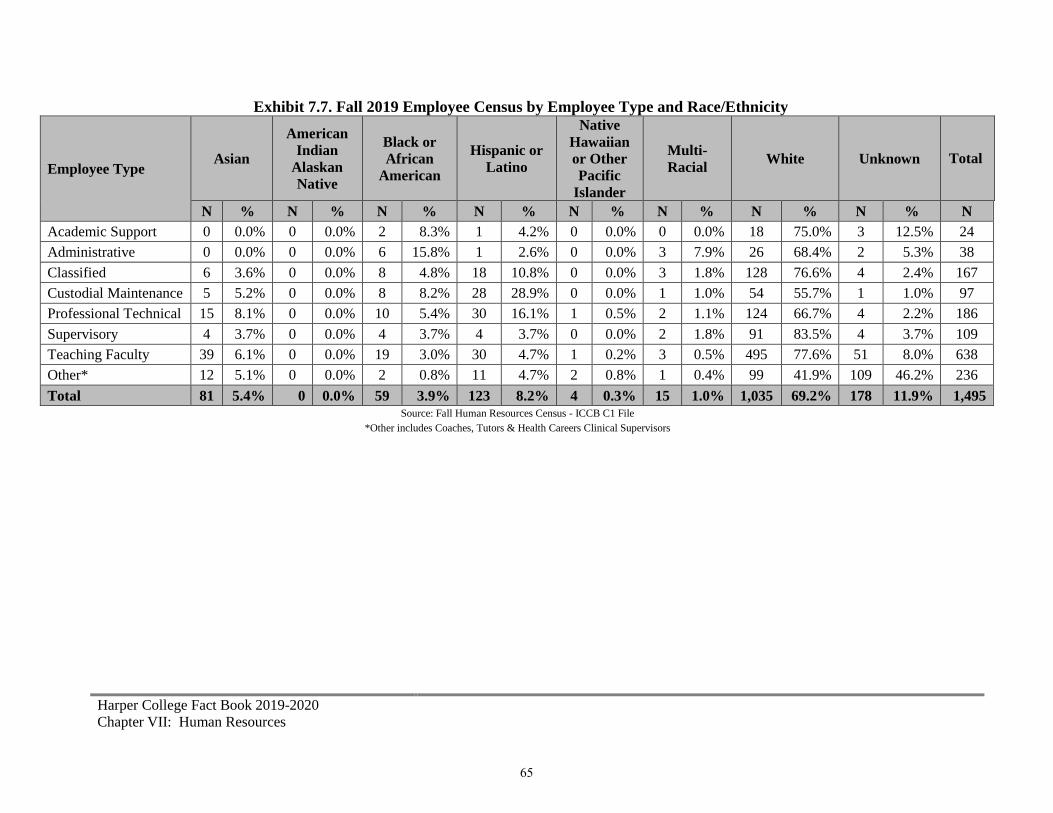
Harper College Fact Book 2019-2020
Chapter VII: Human Resources
Exhibit 7.7. Fall 2019 Employee Census by Employee Type and Race/Ethnicity
Employee Type Asian
American
Indian
Alaskan
Native
Black or
African
American
Hispanic or
Latino
Native
Hawaiian
or Other
Pacific
Islander
Multi-
Racial White Unknown Total
N % N % N % N % N % N % N % N % N
Academic Support 0 0.0% 0 0.0% 2 8.3% 1 4.2% 0 0.0% 0 0.0% 18 75.0% 3 12.5% 24
Administrative 0 0.0% 0 0.0% 6 15.8% 1 2.6% 0 0.0% 3 7.9% 26 68.4% 2 5.3% 38
Classified 6 3.6% 0 0.0% 8 4.8% 18 10.8% 0 0.0% 3 1.8% 128 76.6% 4 2.4% 167
Custodial Maintenance 5 5.2% 0 0.0% 8 8.2% 28 28.9% 0 0.0% 1 1.0% 54 55.7% 1 1.0% 97
Professional Technical 15 8.1% 0 0.0% 10 5.4% 30 16.1% 1 0.5% 2 1.1% 124 66.7% 4 2.2% 186
Supervisory 4 3.7% 0 0.0% 4 3.7% 4 3.7% 0 0.0% 2 1.8% 91 83.5% 4 3.7% 109
Teaching Faculty 39 6.1% 0 0.0% 19 3.0% 30 4.7% 1 0.2% 3 0.5% 495 77.6% 51 8.0% 638
Other* 12 5.1% 0 0.0% 2 0.8% 11 4.7% 2 0.8% 1 0.4% 99 41.9% 109 46.2% 236
Total 81 5.4% 0 0.0% 59 3.9% 123 8.2% 4 0.3% 15 1.0% 1,035 69.2% 178 11.9% 1,495 Source: Fall Human Resources Census - ICCB C1 File
*Other includes Coaches, Tutors & Health Careers Clinical Supervisors
65
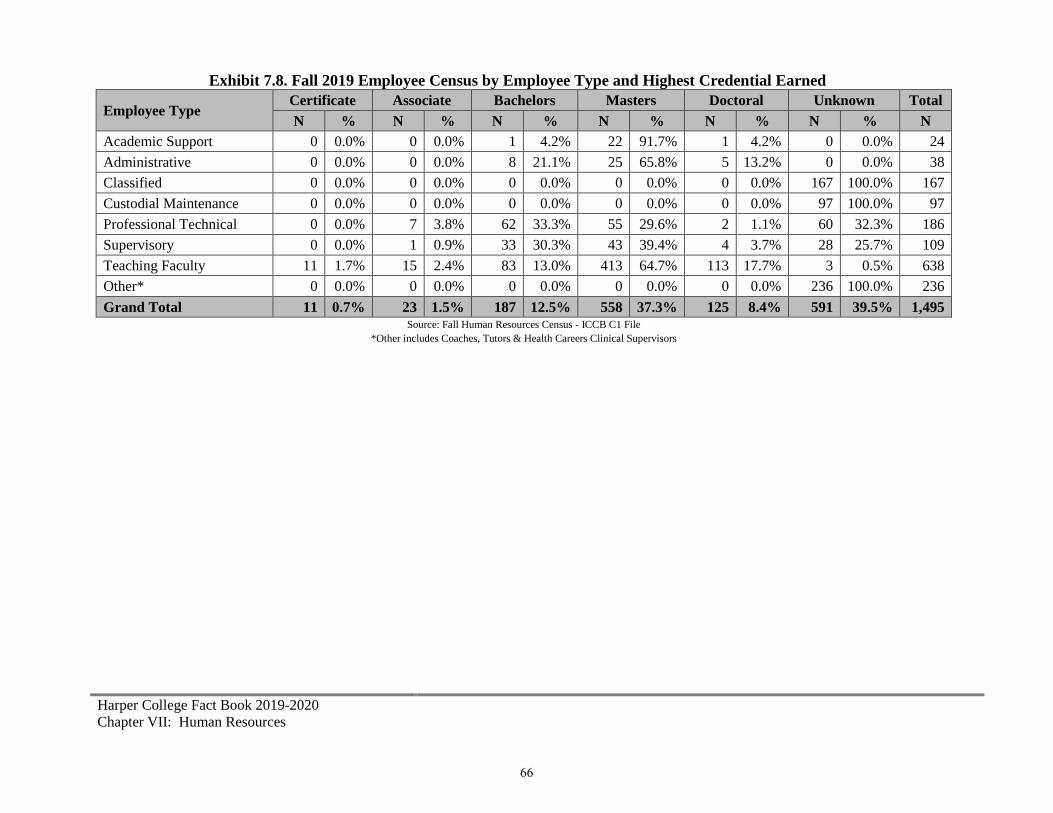
Harper College Fact Book 2019-2020
Chapter VII: Human Resources
Exhibit 7.8. Fall 2019 Employee Census by Employee Type and Highest Credential Earned
Employee Type Certificate Associate Bachelors Masters Doctoral Unknown Total
N % N % N % N % N % N % N
Academic Support 0 0.0% 0 0.0% 1 4.2% 22 91.7% 1 4.2% 0 0.0% 24
Administrative 0 0.0% 0 0.0% 8 21.1% 25 65.8% 5 13.2% 0 0.0% 38
Classified 0 0.0% 0 0.0% 0 0.0% 0 0.0% 0 0.0% 167 100.0% 167
Custodial Maintenance 0 0.0% 0 0.0% 0 0.0% 0 0.0% 0 0.0% 97 100.0% 97
Professional Technical 0 0.0% 7 3.8% 62 33.3% 55 29.6% 2 1.1% 60 32.3% 186
Supervisory 0 0.0% 1 0.9% 33 30.3% 43 39.4% 4 3.7% 28 25.7% 109
Teaching Faculty 11 1.7% 15 2.4% 83 13.0% 413 64.7% 113 17.7% 3 0.5% 638
Other* 0 0.0% 0 0.0% 0 0.0% 0 0.0% 0 0.0% 236 100.0% 236
Grand Total 11 0.7% 23 1.5% 187 12.5% 558 37.3% 125 8.4% 591 39.5% 1,495 Source: Fall Human Resources Census - ICCB C1 File
*Other includes Coaches, Tutors & Health Careers Clinical Supervisors
66
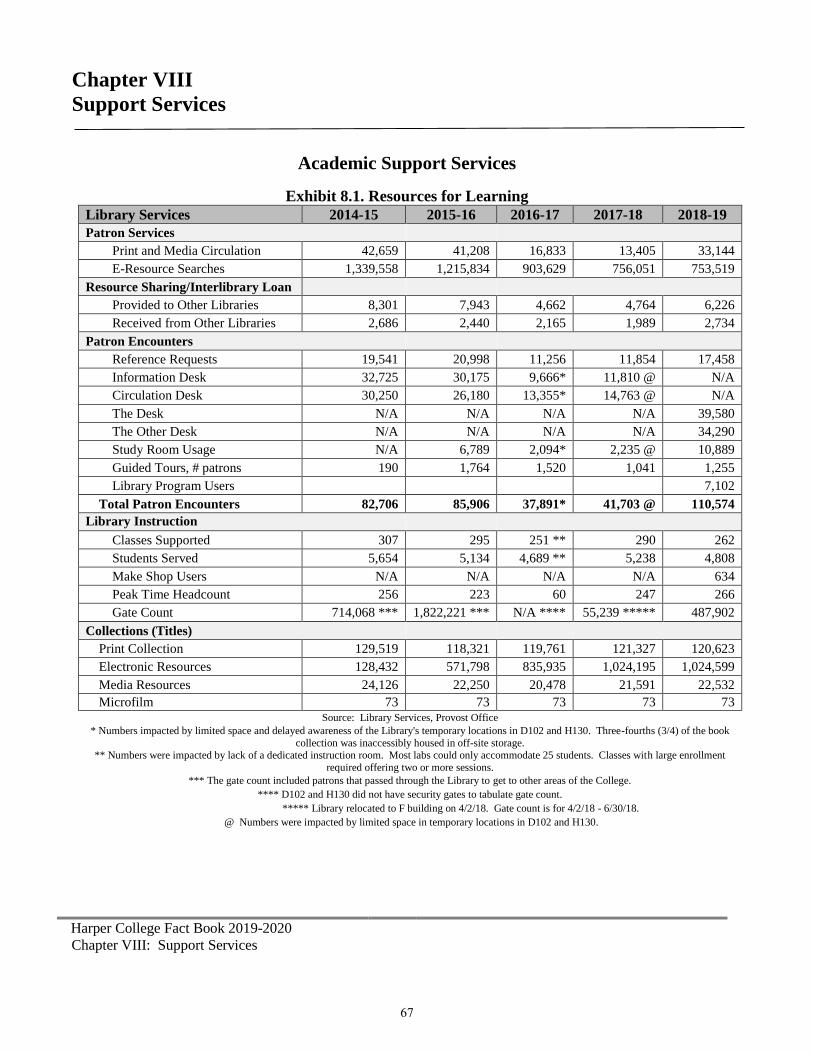
Harper College Fact Book 2019-2020
Chapter VIII: Support Services
Chapter VIII
Support Services
Academic Support Services
Exhibit 8.1. Resources for Learning
Library Services 2014-15 2015-16 2016-17 2017-18 2018-19
Patron Services
Print and Media Circulation 42,659 41,208 16,833 13,405 33,144
E-Resource Searches 1,339,558 1,215,834 903,629 756,051 753,519
Resource Sharing/Interlibrary Loan
Provided to Other Libraries 8,301 7,943 4,662 4,764 6,226
Received from Other Libraries 2,686 2,440 2,165 1,989 2,734
Patron Encounters
Reference Requests 19,541 20,998 11,256 11,854 17,458
Information Desk 32,725 30,175 9,666* 11,810 @ N/A
Circulation Desk 30,250 26,180 13,355* 14,763 @ N/A
The Desk N/A N/A N/A N/A 39,580
The Other Desk N/A N/A N/A N/A 34,290
Study Room Usage N/A 6,789 2,094* 2,235 @ 10,889
Guided Tours, # patrons 190 1,764 1,520 1,041 1,255
Library Program Users 7,102
Total Patron Encounters 82,706 85,906 37,891* 41,703 @ 110,574
Library Instruction
Classes Supported 307 295 251 ** 290 262
Students Served 5,654 5,134 4,689 ** 5,238 4,808
Make Shop Users N/A N/A N/A N/A 634
Peak Time Headcount 256 223 60 247 266
Gate Count 714,068 *** 1,822,221 *** N/A **** 55,239 ***** 487,902
Collections (Titles)
Print Collection 129,519 118,321 119,761 121,327 120,623
Electronic Resources 128,432 571,798 835,935 1,024,195 1,024,599
Media Resources 24,126 22,250 20,478 21,591 22,532
Microfilm 73 73 73 73 73 Source: Library Services, Provost Office
* Numbers impacted by limited space and delayed awareness of the Library's temporary locations in D102 and H130. Three-fourths (3/4) of the book
collection was inaccessibly housed in off-site storage.
** Numbers were impacted by lack of a dedicated instruction room. Most labs could only accommodate 25 students. Classes with large enrollment
required offering two or more sessions.
*** The gate count included patrons that passed through the Library to get to other areas of the College.
**** D102 and H130 did not have security gates to tabulate gate count.
***** Library relocated to F building on 4/2/18. Gate count is for 4/2/18 - 6/30/18.
@ Numbers were impacted by limited space in temporary locations in D102 and H130.
67

Harper College Fact Book 2019-2020
Chapter VIII: Support Services
Exhibit 8.2. Innovative Instruction
Academy for Teaching Excellence 2014-2015 2015-2016 2016-2017 2017-2018 2018-2019
Workshops and Faculty Consultations 290 542 609 769 1,188
Blackboard Course Websites Supported* 6,417 6,615 6,729 6,244 ---
Distance Course Development Requests 30 13 21 15 19
Blackboard Support Requests 3,874 3,369 3,834 2,259 2,878
Newly Eligible Online Faculty** N/A N/A N/A 36 54
Source: Academy for Teaching Excellence, Provost Office
* The number of blackboard course websites supported is no longer applicable.
** Beginning in 2017-2018, the number of newly eligible online faculty was added.
Exhibit 8.3. Academic Support Center
ACADEMIC SUPPORT CENTER:
Tutoring Center / Success Services/
Writing Center 2014-15 2015-16 2016-17 2017-18 2018-19
Tutoring Center Total Contacts 30,667 36,839 35,263 22,163 26,319
Student Contacts 23,809 27,780 26,517 22,163 26,319
Computer Usage 6,858 9,059 8,746 --- ---
Success Services Total Contacts 7,556 7,657 7,724 7,625 5,106
Student Contacts 4,061 4,122 4,158 3,267 2,083
Supplemental Instruction 3,495 3,535 3,566 4,358 3,023
Writing Center Total Contacts 12,162 12,416 9,967 4,935 3,841
Student Contacts 7,146 8,409 6,813 --- 3,841
Computer Usage 5,016 4,007 3,154 --- ---
Computer Usage & Independent Study Contacts* --- --- --- 8,644 16,556
Anatomy Room --- --- --- --- 2,744
Developmental Math Center --- --- --- --- 2,385
Academic Support Center Total: 50,385 56,912 52,954 43,367 56,951
Source: Academic Support Center (Tutoring Center/Success Services/Writing Center) Provost Office
*Beginning FY 2017-18, all Academic Support Center computer use contacts are reflected in this section.
68
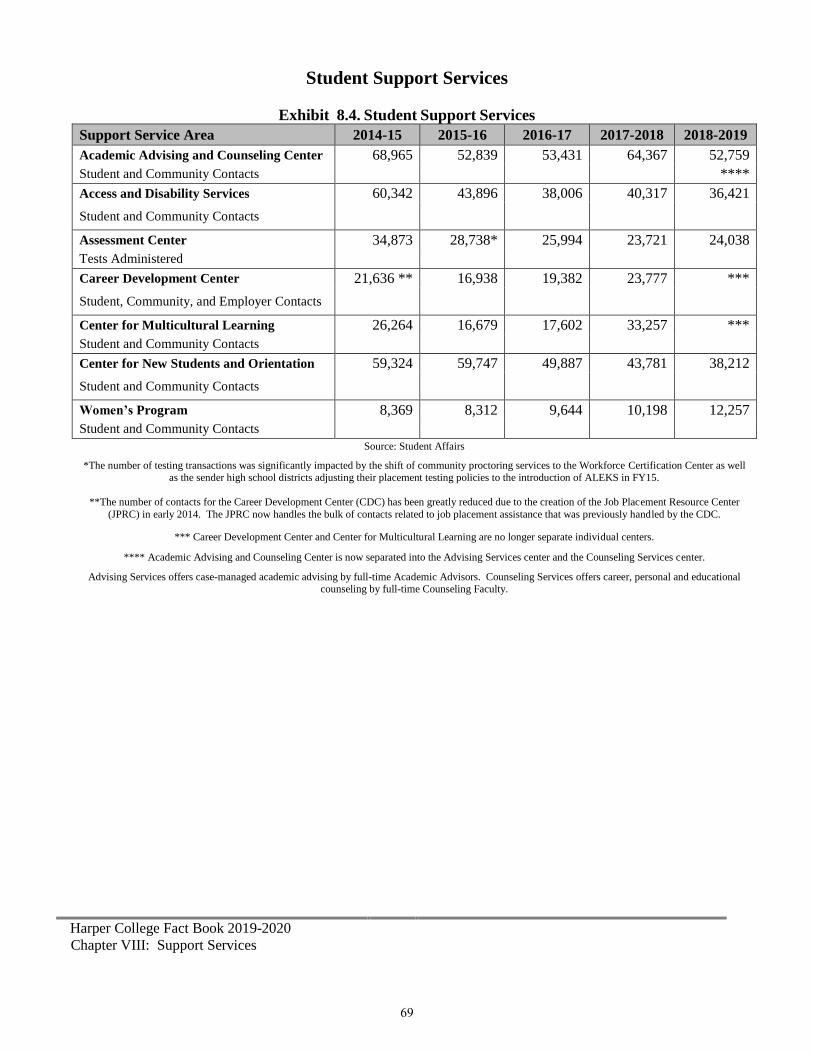
Harper College Fact Book 2019-2020
Chapter VIII: Support Services
Student Support Services
Exhibit 8.4. Student Support Services
Support Service Area 2014-15 2015-16 2016-17 2017-2018 2018-2019
Academic Advising and Counseling Center 68,965 52,839 53,431 64,367 52,759
Student and Community Contacts ****
Access and Disability Services 60,342 43,896 38,006 40,317 36,421
Student and Community Contacts
Assessment Center 34,873 28,738* 25,994 23,721 24,038
Tests Administered
Career Development Center 21,636 ** 16,938 19,382 23,777 ***
Student, Community, and Employer Contacts
Center for Multicultural Learning 26,264 16,679 17,602 33,257 ***
Student and Community Contacts
Center for New Students and Orientation 59,324 59,747 49,887 43,781 38,212
Student and Community Contacts
Women’s Program 8,369 8,312 9,644 10,198 12,257
Student and Community Contacts
Source: Student Affairs
*The number of testing transactions was significantly impacted by the shift of community proctoring services to the Workforce Certification Center as well as the sender high school districts adjusting their placement testing policies to the introduction of ALEKS in FY15.
**The number of contacts for the Career Development Center (CDC) has been greatly reduced due to the creation of the Job Placement Resource Center
(JPRC) in early 2014. The JPRC now handles the bulk of contacts related to job placement assistance that was previously handled by the CDC.
*** Career Development Center and Center for Multicultural Learning are no longer separate individual centers.
**** Academic Advising and Counseling Center is now separated into the Advising Services center and the Counseling Services center.
Advising Services offers case-managed academic advising by full-time Academic Advisors. Counseling Services offers career, personal and educational counseling by full-time Counseling Faculty.
69

Harper College Fact Book 2019-2020
Chapter VIII: Support Services
Financial Aid
Exhibit 8.5. Federal and State Financial Aid Support to Students
Financial Aid Awards 2014-15 2015-16 2016-17 2017-18 2018-19
Number of Awards by Type*
Pell Grant 4093 3,838 3,807 3,913 3,700
Academic Competitiveness Grant (ACG) 0 0 0 0 0
Work Study 77 63 68 68 95
Supplemental Educational Opportunity Grant (SEOG) 529 457 490 472 711
Federal Stafford Loan 1,270 1,084 1,068 959 780
Illinois Student Assistance Commission (ISAC) 1,169 984 1,403 1,700 1,794
IL Vets 129 127 107 107 111
Total 7,267 6,553 6,943 7,219 7,191
Amount of Awards by Type
Pell Grant $12,904,210 $12,045,709 $11,619,640 $13,082,972 $12,889,967
Academic Competitiveness Grant (ACG) $0 $0 $0 $0 $0
Work Study $160,380 $163,371 $171,760 $173,268 $210,248
Supplemental Educational Opportunity Grant (SEOG) $166,164 $174,988 $180,176 $181,819 $260,749
Federal Stafford Loan $6,752,452 $5,618,709 $5,494,148 $5,029,684 $4,076,634
Illinois Student Assistance Commission (ISAC) $1,557,960 $1,275,437 $1,813,138 $2,329,463 $2,367,490
IL Vets $287,404 $270,959 $233,951 $301,770 $325,994
Total $21,828,570 $19,549,173 $19,512,814 $21,098,976 $20,131,082
Source: Financial Aid Office
*Duplicated count (students may receive more than one type award)
For more information on Grants: harpercollege.edu/registration/financialaid/grants.php
For more information on Loans: harpercollege.edu/registration/financialaid/loans/index.php
Exhibit 8.6. Race/Ethnicity of Financial Aid for All Recipients*
Race/Ethnicity 2015-2016 2016-2017 2017-2018 2018-2019
N % N % N % N %
Asian or Pacific Islander 519 9.4% 384 7.2% 231 4.3% 167 3.2%
American Indian or Alaskan Native 17 0.3% 11 0.2% 10 0.2% 3 0.1%
Black 377 6.8% 282 5.3% 198 3.7% 148 2.9%
Hispanic 1,114 20.2% 800 14.9% 587 10.9% 395 7.7%
White 3,253 59.0% 3,672 68.4% 4,193 77.7% 4,273 83.4%
Unknown 238 4.3% 222 4.1% 175 3.2% 137 2.7%
Total 5,518 100.0% 5,371 100.0% 5,394 100.0% 5,123 100.0%
Source: Financial Aid Office.
* Unduplicated counts.
70

Harper College Fact Book 2019-2020
Chapter IX: Recognitions and Awards
Chapter IX
Recognitions and Awards
Fiscal Year 2018-2019 Source: President Reports July 2018-June 2019
National
Educational Advertising Awards:
- Presidential Search Brochure (Category: Brochure), Gold Award, 2019.
- We Are Harper All-District Post Card (Category: Direct Mail), Gold Award,
2019.
Ethics Bowl Competition for Two Year Colleges Competition: 1st Place, 2018.
Government Finance Officers Association Certificate of Achievement for Excellence
in Financial Reporting: Fiscal Year Ended June 30, 2018.
Government Finance Officers Association Award for Best Practices in Community
College Budgeting: Fiscal Year Ending June 30, 2018.
Higher Education Excellence in Diversity Award (HEED): National Recipient, 2018.
Illinois Intercollegiate Forensics Association Tournament: State Debate Champions,
Phi Kappa Delta National Tournament, 2019.
Men’s Cross Country Team: National Champions, 2018.
Men’s Soccer Team: NJCAA DIII Region Champions, 2018.
Men’s Track and Field: 3rd in Nation, 2019.
Men’s Wrestling Team: NJCAA Non-Scholarship National Champions, 2019.
National Council of Marketing and Public Relations (NCMPR):
- ‘Special Event or Fundraising Campaign’ Category for 50th Anniversary Celebration,
Gold Medallion, 2018.
- ‘Excellence in Writing’ Category for article on Brayan Aguirre, a DACA student,
written by Kim Pohl, Silver Medallion, 2018.
National Institute for Learning Outcomes Assessment (NILOA) Excellence in
Assessment Award: Recipient, 2018.
71
Harper College Fact Book 2019-2020
Chapter IX: Recognitions and Awards
National (continued)
National Speech and Debate Sweepstakes: 4th in Debate Sweepstakes, 6th in Speech
Sweepstakes, Gold in two of the 13 speaking events, National Champions in Impromptu
Speaking and Debate, 2019.
Women’s Cross Country Team: National Champions, 2018.
Women’s Track and Field: 3rd in Nation, 2019.
State and Regional
Illinois Council of Community College Administrators (ICCCA) Innovation Award
for Harper College’s apprenticeship work with Zurich North America: Recipient,
2018.
Illinois Intercollegiate Forensics Association Tournament: State Debate Champions,
Phi Kappa Delta National Tournament, 2019.
Michael Bennett Lifetime Achievement Award from Phi Theta Kappa: Dr. Kenneth
L. Ender, 2019.
National Council of Marketing and Public Relations (NCMPR) District 3:
‘Excellence in Writing’ Category for article on Dean Kapolas, a Harper College student,
written by Kim Pohl, Bronze Medallion, 2019.
Women’s Volleyball Team: NJCAA Division III Region Champs, 2018.
International
Toastmasters International Award: Enhancing Employee Engagement through
Continuing Support of the Toastmasters Communication and Leadership Programs
Recipient, 2018.
72


