Session 67PD: Impact of VM-20 on Product Development: SOA Research Moderator: Kelly J Rabin FSA,MAAA Presenters: Karen K Rudolph FSA,MAAA Uri Sobel FSA,MAAA Andrew G Steenman FSA,MAAA SOA Antitrust Disclaimer SOA Presentation Disclaimer
Transcript
Session 67PD: Impact of VM-20 on Product Development: SOA Research
Moderator:
Kelly J Rabin FSA,MAAA
Presenters: Karen K Rudolph FSA,MAAA
Uri Sobel FSA,MAAA Andrew G Steenman FSA,MAAA
SOA Antitrust Disclaimer SOA Presentation Disclaimer
Impact of VM-20 onProduct DevelopmentSOA ResearchValuation Actuary Symposium, 2017Kelly Rabin, Karen Rudolph, Uri Sobel, Andrew Steenman
August 29, 2017
Agenda
Phase 2 Case Studies
Phase 2 Interviews
Observations / Commentary / Impacts
Links to Research Reports
2
Phase 2
Phase 2 expands on the Phase 1 case studies to include the following situations:
Small company with limited data Simplified issue term product Guaranteed YRT premiums Level term product with post-level-term projection 30-year level term product Short pay ULSG product
3
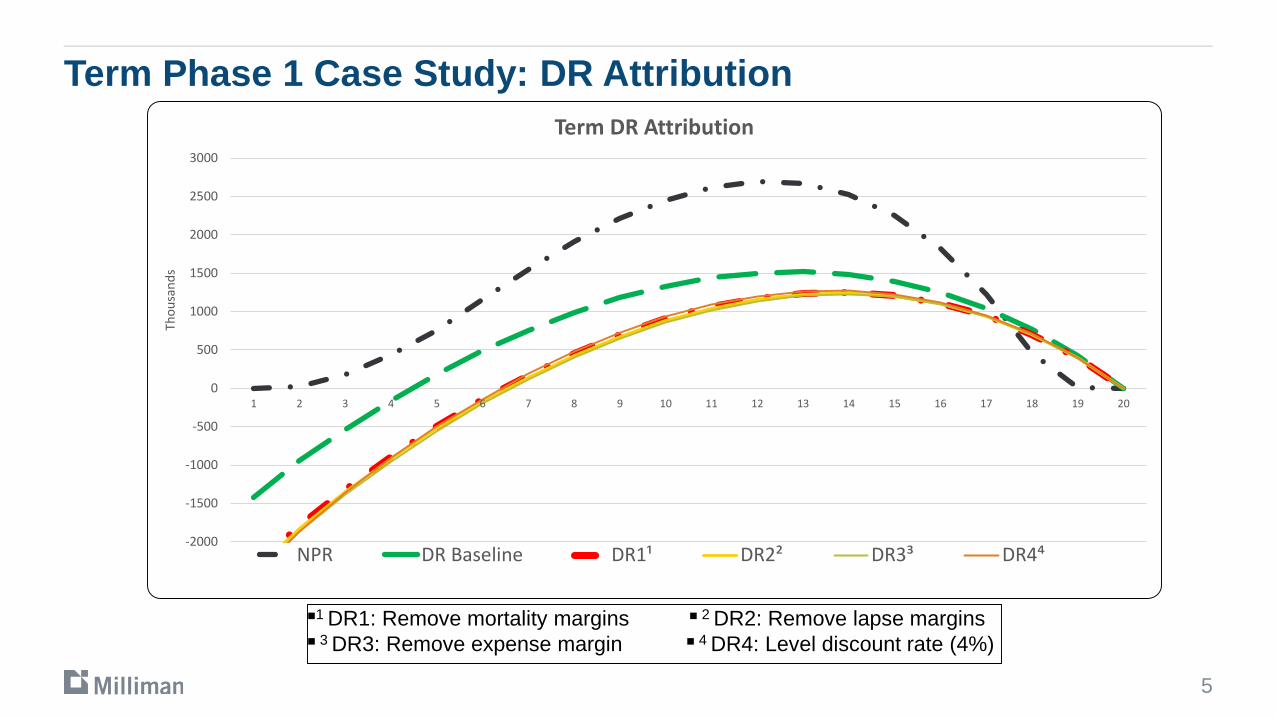
Deterministic Reserve Attribution
DR Baseline: DR from the Phase 1 Situation 5
DR1 Remove Mortality Margins: For each future DR calculation, mortality improvement is included in cash flows beyond the valuation date, or node, and the VM-20 margin is omitted. This effectively brings the mortality assumption back to the company’s anticipated experience. Note that for Phase 1 term, because of the assumed availability of credible mortality data, there was no grading to industry tables over the level term period.
DR2 Remove Lapse Margins: Starting with DR1 assumptions, the lapse margin is omitted from the inner loop cash flows
DR3 Remove Expense Margin: Starting with DR2 assumptions, the expense margin is omitted from the inner loop cash flows
DR4 4% Discount Rate: Starting with DR3 assumptions, the Deterministic Reserve discount rate is assumed to be 4% level
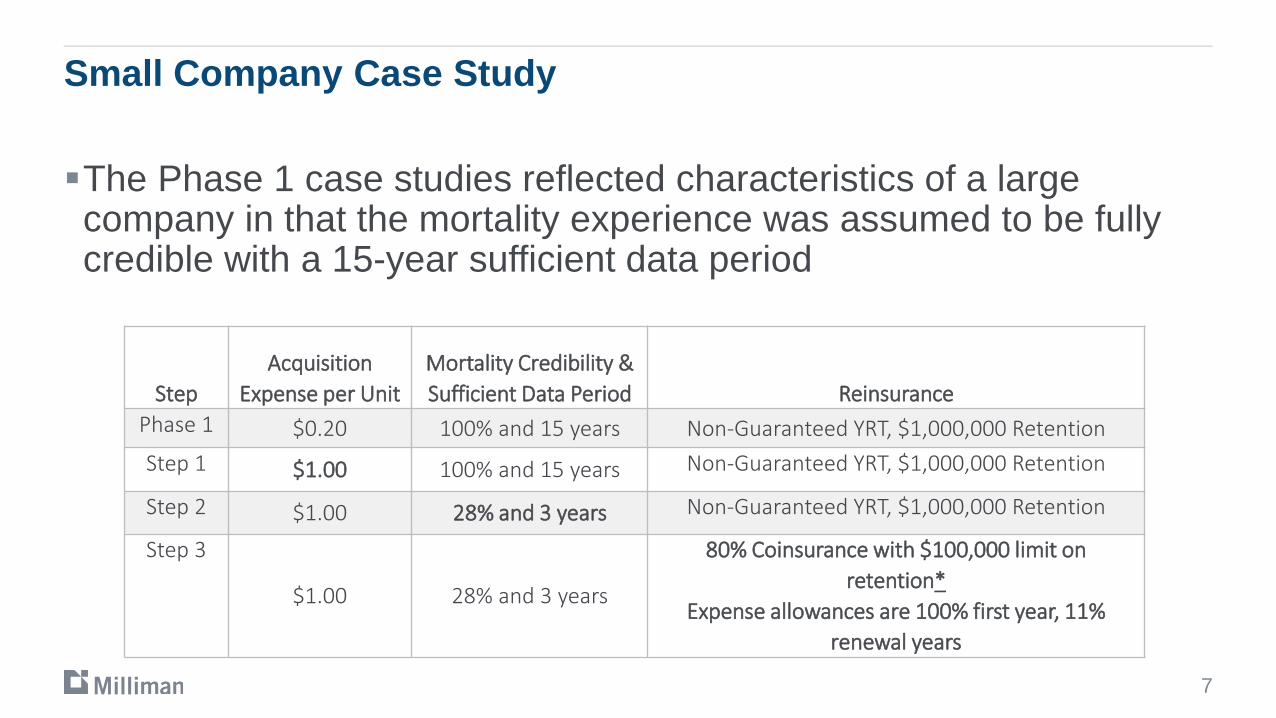
The Phase 1 case studies reflected characteristics of a large company in that the mortality experience was assumed to be fully credible with a 15-year sufficient data period
7
StepAcquisition
Expense per UnitMortality Credibility &Sufficient Data Period Reinsurance
Phase 1 $0.20 100% and 15 years Non-Guaranteed YRT, $1,000,000 RetentionStep 1 $1.00 100% and 15 years Non-Guaranteed YRT, $1,000,000 Retention
Step 2 $1.00 28% and 3 years Non-Guaranteed YRT, $1,000,000 Retention
Step 3
$1.00 28% and 3 years
80% Coinsurance with $100,000 limit on retention*
Expense allowances are 100% first year, 11% renewal years
Term: Small Company Pricing Results
8
Small Company20 Year Level Term
Pretax Profit
Margin1
After-Tax Profit
Margin2
Adjusted After-Tax
Profit Margin3
Surplus Strain
IRRAdjusted After-Tax
High-Band Model OfficePhase 1 Situation 5 19.9% 11.9% 6.7% -147% 10.4%Step 1: Increase Per Unit Acquisition to $1.00 14.7% 8.5% 3.3% -178% 7.1%Step 2: Inner loop mortality 28% credibility; 3 Yr SDP
14.7% 1.0% -4.5% -472% 4.2%
Step 3: Coinsurance 8.1% 1.9% -0.5% -75% 4.5%
1 Pretax profit margin is calculated with discount at the pretax net investment earnings rate (NIER).2 After-tax profit margin is calculated with discount at the pretax NIER.3 Adjusted after-tax profit margin includes target capital effects and is calculated with discount at the pretax NIER.
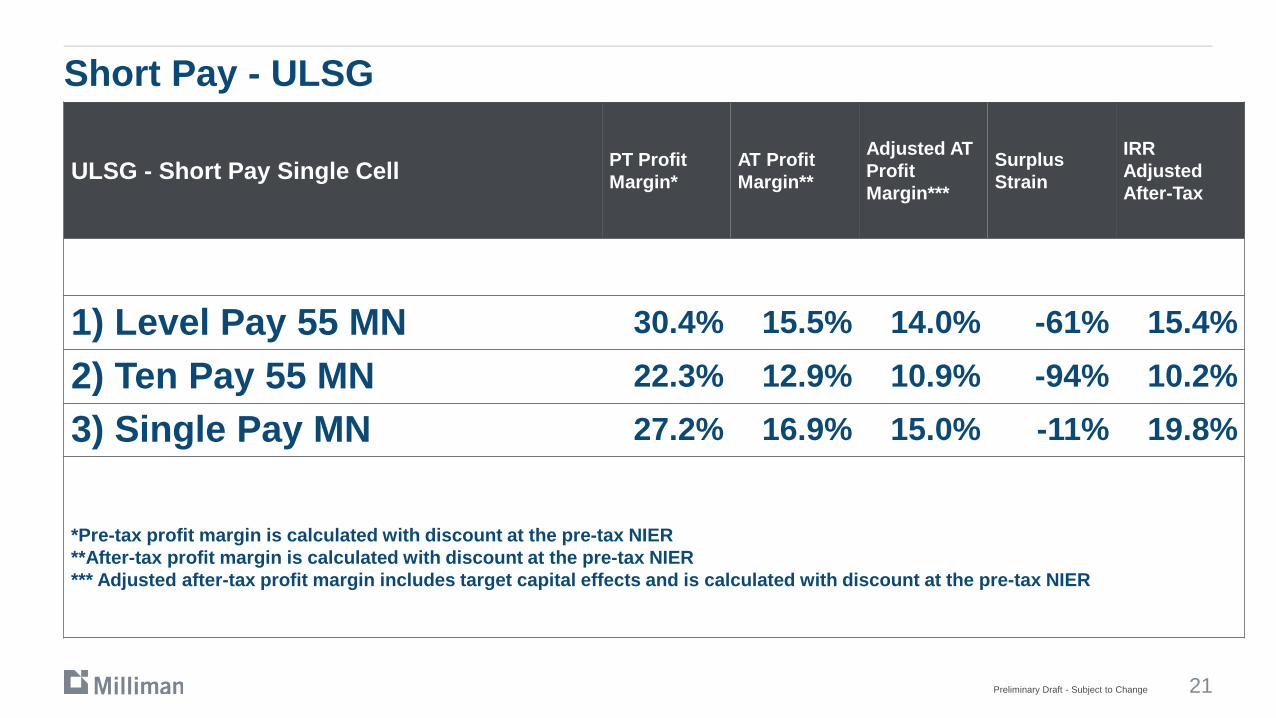
ULSG with Level Premiums for Coverage to A110 PT Profit Margin*
AT Profit Margin**
Adjusted AT Profit Margin***
Surplus Strain
IRR Adjusted After-Tax
High Band Model OfficeStep 1) Phase 1 Pricing Situation 5 19.5% 4.4% 2.6% -285% 5.9%
Step 2) Small Company Reserve Assumptions 18.5% -1.1% -3.0% -503% 4.9%
Step 3) Small Company with Coinsurance 4.9% 2.5% 2.3% -31% 13.4%
*Pre-tax profit margin is calculated with discount at the pre-tax NIER**After-tax profit margin is calculated with discount at the pre-tax NIER*** Adjusted after-tax profit margin includes target capital effects and is calculated with discount at the pre-tax NIER
Preliminary Draft - Subject to Change
Small Company Sensitivity - ULSG
11
(15,000)
(10,000)
(5,000)
-
5,000
10,000
15,000
20,000
25,000
1 11 21 31 41 51 61 71
Small Company Reserve Patterns - $1.2M Band
Small Co w Coin DR Small Co NPR Phase 1 with Coin
Preliminary Draft - Subject to Change
Guaranteed YRT Sensitivity
12Preliminary Draft - Subject to Change
Term Outer Loop Inner LoopMortality Company anticipated experience,
includes improvement into futureCompany anticipated experience with VM-20 margin, but assuming improvement only to the point of valuation, i.e. the future node
YRT premiums –Baseline with $200,000 retention (YRT premiums not guaranteed)
YRT premiums are assessed at a level equal to 110% of the mortality rates in the outer loop
DR calculation assumes YRT premiums equal to 110% of the mortality level in the inner loop which includes the VM-20 margin and improvement only to the point of valuation, i.e. the future node
YRT premiums –Guaranteed 120%
YRT premiums are assessed at a level equal to 120% of the mortality rates in the outer loop
DR calculation assumes YRT charge level equal to 120% of the best estimate mortality rates, therefore the inner loop YRT premiums are the same as the outer loop YRT premiums
Revised Baseline with $200,000 retention 14.0% -2.6% -4.2% −393% 4.6%YRT premiums at 120% of expected mortality 10.1% 4.9% 3.7% −64% 13.9%
*Pre-tax profit margin is calculated with discount at the pre-tax NIER**After-tax profit margin is calculated with discount at the pre-tax NIER*** Adjusted after-tax profit margin includes target capital effects and is calculated with discount at the pre-tax NIER
Preliminary Draft - Subject to Change
Guaranteed YRT Sensitivity - ULSG
14
-
50,000
100,000
150,000
200,000
250,000
300,000
350,000
1 11 21 31 41 51 61 71
Total VM-20 ULSG Reserve - Guaranteed YRT Study
Increased Reinsurance (New Baseline) Guaranteed YRT
Revised Baseline with $200,000 retention 12.9% 7.1% 5.8% −55% 15.0%YRT premiums at 120% of expected mortality 7.2% 3.6% 2.4% −55% 11.7%
*Pre-tax profit margin is calculated with discount at the pre-tax NIER**After-tax profit margin is calculated with discount at the pre-tax NIER*** Adjusted after-tax profit margin includes target capital effects and is calculated with discount at the pre-tax NIER
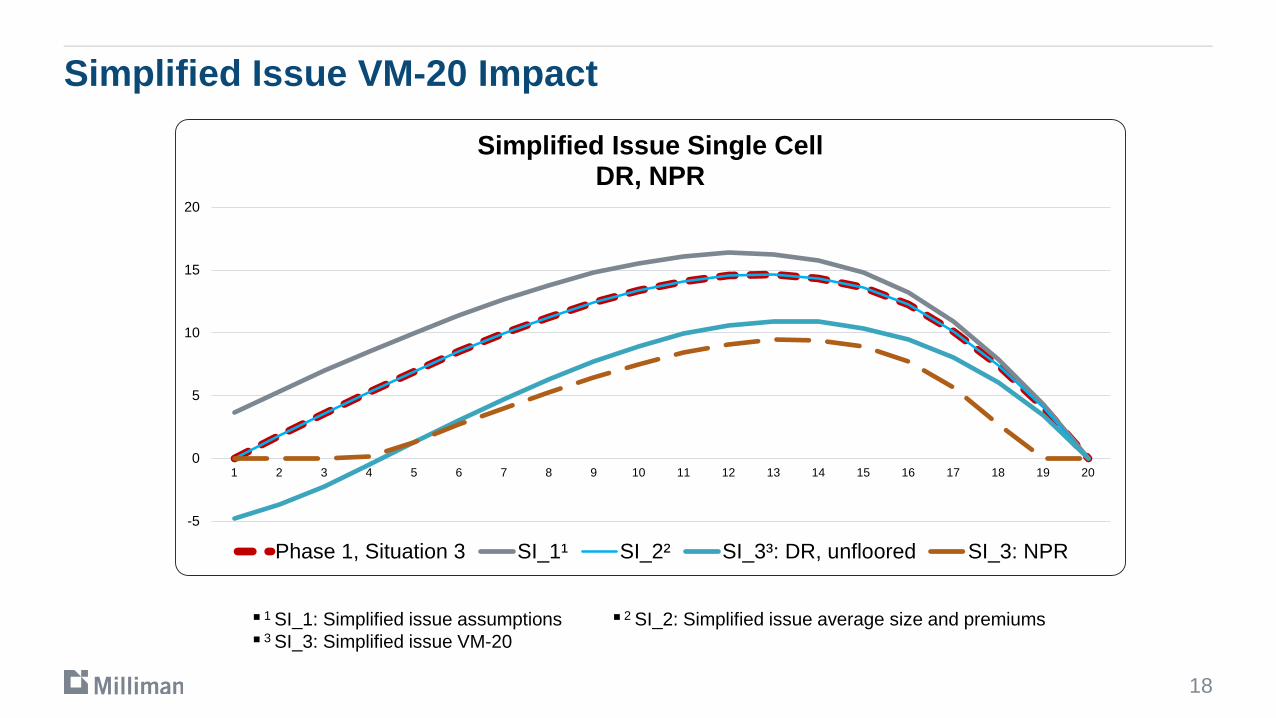
SI_1: SI Experience Assumptions -53.1% -37.3% -40.7% -356% -13.6%
SI_2: $100,000 Average Policy Size; Higher Per Unit Premium
10.9% 6.3% 4.8% -120% 8.8%
SI_3: Implement VM-20 Reserves 10.9% 6.1% 4.6% -120% 10.6%1 Pretax profit margin is calculated with discount at the pretax net investment earnings rate (NIER).2 After-tax profit margin is calculated with discount at the pretax NIER.3 Adjusted after-tax profit margin includes target capital effects and is calculated with discount at the pretax NIER.
■ 1 SI_1: Simplified issue assumptions ■ 2 SI_2: Simplified issue average size and premiums■ 3 SI_3: Simplified issue VM-20
Simplified Issue VM-20 Impact
DR is negative at issue because the cell has been priced for statutory profit
NPR prevails from issue until the 6th duration
Reserve build up is delayed compared to XXX
DR is higher than NPR reserve after duration 6 which creates tax inefficiencies during those years
Other considerations: Is 2017 CSO appropriate table to use What if mortality expectations are higher than any available industry tables? With partial credibility, the company must choose what table to grade to How does the actuary demonstrate a mapping to the industry table?
19
30 Year Term Case Study: Pricing ResultsLow Band, Single Cell
1 Pretax profit margin is calculated with discount at the pretax net investment earnings rate (NIER).2 After-tax profit margin is calculated with discount at the pretax NIER.3 Adjusted after-tax profit margin includes target capital effects and is calculated with discount at the pretax NIER.
*Pre-tax profit margin is calculated with discount at the pre-tax NIER**After-tax profit margin is calculated with discount at the pre-tax NIER*** Adjusted after-tax profit margin includes target capital effects and is calculated with discount at the pre-tax NIER
Preliminary Draft - Subject to Change
Short Pay Study - ULSG
22
-
20,000
40,000
60,000
80,000
100,000
120,000
140,000
160,000
1 11 21 31 41 51 61 71
Total VM-20 Reserve - Short Pay Study
Level Pay Ten Pay Single Pay
Preliminary Draft - Subject to Change
Phase 2 – Interviews One hour discussions with product development actuaries Fourteen different companies Consistent set of open-ended questions
23Preliminary Draft - Subject to Change
Phase 2 – Interviews
Preparedness Implementation Collaboration
Pricing Process Simplifications
24Preliminary Draft - Subject to Change
Phase 2 – Interviews (Preparedness)
VM-20 “Czar” or special VM-20 committee. Valuation area lead effort in some companies. In others, pricing lead. Companies doing AG48 reserve financing ahead and valuation focused. Resources: conferences, webinars, boot camps, and pilot studies, individual
reading, outside consultants. Many companies doing trial runs with VM-20, but only a few planning product
launches in 2017 or early 2018. Term likely to come before ULSG. VM-20 may eventually produce Term and ULSG product design changes, but
no company indicated they worked through all the details. Most taking a “wait-and-see” approach.
25Preliminary Draft - Subject to Change
Phase 2 – Interviews (Implementation Concerns)
Fluctuation of reserves and profitsUnlocking of assumptions and potential future changes in methodologyExplaining movements to senior management
Definition of tax reserves Guidance for assumptions and margins, particularly for newer features and
underwriting regimes with limited experience (e.g., accelerated underwriting) Lower profitability
Small companies with limited or near-zero credibilityCompanies currently engaged in reserve financing
Allocation of VM-20 excess reserves to profit cells
Complexity of calculationsMost systems can handle, but effort still required: upgrading, custom coding,
trainingSeparate inner-loop versus outer-loop assumptionsAuditabilityCoordinating multiple systems (e.g., NPR versus DR and SR)Moving to asset / liability approach (for companies previously using liability only)Runtime
Longer time-to-market in initial years following VM-20 implementation
27Preliminary Draft - Subject to Change
Almost all companies noted increased cooperation and communication between company areas:
Pricing and ValuationCorporateModelingTax
Promote consistency in assumptions More cross functional meetings, work groups, and governance committees
Variety of levels of formality Common theme: VM-20 accelerating or strengthening already existing
governance structures and plans
Phase 2 – Interviews (Collaboration)
28Preliminary Draft - Subject to Change
Phase 2 – Interviews (Changes to Pricing Process)
Same basic steps to pricing process as currently Slower process expected, at least initially, due to:
Collaboration / Communication (interdepartmental, regulators, reinsurers) Initial decision-making regarding various aspects of VM-20 calculations Increased runtimeMore sensitivity testingMore challenging auditing and validationMore reserves to calculate than currently (NPR, DR, SR)
Potential adjustments to reinsurance agreements/rates; reinsurer input being sought more often throughout pricing process
Likely to start with fewer shortcuts and after gauging materiality Liability grouping, cluster modeling, asset grouping Setting certain assumptions in the outer loop equal to the VM-20 compliant
assumptions of the inner loop Using an aggregate margin rather than margins on specific assumptions Calculate DR discount rates and SR only at selected nodes Assume no changes to future credibility or sufficient data period Particularly for sensitivity testing, use relationship between DR and SR to
approximate the SR, or only change outer loop assumptions
30Preliminary Draft - Subject to Change
VM-20 Research Wrap Up – Phase 1
Term, not Financed: PBR increases internal rates of return (IRRs) Term, Financed: PBR decreases internal rates of return (IRRs) ULSG, not Financed: PBR has no material impact internal rates of return
(IRRs) ULSG, Financed: PBR decreases internal rates of return (IRRs) Companies that finance statutory reserves may have incentive to delay
implementation The intuitive idea of PBR reducing reserves and therefore premiums is
not a given under VM-20
31Preliminary Draft - Subject to Change
VM-20 Research Wrap Up – Phase 2 Case Studies
For both term and ULSG, moving from anticipated experience mortality to VM-20 mortality assumptions had the biggest impact on the level of reserves
Small Company Study: Deterministic Reserves is as great as, or greater than, XXX reserves in many durations
Guaranteed YRT case studies produced different results for the term and ULSG products
SI: VM-20 reserving methods may improve IRR compared to Model 830 methods
32Preliminary Draft - Subject to Change
VM-20 Research Wrap Up – Phase 2 Industry Interviews
Even mix between the pricing and valuation areas regarding where VM-20 expertise resided
Higher level of unpredictability and fluctuation in their reserves and anticipated profits under VM-20
Intensiveness and complexity of the computations necessary for VM-20
Lower anticipated profitability upon moving to VM-20 reserving
“Wait-and-see” approach on product design changes
Not much thought to “other” products in a VM-20 context


![CICADA - USENIX · 1 vm 2 vm 3 vm 4 vm 5vm 6 vm 7 vm 8 vm 9 vm 2 vm 3 vm 4 vm 5 vm 6 vm 7 vm 8 vm 9 vm 1 rigid application (similar to VOC [1]) vm 1 vm 2 vm 3 vm 4 vm 5vm 6 vm 7 vm](https://static.documents.pub/doc/80x56/5f3ade2be7477529602b0cb3/cicada-usenix-1-vm-2-vm-3-vm-4-vm-5vm-6-vm-7-vm-8-vm-9-vm-2-vm-3-vm-4-vm-5-vm.jpg)


