Paper No. 15 N76-16576 SYNOPSIS OF CURRENT SATELLITE SNOW MAPPING TECHNIQUES, WITH EMPHASIS ON THE APPLICATION OF NEAR-INFRARED DATA James C. Barnes and Michael D. Smallwood, Environmental Research & Technology, Inc., Concord, Massachusetts 01742 ABSTRACT The Skylab EREP S192 Multispectral Scanner data have provided for the first time an opportunity to examine the reflectance characteristics of snowcover in several spectral bands extending from the visible into the near- infrared spectral region. The analysis of the S192 im- agery and digital tape data indicates a sharp drop in reflectance of snow in the near-infrared, with snow be- coming essentially non-reflective in Bands 11 (1.55- 1.75 urn) and 12 (2.10-2.35 vim). Two potential applica- tions to snow mapping of measurements in the near-infra- red spectral region are possible: (1) the use of a near-infrared band in conjunction with a visible band to distinguish automatically between snow and water droplet clouds; and (2) the use of one or more near- infrared bands to detect areas of melting snow. INTRODUCTION More than 15 years ago, in April 1960, snow could be de- tected in eastern Canada in the initial pictures taken by the first weather satellite, TIROS-1. Since then, as improved satel- lite systems have been developed, an increasing use has been made of remote sensing from space to map snowcover. Recently, a hand- book of techniques for satellite snow mapping has been prepared to assist in the planning of a practical demonstration project of the application of satellite data to snow hydrology (1). In the handbook, the emphasis is on the use of NOAA VHRR (Very High Re- solution Radiometer) and LANDSAT (formerly, the Earth Resources Technology Satellite) visible imagery. These data have been shown to have practical application to snow hydrology. In addition to satellite imagery in the visible portion of the spectrum, measurements in the near-infrared spectral re- gion may also have considerable application to snow mapping. In this paper, the results of an investigation of snow reflectance characteristics using data from the Skylab EREP (Earth Resources Experiment Package) S192 Multispectral Scanner are presented (3). The S192 Multispectral Scanner provided for the first time an opportunity to examine the spectral characteristics of snow from spacecraft altitude over the spectral range extending from the 199 Preceding page blank
Transcript
Paper No. 15 N76-16576SYNOPSIS OF CURRENT SATELLITE SNOW MAPPING TECHNIQUES,WITH EMPHASIS ON THE APPLICATION OF NEAR-INFRARED DATA
James C. Barnes and Michael D. Smallwood, Environmental Research & Technology,
Inc., Concord, Massachusetts 01742
ABSTRACT
The Skylab EREP S192 Multispectral Scanner data haveprovided for the first time an opportunity to examinethe reflectance characteristics of snowcover in severalspectral bands extending from the visible into the near-infrared spectral region. The analysis of the S192 im-agery and digital tape data indicates a sharp drop inreflectance of snow in the near-infrared, with snow be-coming essentially non-reflective in Bands 11 (1.55-1.75 urn) and 12 (2.10-2.35 vim). Two potential applica-tions to snow mapping of measurements in the near-infra-red spectral region are possible: (1) the use of anear-infrared band in conjunction with a visible bandto distinguish automatically between snow and waterdroplet clouds; and (2) the use of one or more near-infrared bands to detect areas of melting snow.
INTRODUCTION
More than 15 years ago, in April 1960, snow could be de-tected in eastern Canada in the initial pictures taken by thefirst weather satellite, TIROS-1. Since then, as improved satel-lite systems have been developed, an increasing use has been madeof remote sensing from space to map snowcover. Recently, a hand-book of techniques for satellite snow mapping has been preparedto assist in the planning of a practical demonstration project ofthe application of satellite data to snow hydrology (1). In thehandbook, the emphasis is on the use of NOAA VHRR (Very High Re-solution Radiometer) and LANDSAT (formerly, the Earth ResourcesTechnology Satellite) visible imagery. These data have beenshown to have practical application to snow hydrology.
In addition to satellite imagery in the visible portionof the spectrum, measurements in the near-infrared spectral re-gion may also have considerable application to snow mapping. Inthis paper, the results of an investigation of snow reflectancecharacteristics using data from the Skylab EREP (Earth ResourcesExperiment Package) S192 Multispectral Scanner are presented (3).The S192 Multispectral Scanner provided for the first time anopportunity to examine the spectral characteristics of snow fromspacecraft altitude over the spectral range extending from the
199
Preceding page blank
visible to well-into the near-infrared.
S192 MULTISPECTRAL SCANNER DATA
Description of S192 Sensor
The S192 Multispectral Scanner is a 13-band radiometerwith 12 of the bands being in the visible or near-infrared por-tion of the spectrum extending to about 2 ym (the thirteenth bandis in the thermal infrared). The spectral range for each band isgiven in Table 1. The conical scan pattern of the S192 covers aswath of the earth's surface that is approximately 72.4 km wide;the instantaneous field-of-view (IFOV) is 79.25 meters (260 feet).A detailed description of the Multispectral Scanner is given inthe Skylab Earth Resources Data Catalog (5). Both imagery anddigital data from Computer Compatible Tapes were used in the dataanalysis.
The S192 data used in this study were acquired for fourtest site areas: the Sierra Nevada-White Mountains are in Cali-fornia; the Wasatch Range in Utah; the central Arizona mountains;and a portion of the Upper Mississippi-Missouri River Basin inthe north-central part of the country. Data from five EREPpasses were analyzed, two from the SL-2 mission in June 1973 andthree from the SL-4 mission in January-February 1974.
Meteorological data indicate the snowcover in the testsite areas observed in June 1973 was quite probably in a meltingcondition, except perhaps at the highest elevations. In each ofthe test site areas observed in mid-winter, some melting couldhave been taking place at lower and middle elevations, or thesnowpack could have been refrozen from melting that had occurredduring the proceeding few days. However, the snow conditions
were more stable than in the two springtime cases. No S192 datawere collected over a test site area immediately following a freshsnowfall or during a very cold period.
ANALYSIS OF S192 IMAGERY
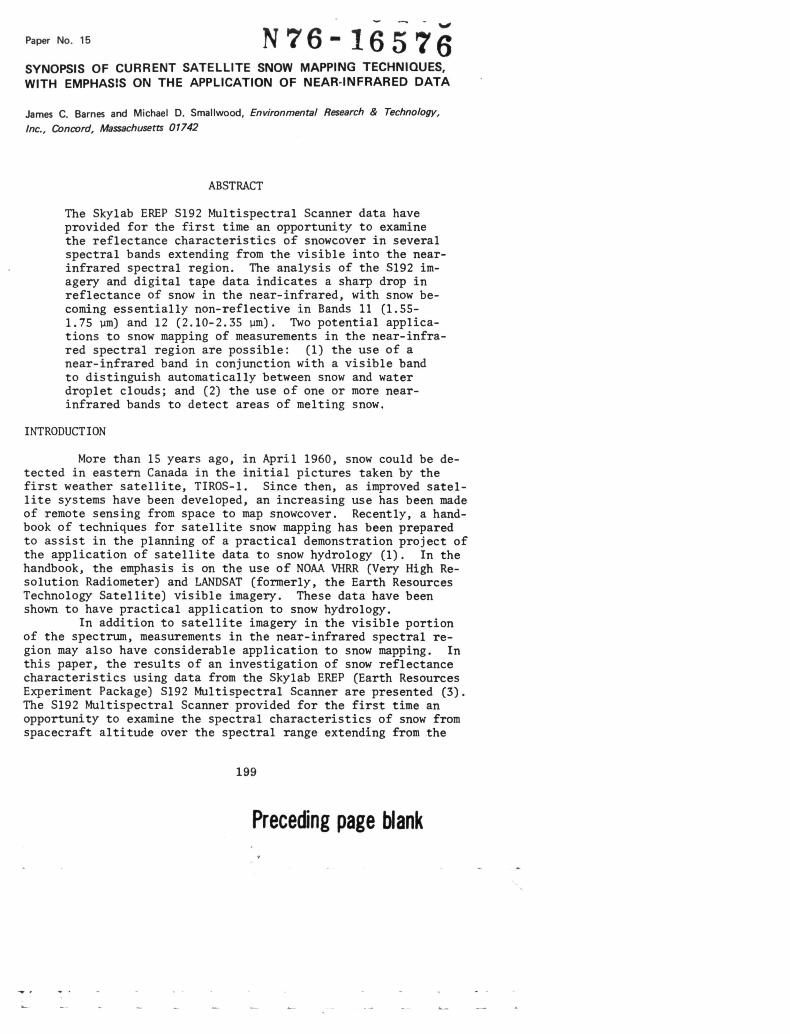
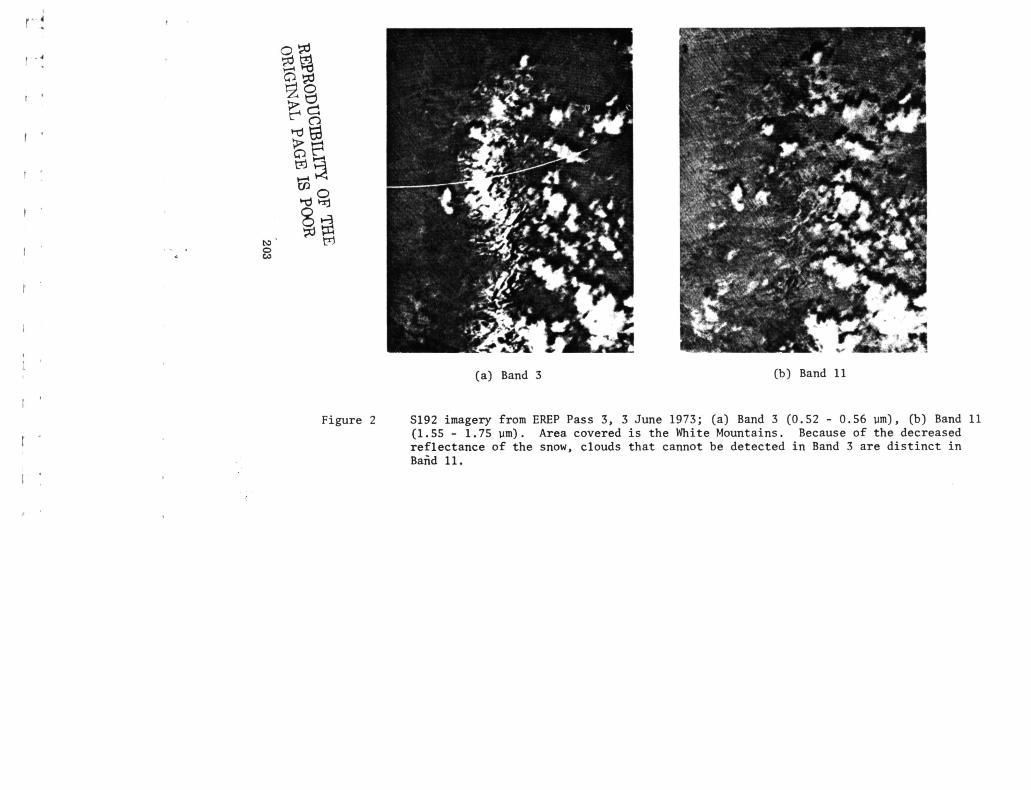
The S192 imagery displays a marked drop in the reflectanceof snow in the near-infrared bands. This effect is readily ap-parent in the imagery from the two SL-2 EREP passes, over theSierra Nevada-White Mountain area and the Wasatch area. For theWasatch area the S192 Band 2 and Band 11 imagery is shown in Fig-ures la and Ib. Similarly, the S192 Band 3 and Band 11 imageryfor the White Mountains is shown in Figures 2a and 2b. In bothcases, snowcover has a high reflectance in the visible band, butappears essentially black in the near-infrared.
In Figures 2a and 2b, not only is the difference in thereflectance of the snow between the visible and near-infraredbands dramatic, but also the distinct nature of the clouds in thenear-infrared spectral region. The concurrent S190A photographindicates that cellular-type clouds, a pattern representative ofcumulus (water clouds) cells, cover much of the area. Over themountains, it is difficult to distinguish between the clouds andthe snow in the visible band S192 imagery because both have essen-tially the same reflectance. In the Band 11 imagery, however,the clouds still appear white, whereas the snow appears essentiallyblack; therefore, each cumulus cell is distinct, even those cellsdirectly over the snowcovered mountains.
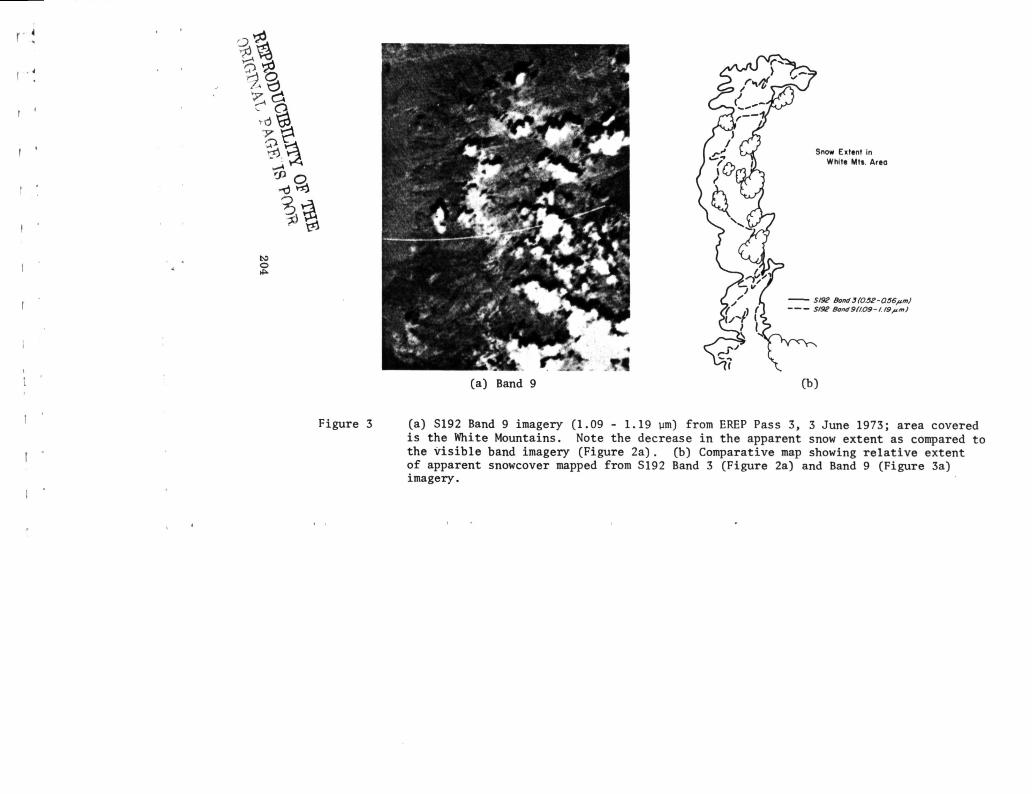
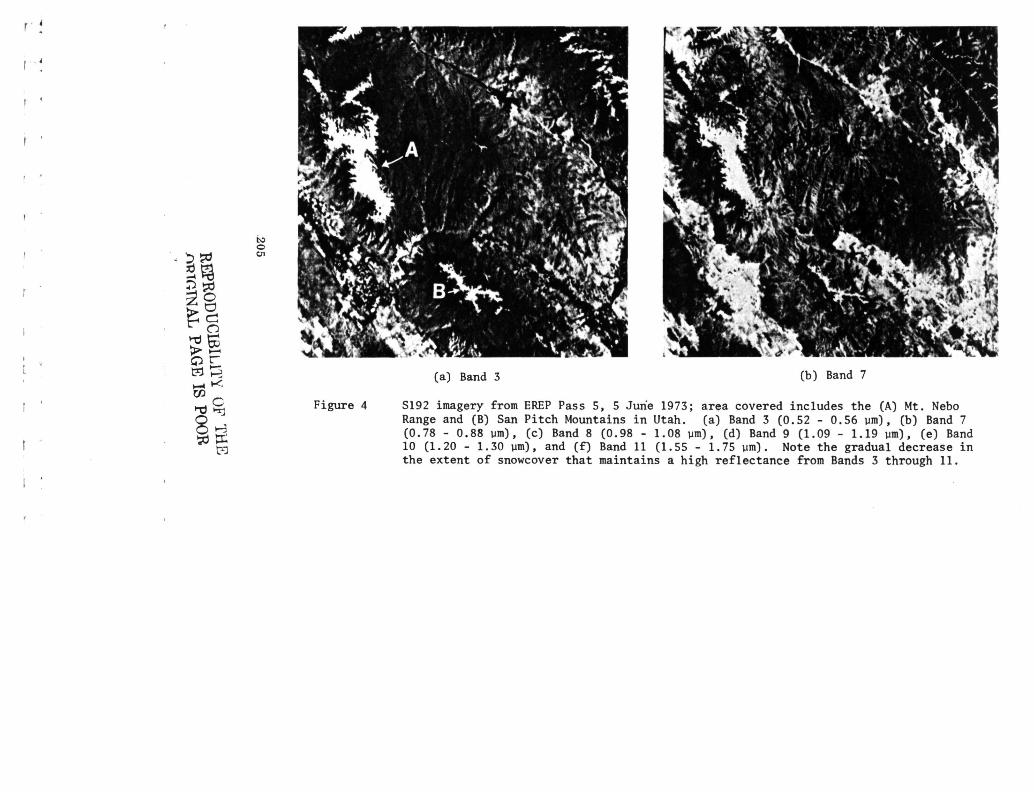
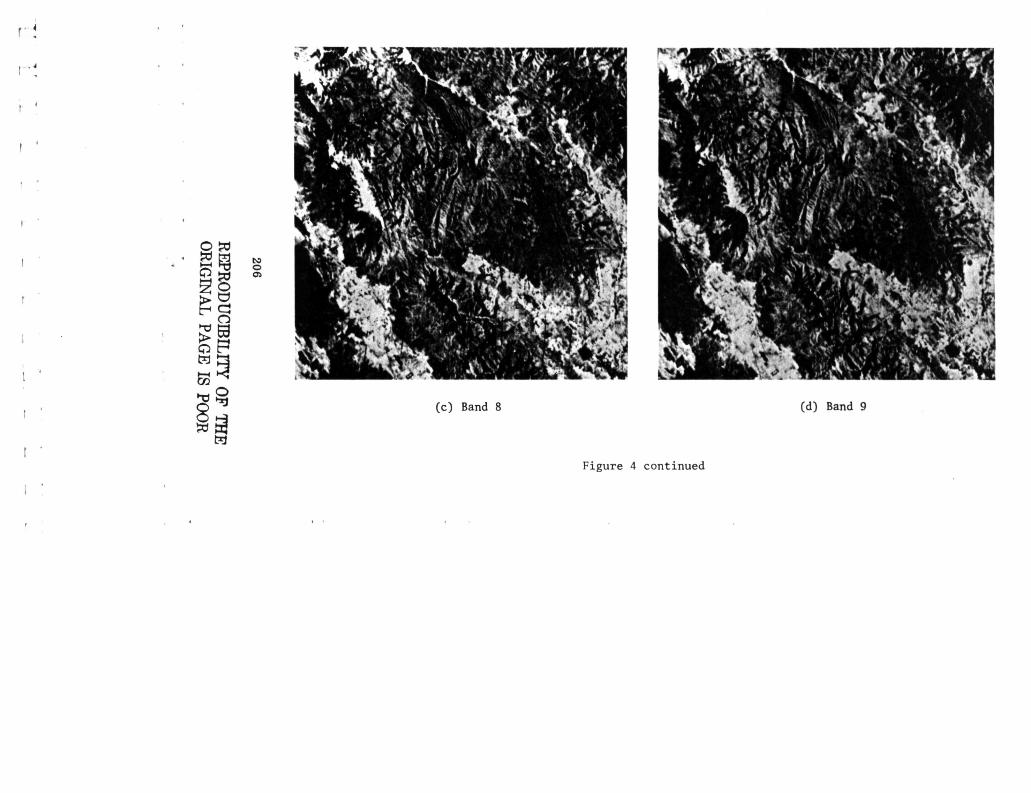
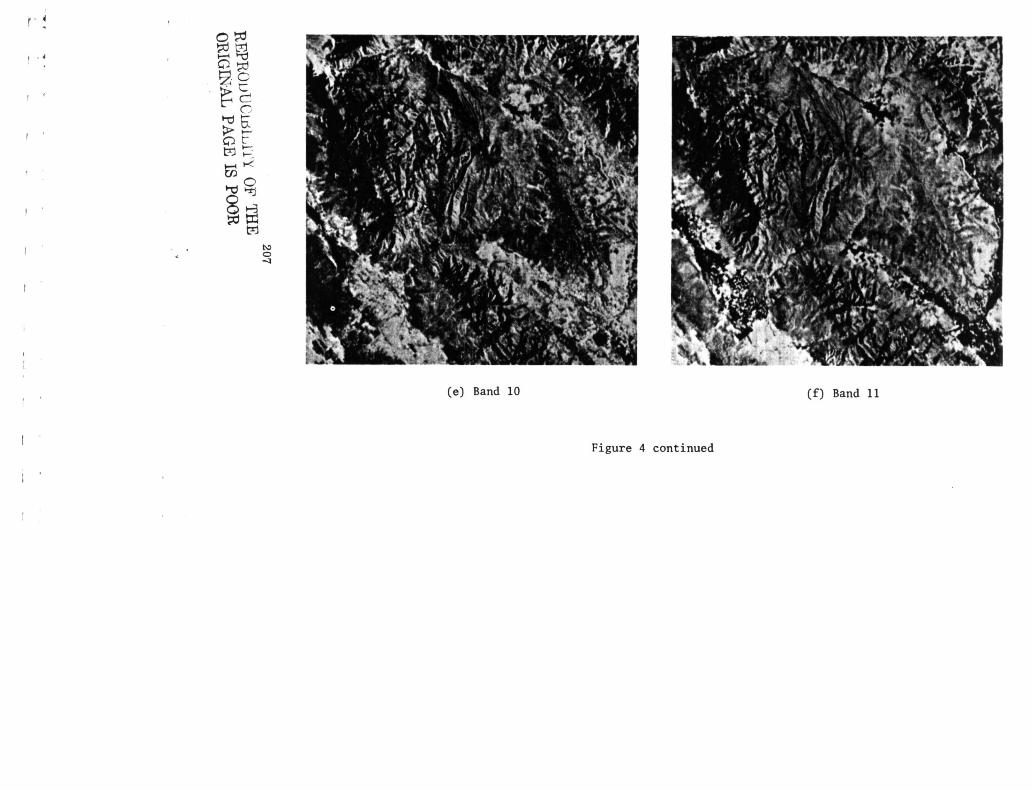
In the imagery from the June 1973 pass over the WhiteMountains, some snow can be detected in Band 9 but the extent ofthe snow appears less than in the visible band; the Band 9 imageryis shown in Figure 3. The apparent decrease in snow extent inthe intermediate spectral bands is also observed in the data forthe Utah test site area, which includes the Mt. Nebo Range andSan Pitch Mountains (Figures 4a through 4f). In the visibleband, the entire snowpack has a high reflectance. In Band 7,however, a slight decrease in the apparent snow extent in the Mt.Nebo Range is observed; in Bands 8, 9, and 10, the apparent snow-cover successively decreases until in Band 10 the only brightarea is along the highest ridge of the range; in Band 11, no snowcan be detected. In the San Pitch Mountains, which are at a low-er elevation, the less extensive snowcover can barely be detectedin Band 7 and cannot be detected in Bands 8 through 11.
The results of the analysis of S192 imagery for the win-tertime cases are essentially the same as those for the SL-2 datadiscussed above. In each case, snow has a high reflectance inthe visible, except in areas that are forested, whereas in theBand 11 imagery, the entire snowcovered area is non-reflective.In the intermediate spectral bands, a gradual lowering of the re-flectance is observed beginning with about Band 8 or 9; however,the decrease in reflectance is uniform across the snowcover, andno gradual decrease in the apparent snow extent is observed, aswas the case in the data from each of the SL-2 passes.
201
13aCQ
c <u«
^C
Q•a
/—x «>j: tnv-' rt-g
/-^ o6 <1)3.-O
rt 4)
in 4->C
M
<N
-H
O
jB
£ M
rt c P
-J03
0)
OS *O
/->
Ccd rC
rt
^-^
O 0
0
•• rt
4)to
</> 4;i- rt 4J
202
.*
OF
TH
EO
RIGIN
AL PA
GE IS PO
OR
C ij 'r
t3
^4
)•H
rtin
C
--a E
«
4)
Om
f-i o4)
in >
inin o
a
at o
G.
r-lrt .-i
a. 4>uj
^ -a
2 <
cuj
rt
-' >^^Ti.-*:-"-
HS.-i"'
.-
.*:
03oa
<4-l 3.
>, in
o^ r- C
a> •
in03
<4-li
O•H
in
atCM in
o
o> •
Ci—
i i-f rt
C/3
v-
<J
M
f— 1
f— I
•oCrtoa^
•O 13
CC
4) -H
rt in
CQ
rt 4->
4) o
/-N
^
C
J3
O -H
*— '
4)
4->
T3 in
/— • >
4) T3
E £
3. 4J
4)(Hvo
i*-i rt
l/>
Oro
0 4
)in -O
i 3
Crt
rtC
N
(J C
Qin
4)
• C
O C
O
-H
• T3
to
« 4)
C
+JT
3 -H
O
C
rt 4)
rt +->
*J03
C
4)3
-a,—
V
O
rt S
4)
•o0)03
4)3
Irto
to•a m
« 4) T
3to
h
3
4) O
in >
rt
in o
o
rt o
e_ .
rt X
B.
4) O
UJ h
C
2 <
intu
4)
t-l 3. <4-l
b-°
E( t~~
4)4)
• O
Mrt
Crt
rt •
E I
•!-> rt
•H
O
rtLT>
4>(N
1/5
rt T
3O
) • <4-l
'C?-H
rt 4)
5
a
20
3
-oV!-.OO
*g
cd ,
P. x
toE
4>
Cd O
4)
4) C
J 4)
(H*-
>
3cd
in -H
Go
ed *J
-Hcd
U.
to
4-> i-t
^r~
e 4
>01
tu (-1 o>
i-( 4->X
bO
-O4)
4) C
C
C
-H cd
3
S
S £
0
0)
cfl
a)(N
0) O
. >
4)a. O.-H
^al
4-" 3a
. M
MU
J
4)
^1
-rt2 x
rt B.
I
•ac01
\ i-Hin
O -H
<4H
Uinr-. cd4)UCT>
4>^-i T
3«N
rH
4)
EX
4) O
I 4->
(-1 IH
CT
l CP
Mo
+j -H
-a•
O B
, 4)
^-i z ^
a.*-_-*
o|
b
-^§
Ei w e
C
0000 .
•H
C
O
og'ggS
cd C
•O
JD
in
cd 4->
4) 4J
•~i
C£,
4)
•H
h
CO
-
^H
4)
« cd
•H
&,
Cd 60cd
cd in
x
<*-i E
>—
'-H
4J
O -H
4>
204
CIV
to4)
rt§CQ
T3
Cf~
C
-H
X
T5 C
Q 4
) i-H0)
C
W i-H
Z
cd /-^ rt
CQ
Oj
C)
X>-' h
60
4J /—
N
Op
* O
O-»-O
»H
e oi4)
3. i-H
LOin
•
l1)
O•O
O
l3
i Ol-H
•
O
CM
l-H(3
LO
v->
O O
>
CSnt in
^ -a
M§
<U
CQ
5 EO
» .JH
•8. j to
Cv
a>
T
3 C
Qo e0
rt r->CO
T
)0)
'-'
® ^
(H rt
•rt >-'/-N
to •
r~- X oo
01 nt c
l-H
4->
•
.. 3 -
1I
•H
O
•§.s"-3
O
Oin 01
to C
•
•H O
- 0)
LO
4->S °°
« 3
in O tJ
cB S
Ca.
n)X
CQo-
oa/..[U
D
. >—
'
E
C
»0 rt /->
(H
LO
E
/—N
xo
a to
t-i --^ooo60T
3 O
E
n) i
•Hfl)
OO
CM eo r-
01 C
•
•-H rt
Oto os *-*
ort
LO MH
r^ «
• ^
LO
XLO•
rt
i-H >
Hi-l
Oj
«4H
0)*-^X
13cd o
^H
O
I 4->
O
Q>
CM
4->
• X
O X
•-H
4->
4)I•HtL,
205
rtCD
oo-ogCO
/—>
u
11uVI
206
REPROD
UCIBILITY
O
F THE
ORIG
INA
L PAG
E IS POO
R
•a§en/—\
in
'
rtm
-OI§u(U(HM
20
7
OB1G
INA
L PAG
E IS POO
R
ANALYSIS OF S192 DIGITAL DATA
Data Processing Procedures
The high data rate of the S192 instrument presented someproblems in working with the Computer Compatible Tapes (CCT's).Even for the rather limited time segments for which CCT's wereprovided, it was not feasible to perform digital count to radianceconversions for the entire data segment. The principal problem,therefore, was to devise a technique for the selection of speci-fic data segments of only a few scanlines corresponding to thelocations of known ground features.
The technique devised to accomplish this task was a pre-selection procedure based on the analysis of raw channel counts.Knowing from the information on the S192 data supplied by NASAthat snowcover would likely be saturated in the visible bands, achannel corresponding to one of the visible bands was selected.The CCT's were then manipulated such that each pixel in that chan-nel that was saturated (raw data count = 255) would be printedout as a black dot and each pixel that was not saturated (rawdata count < 255) would be left blank. The result produced animage-like printout where all snowcovered (non-forested) areasappear black, and, therefore, specific features could be located.
Following selection of the specific numbers of scanlinesand pixels from the printout, the calibrated radiances for eachrequired channel were computed using the appropriate conversionequation supplied with the tapes. This processing technique wasfound to be extremely efficient and greatly facilitated the hand-ling of the S192 Computer Compatible Tapes.
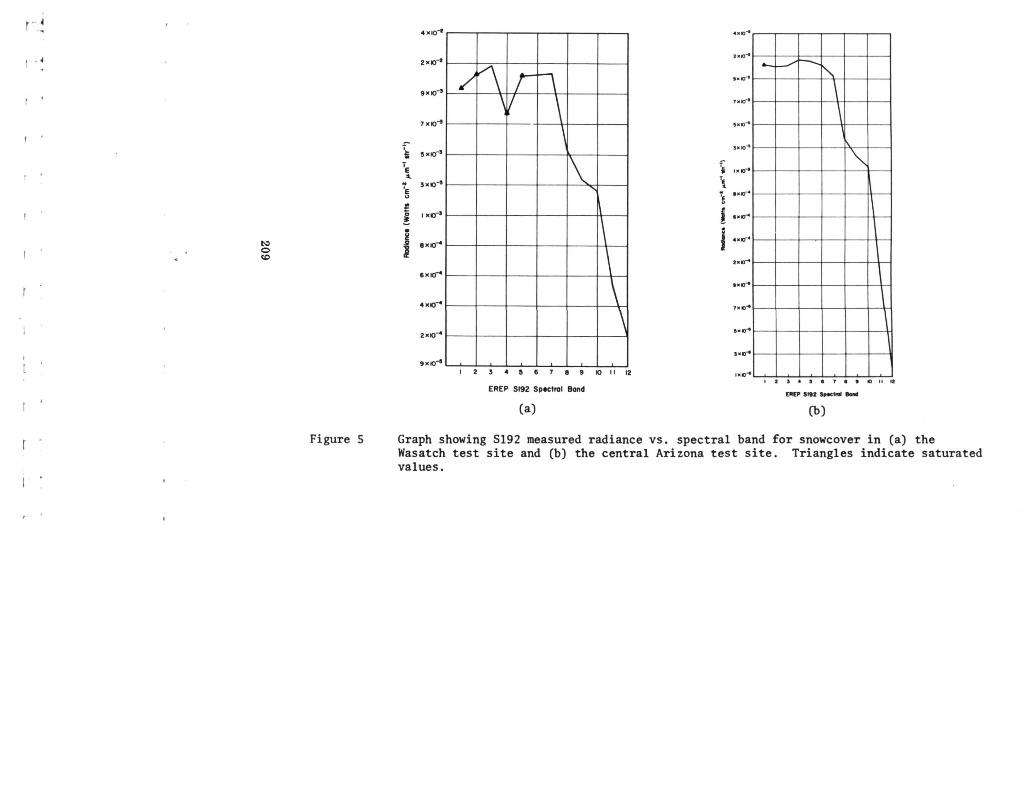
Results of Analysis.
The radiance values obtained from the processing of thedigitized data were analyzed for each of the four cases (digitaldata were not available for the June 1973 pass over the Califor-nia site area). A single*pixel determined to be located within auniform snowpack was selected for each of the four test siteareas. The radiance value for the pixel was averaged with thefive pixels before and after it to acquire a true representationof the snow response. This process was repeated for each band,and the averaged values were then graphed. The resulting graphsof the radiance values for each spectral band are shown in Fig-ures 5a and 5b for two of the test sites, the Wasatch and the cen-tral Arizona Mountains.
For each of the test sites, the graphs indicate satura-tion or near saturation values (triangles indicate saturationlevels) throughout the visible portion of the spectrum followedby a significant decrease in reflectance in the near-infrared.In the interpretation of the graphs it is necessary to considernot only the curve itself, but also the curve in relation to sat-uration levels; in this way, a saturated value is not misinter-preted as a decrease in reflectance (such as Band 4).
208
-o4)
: i:i
(,.«• i-
"* !
cd rt
•— ' O•H
c •«•H
C•H
hv in
>
i)O
I-H
O
60
I Sfit.2c -Hrt
in
I-H
V)
cd v
o rt
4) C
D. O
in M•H
(,-»* i
«»»*) «»»ll»*l
4) 0)
O
(H
§£
•H
4)
T3
y!H
4>
3 .0
U)
'-'rt4>
-am60C <
->•H
I/I
2
4)
O
-PO
I/IX
<->
4)o. a) art
i/i I-H(H
rt rt
209
DISCUSSION OF RESULTS OF S192 DATA ANALYSIS
Comparison of SL-2 and SL-4 Data
For the five cases for which S192 data were analyzed, theoverall results of the analysis of the imagery and the digitalradiance values are consistent. In each case, snowcover exhibitsa marked drop in reflectance in the near-infrared portion of thespectrum. Moreover, no significant difference in the reflectancecharacteristics of snow is apparent in the five cases examined,even though two of the cases were from the late spring and theother three from mid-winter. One difference that was observed,however, is that in both of the late spring cases the apparentextent of the snowcover gradually decreases from Band 7 throughBand 11; in the winter cases, a uniform decrease in reflectanceis observed with no apparent change in the detectable snow ex-tent.
As was pointed out in the earlier discussion of the datasample, even in the winter cases no data were collected immed-iately following a fresh snowfall. Thus, the two spring caseswere at times when the snowpack was in a general melting condi-tion, whereas the three wintertime cases were at times when thesnowpack was more stable but still consisting of somewhat agedsnow that might be undergoing slight melting or had undergonemelting and become refrozen.
It must also be remembered that the problem of measuringradiance values from a spacecraft platform is extremely complex.Many factors, such as the slope of the reflecting surface andespecially the solar elevation angle, can influence the measure-ments. The solar elevation angle must be considered when attemp-ting to compare measurements taken over different areas at differ-ent times of the year. Atmospheric attenuation must also betaken into account; however, the preliminary results of anotherSkylab investigation being conducted at ERT indicate that theerror in determining surface reflectance for snow would be lessthan five percent for all spectral bands.
Comparison With Laboratory Experiments
The results of the analysis of the Skylab data are ingeneral agreement with the results of laboratory experiments ofthe red and near-infrared spectral reflectance of snow (6). Sincethe laboratory results are in terms of the snow reflectance rela-tive to a standard (white barium sulfate powder), it is difficultto compare these results directly with S192 measured radiances.However, graphs of the laboratory results show similar tendenciesto the S192 radiances over snowcover. The S192 results indicatea decrease in snow reflectance beginning in Band 8 (0.98-1.08 urn);the laboratory experiments indicate a high reflectance in the red,with a marked decrease in reflectance from about 0.90 to 1.0 \aa(a slight increase in reflectance occurs at 1.0 to 1.1 vim).Secondly, the S192 results show a slight leveling off of the drop
210
in snow reflectance in Band 10 (1.20-1.30 ym); the laboratoryexperiments show that the reflectance decreases rapidly from 1.1to 1.5 ym with the exception that at about 1.25-1.35 ym it levelsoff and even makes a slight recovery. Finally, the S192 resultsshow the lowest reflectance values to be in Bands 11 (1.55-1.75ym) and 12 (2.10-2.35); the laboratory experiments show low re-flectance values at about 1.5-1.6 ym and an even stronger depres-sion at 1.95-2.05 ym with a very slight rise at about 2.25 ym.
In the laboratory experiments, natural aging of the snowinfluences both the degree and rate of change of the reflectance.In general, melting lowers the reflectance, with some recovery ifthe snow is refrozen. A significant difference in the reflec-tance curves for dry and melting snow occurs at about 1.2 -1.4 ym.The snowcover observed in the Skylab experiment had in each caseaged to a certain extent.
POTENTIAL APPLICATIONS TO SNOW MAPPING
Based on the results of the analysis of S192 data, twopotential applications to snow mapping of measurements in thenear-infrared spectral region are possible: (1) the use of anear-infrared band in conjunction with a visible band to distin-guish automatically between snow and clouds; and (2) the use ofone or more near-infrared bands to detect melting snow.
The nearly complete reversal in snow reflectance betweenthe visible bands and Bands 11 and 12 observed in each case in-dicates that in this portion of the near-infrared, snow surfacesare essentially non-reflective regardless of the condition of thesnow. In contrast, the reflectance of clouds (water droplet) isessentially the same in each of the S192 bands, displaying nodrop in the near-infrared. As a result, a technique combiningtwo spectral bands, one in the visible and one in the near-infra-red at the position of Band 11 or 12 (1.55-1.75 ym or 2.10-2.35ym), can be used to distinguish between snow, clouds, and non-snowcovered ground. A feature having a high reflectance in thevisible and a low reflectance in the near-infrared would be clas-sified as snow; a feature having a high reflectance in both bandswould be classified as cloud; and a feature having a low reflec-tance in the visible and a medium reflectance in the near-infra-red would be classified as non-snowcovered ground. An automatictechnique for distinguishing snow from clouds is of particularsignificance, since this has been recognized as-a serious problemwith regard to the eventual machine processing of satellite datafor snowcover mapping.
The second potential application, that of detecting melt-ing snow, is based on the observed behavior of snow in the inter-mediate bands from about Band 7 (0.78-0.88 ym) through Band 10(1.20-1.30 ym). In an early investigation using Nimbus-3 near-infrared data (8) the observed low reflectance of snow and icewas attributed to the existence of meltwater on the snow/ice sur-face. In studies using LANDSAT imagery (2, 4, and 7), the near-infrared band has consistently indicated less snowcover than has
211
the visible band; the difference has been attributed to the re-duced near-infrared reflectance associated with melting or refro-zen snow.
Although the Skylab data sample was limited, the S192film products for the spring cases (June) display snow reflectancecharacteristics not observed in the winter cases (January-Febru-ary) . In the two spring cases, the apparent snow extent decreasesgradually from a maximum in the visible (Band 6) to a minimum inBand 11. This gradual decrease in the area of high reflectanceis difficult to account for unless it is because the snow at thelower elevations is melting, and therefore exhibits a more rapiddrop in reflectance, whereas the snow at the highest elevationsis dryer or refrozen, and therefore does not exhibit a signifi-cant drop in reflectance until Band 11. In the winter cases, thesnowpack is more uniform at all elevations, so does not displaythe gradual reduction in reflectance. It is concluded, therefore,that bands in the spectral range from about 0.8 um to about 1.30ym should provide the most information on the condition of thesnow surface with regard to the snow being melting (wet surface)or being not melting or refrozen (dry surface).
Further study of snow reflectance characteristics isneeded. The available data sample did not include a situationwhere snow and ice clouds are present, where the technique to dis-tinguish between snow and water droplet clouds could be tested todetermine its application to ice clouds. Also, measurements overfresh, dry snow as well as additional measurements over areas ofknown melting snow are needed before the relationships betweenreflectance and snow condition are completely understood. Never-theless, the results of the analysis of Skylab EREP data are be-lieved to be sufficiently conclusive to warrant careful consider-ation for including one or more near-infrared spectral bands onradiometers to be flown on future operational satellite systems.Measurements in the near-infrared spectral region, in combinationwith visible and thermal infrared measurements, have the potentialfor providing greatly improved information with regard to snowhydrology and thus have the potential for providing eventual sig-nificant cost savings to snow survey programs.
ACKNOWLEDGEMENTS
The investigation described in this paper was supportedby NASA Johnson Space Center under Contract No. NAS 9-13305. Theauthors are grateful for the assistance provided throughout thestudy by the Technical Monitor, Mr. Larry B. York, of the Prin-cipal Investigator Office.
REFERENCES
1. Barnes, J.C., and C.J. Bowley, 1974: Handbook of Techniquesfor Satellite Snow Mapping, Report prepared under Con-tract NAS 5-21803, Environmental Research § Technology,Inc., Concord, MA, 95 pp.
212
2. Barnes, J.C., C.J. Bowley, and D.A. Siimnes, 1974: The Appli-cation of ERTS Imagery to Mapping Snowcover in the Wes-tern United States, Final Report under Contract NAS 5-21803, Environmental Research § Technology, Inc., Con-cord, MA, 77 pp.
3. Barnes, J.C., M.D. Smallwood, and J.L. Cogan, 1975: Study toDevelop Improved Spacecraft Methods Using Skylab/EREPData, Final Report under Contract No. NAS 9-13305,Environmental Research § Technology, Inc., Concord, MA,92 pp.
4. Bowley, C.J., and J.C. Barnes, 1975: The Application of ERTSImagery to Mapping Snowcover in the Western UnitedStates, Supplemental Report under Contract NAS 5-21803,Environmental Research § Technology, Inc., Concord, MA,43 pp.
5. NASA, 1974: Skylab Earth Resources Data Catalog, Doc. No.JSC-09016, NASA/Johnson Space Center, Houston, Texas,359 pp.
6. O'Brien, H.W., and R.H. Munis, 1975: Red and Near-InfraredSpectral Reflectance of Snow, Research Report 332, 18pp., U.S. Army Cold Regions Research and EngineeringLaboratory, Hanover, N.H.
7. Rango, A., V.V. Salomonson, and J.L. Foster, 1975: SeasonalStreamflow Estimation Employing Satellite Snowcover Ob-servations, Preprint X-913-75-26, NASA/Goddard SpaceFlight Center, 34 pp.
8. Strong, A.E., E.P. McClain, and D.F. McGinnis, 1971: "Detec-tion of Thawing Snow and Ice Packs through the CombinedUse of Visible and Near-Infrared Measurements from EarthSatellites", Monthly Weather Review 99 (11), pp. 828-830.