Paper Number: 128 Title: Material Characterization for the Analysis of Skin/Stiffener Separation 32 nd Technical Conference Authors: Carlos G Dávila Frank A. Leone Kyongchan Song James G. Ratcliffe Cheryl A. Rose
Transcript
Paper Number: 128 Title: Material Characterization for the Analysis of Skin/Stiffener Separation 32nd Technical Conference Authors: Carlos G Dávila Frank A. Leone Kyongchan Song James G. Ratcliffe Cheryl A. Rose
ABSTRACT
Test results show that separation failure in co-cured skin/stiffener interfaces is characterized by dense networks of interacting cracks and crack path migrations that are not present in standard characterization tests for delamination. These crack networks result in measurable large-scale and sub-ply-scale R curve toughening mechanisms, such as fiber bridging, crack migration, and crack delving. Consequently, a number of unknown issues exist regarding the level of analysis detail that is required for sufficient predictive fidelity. The objective of the present paper is to examine some of the difficulties associated with modeling separation failure in stiffened composite structures. A procedure to characterize the interfacial material properties is proposed and the use of simplified models based on empirical interface properties is evaluated.
INTRODUCTION
Over the past 15 years, the ability to predict delamination and skin/stiffener separation in composite structures has dramatically improved with the development and maturation of the cohesive element technology. Bisagni et al., for instance, demonstrated that the collapse of stiffened panels subjected to postbuckling deformations can be predicted with models composed of shell and cohesive elements [1]. However, a number of issues regarding the characterization of interface material properties for structural analysis must still be addressed.
The characterization of the material properties required for modeling delamination is typically conducted using standard tests such as the double cantilever beam (DCB) and mixed mode bending (MMB) tests[2, 3]. The DCB and MMB specimens consist of unidirectional laminates with a pre-embedded crack induced by a film of Teflon.
_____________
Carlos G Dávila, Structural Mechanics & Concepts Br NASA Langley, Hampton, VA 23681 Frank A. Leone, Structural Mechanics & Concepts Br NASA Langley, Hampton, VA 23681 Kyongchan Song, Analytical Mechanics Associates, Inc., Hampton, VA 23681 James G. Ratcliffe, Durability, Damage Tol & Reliability Br NASA Langley, Hampton, VA 23681 Cheryl A. Rose, Structural Mechanics & Concepts Br NASA Langley, Hampton, VA 23681
The interlaminar fracture toughness, Gc, is generally extracted from the first point of nonlinearity, as opposed to the steady-state propagation condition, so that Gc represents a clean onset of delamination propagation that is unaffected by fiber bridging, matrix cracking, and other potential toughening or blunting mechanisms. Therefore, the value of Gc obtained from a standard test is a “first principles” attempt to quantify the magnitude of pure delamination.
However, the majority of structural composite laminates are multidirectional, and delaminations develop between plies of different orientations. Failure of these structures typically involves interactions of multiple matrix cracks and delaminations on multiple interfaces. Additionally, in stiffened-skin structures, the material and architecture of the stiffener may be different from that of the skin. Studies have shown that actual structural interfaces exhibit critical values of Gc that are up to four times larger than those obtained from standard unidirectional specimens of the same material [4].
This paper examines some of the differences in interlaminar fracture between unidirectional plies in standard test specimens and interlaminar fracture between common structural interfaces, such as skin-stiffener interfaces. The objective of the investigation is to initiate a discussion on how to characterize structural interface properties and how to model structural interfacial separation. In particular, we examine the development and implementation of cohesive laws that can account for the differences between the R curves in standard and structural interfaces. Some of the toughening mechanisms, such as those that result from migrations of the delamination paths, can be captured using detailed three-dimensional models. However, other mechanisms occur at a sub-ply scale, and these effects cannot be captured using “first principles” properties. For instance, test results of interfaces between dissimilar materials indicate that toughening mechanisms such as surface delving [5], i.e., the blunting due to micro-damage caused by a crack front digging into the surface of a ply and lifting some fibers, occurs at a scale much smaller than can be modeled and thus requires the use of context-specific empirical material properties.
INTERFACIAL DAMAGE IN THREE-POINT BEND AND SEVEN-POINT BEND TESTS
Three-point bend (3PB) doubler and seven-point bend (7PB) tests have been conducted to investigate details of the damage processes in skin-stiffener separation and to develop modeling approaches for representing the separation. The 3PB doubler test [6] is one of the simplest tests that can be performed to observe and characterize the separation failure between skin and stiffener. The 3PB specimens consist of 12” by 2” rectangular strips of skin with a co-cured 4” by 2” doubler consisting of a patch of fabric material that represents the flange of a stiffener. The stacking sequence of the skin is [-45/45/0/90/-45/45]s and that of the doubler is [-45/0/45/-45/-45/45/0/-45/-45/0/45/-45]. The 3PB doubler specimen is supported on two rollers with an 8-inch span, as shown in Figure 1.
Figure 1. 3PB doubler test and detail showing flange debonding.
Damage initiates in the region of the flange termination shown in the detail of Figure 1 as a combination of transverse matrix cracks in the outer ply of the skin and delamination at the interface between skin and flange. As the separation between skin and flange increases, it becomes clear that the path of the delamination is a tortuous combination of matrix cracks, fiber bundle bridges, delaminations, and meandering cracks. A cross-section of the cracks can be observed in the X-Ray computed tomography (CT) cross section shown in Figure 2.
Figure 2. X-Ray CT cross-section of flange termination area showing morphology of delamination
separation.
The 3PB test is simple to conduct and provides useful information regarding skin/stringer separation failure. However, its deformation does not have compound curvatures that are representative of a post-postbuckled stiffened panel and its damage modes are strongly influenced by cracks that initiate at the free edges.
The 7PB test [7, 8] is another useful test for investigating skin/stiffener debonding in a controlled manner. The 7PB fixture consists of five coplanar lower supports points
and two upper loading points, as shown in Figure 3. All seven loading points are capped with ½ -inch balls. To prevent indentation damage at the loading points, shims were placed between the support points and the specimen. The deformation imparted by the seven load points on the test specimen is similar to the postbuckling deformation of a corresponding panel subjected to axial compression. However, postbuckled panels typically collapse suddenly, while those tested in 7PB undergo some degree of stable progression of damage accumulation that is more amenable to detailed observation.
The specimen used in the 7PB test consists of a 10” by 10” skin of IM7/8552 unidirectional (UD) tape with a stacking sequence of [-45/45/0/90/-45/45]s and a co-cured hat-shaped stringer made of IM7/8552 plain-weave (PW) fabric and composed of two parts: a prismatic wrap around a mandrel with a stacking sequence of [-45/45/0/45] and an overwrap that extends to form the flanges of the stiffener with the following stacking sequence: [-45/0/45/-45/-45/45/0/-45/-45/0/45/-45].
The tests indicate that the damage induced by the 7PB test frame is contained within the region of the skin/stiffener interfaces close to the upper load points, as shown in the detail in Figure 4. The tests were conducted in steps so that the specimen could be scanned by ultrasonic testing (UT) after each step. A sequence of scans for a typical specimen is shown in Figure 5. The first loading cycle was stopped at 801 lbs after several acoustic emission (AE) signals were detected. However, a UT scan was performed and no damage was visible. During the second loading cycle, a skin/stiffener separation occurred suddenly at 770 lbs. The UT scan shown in Figure 5 indicates that the size of the damage zone is approximately 2.44” by 0.2”. It is interesting to note that this separation occurred at a load below that of the first loading cycle.
Figure 3. 7PB test fixture and specimen.
As the load is increased, a second delamination appears on the opposite flange. In subsequent loading cycles, the damage grew in a relatively stable manner. These observations can be contrasted with the results of a shell model, which predicts an equal and gradual progression of delamination damage on both flanges.
Figure 4. Detail of separation damage near upper load application point.
Figure 5. Typical damage progression in 7PB test. UT images and shell model.
PROPERTIES OF STRUCTURAL INTERFACES
Although the fracture processes operating in the separation of structural interfaces are clearly different from that in unidirectional standard specimens, the number of comparative studies that can be found in the literature is surprisingly limited. Wagner et al. [4] conducted a test by pulling a blade stiffener off a skin in a mode-I-dominated fracture using the configuration illustrated in Figure 6a. The fracture toughness (0.875 ≤ Gc ≤ 1.1 N/mm) obtained from these tests was found to be approximately four times higher than that obtained with a DCB test for the same IM7/8552 material (Gc = 0.27 N/mm, Figure 6b). Consequently, it is necessary to investigate what mechanisms contribute to this difference and how to account for these mechanisms in a damage model.
a) Skin/stiffener separation [4] b) DCB test
Figure 6. Measuring the fracture toughness in (a) a structural specimen and (b) a standard specimen.
Recognizing that delaminations usually occur between plies of different orientations, Pereira et al. [9] developed a DCB test for nonstandard 0°/θ° interfaces. Their experimental results indicate that the fracture toughness for all 0°/θ° orientations is characterized by strong R curve effects. The 200% increase in fracture toughness between the start of crack growth propagation and steady-state propagation for 0°/0° interfaces is well-documented and attributable to fiber bridging [2]. The R curve effect for general non-standard interfaces is even more pronounced, as can be observed in Figure 7. The increase in toughness for non-standard interfaces is about 400%.
Figure 7. Typical R curves of 0°/0°, 0°/67.5° and 0°/90° specimens [9].
It is interesting to notice that the initiation value, Gc = 270 N/mm, appears to be approximately the same regardless of the orientation of the plies. This initiation represents the start of the propagation and it is not surprising that this value is not significantly affected by the various bridging and blunting mechanisms that develop as the delamination starts to propagate.
In addition to bridging, several damage mechanisms contribute to the fracture toughness of non-unidirectional laminates: transverse matrix cracking, migration of the delamination paths through the matrix cracks, ply delving, and surface roughness. As early as 1982, Nicholls [10] had observed that the fracture surfaces in DCB specimens of unidirectional laminates are smooth with little or no fiber breakage, which is consistent with a low observed value of Gc. On the other hand, the failure surfaces in
angle ply laminates were characterized by several distinct regions, each with its own morphology. The initial propagation region consisted of a delamination between two plies, while the other regions involved unsteady propagation paths oscillating between plies. The Gc for unsteady propagation was found to be higher than that for the initial propagation and strongly dependent on the angles of the plies with respect to the direction of propagation. The transitions between these regions was observed to be delimited by a line parallel to the fibers above the interface and another line parallel to the plies fibers below the interface, with the resulting transition forming the shape of a distinct “V.”
Following Nicholls’ observations, Robinson conducted modified DCB tests of specimens with +45°/-45° interfaces [11] to determine the role of edge effects and fiber bridging on Gc. To separate the effect of edge delaminations and confine the growth of delamination to occur at the intended interface, Robinson manufactured modified DCB specimens with Teflon inserts along the edges. With these Teflon inserts, delamination migration and most bridging was prevented and therefore most of the increase in Gc with crack growth was eliminated. The resulting Gc for propagation in a +45°/-45° interface was about 30% higher than that of a 0°/0° interface.
It is clear from the preceding discussion that the Gc for delamination initiation in a standard test of a unidirectional laminate is at best representative of the propagation of delamination between smooth 0° surfaces, and that it does not take into account the kinematics of delamination migrations and the interaction of complex crack networks and other damage mechanisms. Recent studies [12] indicate that some of these mechanisms, such as delamination along a 0° interface, transverse matrix cracking, and some migration of the crack path can be captured with detailed three-dimensional damage models using the Gc for initiation. If such a detailed model can predict the networks of cracks, it would be able to predict some of the R curve effect observed in a test. However, some R curve effects such as those associated with delamination propagation between plies with dissimilar orientations are the result of sub-ply mechanisms and surface roughness, the modeling of which requires a modeling scale that is beyond any of today’s capabilities. Therefore, regardless of the modeling detail, the use of empirical material properties that account for more than crack initiation is inescapable.
An appealing alternative to attempting to construct extraordinarily detailed models that capture ply-level crack networks would be to neglect the kinematic complexity and account for all of the damage mechanisms by using empirical interface material properties. In other words, can the separation of two composite interfaces be represented by a material law that is independent of all topological parameters, such as the angles between the direction of propagation and the ply lamination directions? In general, no. A material law cannot take into account, for instance, the effect of interactions with free edges, which were shown by Robinson to dramatically influence the fracture response.
However, when observing the experimental results shown in Figure 5, one may see that, even though the damage consists of different zones, the edge of the damage zone is smooth. If the damage grew at significantly different rates in different directions, the damage shape would appear jagged with discontinuities between the different damage zones. Instead, the damage front appears to grow in a relatively similar manner in all directions, indicating the possibility that a good approximation of the shape of an effective delamination can be predicted using an empirical material law. The application
and potential limitations of using cohesive laws to predict the propagation of delamination in composite structures is discussed in the remaining sections.
REPRESENTING R CURVES WITH COHESIVE LAWS
R curve effects are seldom taken into account in analysis because of the difficulty in having to apply a value of Gc that increases with crack propagation. However, it is well known that there is a direct relationship between the shape of the cohesive law and the resulting R curve [13]. As can be expected, the shape of the cohesive law, e.g., bilinear or exponential [14], is inconsequential for the prediction of fracture under small-scale bridging conditions. However, the shape of the law plays a fundamental role under large-scale bridging conditions, where the process zone length may be large relative to other length scales in the problem. When crack propagation includes different energy dissipation mechanisms that act over different length scales, the nature of these mechanisms must be accounted for in the cohesive law.
Dávila et al. [15] have shown that trilinear softening laws can represent a wide variety of R curve responses. Trilinear laws have the benefit of being decomposable into two bilinear laws, for which specific constraints for mode mixity have been developed [16]. A comparison of the effect of a bilinear and a trilinear cohesive law on load vs. displacement predictions is illustrated in Figure 8a. Experimental results are represented by the black line, predictions obtained with a bilinear law are shown by the solid red line, and predictions obtained with a tri-linear law are shown by the blue line. It can be observed that the trilinear cohesive law is necessary when there is a large difference between the Gc for delamination initiation and for steady-state propagation.
a) Force displacement results obtained using
bilinear and trilinear cohesive laws. b) Trilinear obtained by superposition of
two bilinear laws.
Figure 8. Trilinear cohesive laws can represent a wide range of R curve effects.
Several methods have been proposed to characterize the parameters n and m that describe the shape of the trilinear law (see Figure 8b). Dávila proposed a semi-empirical equation [15] relating directly a linearized fit of the R curve to the parameters n and m. Airoldi [17] obtained the parameters for delamination in glass-epoxy laminates by performing parametric analyses and minimizing the error between the numerical and the averaged experimental force–displacement responses. Bergan [18] extracted the trilinear law for intralaminar fracture by fitting an analytical form of the J-integral to the
experimental R curve plotted as a function of the opening displacement measured at the crack tip. Girolamo [19] used closed form solutions of the J-integral for DCB, end-notched flexure (ENF), and MMB tests to obtain the mixed mode trilinear laws describing the fracture of FM300 adhesive in a composite laminate. Finally, the example in the next section illustrates that, in some cases, the identification of the trilinear law can also be performed by extremely simple means.
FABRIC/TAPE INTERFACE: A SUB-PLY R CURVE MECHANISM
Composite structures are often composed of different materials. For instance, fuselage skins are usually manufactured with unidirectional tape, while stiffeners, which have tighter compound curvatures are often manufactured with fabric plies for better drapability. The panels designed for study in the Advanced Composites Project were manufactured with IM7/8552 unidirectional tape and PW fabric. To characterize the properties of the tape/fabric interface specimens were fabricated with a stacking sequence of [0t]/[0f]/[0t]5/[0f]/[0t]/T/[0f]/[0t]7/[0f], where the subscript “t” refers to tape, “f” refers to fabric, and T stands for the crack initiator Teflon. This stacking sequence results in a laminate that is approximately symmetric and balanced, but with a fracture interface between tape and fabric. The configuration of the specimens and the testing procedures are described in Ratcliffe [3].
The specimens were tested in DCB, end-loaded split (ELS) and MMB tests. The tests were conducted with specimens oriented with tape-side-up and fabric-side-up to evaluate the influence of the shear stress direction on the crack growth resistance.
The experimental results indicate that, in all tests, the fracture plane remains at the tape/fabric interface and does not migrate. Typical experimental force-displacement results for a DCB and an MMB (50% mode ratio) tests with fabric-side-up are shown by the red lines in Figures 9a and 9b, respectively (the analytical results, T/F and T/T are discussed below). It can be observed that in both tests there was some nonlinearity in the load-displacement response before reaching the peak load. This nonlinearity is caused by the initiation of delamination propagation.
a) Load-displacement response of DCB test b) Load-displacement response of MMB test
Figure 9. Experimental and predicted load-deflection curves for DCB and MMB tests of tape/fabric interfaces (fabric-side-up, fabric-active).
The DCB and MMB specimens were modeled in Abaqus/Std (Version 2016 - Dassault Systèmes Simulia Corp., Providence, RI, USA) with a simple model composed of two layers of SC8R shell elements connected with COH3D8 cohesive elements, as illustrated in Figure 10. The material moduli for IM7/8552 shown in Table 1 were used in the analyses.
Figure 10. Simulation of MMB test with a fabric/tape interface.
Analyses were conducted first using the standard properties listed in Table 2, where
the abbreviation T/T indicates that the values were measured using standard unidirectional tape specimens with a tape/tape interface. The mode I penalty stiffness KI for T/T is rather arbitrary and its value was determined from previous experience. The shear stiffness Ksh was calculated using the Turon constraint for mixed mode [16]:
2
=
c
c
c
cIsh GII
GIKKστ
(1)
where σc and τc are the mode I and shear strengths. The term ηΒΚ in Table 2 denotes the exponent of the Benzeggagh and Kenane (BK) mixed-mode criterion [20]. The properties “T/F bridging” and “structural bridging” in Table 2 are discussed later in this Section.
The results of the simulations using T/T properties are shown as dashed lines in Figures 9a and 9b. These results underpredict the experimental response of both the DCB and the MMB specimens by almost a factor of two. Clearly, the standard Gc for a T/T interface does not account for the R curve effects that allow the load-carrying capability of the specimens to increase well past the damage initiation loads.
Table 2. Interface properties of IM7/8552 (fabric-side-up)
The reason why the fracture properties of T/T interfaces are too low to be
representative of tape/fabric (T/F) interfaces is not immediately clear. Fiber bridging was not observed in the test, so perhaps surface roughness or the resin pockets in the fabric may be playing a role. Regardless of what specific mechanisms cause the R curve, it is possible to establish a mixed-mode trilinear cohesive law that captures this effect. In a previous section, several techniques were discussed for characterizing the trilinear law. In the present work, we use a simpler approach based on the superposition of two bilinear laws that is similar to the identification procedure proposed by Airoldi [17].
It can be observed in Figure 9 that the peak loads predicted with T/T properties correlate well with the first nonlinearities observed in the experimental results. Therefore, the simplest way to obtain a trilinear law for the tape/fabric interface is to add a second bi-linear “bridging” law to the bilinear law representing a T/T interface. The Gc_br for the bridging laws in modes I and II is simply the difference between the steady-state values of GcT/F and GcT/T of the R curves measured in the test. For instance, the mode I GcT/F for steady-state propagation for the test reported in Figure 9a is 3.4 lbf/in. Therefore, GcT/F = 3.4-1.37 ≈ 2 lbf/in. Only single digit precision is used to reinforce the fact that great precision in these measurements is not practical nor is it necessary. Finally, the BK exponent ηΒΚ is calculated to ensure that the Gc matches the experimental result of the 50% MMB test. The Gc that results from superposing T/T properties and the bridge is shown in Figure 11 as a function of mode mixity. It is interesting to observe that the Gc for T/F, which is the sum of T/T and T/F bridging, is between 2.5 and 3.8 times that for T/T for all mode mixities.
The normal and shear strengths can be obtained by trial and error: higher values tend to eliminate the nonlinearity in the pre-peak response and vice-versa. By simple curve-fitting, the strengths of 1000 psi and 3000 psi shown in Table 2 were obtained. Once again, single-digit precision is sufficient.
To ensure that the superposition of two bilinear curves results in a trilinear curve, the displacement jump δ0 at peak stress must be the same for both bilinear laws (see Figure 8b). Therefore, the penalty stiffnesses for bridging in mode I and shear are calculated as:
TT
bridgeTTbridge KK
// σσ
= (2)
Figure 11. Values of Gc for standard, bridge and total cohesive laws as a function of mode mixity
(fabric-side-up).
All of the calculated values of the penalty stiffnesses are shown in Table 2. The simulation results obtained with the superposition of the T/T and the T/F bridging law is represented in Figure 10 by solid blue lines. These results indicate an excellent correlation between calculated and experimental responses.
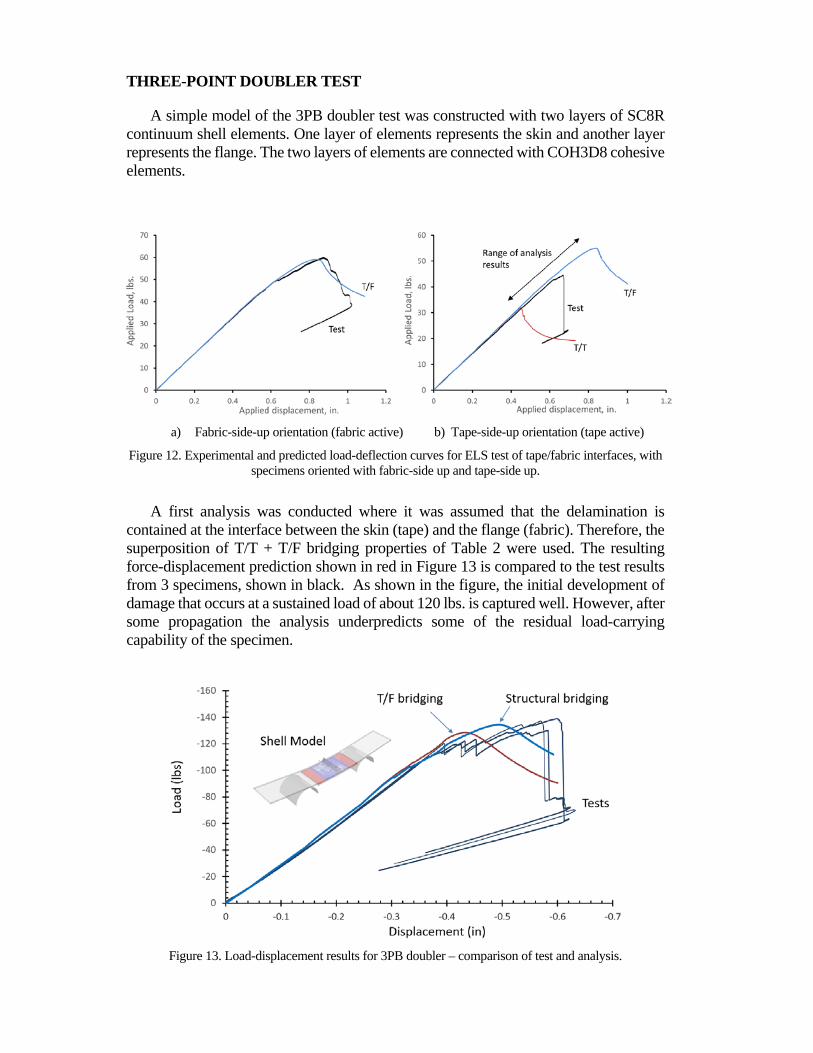
Although empirical material properties can be used to represent complex fracture processes with excellent results, there are potential pitfalls that must be understood. It is simple to demonstrate that the kinematics of fracture processes can change dramatically and unexpectedly with different local loading conditions, material orientations, or interactions with the free edges. For instance, the predictions for the ELS test of a specimen oriented with the fabric-side up obtained using the T/F bridging properties, shown in Figure 12a correlate well with the test results. However, when the specimen is turned upside-down, the response is unstable, as shown in Figure 12b. The experimental peak load lies in between the peak load predicted with T/T properties and with T/F bridging properties. It appears that the initiation of propagation was delayed with respect to initiation of propagation in a T/T specimen, probably because of the roughness of the T/F interface. However, after a small amount of growth, the propagation becomes unstable until it stops. The fact that propagation stops close to the T/T curve indicates that the Gc for propagation is close to the Gc for propagation for T/T.
An explanation of the effect of specimen orientation on the response is provided by Greenhalgh [21]: depending on the sign of the transverse shear at an interface, a delamination is either driven towards the material above or below the interface. Depending on the orientation of the specimen in the ELS test, the delamination may delve [5] into the fabric or the tape. In the first case, the fabric surface is said to be active, and in the second case, the tape surface is active. Once again, these differences in response indicate that empirical material properties can change in significant ways depending on mechanisms that occur at scales below that of the model.
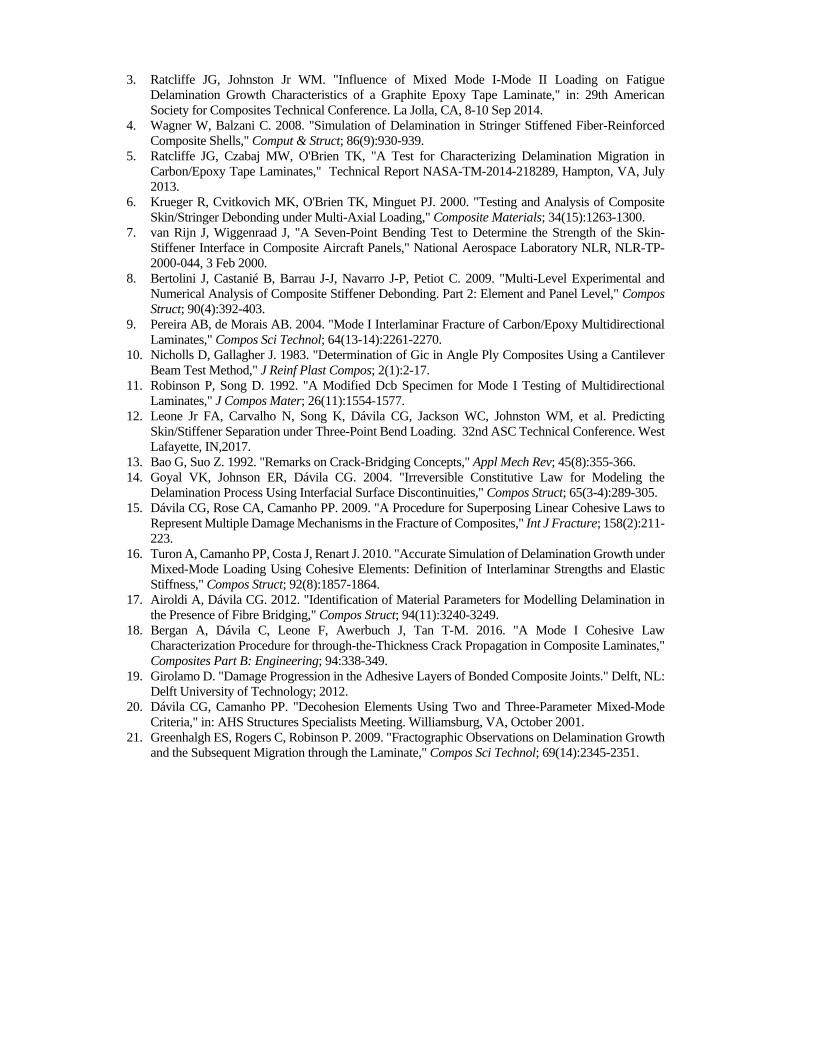
THREE-POINT DOUBLER TEST
A simple model of the 3PB doubler test was constructed with two layers of SC8R continuum shell elements. One layer of elements represents the skin and another layer represents the flange. The two layers of elements are connected with COH3D8 cohesive elements.
a) Fabric-side-up orientation (fabric active) b) Tape-side-up orientation (tape active)
Figure 12. Experimental and predicted load-deflection curves for ELS test of tape/fabric interfaces, with specimens oriented with fabric-side up and tape-side up.
A first analysis was conducted where it was assumed that the delamination is contained at the interface between the skin (tape) and the flange (fabric). Therefore, the superposition of T/T + T/F bridging properties of Table 2 were used. The resulting force-displacement prediction shown in red in Figure 13 is compared to the test results from 3 specimens, shown in black. As shown in the figure, the initial development of damage that occurs at a sustained load of about 120 lbs. is captured well. However, after some propagation the analysis underpredicts some of the residual load-carrying capability of the specimen.
Figure 13. Load-displacement results for 3PB doubler – comparison of test and analysis.
A second analysis was conducted with higher values of Gc intended to represent the effect of all of the damage mechanisms occurring in the structural separation (see Figure 2). These properties were estimated from the previously discussed observations of Wagner [4] and Pereira [9]. Both noticed that the Gc for arbitrary interfaces is about 400% of the Gc for initiation in T/T. Therefore, a new set of bridging properties shown in Table 2 was constructed such that the total of the T/T and the structural bridging law is four times that for T/T initiation. The resulting prediction, shown in blue in Figure 13 indicates a better correlation between the predicted and experimental results than with the T/F bridging law.
CONCLUDING REMARKS
This paper examines some of the differences between interlaminar fracture in a unidirectional laminate and interfacial separation in a structure. The interfacial properties measured conventionally with unidirectional laminates are representative of the initiation of propagation, and provide a true “first principles” measure of pure delamination devoid of the contribution of other mechanisms. However, interfacial separation is characterized by complex networks of interconnected cracks, delamination migrations, and fiber bridges. These interacting mechanisms tend to blunt the crack front and bridge the wake of the crack with a consequential increase in the Gc required for further damage propagation. Ideally, it should be possible to develop a sufficiently detailed three-dimensional model that can predict all of the damage mechanisms using only “first principles.” Some of today’s best models can indeed predict transverse matrix cracking, delamination, and delamination path migration using essential properties. However, other damage mechanisms such as those associated with surface roughness occur at the sub-ply scale and are therefore not within the scale of any normal or tractable numerical model. Consequently, even in the most detailed models, some empirical properties are needed.
The alternative to attempting to account for all of the damage mechanisms is to ignore the complexity of the kinematics and instead apply an empirical material response that captures all of the damage mechanisms. The objective of the investigation was to initiate a discussion on how to characterize structural interfaces for empirical material model development and how to efficiently model interfacial separation. A simple tri-linear cohesive law identification procedure based on the superposition of bilinear cohesive laws was proposed. Furthermore, three examples of delamination in multidirectional laminates were presented that indicate that the effective Gc is approximately four times greater than the Gc for delamination initiation. To determine whether this factor of four is typical and a reasonable approximation for all multidirectional laminates will require further investigation.
REFERENCES
1. Bisagni C, Vescovini R, Dávila CG. 2011. "Single-Stringer Compression Specimen for the Assessment of Damage Tolerance of Postbuckled Structures," J Aircraft; 48(2):495-502.
2. Murri GB, "Evaluation of Delamination Onset and Growth Characterization Methods under Mode I Fatigue Loading," Technical Report NASA/TM–2013-217966, Hampton, VA, Feb 2013.
3. Ratcliffe JG, Johnston Jr WM. "Influence of Mixed Mode I-Mode II Loading on Fatigue Delamination Growth Characteristics of a Graphite Epoxy Tape Laminate," in: 29th American Society for Composites Technical Conference. La Jolla, CA, 8-10 Sep 2014.
4. Wagner W, Balzani C. 2008. "Simulation of Delamination in Stringer Stiffened Fiber-Reinforced Composite Shells," Comput & Struct; 86(9):930-939.
5. Ratcliffe JG, Czabaj MW, O'Brien TK, "A Test for Characterizing Delamination Migration in Carbon/Epoxy Tape Laminates," Technical Report NASA-TM-2014-218289, Hampton, VA, July 2013.
6. Krueger R, Cvitkovich MK, O'Brien TK, Minguet PJ. 2000. "Testing and Analysis of Composite Skin/Stringer Debonding under Multi-Axial Loading," Composite Materials; 34(15):1263-1300.
7. van Rijn J, Wiggenraad J, "A Seven-Point Bending Test to Determine the Strength of the Skin-Stiffener Interface in Composite Aircraft Panels," National Aerospace Laboratory NLR, NLR-TP-2000-044, 3 Feb 2000.
8. Bertolini J, Castanié B, Barrau J-J, Navarro J-P, Petiot C. 2009. "Multi-Level Experimental and Numerical Analysis of Composite Stiffener Debonding. Part 2: Element and Panel Level," Compos Struct; 90(4):392-403.
9. Pereira AB, de Morais AB. 2004. "Mode I Interlaminar Fracture of Carbon/Epoxy Multidirectional Laminates," Compos Sci Technol; 64(13-14):2261-2270.
10. Nicholls D, Gallagher J. 1983. "Determination of Gic in Angle Ply Composites Using a Cantilever Beam Test Method," J Reinf Plast Compos; 2(1):2-17.
11. Robinson P, Song D. 1992. "A Modified Dcb Specimen for Mode I Testing of Multidirectional Laminates," J Compos Mater; 26(11):1554-1577.
12. Leone Jr FA, Carvalho N, Song K, Dávila CG, Jackson WC, Johnston WM, et al. Predicting Skin/Stiffener Separation under Three-Point Bend Loading. 32nd ASC Technical Conference. West Lafayette, IN,2017.
13. Bao G, Suo Z. 1992. "Remarks on Crack-Bridging Concepts," Appl Mech Rev; 45(8):355-366. 14. Goyal VK, Johnson ER, Dávila CG. 2004. "Irreversible Constitutive Law for Modeling the
Delamination Process Using Interfacial Surface Discontinuities," Compos Struct; 65(3-4):289-305. 15. Dávila CG, Rose CA, Camanho PP. 2009. "A Procedure for Superposing Linear Cohesive Laws to
Represent Multiple Damage Mechanisms in the Fracture of Composites," Int J Fracture; 158(2):211-223.
16. Turon A, Camanho PP, Costa J, Renart J. 2010. "Accurate Simulation of Delamination Growth under Mixed-Mode Loading Using Cohesive Elements: Definition of Interlaminar Strengths and Elastic Stiffness," Compos Struct; 92(8):1857-1864.
17. Airoldi A, Dávila CG. 2012. "Identification of Material Parameters for Modelling Delamination in the Presence of Fibre Bridging," Compos Struct; 94(11):3240-3249.
18. Bergan A, Dávila C, Leone F, Awerbuch J, Tan T-M. 2016. "A Mode I Cohesive Law Characterization Procedure for through-the-Thickness Crack Propagation in Composite Laminates," Composites Part B: Engineering; 94:338-349.
19. Girolamo D. "Damage Progression in the Adhesive Layers of Bonded Composite Joints." Delft, NL: Delft University of Technology; 2012.
20. Dávila CG, Camanho PP. "Decohesion Elements Using Two and Three-Parameter Mixed-Mode Criteria," in: AHS Structures Specialists Meeting. Williamsburg, VA, October 2001.
21. Greenhalgh ES, Rogers C, Robinson P. 2009. "Fractographic Observations on Delamination Growth and the Subsequent Migration through the Laminate," Compos Sci Technol; 69(14):2345-2351.