Noise and Health, confusing findings in the Rotterdam Metropolitan Area Authors’name: H.Wolfert Authors' Affiliation: DCMR EPA 1 DCMR Environmental Protection Agency, Centre for Environmen tal Expertise's, P.O. Box 843, Schiedam, The Netherlands , henk.wolfert@dcmr.nl INTRODUCTION As from 1994 the provincial and local authorities in the Rotterdam Metropolitan Area had already realized that joint monitoring of the regional environmental situation was esse ntial to an effectiv e environmenta l policy. Sinc e then, fifteen so call ed MSR reports on the Rott er dam regi on have been pu blished. In the early year s, the env ironmental qua lity appeared to improve vis ibl y. Mor e recent ly, howeve r, on balance no further progress has been made. The explanation for this is that in the nineties, the ‘easy’ environmental problems could be solved through stringent source policy; the initiative at that time lay with the major polluters. As a consequence of this the dif ficult problems remain ed pro blems, whi ch wer e mos tly caused by dif fus e sources. For example, noise nuisance is caused, among other things, by road and airtraffic, and industry, while shipping traffic and road traffic are important sources of airpollution. Since there are usually a number of authorities responsible for tackling these di ff use sources, ef fect ive coopera tio n between these author it ies is a prerequisite. Thus within MSR the most important authorities in the Rotterdam region environmental field are represented. By jointly sketching an integral picture of the environmental situation in the region in MSR, these authorities can also jointly take those measures which are necessary in order to tackle the diffuse sources. The goal of MSR is twofold. In the fi rst place MSR aims at tracking the progress ofenvironmental policy in the region and indicating new developments relating to environmental quality, free from value judgments. In this way MSR contributes to the policy cycles of the authorities who work together in MSR. Administrators and theirstaff thus obtain information which enables them to place, evaluate and, if necessary, adjust their policy in a broader context. Based on this information, they can also formulate new policy or speed up its implementation. Where no verifiable policy objectives are available, indicators in any case perform a warning function so that timely adjustments are still possible. In the second place, MSR informs residents and the business sector about the state of the environment in the Rotterdam region and its recent developments. In this way MSR fulfils the obligation that authorities have, in the framework of the Aarhus treaty, to supply environmental information to theirresi dents. Furth er more, MSR responds to the soci et al need for tr anspar ent government. The last MSR rep or t was published mid 2010. Duri ng more than 15 year s the monitoring program and report were elaborated. At first only environmental themes as noise, air- and soil pollution were reported and developments on environmental permit ti ng and enforcement of these permit s. The very last report comprises indicators on energy, sustainable mobility, waste, water, air quality, noise, external safety, green and nature, space and also health. Environmental themes are cross 1
Transcript
8/6/2019 Paper on Noise and Health in Rotterdam Metropolitan Area
Noise and Health, confusing findings in the Rotterdam MetropolitanArea
Authors’name: H.Wolfert
Authors' Affiliation: DCMR EPA
1 DCMR Environmental Protection Agency, Centre for Environmental Expertise's, P.O. Box 843,Schiedam, The Netherlands, [email protected]
INTRODUCTION
As from 1994 the provincial and local authorities in the Rotterdam Metropolitan Areahad already realized that joint monitoring of the regional environmental situation wasessential to an effective environmental policy. Since then, fifteen so called MSR
reports on the Rotterdam region have been published. In the early years, theenvironmental quality appeared to improve visibly. More recently, however, onbalance no further progress has been made. The explanation for this is that in thenineties, the ‘easy’ environmental problems could be solved through stringent sourcepolicy; the initiative at that time lay with the major polluters. As a consequence of thisthe difficult problems remained problems, which were mostly caused by diffusesources. For example, noise nuisance is caused, among other things, by road and air traffic, and industry, while shipping traffic and road traffic are important sources of air pollution. Since there are usually a number of authorities responsible for tacklingthese diffuse sources, effective cooperation between these authorities is aprerequisite. Thus within MSR the most important authorities in the Rotterdam region
environmental field are represented. By jointly sketching an integral picture of theenvironmental situation in the region in MSR, these authorities can also jointly takethose measures which are necessary in order to tackle the diffuse sources.
The goal of MSR is twofold. In the first place MSR aims at tracking the progress of environmental policy in the region and indicating new developments relating toenvironmental quality, free from value judgments. In this way MSR contributes to thepolicy cycles of the authorities who work together in MSR. Administrators and their staff thus obtain information which enables them to place, evaluate and, if necessary,adjust their policy in a broader context. Based on this information, they can alsoformulate new policy or speed up its implementation. Where no verifiable policy
objectives are available, indicators in any case perform a warning function so thattimely adjustments are still possible. In the second place, MSR informs residents andthe business sector about the state of the environment in the Rotterdam region andits recent developments. In this way MSR fulfils the obligation that authorities have, inthe framework of the Aarhus treaty, to supply environmental information to their residents. Furthermore, MSR responds to the societal need for transparentgovernment. The last MSR report was published mid 2010. During more than 15 years themonitoring program and report were elaborated. At first only environmental themesas noise, air- and soil pollution were reported and developments on environmental
permitting and enforcement of these permits. The very last report comprisesindicators on energy, sustainable mobility, waste, water, air quality, noise, externalsafety, green and nature, space and also health. Environmental themes are cross
1
8/6/2019 Paper on Noise and Health in Rotterdam Metropolitan Area
border issues with other policy fields like economy, green, spatial- and urbanplanning, mobility et cetera. This is in particularly true for noise. The number of noiseindicators have increased during the past years. This paper mainly goes into thesurveys that were done in 2008, the Environmental Perception Survey conducted in
20071
and the Rotterdam Noise Map as meant in article 7 of the END [1] and someunderlying reports as the MSR report on Noise, Health and Money [2].
NOISE IN THE ROTTERDAM METROPOLITAN AREA
From earlier surveys, the so called Deltaplan Noise [3] and the CBA 2nd Maasvlakte
[4] which was conducted by DCMR, commissioned by the CBS2, it was found that theRotterdam Metropolitan Region encounters a lot of noise from industrial premises,roads, railways and aviation. This was established by the consolidated noise map,that was produced based on the four separated noise maps for the END, see figure1.
figure 1: Consolidated Noise Map Rotterdam 2008
In the Rotterdam Metropolitan Area, which harbors the largest port of Europe and thethird in the world, many noise sources are present. The region comprises more than22.000 enterprises, 350 km of motorways, 250 trunk roads, 250 local roads and100km of railways. The region is very crowded, around 1,2 million citizens are livingin this region and 400.000 laborers are working in the harbour, the factories, officeset cetera. At this time, the city of Rotterdam has 560.000 inhabitants and is thesecond largest city of The Netherlands. The Rotterdam Metropolitan Regioncontributes approximately 13% of the Dutch Gross Domestic Product. A smallbusiness airport is situated north of Rotterdam, which causes a lot of complaints.
NOISE, HEALTH AND MONEY
Within the MSR program, it is more or less a custom to produce a special themereport, beside the overall report on all components. In 2008 a theme report on noisehas been drafted and published. Besides indicators on money a lot of noiseindicators were reported like number and percentage of inhabitants exposed per
noise class and per type of noise, annoyed and highly annoyed people, people that1 Reported in 20082 CBS is the Dutch Bureau for Statistics
2
8/6/2019 Paper on Noise and Health in Rotterdam Metropolitan Area
encounter sleep disturbance, severe sleep disturbance and even the so calledDALY's. The graphs en tables within the theme report are based on the findings of the Rotterdam Noise Map. Beside the map on traffic noise, industrial noise, railwaynoise and aviation noise, the consolidated noise map was produced and a map with
potential quiet areas as well. A few of these findings are depicted below.
figure 2: percentage of annoyed people
The figure shows that road traffic noise is by far the most troublesome noise. This isplausible there road traffic noise affects the most people in Rotterdam. The number of exposed people by road traffic noise amounts almost 18.000. The figure of theexposed people stays behind in this paper but can be found at the website of MSR,www.hetmilieuinderegiorotterdam.nl.
figure 3: percentage of highly annoyed people
The same applies for highly annoyed people. About 7% of the 'Rotterdammers' aresubject to high annoyance. It looks that industrial noise and railway noise hardly donot play a role. Although, expressed in real numbers, there are almost 20,000citizens exposed to noise that is annoying and around 8,000 citizens to noise thatresults in high annoyance. The number of people that is exposed to aviation noise(from the Rotterdam Airport) is rather low (198 versus 64 for annoyance and highannoyance).The report on Health and Money memorizes also the number of DALY's due to roadtraffic noise and industrial noise. This is given in table 1.
3
8/6/2019 Paper on Noise and Health in Rotterdam Metropolitan Area
It is also stated in the report that noise, especially long lasting noise causedirreversible health effects in men like high blood pressure, cardiovascular diseases
like heart attacks and strokes which could be fatal. It is estimated that the number of fatalities, due to long lasting noise, in the Rotterdam Metropolitan Region amounts to35-40 per annum.
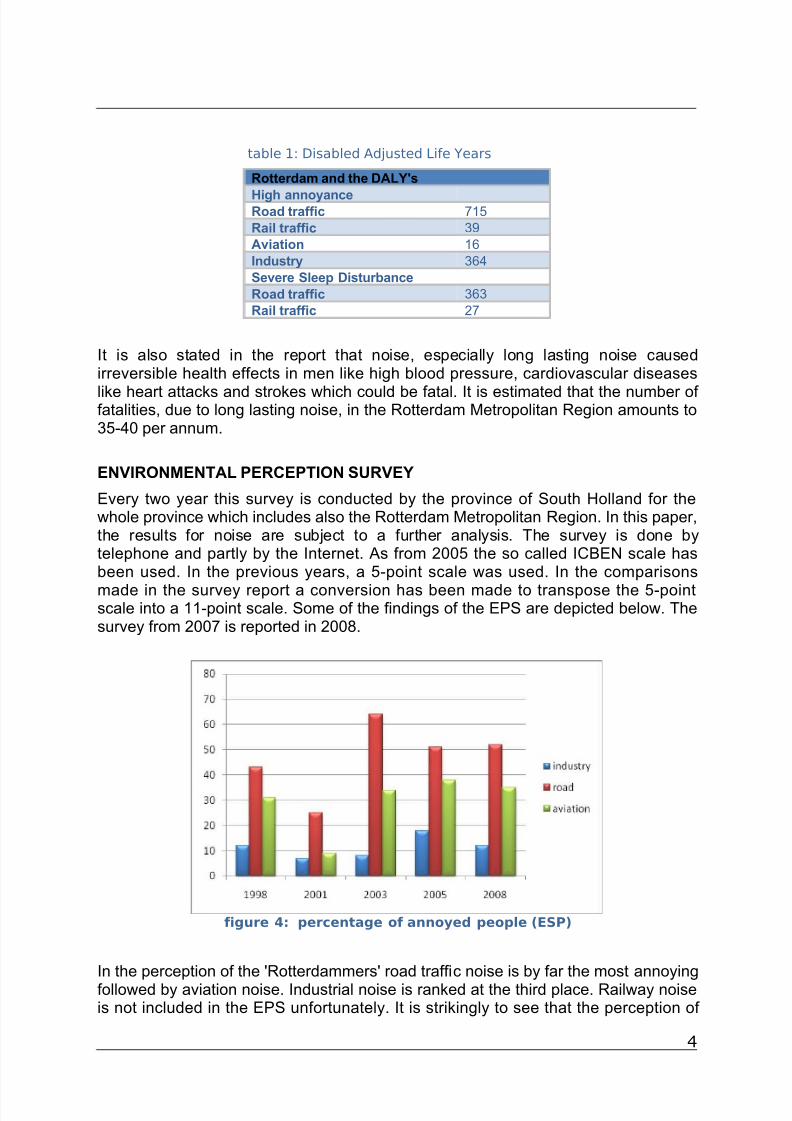
ENVIRONMENTAL PERCEPTION SURVEY
Every two year this survey is conducted by the province of South Holland for thewhole province which includes also the Rotterdam Metropolitan Region. In this paper,the results for noise are subject to a further analysis. The survey is done bytelephone and partly by the Internet. As from 2005 the so called ICBEN scale hasbeen used. In the previous years, a 5-point scale was used. In the comparisons
made in the survey report a conversion has been made to transpose the 5-pointscale into a 11-point scale. Some of the findings of the EPS are depicted below. Thesurvey from 2007 is reported in 2008.
figure 4: percentage of annoyed people (ESP)
In the perception of the 'Rotterdammers' road traffic noise is by far the most annoyingfollowed by aviation noise. Industrial noise is ranked at the third place. Railway noiseis not included in the EPS unfortunately. It is strikingly to see that the perception of
4
8/6/2019 Paper on Noise and Health in Rotterdam Metropolitan Area
the citizens is varying from year to year. Only in the case of aviation there is a reasonfor the drop in 2001. In that year, the class 2 airplanes have been phased out. Thevariation found in road and industrial noise cannot be explained so far.
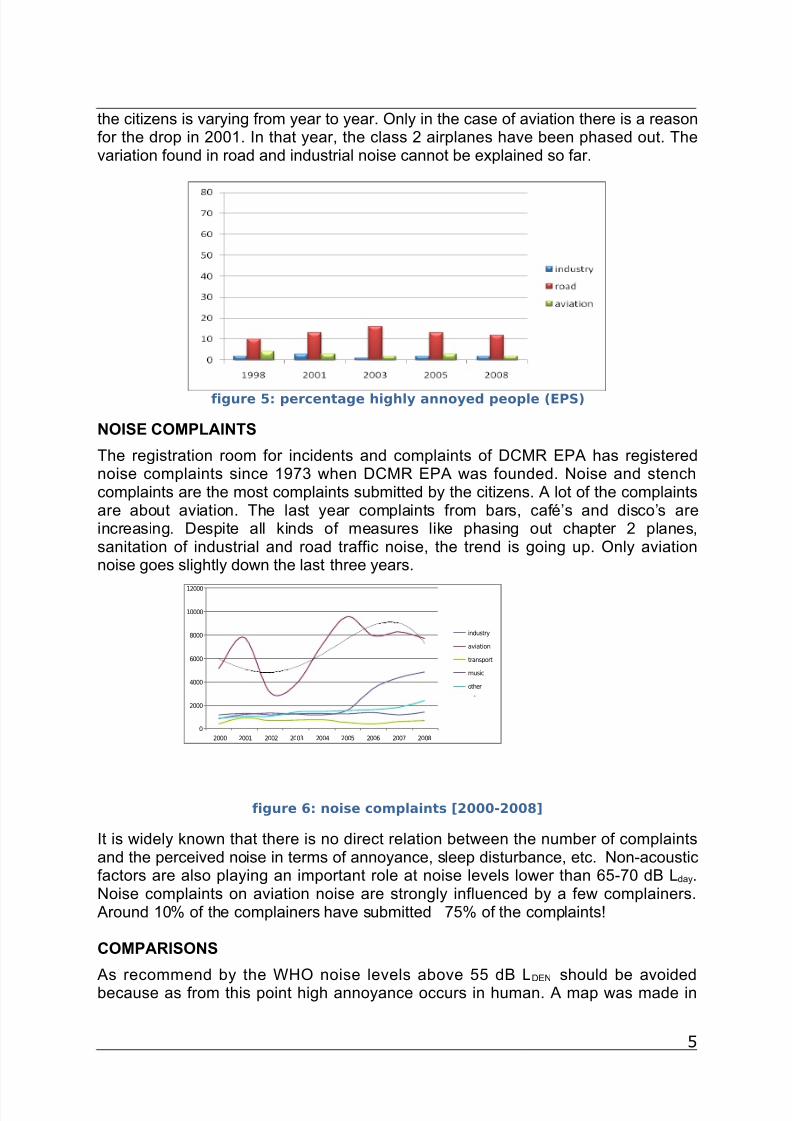
figure 5: percentage highly annoyed people (EPS)
NOISE COMPLAINTS
The registration room for incidents and complaints of DCMR EPA has registerednoise complaints since 1973 when DCMR EPA was founded. Noise and stenchcomplaints are the most complaints submitted by the citizens. A lot of the complaintsare about aviation. The last year complaints from bars, café’s and disco’s areincreasing. Despite all kinds of measures like phasing out chapter 2 planes,sanitation of industrial and road traffic noise, the trend is going up. Only aviationnoise goes slightly down the last three years.
0
2000
4000
6000
8000
10000
12000
2000 2001 2002 2003 2004 2005 2006 2007 2008
industry
aviation
transport
music
other
figure 6: noise complaints [2000-2008]
It is widely known that there is no direct relation between the number of complaintsand the perceived noise in terms of annoyance, sleep disturbance, etc. Non-acousticfactors are also playing an important role at noise levels lower than 65-70 dB Lday.Noise complaints on aviation noise are strongly influenced by a few complainers.Around 10% of the complainers have submitted 75% of the complaints!
COMPARISONS
As recommend by the WHO noise levels above 55 dB LDEN should be avoidedbecause as from this point high annoyance occurs in human. A map was made in
5
8/6/2019 Paper on Noise and Health in Rotterdam Metropolitan Area
order to show the extent of houses and sensitive objects3 in the Rotterdammunicipality that are exposed to noise higher than 55dB LDEN. A part of this map isdepicted in figure 6.
figure 7: houses exposed > 55dB LDEN
Due to the high expenses of measures and the impracticality of them, it was decidedto use a higher threshold of 63 dB. For the night, a similar map was made. Thethreshold value according to the WHO recommendations amounts 40 dB Lnight. As inmany cities the Lnight seems to be a forgotten parameter. The map with the houses
that are exposed to 40 dB Lnight and higher is depicted in figure 7.
figure 8: houses exposed to 40 dB LNIGHT
As 40 dB is the interim value recommend by the WHO and 35 dB the preferred limitvalue on the long term, it can be noticed that a lot of houses and sensitive objects
cannot comply with these limit values and that measures will be needed in a
3 like schools, hospitals, nursing homes, et cetera
6
8/6/2019 Paper on Noise and Health in Rotterdam Metropolitan Area
drastically way. It can be doubted if the preferred noise limits are feasible becauseeffects of local measures are limited. [wolfert,2009].
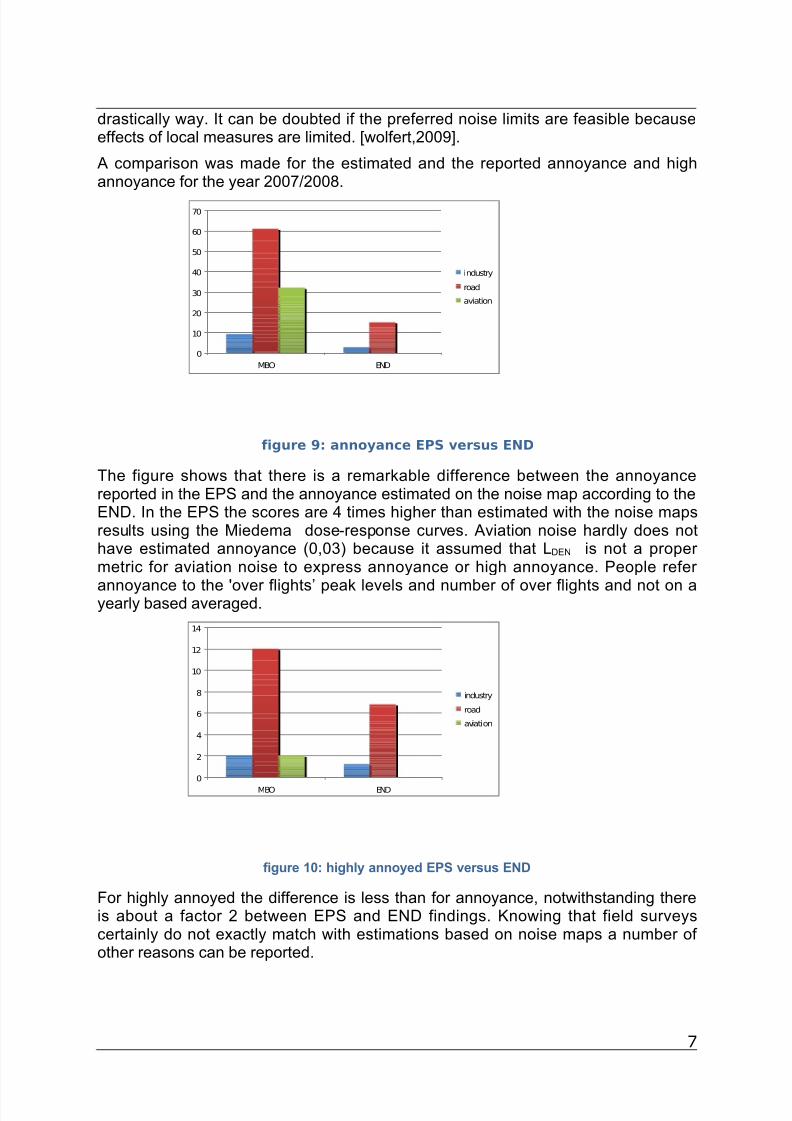
A comparison was made for the estimated and the reported annoyance and highannoyance for the year 2007/2008.
0
10
20
30
40
50
60
70
MBO END
industry
road
aviation
figure 9: annoyance EPS versus END
The figure shows that there is a remarkable difference between the annoyancereported in the EPS and the annoyance estimated on the noise map according to theEND. In the EPS the scores are 4 times higher than estimated with the noise mapsresults using the Miedema dose-response curves. Aviation noise hardly does nothave estimated annoyance (0,03) because it assumed that LDEN is not a proper metric for aviation noise to express annoyance or high annoyance. People refer
annoyance to the 'over flights’ peak levels and number of over flights and not on ayearly based averaged.
0
2
4
6
8
10
12
14
MBO END
industry
road
aviation
figure 10: highly annoyed EPS versus END
For highly annoyed the difference is less than for annoyance, notwithstanding thereis about a factor 2 between EPS and END findings. Knowing that field surveyscertainly do not exactly match with estimations based on noise maps a number of other reasons can be reported.
7
8/6/2019 Paper on Noise and Health in Rotterdam Metropolitan Area
1. Inaccuracy of the noise calculations due to the modeling, the validity of themethod at given distances in the Rotterdam Metropolitan Region (>700m),assumptions, missing data et cetera.
2. Local circumstances in Rotterdam could have an important influence.Compared to other cities, Rotterdam has a high percentage people with alow income and a high percentage of members from another ethnic entity(± 50%). Especially the group originated from non-western countries areassumed less sensitive to noise because it was found that they hardlycomplain about noise [DCMR EPA, 1997]. Due to this, one should expectthat a reverse view should occur.
3. Noise levels are assessed as from 50 dB while it is known that annoyanceoccurs as from 42 dB LDEN and sleep disturbance from 35 dB. A hugenumber of people exposed to noise levels between 42 dB and 50 dB are
excluded because the noise map only shows the noise levels above 50 dBLDEN and LNIGHT.
4. The samples made (number of people interviewed) in the EPS amount(472) which is about 0,08% which could be too low. Within the 95Confidence Interval an error range of ± 4,5% is estimated in the report.
5. The questions in the EPS questionnaire let some room for interpretationand could be improved. Example: it is not clear if mopeds, scooters areincluded in the questions and they are included in the calculations! Fromsurvey done before it is known that mopeds and scooters in cities areperceived as very annoying [Sandberg,200]
6. Non-acoustic factors possibly could have influenced the reportedperception in the EPS, especially the people classified as annoyed.
7. Applying the Miedema curves at a smaller -local- scale introducesinaccuracies because dose-response relations for traffic noise andannoyance appear to be scale-specific: relationships established atinternational levels sometimes deviate from national relationships; in turnthese relations can deviate from regional ones. For policies this means thatconsideration should be given to the limitations and transferability of (inter-)national exposure-response relationships used in local situations [O.R.PBreugelmans et all, 2007]
8. Although, the Miedema curves might be the best we currently have, it iswidely known that there is still some room for improvement. A few thingsshould be improved:
a. The study used the so called cut-off points (45 dB and 75 dB); fromother studies (not noise) it known that this could influence the results. Asensitivity analysis could raise some insight if other cut-off points, e.g.as from 35 dB will deliver other results.
b. Those curves are partly based on old data (1970-1980); since thenlifestyle has drastically changed in the western world. It could be
considered to exclude the old data and to add recent data in order toestimate updated curves. In some of the older surveys only thepercentage of highly annoyed was estimated and some surveys
8
8/6/2019 Paper on Noise and Health in Rotterdam Metropolitan Area
comprised limited data for high noise levels originated by rail and roadtraffic which should be an extra reason to skip those data.
c. The Miedema curves are also based on data from other continents, likeNorth America and Australia. Culture and habits differ from the
'European culture' if there is a European culture. Cities, especially citycenters in Europe differ from cities in North America, these are rather new and have structures, which are more car friendly. It is known thatcar use in North America is more common than in Europe. E.g. morethan 75% of the Canadians goes every day by car, in the 8 major agglomerations is somewhat lower (± 68%, 2006). In Australia it isalmost the same [Australian Bureau of Statistics].
d. The conversion from LDN to LDEN includes a number of assumptionswhich could influence the findings; is the conversion applicable tohighways and smaller roads in cities both, where no continuous flow of
traffic appears?
e. The conversion of the 3 or 5 points scale to the 11-points ICBEN scalehas introduced some inaccuracies because of the questions thatdiffered in the distinguished surveys and it is assumed that offeringpeople a more detailed scale a more balanced input is obtained.
CONCLUSIONS
From figure 4 and 5 can be concluded that human perception on noise is not a stablefactor but more like the stock markets. It can vary from year to year. Reasons couldbe incidents that have been occurred, media attention, spatial developments near district, et cetera.
Outcomes of 'calculated noise effects' differ remarkably from those that were foundduring field surveys like the EPS. Some divergence could be expected taking intoaccount the scattering of data points and the 95% confidence level. Significantdivergence can be addressed to numerous causes, see above.
For politicians and policy makers those discrepancies are confusing and do notcontribute to better understanding of the noise.
REFERENCES
Breugelmans O.R.P. et al (2007) Transferability of (inter-) national exposure responserelatiojnships used in local situations, RIVM.
DCMR EPA, (1997) Complaints and members of ethnic minorities.
European Noise Directive 2002/49/EC relating to assessment and management of environmental noise (2002), EC
Findell, I & Stallen P. (2009) Non-acoustic factors in environmental noise
Franssen, E.A.M et al (2004) Hinder door milieufactoren en de beoordeling van deleefomgeving, RIVM
Giering, K (2010) Lärmwirkungen, Dosis-Wirkungsrelationen, Umwelt Bundes Ambt füMensch und Umwelt
Kim, R. et al (2009) Noise Night Guidelines for Europe, WHO
Kim, R. et all (2011) Burden of disease from environmental noise, WHO
9
8/6/2019 Paper on Noise and Health in Rotterdam Metropolitan Area
Miedema, H et al (2001) Annoyance from Transportation Noise, relations with exposuremetric DNL and DENL and their Confidence Intervals, RIVM in Environmental HealthPerspectives Volume 109, number 4
Sandberg, U et al (200) Noise Emission from Powered Two Wheeled Vehicles, positionpaper to EU
Vliet, van J et al (2008) Onderzoek Milieubeleving Provincie Zuid Holland (EPS)
Wolfert, H (2009) Cities cannot solve their noise problems solitarily, DAGA Rotterdam
Wolfert, H (2007) Noise monitoring in the Rotterdam Metropolitan Area, INTERNOISEIstanbul
Wijk, van A.M. et al (2008) Noise Health and Money, MSR report Rotterdam MetropolitanArea.