Which Hat to Wear? Impact of Natural Identities on Coordination and Cooperation Yan Chen a,1,* , Sherry Xin Li b,2 , Tracy Xiao Liu c,3 , Margaret Shih d,4 a School of Information, University of Michigan, 105 S. State Street, Ann Arbor, MI 48109, United States b School of Economic, Political and Policy Sciences, University of Texas at Dallas, 800 W. Campbell Road, Richardson, TX 75080, United States c Department of Economis, Tsinghua University, Beijing, China d UCLA Anderson School of Management, 110 Westwood Plaza, Los Angeles, CA 90095-1481, United States Abstract As the workforce becomes increasingly diverse, motivating individuals from differ- ent backgrounds to work together effectively is a major challenge facing organizations. In an experiment conducted at a large public university in the United States, we manip- ulate the salience of participants’ multidimensional natural identities and investigate the effects of identity on coordination and cooperation in a series of minimum-effort and prisoner’s dilemma games. By priming a fragmenting (ethnic) identity, we find that, compared to the control, participants are significantly less likely to choose high effort in the minimum-effort games, leading to less efficient coordination. In com- parison, priming a common organization (school) identity significantly increases the choice of a rational joint payoff maximizing strategy in a prisoner’s dilemma game. JEL Classification: C7, C91 Keywords: social identity, diversity, prisoner’s dilemma, minimum-effort game, experiment 1. Introduction As the world becomes increasingly integrated and the workforce becomes more diverse, motivating individuals from diverse backgrounds to work together effectively is a major challenge facing organizations today. While increasing diversity in groups has been found to elicit positive outcomes such as enhancing thoughtful decision pro- cesses (Nemeth, 1986), expanding access to social networks and resources (Tushman, * Corresponding author. Email addresses: [email protected](Yan Chen), [email protected](Sherry Xin Li), [email protected](Tracy Xiao Liu), [email protected](Margaret Shih) 1 University of Michigan. Phone: 1-734-764-9488. Fax: 1-734-764-1555. 2 University of Texas at Dallas 3 Tsinghua University 4 University of California at Los Angeles Preprint submitted to Elsevier November 27, 2013
Transcript
Which Hat to Wear? Impact of Natural Identities onCoordination and Cooperation
Yan Chena,1,∗, Sherry Xin Lib,2, Tracy Xiao Liuc,3, Margaret Shihd,4
aSchool of Information, University of Michigan, 105 S. State Street, Ann Arbor, MI 48109, United StatesbSchool of Economic, Political and Policy Sciences, University of Texas at Dallas, 800 W. Campbell Road,
Richardson, TX 75080, United StatescDepartment of Economis, Tsinghua University, Beijing, China
dUCLA Anderson School of Management, 110 Westwood Plaza, Los Angeles, CA 90095-1481, United States
Abstract
As the workforce becomes increasingly diverse, motivating individuals from differ-ent backgrounds to work together effectively is a major challenge facing organizations.In an experiment conducted at a large public university in the United States, we manip-ulate the salience of participants’ multidimensional natural identities and investigatethe effects of identity on coordination and cooperation in a series of minimum-effortand prisoner’s dilemma games. By priming a fragmenting (ethnic) identity, we findthat, compared to the control, participants are significantly less likely to choose higheffort in the minimum-effort games, leading to less efficient coordination. In com-parison, priming a common organization (school) identity significantly increases thechoice of a rational joint payoff maximizing strategy in a prisoner’s dilemma game.
JEL Classification: C7, C91
Keywords: social identity, diversity, prisoner’s dilemma, minimum-effort game,experiment
1. Introduction
As the world becomes increasingly integrated and the workforce becomes morediverse, motivating individuals from diverse backgrounds to work together effectivelyis a major challenge facing organizations today. While increasing diversity in groupshas been found to elicit positive outcomes such as enhancing thoughtful decision pro-cesses (Nemeth, 1986), expanding access to social networks and resources (Tushman,
1University of Michigan. Phone: 1-734-764-9488. Fax: 1-734-764-1555.2University of Texas at Dallas3Tsinghua University4University of California at Los Angeles
Preprint submitted to Elsevier November 27, 2013
1977), promoting innovation (Van Der Zee and Paulus, 2008), and facilitating problemsolving (Hong and Page, 2001), increasing diversity also introduces group biases thatmay contribute to conflict among group members (Pelled, Eisenhardt and Xin 1999;Hargreaves Heap and Zizzo 2009). As a result, organizations wishing to obtain thebenefits associated with diversity must also learn how to manage diversity in orderto facilitate coordination, cooperation and positive interpersonal relationships amongtheir members.
Research findings underscore the importance of effectively promoting coordina-tion, cooperation and positive interpersonal relationships among members of an orga-nization. Positive relationships have been associated with a host of important outcomessuch as more effective sharing of resources and information, greater trust and betterperformance (Blatt and Camden 2006; Gruenfeld, Mannix, Williams and Neale 1996).Thus, integrating a diverse workforce, and motivating members who come from differ-ent backgrounds to work effectively towards a common goal is an important task facingmany organizations.
However, despite this importance, organizations trying to promote better coordina-tion and cooperation in diverse groups face several challenges in accomplishing thisgoal. First, work on minimal groups in psychology and near-minimal groups in eco-nomics finds that individuals are predisposed to favor the ingroup over the outgroupto enhance and maintain positive self-esteem (Tajfel and Turner, 1979). As a conse-quence, individuals perceive their ingroup members to be more similar to them thanmembers of the outgroup (Allen and Wilder, 1975) and ascribe more positive traits toingroup members (Brewer, 1979). Individuals are also more likely to help members ofthe ingroup over the outgroup (Crosby et al., 1980), to allocate more rewards to ingroupmembers (Wilder, 1986), and to show more charity, less envy, more positive reciprocity,less negative reciprocity, and more social welfare maximizing actions towards ingroupmembers (Chen and Li, 2009). In sum, research on minimal and near-minimal groupshas collected a great deal of evidence showing that highlighting different social identi-ties may fragment a group by introducing group biases that lead to counterproductiveoutcomes.
However, in the real world, people can be simultaneously identified along manydimensions of identity (Hewstone, 1996). Consider an African American male accoun-tant who is a partner in his firm. He may be identified by his gender (male), his race(black), his role (partner), his occupation (accountant) or his organization (firm). Someof these identities may be shared by other members of the group, while other identitiesmay not. Thus, highlighting these different identities may call forth different grouporientations and their consequent behaviors within an organization. Furthermore, re-search finds that feelings of similarities to others within a group can be situationallyaltered by manipulating the salience of different social identities (Chatman et al., 1998).While highlighting uncommon identities may fragment a group, highlighting commonidentities might unify a group.
In practice, common identities have been used to create common goals and values.For example, Nike founder Phil Knight and many of his employees have tattoos of theNike “swoosh" logo on their left calves as a sign of group membership (Camerer andMalmendier, 2007). To create a common identity, organizations have attempted vari-ous team-building exercises, such as simulated space missions where the crew works
2
together to overcome malfunctions while navigating through space (Ball, 1999). Whilestandard economic theory does not have an explanation for such phenomena, researchon social identity shed lights on the effects of common identity on organization out-comes.
Social psychology work on intergroup relations finds that highlighting a commoningroup identity can reduce intergroup bias (Dovidio, Gaertner, and Saguy 2009; Gaert-ner and Dovidio 2000). For instance, college roommates from differing ethnic back-grounds who perceived more common identities were less likely to show decline intheir friendship than roommates who did not (West et al., 2009). In another study,emphasizing a common ingroup identity increased satisfaction with coworkers in eth-nically diverse workgroups (Cunningham, 2005). In a multilevel public goods gameacross six countries, self-reported identification with the world as a whole predictscontributions to a global public good (Buchan et al. 2011).
Moreover, evidence in experimental economics finds that a common group identityincreases cooperation in public goods games (Eckel and Grossman, 2005) and pris-oner’s dilemma games (Goette et al., 2006), where the dominant strategy is to com-pletely free ride or defect. Furthermore, it improves coordination in the battle of sexesgame (Charness et al., 2007), the provision point mechanism (Croson et al., 2008), andthe minimum-effort game (Chen and Chen, 2011). The latter two games have multiplePareto ranked equilibria; a salient common identity leads to the selection of a moreefficient equilibrium.
This study extends previous research on the effects of a common identity on eco-nomic behavior. In particular, we investigate the effects of highlighting a commonversus fragmenting identity on coordination and cooperation in a series of prisoner’sdilemma and minimum-effort games with varying incentives for cooperation. Usingsubjects from a large public university in the United States, we prime participant schoolidentity as their common identity, and ethnic identity as their fragmenting identity.
By priming a fragmenting (ethnic) identity, we find that, compared to the control,participants are significantly less likely to choose high effort in the minimum-effortgames, leading to a reduction in efficient coordination. In comparison, priming a com-mon organization (school) identity significantly increases the choice of a rational jointpayoff maximizing strategy in a prisoner’s dilemma game. Furthermore, we find thatpriming school identity interacts with stereotypes in interesting ways.
This paper contributes to the social identity literature in several ways. First, ratherthan inducing group identity in the laboratory, we study two naturally existing socialidentities - ethnic identity and organization identity. Thus, compared to studies usinginduced group identity, our results can be more easily applied to real-life work environ-ments. Second, this study goes beyond documenting the intergroup bias in individualchoices. We use the identity priming technique from social psychology to manipu-late the salience of the respective identities to investigate the extent to which evokingdifferent dimensions of these identities impacts individual choices in coordination andcooperation. Third, this study is among the first in economics to empirically evaluatethe effectiveness of using a common identity as a design tool to increase coordinationand cooperation among an ethnically diverse group of participants. Lastly, comparedto social psychology studies of natural identities, we demonstrate that identity priminginteracts with the strategic properties of games. The same priming technique can have
3
different effects in different games.The rest of the paper is organized as follows. Section 2 presents the experimental
design. In Section 3, we present our analysis and results. Section 4 discusses the resultsand concludes.
2. Experimental Design
Our experimental design simulates a work environment in an organization in whichemployees have multi-dimensional social identities and engage in strategic interac-tions with one another involving potential tradeoffs between self interest and groupinterest. Although our participants share a common organization identity, they comefrom diverse ethnic backgrounds. The incentivized tasks in the experiment involvechoices to cooperate or coordinate with another employee in the organization. Thus,the experimental design captures three important factors that may influence individualchoices at a workplace: self interest, group interest, and intergroup relations. We usethe priming method from social psychology to make one of the participants’ naturalidentities salient before they participate in a sequence of one-shot prisoner’s dilemmaand minimum-effort games.
In this study, we are interested in several questions. First, do people exhibit ingroupfavoritism and outgroup discrimination, even in the absence of priming, when the otherplayer’s ethnic identity is known? Second, does group behavior intensify when weprime a fragmenting (ethnic) identity? Lastly, can we alleviate ingroup favoritism andoutgroup discrimination by priming a common organization identity? In what follows,we describe the priming method, introduce the games and present the experimentalprocedure.
2.1. Identity Priming
Priming is an experimental technique in psychology that introduces certain stimuli(“primes") to activate individuals’ social knowledge structures (Bargh, 2006). Thetypes of primes include text (e.g., a questionnaire, an article, or a word scramblinggame), image, or audio.
Priming social identities can impact people’s behavior and attitudes outside of theirawareness and control (see Bargh and Chartrand 1999 for a review), as demonstratedby social psychologists in a large body of work on identity priming. In these laboratorystudies, psychologists have found that making social identities salient often inducesstudy participants to adopt behaviors that are consistent with the stereotypes associatedwith the identity. These effects occur even when participants are not aware that theyare being primed. In one study, college students primed with stereotypes of the elderlywalk more slowly as they exit the study than those who are not primed with stereotypesof the elderly (Bargh et al., 1996). In another study, Steele and Aronson (1995) find thatAfrican American students who are stereotyped to be poor students underperform onacademic tests when asked to indicate their race prior to taking the test. These effectshave also been documented in other groups such as Hispanic Americans (Aronsonet al., 1998), individuals from lower socio-economic status (Croizet and Claire, 1998)and women in math (Spencer et al., 1999).
4
On the other hand, while activating negative stereotypes can hurt performance, ac-tivating positive stereotypes can boost performance. In one experiment, Shih et al.(1999) examined the performance of Asian women on a mathematics test. Womenare stereotyped to have inferior quantitative skills (Benbow 1995; Hedges and Nowell1995) while Asians are stereotyped to have superior quantitative skills (Steen, 1987).Shih et al. (1999) find that Asian American women perform better on a mathemat-ics test when their ethnic identity is primed, but worse when their gender identity isprimed, compared to a control group with neither identity primed. In contrast, AsianAmericans taking a verbal test showed the reverse pattern of performance. In this case,women are stereotyped to be verbally talented while Asians are not. Asian Americanwomen perform higher on the verbal test when their gender is salient, and worse whentheir ethnicity is made salient (Shih et al., 2006). These priming techniques have alsobeen applied to study risk and time preferences in economics (Benjamin et al., 2010).
Identity priming can also activate intergroup bias. Simply exposing individuals towords indicating ingroup or outgroup identity can elicit differential judgements frompeople. Perdue et al. (1990) find that subliminally exposing individuals to words asso-ciated with the ingroup and the outgroup (i.e. “us", “them") affects how quickly studyparticipants judge positive and negative words. Participants are more quick to judgepositive to be positive if exposed to ingroup words such as “us," and more quick tojudge negative words to be negative if exposed to outgroup words such as “them". Inthe present study, we use identity priming methods to examine if individuals automati-cally exhibit intergroup bias in prisoner’s dilemma and coordination games.
We choose two ethnic groups, Caucasians and Asians, which can be differenti-ated by their last names. For Asian participants, we focus on those with Chineselast names in order to avoid potential complex intergroup preferences among differ-ent Asian groups, e.g., Chinese and Japanese.
We adopt the priming technique from Shih et al. (1999), and subtly activate a socialcategory outside of participants’ awareness in the identity treatments. The stimuli areintroduced through a pre-experiment questionnaire. In the ethnic identity treatment,the questions pertain to an individual’s ethnic background, family history (“How manygenerations has your family lived in America?" and “From which countries did youfamily originate?"), and cultural heritage (“What languages do you speak?"). In theschool identity treatment, subjects are asked about which school they attend. They arethen asked to reflect on their choices of schools when applying for college (“Did youconsider any other school? If yes, what other schools?", “Why did you decide to chooseyour specific school?"). Since the subjects in each experimental session study at thesame university, these questions pertain to an individual’s common identity of beingpart of her university. In the control sessions, the questions are designed to be identityneutral, i.e., related to neither the ethnic nor the school identities. Subjects are askedabout their activities in leisure time, for example, “How often do you watch television?"“How often do you eat out?" and “How often do you attend movies?" The identity neu-tral questionnaire is designed to preserve the direct comparability with the two identitytreatments. These procedures are adopted from those used in past psychology experi-ments and the questionnaires are modified versions of those used in Shih et al. (1999).The primes are designed to make salient the appropriate social identity and activate theconstructs associated with the identity. A social identity is attached to a whole host
5
of associated traits, stereotypes, social expectations, and schemas (Deaux, 1996). Thequestionnaires and summary responses are included in Appendix A.
2.2. The Games
To investigate intergroup and intragroup coordination and cooperation under con-ditions when a fragmenting or a common identity is made salient, we choose variantsof the prisoner’s dilemma and minimum-effort games. This class of games is amongthe simplest of those which capture the tension between individual and group inter-ests. The prisoner’s dilemma game has also been used in the social identity literaturein psychology to investigate the causes of group bias (Yamagishi and Kiyonari, 2000;Simpson, 2006).
2.2.1. The Prisoner’s Dilemma GamesFigure 1 presents the extensive forms of the five sequential prisoner’s dilemma
games (PD) in our experiment. In each game, player 1 has two strategies, cooperate(C) or defect (D), whereas player 2 has four strategies:
• Always cooperate (CC): cooperate if player 1 cooperates, and cooperate if player1 defects.
• Always defect (DD): defect if player 1 cooperates, and defect if player 1 defects.
• Reciprocal (CD): cooperate if player 1 cooperates, and defect if player 1 defects.
• Opposite (DC): defect if player 1 cooperates, and cooperate if player 1 defects.
Note that, while we use C and D throughout the paper for the ease of exposition,the subjects are given neutral terminologies. Player 1 (2), called player A (B) in theinstructions, has actions A1 (B1) and A2 (B2), corresponding to C and D, respectively.
In one-shot scenarios, a sizeable literature on social preferences uncovers a non-negligible number of conditional cooperators in social dilemma types of games (Fehrand Gaechter, 2000; Healy, 2007). Healy (2007) models the sequential prisoner’sdilemma game as a game of incomplete information about player 2’s types. Specif-ically, let p be player 1’s belief that 2 is a conditional cooperator. Assuming risk neu-trality, player 1 will choose to cooperate if the expected value from cooperation is atleast as great as the expected value from defection, i.e.,
pπ1(C,C) + (1− p)π1(C,D) ≥ π1(D,D).
Therefore, player 1 prefers to choose the lottery rather than choosing Defect if and onlyif the likelihood that player 2 is a conditional cooperator is sufficiently high, or p ≥ p∗,where
p∗ =π1(D,D)− π1(C,D)
π1(C,C)− π1(C,D).
In our experiment, payoffs in each PD game are chosen such that p∗ ∈ {0, 1/4, 1/2,2/3, 3/4}, which corresponds to PD games 0 to 4. In PD 1, player 1 should cooperate
6
C D
Player 2 C D
9 -6
3 3
p*=3/4
PD 4 Player 1
Player 2 C D
6 6
-6 9
C D
Player 2 C D
Player 1’s payoff
Player 2’s payoff
9 -3
3 3
p*=2/3
PD 3 Player 1
Player 2 C D
6 6
-3 9
C D
Player 2 C D
9 0
3 3
p*=1/2
PD 2 Player 1
Player 2 C D
6 6
0 9
C D
Player 2 C D
Player 1’s payoff
Player 2’s payoff
9 2
3 3
p*=1/4
PD 1 Player 1
Player 2 C D
6 6
2 9
C D
Player 2 C D
Player 1’s payoff
Player 2’s payoff
9 3
3 3
p*=0
PD 0 Player 1
Player 2 C D
6 6
3 9
Figure 1: Extensive Form Representation of the Prisoner’s Dilemma Games (PD)
7
if she believes that at least 1/4 of player 2s are conditional cooperators. In contrast,in PD 4, player 1 will cooperate when she believes that the proportion of conditionalcooperators exceeds 3/4. Other things being equal, we expect to see the likelihood ofplayer 1’s cooperation decrease from PD 0 to PD 4.
In this design, the range of thresholds for cooperation enables us to measure thesensitivity and robustness of group behavior under varying incentives. This designfeature is an improvement over previous studies, where only one threshold is imple-mented, such as in Yamagishi and Kiyonari (2000) who implement a sequential pris-oner’s dilemma game with p∗ = 1/2.
To accurately elicit player 2’s type, we use the strategy method. Specifically, player2 is asked to submit a complete strategy without knowing player 1’s choice, in the formof “if A chooses A1, I choose (B1 or B2); if A chooses A2, I choose (B1 or B2)."The use of the strategy method effectively transforms the extensive form games inFigure 1 into the normal form games in Figure 2.5
In normal form representation, PD 0 has four Nash equilibria, {(D, DD), (C, DD),(D, CC), (D, DC)}, while each game in PD 1-4 has a unique pure strategy Nash equi-librium, (D, DD). Thus, behavior in game 0 measures group effects on coordination,while behavior in games 1-4 measures group effects on cooperation.
Of player 2’s four strategies, DC (i.e., doing the opposite to what player 1 does)warrants more discussion. In PD 1-4, DC is weakly dominated by DD, and as expected,empirically adopted least often (Section 3). In PD 0, however, DC is a weakly dominantstrategy for player 2. Comparing player 2’s two weakly dominant strategies, DD andDC, we note that DC maximizes joint payoffs and Pareto dominates DD. Specifically,if player 1 chooses to defect, DC leads to a higher joint payoff without sacrificing ownpayoff (3 regardless); however, if player 1 chooses to cooperate (which leads to a jointpayoff of 12 regardless what player 2 does), player 2 chooses to defect to maximizeself interest. Therefore, we name DC as the rational joint-payoff-maximizing strategy(hereafter rJPM) in PD 0. Note that player 2’s other joint-payoff-maximizing strategy,CC, is weakly dominated, and thus not rational.
2.2.2. The Minimum-Effort GamesTo further investigate the effects of identity priming on coordination, we choose a
series of the minimum-effort games (ME) used in Goeree and Holt (2005). To makethem comparable to the PD games, we transform the 2 × 2 minimum-effort games inGoeree and Holt (2005) in three ways. First, we multiply all payoffs by 10 so that thepayoffs are similar in magnitude to those in the PD games. Second, we transform thenormal form games to the extensive form and then apply the strategy method. Lastly,
5Figuières et al. (2012) study voluntary contribution to public goods under three conditions, sequentialtreatment with information (about earlier contributions within round), sequential treatment without informa-tion, and a simultaneous treatment. They find that contributions under sequential treatment without informa-tion are not significantly different from that under the simultaneous treatment. A crucial difference betweenour implementation of the sequential move without information and theirs is that our player 2s submit strate-gies conditional on player 1’s move, whereas later movers in Figuières et al. (2012) cannot condition theircontributions on earlier contributions. Therefore, based on their Result 1, we expect our sequential withoutinformation implementation to be equivalent to the normal form games in Figure 2.
8
PD 0 CC DD CD DC
C 6, 6 3, 9 6, 6 3, 9
D 9, 3 3, 3 3, 3 9, 3
PD 1 CC DD CD DC
C 6, 6 2, 9 6, 6 2, 9
D 9, 2 3, 3 3, 3 9, 2
PD 3 CC DD CD DC
C 6, 6 -3, 9 6, 6 -3, 9
D 9, -3 3, 3 3, 3 9, -3
PD 2 CC DD CD DC
C 6, 6 0, 9 6, 6 0, 9
D 9, 0 3, 3 3, 3 9, 0
PD 4 CC DD CD DC
C 6, 6 -6, 9 6, 6 -6, 9
D 9, -6 3, 3 3, 3 9, -6
Figure 2: Normal Form Representation of the Prisoner’s Dilemma Games (PD)
9
we use five different cost parameters to vary the predictions of equilibrium selection,as explained after we introduce the games.
Figure 3 presents the extensive forms of the five sequential minimum-effort games.Similar to the PD games, player 1 in sequential ME games has two strategies, higheffort (H) or low effort (L), while player 2 has four strategies:
• Always choose high effort (HH): high effort if player 1 chooses H, and higheffort if player 1 chooses L.
• Always choose low effort (LL): low effort if player 1 chooses H, and low effortif player 1 chooses L.
• Reciprocal (HL): high effort if player 1 chooses H, and low effort if player 1chooses L.
• Opposite (LH): low effort if player 1 chooses H, and high effort if player 1chooses L.
As the minimum-effort games belong to the class of potential games (Mondererand Shapley, 1996), we can vary a cost parameter so that the potential maximizingequilibrium is either the low- or high-effort equilibrium. Define c as player i’s marginalcost of effort. As discussed in Goeree and Holt (2005), in the 2×2 version of the game,when c > 0.5, {L, L} is the potential maximizing equilibrium, whereas {H, H} is thepotential maximizing equilibrium when c < 0.5. Thus, c∗ = 0.5 is the cutoff costparameter.
Given sufficient time to learn, Goeree and Holt (2005) demonstrate that stochas-tic potential maximization is a good predictor for the outcome distributions.6 Usinginduced identities and a continuum of strategies in the lab, Chen and Chen (2011)demonstrate that, when c = 0.75, play converges to the low-effort equilibrium in thecontrol and with outgroup matching, but it converges to the high-effort equilibriumwith ingroup matching. This is consistent with their theoretical prediction that a salientingroup identity changes equilibrium selection by changing the potential function ofthe game.
In comparison to Chen and Chen (2011), we investigate whether differentially ac-tivated natural identities might influence equilibrium selection with varying strengthof incentives. Therefore, we choose c ∈ {0.4, 0.5, 0.6, 0.7, 0.8}. With this set of pa-rameters, the low-effort equilibrium maximizes the potential for c > 0.5, whereas thehigh-effort equilibrium maximizes the potential when c = 0.4. At the cutoff value,c∗ = 0.5, play is diffused without identity priming, and it should converge to the high-effort equilibrium with in-group matching. Previous experimental evidence suggeststhat potential maximization provides a benchmark for comparative statics, althoughnot good point predictions. Thus, we expect that as c increases, the likelihood of coor-dination to the efficient high-effort equilibrium will decrease.
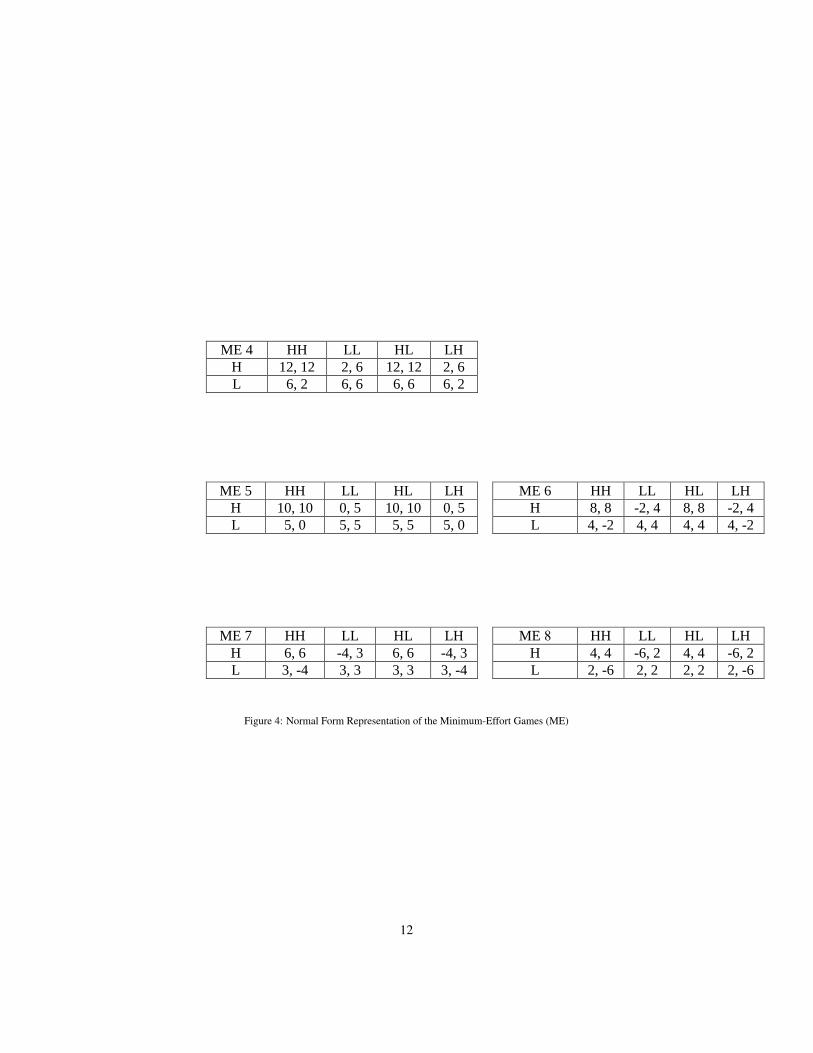
As in the prisoner’s dilemma games, the strategy method transforms the extensiveform games in Figure 3 into the normal form games in Figure 4.
6Fatas and Morales (2013) apply an alternative step-thinking model to the experimental data from Goeree
10
• Always choose low effort (LL): low effort if player 1 chooses H, and low effort if player 1chooses L.
• Reciprocal (HL): high effort if player 1 chooses H, and low effort if player 1 chooses L.
• Opposite (LH): low effort if player 1 chooses H, and high effort if player 1 chooses L.
H L
Player 2 H L
2 -6
2 2
c=0.8
ME 8 Player 1
Player 2 H L
4 4
-6 2
H L
Player 2 H L
Player 1’s payoff
Player 2’s payoff
3 -4
3 3
c=0.7
ME 7 Player 1
Player 2 H L
6 6
-4 3
H L
Player 2 H L
4 -2
4 4
c=0.6
ME 6 Player 1
Player 2 H L
8 8
-2 4
H L
Player 2 H L
Player 1’s payoff
Player 2’s payoff
5 0
5 5
c*=0.5
ME 5 Player 1
Player 2 H L
10 10
0 5
H L
Player 2 H L
Player 1’s payoff
Player 2’s payoff
6 2
6 6
c=0.4
ME 4 Player 1
Player 2 H L
12 12
2 6
Figure 3: Extensive Form Representation of the Minimum-Effort Games (ME)
As the minimum-effort games belong to the class of potential games (Monderer and Shapley1996), we can vary a cost parameter so that the potential maximizing equilibrium is either the
9
Figure 3: Extensive Form Representation of the Minimum-Effort Games (ME)
11
ME 4 HH LL HL LH
H 12, 12 2, 6 12, 12 2, 6
L 6, 2 6, 6 6, 6 6, 2
ME 5 HH LL HL LH
H 10, 10 0, 5 10, 10 0, 5
L 5, 0 5, 5 5, 5 5, 0
ME 7 HH LL HL LH
H 6, 6 -4, 3 6, 6 -4, 3
L 3, -4 3, 3 3, 3 3, -4
ME 6 HH LL HL LH
H 8, 8 -2, 4 8, 8 -2, 4
L 4, -2 4, 4 4, 4 4, -2
ME 8 HH LL HL LH
H 4, 4 -6, 2 4, 4 -6, 2
L 2, -6 2, 2 2, 2 2, -6
Figure 4: Normal Form Representation of the Minimum-Effort Games (ME)
12
In its normal form representation, each of the five games has three pure strategyNash equilibria, {(H, HH), (H, HL), (L, LL)}. Note that HL is player 2’s only weaklydominant strategy. In addition, conditional on player 1’s choice, HL also maximizesjoint payoff. Therefore, HL maximizes player 2’s self-interest as well as joint payoff,making it a strong predictor for player 2s’ behavior.
2.3. Experimental Procedure
At the University of Michigan, we implement one control condition and two iden-tity priming treatments, each of which has five independent sessions for the PD andME games, respectively. The two treatments include an ethnic identity treatment wherewe prime participants’ (fragmenting) ethnic identities and a school identity treatmentwhere we prime participants’ common University of Michigan identity. We explain ourexperimental procedure in detail below.
Common to all three experimental conditions, each session consists of eight sub-jects and three stages: a pre-experiment questionnaire to prime a participant’s naturalidentity in the treatments and an identity-neutral questionnaire for the control con-dition, four rounds of two-person games, each with a different match, and a post-experiment questionnaire to elicit demographics information and to check the effectsof priming.
In the first stage, participants in each experimental session fill out a pre-experimentquestionnaire designed to prime ethnic or school identity in the two respective treat-ments, or an identity-neutral questionnaire in the control condition.
In the second stage, eight subjects in each session are randomly assigned as player1 or 2 in the two-person games for four rounds. Although their player roles are fixedduring the experiment, their match in each round is different in order to minimizerepeated game effects. In each round, each participant plays the five PD (or ME) gameswith her match. To control for any game order effect within a treatment, we use a LatinSquare design, whereby each of the five sessions in a treatment has a different gameorder.7
Unlike most laboratory experiments that use anonymous matching,8 we providethe co-player’s ethnic background information in all three treatments. Specifically, theco-player’s last name appears on the screen. For example, a participant is told that sheis matched with “Chen" or “Smith" while making the decision. The displayed name isthe co-player’s real last name.
Furthermore, since the participants go through several rounds, we expose themto photos as an unobtrusive means to reinforce the primes.9 We select four pictures
and Holt (2005) and obtain precise point predictions for the observed results.7The PD game orders include 0-1-2-3-4, 1-2-3-4-0, 2-3-4-0-1, 3-4-0-1-2, and 4-0-1-2-3, so that each
game has appeared once in each position. The ME game orders follow the same process.8Andreoni and Petrie (2004) is a notable exception where subjects’ digital photos are presented to their
partners in a laboratory fundraising experiment.9The use of posters and pictures to prime stereotypes is a common procedure in psychological priming
studies. For instance, Cheryan et al. (2009) used posters to make salient stereotypes in the computer sci-ences. Chen and Bargh (1997) exposed participants to picture of Black and White faces to prime stereotypesassociated with race.
13
for each treatment, and display one picture at a time on the computer screen for fiveseconds before subjects proceed to the next round. In the ethnic identity treatment,pictures of architecture from China and Europe are shown, while in the school identitytreatment, subjects see pictures of their university landmarks. In the control sessions,identity-neutral landscape pictures are shown. These photos were pretested to estab-lish that they primed the appropriate identities and that they were equally positive invalence.10 Additionally, we elicit individual beliefs about her match’s decision in eachgame, and reward each correct guess with 2 points. Feedbacks on their matches’ actualdecisions are not provided until the end of the experiment. The experimental instruc-tions and the pictures (Figures 9, 10 and 11) are included in Appendix B.
Note in all the treatments, including the control condition, co-player’s surnameis provided to subjects before they make decisions. We choose this design to makethe setting more comparable to real-life social interactions at workplaces. When peo-ple interact with one another at work, they have the information on their co-workers’ethnicity. Therefore, compared to an alternative design in which no information is pro-vided on the co-player, the current control condition serves as a better benchmark andcarries more natural generalization to organization design.
In the third stage, we conduct a post-experiment survey, which collects informationon demographics, self-statements, strategies used during the experiments, and evalua-tion of ethnic stereotypes. The post-experiment questionnaire and summary responsesare included in Appendix C.
Table 1 summarizes the features of the experimental sessions, including treatments,number of participants, and ethnic compositions by treatment. Overall, 30 independentcomputerized sessions were conducted at the School of Information Lab at the Univer-sity of Michigan, with a total of 240 student subjects. The 15 sessions of PD gameswere conducted from May to July 2008, with 62 Asian and 58 Caucasian participants.Another 15 sessions of ME games were conducted from June to July 2012, with 61Asian and 59 Caucasian participants.11
10For the pretest, we had coders rate the photos on how ethnic, UM related, and positive they were. Wefound that the ethnic architecture were rated as more ethnic than the other photos. The UM photos weremore UM related than the other photos. Furthermore, there were no differences in how positive the photoswere.
11Another 15 sessions of the PD games were conducted in the California Social Science ExperimentalLaboratory (CASSEL) at UCLA in May 2009, with 63 Asian and 57 Caucasian participants. However, due
14
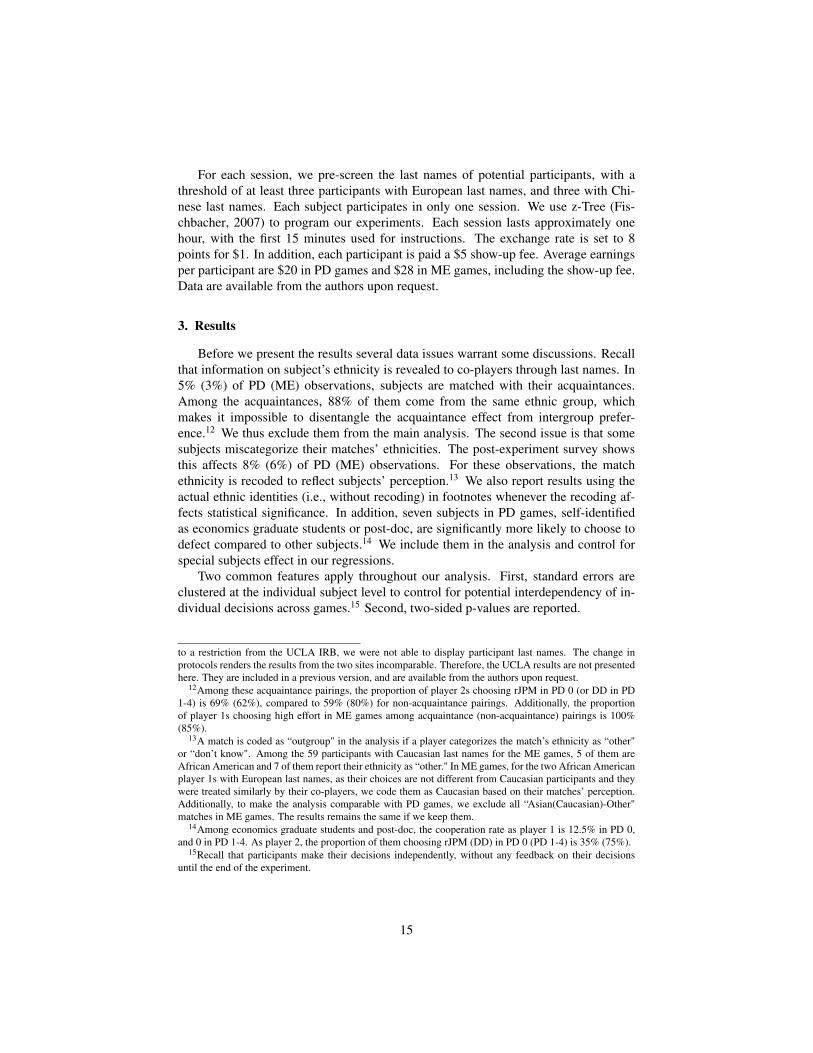
For each session, we pre-screen the last names of potential participants, with athreshold of at least three participants with European last names, and three with Chi-nese last names. Each subject participates in only one session. We use z-Tree (Fis-chbacher, 2007) to program our experiments. Each session lasts approximately onehour, with the first 15 minutes used for instructions. The exchange rate is set to 8points for $1. In addition, each participant is paid a $5 show-up fee. Average earningsper participant are $20 in PD games and $28 in ME games, including the show-up fee.Data are available from the authors upon request.
3. Results
Before we present the results several data issues warrant some discussions. Recallthat information on subject’s ethnicity is revealed to co-players through last names. In5% (3%) of PD (ME) observations, subjects are matched with their acquaintances.Among the acquaintances, 88% of them come from the same ethnic group, whichmakes it impossible to disentangle the acquaintance effect from intergroup prefer-ence.12 We thus exclude them from the main analysis. The second issue is that somesubjects miscategorize their matches’ ethnicities. The post-experiment survey showsthis affects 8% (6%) of PD (ME) observations. For these observations, the matchethnicity is recoded to reflect subjects’ perception.13 We also report results using theactual ethnic identities (i.e., without recoding) in footnotes whenever the recoding af-fects statistical significance. In addition, seven subjects in PD games, self-identifiedas economics graduate students or post-doc, are significantly more likely to choose todefect compared to other subjects.14 We include them in the analysis and control forspecial subjects effect in our regressions.
Two common features apply throughout our analysis. First, standard errors areclustered at the individual subject level to control for potential interdependency of in-dividual decisions across games.15 Second, two-sided p-values are reported.
to a restriction from the UCLA IRB, we were not able to display participant last names. The change inprotocols renders the results from the two sites incomparable. Therefore, the UCLA results are not presentedhere. They are included in a previous version, and are available from the authors upon request.
12Among these acquaintance pairings, the proportion of player 2s choosing rJPM in PD 0 (or DD in PD1-4) is 69% (62%), compared to 59% (80%) for non-acquaintance pairings. Additionally, the proportionof player 1s choosing high effort in ME games among acquaintance (non-acquaintance) pairings is 100%(85%).
13A match is coded as “outgroup" in the analysis if a player categorizes the match’s ethnicity as “other"or “don’t know". Among the 59 participants with Caucasian last names for the ME games, 5 of them areAfrican American and 7 of them report their ethnicity as “other." In ME games, for the two African Americanplayer 1s with European last names, as their choices are not different from Caucasian participants and theywere treated similarly by their co-players, we code them as Caucasian based on their matches’ perception.Additionally, to make the analysis comparable with PD games, we exclude all “Asian(Caucasian)-Other"matches in ME games. The results remains the same if we keep them.
14Among economics graduate students and post-doc, the cooperation rate as player 1 is 12.5% in PD 0,and 0 in PD 1-4. As player 2, the proportion of them choosing rJPM (DD) in PD 0 (PD 1-4) is 35% (75%).
15Recall that participants make their decisions independently, without any feedback on their decisionsuntil the end of the experiment.
15
We are interested in the extent to which the ethnic and school priming influencescoordination (ME games, PD 0) and cooperation (PD 1-4), respectively. Since earlierstudies in social psychology suggest that favoritism towards ingroup and discrimina-tion against outgroup may occur separately (Brewer, 1999), we examine the treatmenteffects on ingroup favoritism, outgroup discrimination, and intergroup differentials, re-spectively. The analysis focuses on individual strategies although the results are largelyconsistent with actions-based analysis.
Table 2 presents the outcome distribution in each of the five ME games. Tables 9to 14 in Appendix D separately tabulate the same information by match types. Recallthat each of the ME games has three Pareto-ranked Nash equilibrium outcomes, {(H,HH), (H, HL), (L, LL)}. One of the Pareto-efficient Nash equilibrium outcomes, (H,HL), is the mode of distribution in every game of every treatment. Furthermore, thereciprocal strategy, HL, accounts for over 95% of player 2 strategies in each game,which indicates that any treatment effect is likely to be caused by player 1 strategies.Going from ME 4 to ME 8, we observe a general increase in L in each treatment,consistent with the prediction of potential games. In our subsequent analysis of MEgames, we will focus on player 1 strategies.
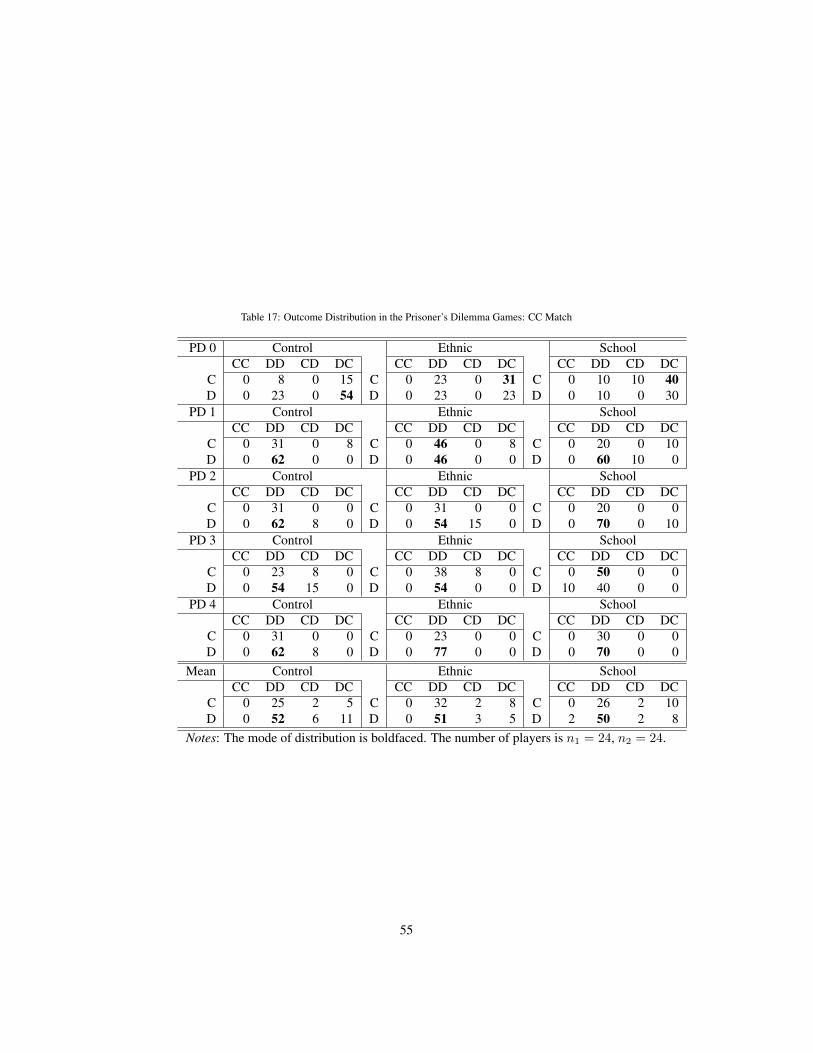
Similarly, Table 3 presents the outcome distributions in each of the five PD games.Again, Tables 15 to 18 in Appendix D tabulate the same information by match type.Nash equilibrium outcomes are again italicized, whereas the mode of distribution isboldfaced. Recall that PD 0 has four Nash equilibrium outcomes, {(D, DD), (C, DD),(D, CC), (D, DC)}. Two of player 2’s strategies, DD and DC (or rJPM), account forover 80% of player 2’s choices. In PD 1-4, the unique Nash equilibrium outcome, (D,DD), is also the mode of distribution in each treatment, and DD accounts for more than2/3 of player 2’s choices. Therefore, in subsequent analysis of player 2 strategies, wewill focus on DD and DC in PD 0, and DD in PD 1-4.
3.1. Control
Recall participants in the control sessions are given information (i.e., last name) thatreveals the match’s ethnicity, although the pre-survey is intended to be identity neutral.This design enables us to identify potential group effects associated with the revelationof ethnicity information. It makes the setting comparable to real-life workplaces whereco-workers have information about others’ ethnicity.
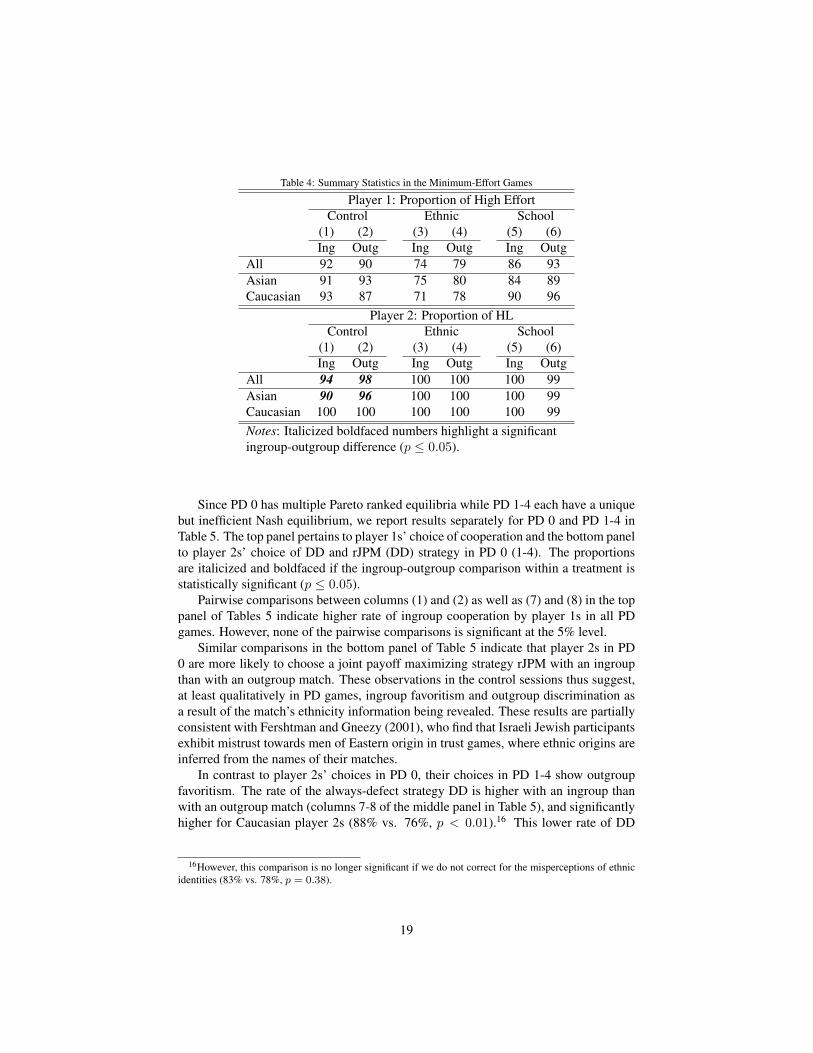
The results from the control sessions in the minimum-effort games, presented incolumns (1) and (2) in Table 4, establish a baseline for comparison with the two identitytreatments. The top panel pertains to player 1s’ choice of high effort and the bottompanel to player 2s’ choice of the reciprocal HL strategy. We present results for allplayers, as well as Asian and Caucasian players separately. While player 1s are morelikely to choose high effort when matched with an ingroup member, this intergroupdifference is not statistically significant. In comparison, player 2s are significantlymore likely to choose HL when matched with an outgroup member, which is drivenby Asian players. This outgroup favoritism has also been observed among East Asianchildren in a dictator game (Friesen et al. 2012) and among the Vietnamese towards theKhmer in dictator and envy games after controlling for socio-demographic variables(Tanaka and Camerer 2013).
16
Table 2: Outcome Distribution in the Minimum-Effort Games
ME 4 Control Ethnic SchoolHH LL HL LH HH LL HL LH HH LL HL LH
H 0 1 94 0 H 0 0 91 0 H 0 0 93 0L 0 0 5 0 L 0 0 9 0 L 0 0 7 0
ME 5 Control Ethnic SchoolHH LL HL LH HH LL HL LH HH LL HL LH
H 0 5 92 0 H 0 0 77 0 H 0 0 87 0L 0 0 3 0 L 0 0 23 0 L 0 0 13 0
ME 6 Control Ethnic SchoolHH LL HL LH HH LL HL LH HH LL HL LH
H 0 3 85 1 H 0 0 75 0 H 0 0 88 0L 0 1 10 0 L 0 0 25 0 L 0 0 12 0
ME 7 Control Ethnic SchoolHH LL HL LH HH LL HL LH HH LL HL LH
H 0 1 82 1 H 0 0 72 0 H 1 0 87 0L 0 1 14 0 L 0 0 28 0 L 0 0 12 0
ME 8 Control Ethnic SchoolHH LL HL LH HH LL HL LH HH LL HL LH
H 0 3 78 0 H 0 0 73 0 H 0 1 78 0L 0 1 18 0 L 0 0 27 0 L 0 0 21 0
Mean Control Ethnic SchoolHH LL HL LH HH LL HL LH HH LL HL LH
H 0 3 86 1 H 0 0 78 0 H 0 0 87 0L 0 1 10 0 L 0 0 22 0 L 0 0 13 0
Notes:a. Nash equilibrium outcomes, {(H, HH), (H, HL), (L, LL)}, are italicized.b. The mode of distribution is boldfaced.
17
Table 3: Outcome Distribution in the Prisoner’s Dilemma Games
PD 0 Control Ethnic SchoolCC DD CD DC CC DD CD DC CC DD CD DC
C 3 16 1 16 C 0 10 4 19 C 0 4 1 26D 7 20 4 33 D 3 21 9 35 D 1 18 1 49
PD 1 Control Ethnic SchoolCC DD CD DC CC DD CD DC CC DD CD DC
C 3 21 0 3 C 1 38 6 3 C 0 16 0 3D 5 49 5 13 D 4 42 3 3 D 8 68 3 3
PD 2 Control Ethnic SchoolCC DD CD DC CC DD CD DC CC DD CD DC
C 3 21 1 0 C 0 24 4 0 C 0 24 0 0D 0 55 19 1 D 1 54 14 3 D 1 65 7 3
PD 3 Control Ethnic SchoolCC DD CD DC CC DD CD DC CC DD CD DC
C 0 17 4 1 C 0 28 5 0 C 1 20 4 0D 4 49 23 1 D 1 55 10 0 D 3 62 9 0
PD 4 Control Ethnic SchoolCC DD CD DC CC DD CD DC CC DD CD DC
C 0 16 5 0 C 1 26 4 0 C 0 19 3 0D 4 57 17 0 D 1 56 12 0 D 1 72 5 0
Mean Control Ethnic SchoolCC DD CD DC CC DD CD DC CC DD CD DC
C 2 18 2 4 C 1 25 5 4 C 0 17 2 6D 4 46 14 10 D 2 46 9 8 D 3 57 5 11
Since PD 0 has multiple Pareto ranked equilibria while PD 1-4 each have a uniquebut inefficient Nash equilibrium, we report results separately for PD 0 and PD 1-4 inTable 5. The top panel pertains to player 1s’ choice of cooperation and the bottom panelto player 2s’ choice of DD and rJPM (DD) strategy in PD 0 (1-4). The proportionsare italicized and boldfaced if the ingroup-outgroup comparison within a treatment isstatistically significant (p ≤ 0.05).
Pairwise comparisons between columns (1) and (2) as well as (7) and (8) in the toppanel of Tables 5 indicate higher rate of ingroup cooperation by player 1s in all PDgames. However, none of the pairwise comparisons is significant at the 5% level.
Similar comparisons in the bottom panel of Table 5 indicate that player 2s in PD0 are more likely to choose a joint payoff maximizing strategy rJPM with an ingroupthan with an outgroup match. These observations in the control sessions thus suggest,at least qualitatively in PD games, ingroup favoritism and outgroup discrimination asa result of the match’s ethnicity information being revealed. These results are partiallyconsistent with Fershtman and Gneezy (2001), who find that Israeli Jewish participantsexhibit mistrust towards men of Eastern origin in trust games, where ethnic origins areinferred from the names of their matches.
In contrast to player 2s’ choices in PD 0, their choices in PD 1-4 show outgroupfavoritism. The rate of the always-defect strategy DD is higher with an ingroup thanwith an outgroup match (columns 7-8 of the middle panel in Table 5), and significantlyhigher for Caucasian player 2s (88% vs. 76%, p < 0.01).16 This lower rate of DD
16However, this comparison is no longer significant if we do not correct for the misperceptions of ethnicidentities (83% vs. 78%, p = 0.38).
19
Table 5: Summary Statistics in Prisoner’s Dilemma Games
PD 0 PD 1-4Player 1: Proportion of Cooperation Player 1: Proportion of Cooperation
Control Ethnic School Control Ethnic School(1) (2) (3) (4) (5) (6) (7) (8) (9) (10) (11) (12)Ing Outg Ing Outg Ing Outg Ing Outg Ing Outg Ing Outg
with an outgroup match is due to player 2s’ increased positive reciprocity towardsan outgroup match in games 1-4.17 This outgroup favoritism, while opposite to thefindings in earlier studies with near-minimal groups in the lab (Chen and Li, 2009), hasbeen reported in studies with natural identities (Friesen et al. 2012, Tanaka and Camerer2013). Nevertheless, since we are primarily interested in how different identity priminginfluences individual choices and their intergroup preferences, these findings in thecontrol sessions serve as a benchmark for the analysis of the treatment effects of ethnicand school priming.
3.2. TreatmentsIn this subsection, we investigate the extent to which identity priming affects indi-
vidual behavior in the ME games, PD 0, and PD 1-4, respectively. For each result, wefirst present the aggregate treatment effects (Table 6). We then discuss heterogeneousimpact of identity priming on Asian and Caucasian subjects separately (Table 7).
Table 6 presents six probit specifications investigating the treatment effects of iden-tity priming, each of which corresponds to each role’s strategy by game.18 The depen-dent variables are player 1’s choice of high effort in the ME games (column 1), player1’s choice of cooperation in PD 0 (column 2), player 2’s choice of rJPM (column 3) orDD (column 4) in PD 0, player 1’s choice of cooperation in PD 1-4 (column 5), andplayer 2’s choice of DD in PD 1-4 (column 6), respectively. As we are interested in thetreatment effects, the independent variables of interest are ethnic priming and schoolpriming. The control is the omitted category. We also control for special subjects,i.e., economics graduate students and post-doctoral scholars, and game fixed effects.Coefficient estimates are reported. Standard errors in parentheses are clustered at theindividual subject level.
We first investigate behavioral changes in the ethnic priming treatment relative tothe control sessions. Recall subjects in both treatments are given information on thematch’s ethnicity. The only difference is that the pre-survey in the ethnic priming treat-ment is used to activate ethnic identities, whereas that in the control is designed to beidentity neutral. We focus on the treatment effect, i.e., how ethnic priming, in addi-tion to information on match’s ethnicity (surnames), influences participant behavior,relative to the control.
As ethnic priming might subtly activate fragmenting identities, compared to thecontrol sessions, we expect that participants will be less cooperative in the ethnic prim-ing treatment.
Hypothesis 1 (Ethnic Priming). Compared to the control, players are less cooperativein the ethnic priming treatment.
In the minimum-effort games, Hypothesis 1 implies that, compared to the control,player 1s will be less likely to choose high effort in the ethnic priming treatment. Sim-
17For Caucasian player 2s in the control (PD 1-4), when player 1 cooperates, the proportion of cooperationis 10% for an ingroup match and 20% for an outgroup match (p < 0.01). When player 1 defects, theproportion of cooperation is 16% for an ingroup match and 17% for an outgroup match (p = 0.312).
18The regression for player 2’s strategies in the ME games is omitted due to the lack of variations acrosstreatments as shown in Table 4.
21
Table 6: Aggregate Treatment Effects of Identity Priming: Probit
Games: ME 4-8 PD 0 PD 1-4Roles: Player 1 Player 1 Player 2 Player 1 Player 2Strategies: High Effort Cooperation rJPM DD Cooperation DDSpecification: (1) (2) (3) (4) (5) (6)Ethnic Priming -0.652** -0.072 0.168 -0.211 0.328 0.314
(0.268) (0.235) (0.218) (0.222) (0.236) (0.229)Observations 1,030 227 227 227 876 908Log Pseudo L. -389.6 -143.8 -146.1 -133.4 -515.8 -446.3Pseudo R2 0.08 0.01 0.05 0.03 0.014 0.02Notes:a. Game dummies and special subjects are controlled for.b. Coefficients are reported.c. Robust standard errors in parentheses are clustered at the individual level.d. Significant at: * 10-percent level; ** 5-percent level; *** 1-percent level.
ilarly, in PD 0, it implies that, compared to the control, player 1s will be less likely tochoose cooperation, whereas player 2s will be less (more) likely to choose rJPM (DD).
Result 1 (Ethnic Priming on Coordination). In the minimum-effort games, ethnic prim-ing reduces the likelihood that player 1 chooses high effort by 13.6% compared to thecontrol. In comparison, ethnic priming has no statistically significant effect in PD 0.
Support. Column (1) in Table 6 shows that ethnic priming significantly reduces player1’s choice of high effort (-0.652, p < 0.05, marginal effect 13.6%) in the ME games.Consequently, the Pareto-efficient Nash equilibrium outcome, (H, HL), is selected 11%less often in ethnic priming treatment than in the control. In comparison, none of thecoefficients of ethnic priming in columns (2) - (4) is significant at the 5% level.
For each column in Table 6, we further analyze potential heterogeneous subgroupeffects of identity priming in Table 7. Specifically, Table 7 provides the results sepa-rately for Asian and Caucasian subjects. In addition, the interaction terms of identityprimes with the ingroup dummy variable allow the impact of identity primes to vary forthe different types of group matching (Brewer 1999).19 Again, Table 7 presents probitspecifications with standard errors clustered at the individual subject level. We again
19An alternative empirical approach is to allow three way interactions among identity prime (ethic orschool), matching type (ingroup or outgroup), and ethnic background (Asian or Caucasian). Results arerobust to the alternative specifications, but Table 7 are easier to interpret.
22
control for special subjects and game fixed effects, and omit the coefficients due to thespace constraint.
Result 1 suggests that on average player 1’s choice of high effort in the ethnic primetreatment is 13.6% lower than that in the control. The reduction in player 1’s higheffort happens for all types of pairings, including 17.7% for Asian ingroup pairing,13.9% for Asian outgroup pairing, 23.3% for Caucasian ingroup pairing, and 7.5% forCaucasian outgroup pairing (columns 1 and 2 in Table 7).20 Further analyzing theseeffects by pairing type, i.e., the coefficient estimates of the Ethnic Priming variable andits interaction with Ingroup in columns (1) and (2) in Table 7, we cannot reject thatthe reduction in player 1’s high effort differs in any pairing from others. Therefore, byResult 1, we reject the null in favor of Hypothesis 1 for ME games.
Result 2 (Ethnic Priming on Cooperation). In PD 1-4, while ethnic priming has noaggregate treatment effect, Caucasian players are significantly more likely to chooseDD when matched with an outgroup member under ethnic priming, compared to thecontrol condition.
Support. In Table 6, neither coefficient of ethnic priming in columns (5) or (6) issignificant at the 5% level. In column (12) of Table 7, the coefficient of ethnic primingis positive and significant (0.788, p < 0.05, marginal effect 15.7%), indicating that,compared to the control, Caucasian players are significantly more likely to choose DDwhen matched with an outgroup member.
We next evaluate how school identity priming influences individual behavior com-pared to the control sessions. Recall the common identity prime, implemented in thepre-survey, is designed to subtly activate individual’s common identity of being part ofher university. We again focus on the treatment effect, i.e., how school identity prim-ing, in addition to the information on a match’s ethnicity, influences behavior relative tothe control. In the school priming treatment, we expect less intergroup bias comparedto the control.
Hypothesis 2 (School Priming). Compared to the control, a player will be more coop-erative in the school priming treatment.
In the minimum-effort games, Hypothesis 2 implies that, compared to the control,in the school priming treatment, player 1 will be more likely to choose high effort witheither an ingroup or an outgroup match. Similarly, in the prisoner’s dilemma games, itimplies that, compared to the control, in the school priming treatment, player 1s willbe more likely to cooperate with an ingroup or an outgroup match. For player 2s, thelikelihood of adopting rJPM (DD) strategy increases (decreases) from the control tothe school priming treatment in PD 0 (PD 1-4).
20The marginal effect of ethnic priming for outgroup (or ingroup) is computed as the change in probabilityof player 1’s choice of high effort when the ethnic priming variable changes from 0 to 1, and the ingroupdummy variable takes the value of 0 (or 1). Although the marginal effect is significant for none of thesepairing types due to the smaller sample sizes (p > 0.10), the aggregate effect of ethnic priming on all player1’s choice of high effect (13.6%) is statistically significant at the 5% level. Marginal effects in the remainderof this section are computed in the same way.
23
Tabl
e7:
Trea
tmen
tEff
ects
ofId
entit
yPr
imin
gby
Play
erE
thni
city
:Pro
bit
ME
4-8
PD0
PD1-
4Pl
ayer
1Pl
ayer
1Pl
ayer
2Pl
ayer
1Pl
ayer
2H
igh
Eff
ort
Coo
pera
tion
rJPM
DD
Coo
pera
tion
DD
Asi
anC
auca
sian
Asi
anC
auca
sian
Asi
anC
auca
sian
Asi
anC
auca
sian
Asi
anC
auca
sian
Asi
anC
auca
sian
(1)
(2)
(3)
(4)
(5)
(6)
(7)
(8)
(9)
(10)
(11)
(12)
Eth
nic
-0.6
45-0
.377
-0.6
120.
399
0.51
80.
311
-0.3
50-0
.245
0.03
20.
629
0.47
10.
788*
*(0
.520
)(0
.448
)(0
.436
)(0
.462
)(0
.572
)(0
.499
)(0
.575
)(0
.541
)(0
.434
)(0
.425
)(0
.419
)(0
.372
)Sc
hool
-0.2
730.
665
-0.3
250.
073
1.36
9**
0.27
3-0
.713
-0.0
640.
022
0.20
61.
109*
0.31
5(0
.532
)(0
.411
)(0
.493
)(0
.412
)(0
.598
)(0
.505
)(0
.640
)(0
.523
)(0
.499
)(0
.511
)(0
.573
)(0
.394
)In
grou
p-0
.136
0.37
20.
596*
0.02
60.
419
0.20
9-0
.035
0.00
00.
234
0.33
0**
0.25
90.
499*
**(0
.217
)(0
.371
)(0
.362
)(0
.333
)(0
.255
)(0
.338
)(0
.236
)(0
.381
)(0
.302
)(0
.162
)(0
.282
)(0
.140
)E
thni
c×In
grp
-0.0
48-0
.587
-0.0
900.
099
-0.3
43-0
.717
-0.2
020.
651
0.18
3-0
.264
-0.5
28-0
.556
(0.3
00)
(0.4
61)
(0.5
28)
(0.5
96)
(0.3
29)
(0.4
63)
(0.4
30)
(0.4
40)
(0.4
29)
(0.2
30)
(0.3
82)
(0.5
17)
Scho
ol×
Ingr
p-0
.081
-0.9
15**
-0.1
370.
395
-0.4
23-0
.251
0.08
0-0
.276
-0.1
87-0
.069
-0.5
96*
-0.2
31(0
.441
)(0
.458
)(0
.468
)(0
.483
)(0
.483
)(0
.597
)(0
.477
)(0
.572
)(0
.313
)(0
.254
)(0
.360
)(0
.414
)C
onst
ant
1.18
4***
0.80
4**
-0.2
30-0
.748
**-0
.599
0.29
3-0
.279
-0.5
02-0
.834
**-1
.005
***
0.24
20.
831*
*(0
.443
)(0
.366
)(0
.333
)(0
.344
)(0
.431
)(0
.335
)(0
.411
)(0
.361
)(0
.371
)(0
.336
)(0
.319
)(0
.372
)O
bser
vatio
ns54
548
511
511
212
210
512
210
542
844
848
842
0L
ogPs
eudo
L.
-209
.5-1
73.1
-70.
1-6
7.2
-74.
5-6
5.9
-68.
7-6
2.4
-245
.5-2
59.8
-261
.0-1
60.6
Pseu
doR
20.
070.
120.
070.
020.
120.
010.
070.
020.
020.
050.
060.
05N
otes
:a.
Gam
edu
mm
ies
and
spec
ials
ubje
cts
are
cont
rolle
dfo
r.b.
Coe
ffici
ents
are
repo
rted
.c.
Rob
usts
tand
ard
erro
rsin
pare
nthe
ses
are
clus
tere
dat
the
indi
vidu
alle
vel.
d.Si
gnifi
cant
at:*
10-p
erce
ntle
vel;
**5-
perc
entl
evel
;***
1-pe
rcen
tlev
el.
24
In Table 6, for the ME games (column 1), school identity priming does not affectplayer 1’s choice (−0.073, p > 0.10), mainly because player 1’s likelihood of choosinghigh effort in the control is already as high as 91%. Nevertheless, an interesting sub-group result is that the school identity priming increases Caucasian player 1’s choice ofhigh effort with outgroup (87% in the control vs. 96% in the school priming treatment,Table 4), but has little impact on their choice of high effort with ingroup matches (93%in control vs. 90% in the school priming treatment, Table 4). Consequently, the schoolidentity priming significantly alleviates Caucasian player 1’s outgroup discrimination,which is reflected by the coefficient estimate of the School*Ingroup variable in column(2) of Table 7 (−0.915, p < 0.05).
We next turn to PD 0. Since the school priming does not affect player 1’s decisionsor player 2’s choice of the DD strategy, we focus on player 2’s choice of the rJPMstrategy. Result 3 summarizes our analysis of school priming in ME and PD 0.
Result 3 (School Priming on Coordination). While school priming has no effect on theME games, in PD 0, the common school identity priming makes player 2s significantlymore likely to choose the rJPM strategy compared to the control (with a marginal effectof 24.8%). This increase in rJPM is mainly contributed by Asians.
Support. In column (3) of Table 6, the coefficient of school priming is positive andsignificant (0.674, p < 0.05, marginal effect 24.8%). The treatment effects by playertype and pairing in Table 7 shows that this increase in player 2’s rJPM as the resultof school priming is shared by all pairing types, and is primarily driven by Asians’behaviors: 34.6% (p < 0.05) by Asian ingroup pairing, 48.4% (p < 0.05) by Asianoutgroup pairing, 1% (p > 0.10) by Caucasian ingroup pairing, and 9% (p > 0.10) byCaucasian outgroup pairing (marginal effects are computed based on columns 5 and 6in Table 7).
By Result 3, we reject the null in favor of Hypothesis 2 that school priming in-creases participant cooperativeness for both ingroup and outgroup matches. Comparedto the impact of school priming on coordination, its impact on cooperation in PD 1-4is more complex.
An interesting result on the aggregate treatment effect in PD games 1-4 is that theschool identity priming marginally increases player 2’s choice of DD strategy (0.532,p < 0.10, marginal effect 14.6%, column 6, Table 6). As shown in the subgroup anal-ysis in Table 7, this increase in player 2’s choice of DD happens to all pairing types.Specifically, the increase in DD is 28.2% (p < 0.05) for Asian outgroup pairing, 15.7%for Asian ingroup pairing (p > 0.10), 6.8% (p > 0.10) for Caucasians outgroup pair-ing, and 1.4% (p > 0.10) for Caucasian ingroup pairing (marginal effects are computedbased on columns 11 and 12 of Table 7).
The increase in Asian player 2’s choice of DD as the result of school priming is sur-prising. Although it is marginally significant, it is in sharp contrast to previous findingsin the social psychology literature that shows activating the salience of shared socialidentity could increase cooperative behavior (Gaertner and Dovidio, 2000). Therefore,we investigate this finding in the remainder of this section. Our analysis indicates thatpriming school identity makes player 2s, especially Asian player 2s, act more com-petitively, compared to their counterparts in the control. One possible explanation, as
25
suggested by social psychology research on stereotypes, is that social identity prim-ing may make individual’s behavior conform to stereotypes (i.e., some innate statisti-cal models of characteristics or behaviors) of the social categories associated with theprimed identities (Shih et al. 1999). We thus conjecture that, while subtly activating acommon identity, the school identity priming may also introduce school specific cuesfor behavior (e.g., being competitive) that subsequently influence individual decisions.
This conjecture is formulated based on subject responses to post-experiment ques-tions on stereotypes. Subjects are asked to report, on a 1 to 7 Likert scale, their per-ceptions of the competitiveness of each ethnicity. Asian participants report 6.27 forAsians in the school priming treatment, significantly higher than the 5.4 in the con-trol (p = 0.05, one-sided Wilcoxon rank-sum test). In other words, the school iden-tity priming may have influenced the ethnic stereotype of being competitive, particu-larly among Asians. In contrast, the perception of self competitivenss for Caucasianplayer 2s does not change from control to the school priming treatment (5.2 vs. 4.9,p = 0.246, one-sided Wilcoxon rank-sum test). In the analysis below, we further ex-amine the impact of school priming on player 2’s choice of DD strategy in PD 1-4 bycontrolling for players’ competitiveness perception and allow this perception to varyin response to the school priming. Doing so enables us to isolate the impact of schoolpriming from its influence through stereotypes.
Results are reported in Table 8. We include data from the control and the schoolpriming treatment.21 The dependent variable is the likelihood of player 2s choosingthe DD strategy. In addition to the school priming dummy (the control in the omittedcategory), the ingroup matching dummy, their interaction, we also control for an indi-vidual’s competitiveness perception (SelfCompetitiveness) and its interaction with theschool treatment dummy, age, gender, special subjects, and game fixed effects. Stan-dard errors are clustered at the individual level. We summarize the analysis of schoolpriming on cooperation below.
Result 4 (School Priming on Cooperation). While school priming does not have anysignificant aggregate effect in PD 1-4, after controlling for the impact of school prim-ing on the individual competitiveness stereotype, however, we find that school primingmakes Asian player 2s significantly (weakly) less likely to choose the always-defectstrategy with an ingroup (outgroup) match.
Support. Table 6 (column 6) indicates that school priming marginally increases player2’s choice of DD (0.532, p < 0.10). Table 8 shows that after we control for individualcompetitiveness stereotype, school identity priming reduces Asian player 2’s choice ofDD (column 1) with both outgroup (-5.234, p < 0.10, marginal effect 30.6%) and in-group matches (joint effect of -5.234 and -0.803, p < 0.05, marginal effect 38.7%).22 Incontrast, neither school priming nor individual competitiveness stereotype influencesCaucasian player 2’s choice of DD (p > 0.10 for all relevant variables in column 2).
21Including data from the ethnic identity treatment does not change the results. In addition, ethnic primingdoes not affect individuals’ competitiveness perceptions.
22The marginal effect of school priming for ingroup is computed as the change in probability of Asianplayer 2’s choice of DD when the school priming variable changes from 0 to 1, and the ingroup dummyvariable takes the value of 1.
26
Table 8: Effects of School Priming on Stereotypes (PD 1-4): Probit
(1.364) (2.284)Observations 284 280Log Pseudo L. -121.3 -118.0Pseudo R2 0.27 0.08Notes:a. Game dummies and special subjects are controlled for.b. Coefficients are reported.c. Robust standard errors in parentheses are clustered at the individual level.d. Significant at: * 10-percent level; ** 5-percent level; *** 1-percent level.
27
Furthermore, the positive and significant interaction term School×SelfCompetitive(1.146, p < 0.05, marginal effect 28.2%) suggests that the school priming at the Uni-versity of Michigan triggers Asian subjects’ self perception of competitiveness, leadingto higher rate of DD by Asian player 2s in the school treatment relative to the control.
On the methodology front, our analysis demonstrates the importance of measuringstereotypes or trait perceptions of natural social groups when studying the effects ofgroup identity on economic decision making. While our study uses self stereotypesto gain insights into intergroup behavior, Tanaka and Camerer (2013) use stereotypestowards other groups to understand the lack of outgroup discrimination among theVietnamese towards the Khmers in their study.
Overall, we find that priming different natural identities can influence behaviorin coordination and cooperation settings, the extent to which priming is effective de-pends on the incentive structures. Specifically, priming a fragmenting ethnic identitysignificantly decreases efficient coordination, whereas priming a unifying school iden-tity significantly increases the choice of a rational joint-payoff-maximizing strategy,and Asians’ cooperation. Our results suggest that priming a common organizationalidentity is an effective tool to alleviate intergroup discrimination and improve overallcooperation.
4. Discussions
As the workforce becomes increasingly diverse, organizations frequently encounterthe issue of motivating individuals from different backgrounds to work together to-wards a common goal. Our paper investigates the effects of priming a fragmenting(ethnic) versus a common organization identity on coordination and cooperation amongAsian and Caucasian students in a controlled laboratory experiment.
We have several new findings. First, priming a fragmenting (ethnic) identity sig-nificantly decreases efficient coordination compared to the control. In comparison,priming a common (school) identity significantly increases the choice of a joint payoffmaximizing strategy. However, in games with a unique inefficient Nash equilibrium,the effects of priming a common identity are more complex. As priming enhances thenegative effects of the competitiveness stereotype on cooperation among Asians, weobserve a marginally significant decrease of cooperation from control to school prim-ing treatment. However, after we control for the perception of competitiveness and itsinteraction with school priming, school priming enhances cooperation for both Asianingroup and outgroup matching compared to control.
Our study sheds light on policy making for organizations facing a diverse workforce. Immigrants have become a substantial and increasingly important segment ofthe labor force in the United States and many other parts of the world. In 2012, 16percent of the workers in the United States, i.e., more than 25 million workers, wereforeign born. These foreign-born workers accounted for more than half of the growthof the U.S. labor force during the past decade. Among these foreign-born workers, 38percent come from Mexico and Central America, and 28 percent from Asia.23 Due to
23http://www.bls.gov/spotlight/2013/foreign-born/, retrieved on November 27,
the native-born baby-boomers’ exit from the labor force and the injection of immigrantworkers into the labor force, workplaces will continue to become more diverse. TheU.S. Congressional Budget Office predicts that “[u]nless native fertility rates increase,it is likely that most of the growth in the U.S. labor force will come from immigrationby the middle of the century."
Although economic assimilation of immigrants, i.e., the change in the wage gapbetween immigrant and native-born workers, has been extensively studied in laboreconomics (Borjas 1994, 1999), immigrant social assimilation has been significantlyunderstudied.24 This study underscores the importance to understand the factors thatinfluence immigrant workers’ social assimilation and the impact on their social inter-actions with others at workplaces. It also has policy implications for organizationalmanagement. For example, building employees’ common identity in an organizationmay serve as an identity-based mechanism to raise the cooperation and coordinationlevel among employees in strategic environments and, consequently, increase the over-all productivity of the organization.
It would be interesting for future research to study the impact of these policies onbehaviors of workers from other ethnic groups, and to study whether the results canbe generalized beyond ethnic lines to other “group" contexts, such as gender groupsor different professional groups. Finally, we hope to extend this study to the field, andinvestigate the extent to which organizational policy design that focuses on commonidentity building may influence cooperation and coordination among workers.
Acknowledgements: We thank Jim Andreoni, Robert Gazzale, Uri Gneezy, NancyKotzian, Jeff MacKie-Mason, Robert Sandy, Mark Wilhelm, and seminar participantsat Duisburg-Essen, IUPUI, Michigan, UCSD and the International Meetings of theEconomic Science Association (2010 Copenhagen, 2011 Chicago) for helpful dis-cussions and comments, and Brian MacKie-Mason for excellent research assistance.The financial support from the National Science Foundation through grants no. SES-0720943 and BCS-1111019 is gratefully acknowledged.
2013.24An exception is Cox and Orman (2010) who study immigrants’ trust and trustworthiness in a lab exper-
iment.
29
References
Allen, V.L., Wilder, D.A., 1975. Categorization, belief similarity, and intergroup dis-crimination. Journal of Personality and Social Psychology 32, 971–977.
Andreoni, J., Petrie, R., 2004. Public goods experiments without confidentiality: aglimpse into fund-raising. Journal of Public Economics 88 (7-8), 1605 – 1623.
Aronson, J., Quinn, D.M., Spencer, S., 1998. Stereotype threat and the academic under-performance of minorities and women. In: Swim, J.K., Stangor, C. (Eds.), Prejudice:The targets perspective, Academic Press, New York.
Ball, J.R., 1999. ‘space missions’ focus on team building. The Greater Baton RougeBusiness Report 17 (15), 31.
Bargh, J., Chen, M., Burrows, L., 1996. Automaticity of social behavior: Direct effectsof trait construct and stereotype activation on action. Journal of Personality andSocial Psychology 71, 230–244.
Bargh, J.A., 2006. What have we been priming all these years? on the development,mechanisms, and ecology of nonconscious social behavior. European Journal ofSocial Psychology 36, 147168.
Bargh, J.A., Chartrand, T.L., 1999. The unbearable automaticity of being. AmericanPsychologist 54, 462–479.
Benbow, C.P., 1995. Sex differences in mathematical reasoning ability in intellectuallytalented preadolescents: Their nature, effects, and possible causes. Behavioral andBrain Sciences 11, 169–232.
Benjamin, D.J., Choi, J.J., Strickland, A.J., 2010. Social identity and preferences.American Economic Review 100 (4), 1913–1928.
Blatt, R., Camden, C.T., 2006. Positive relationships and cultivating community. In:Dutton, J.E., Ragins, B.R. (Eds.), Exploring positive relationships at work: Buildinga theoretical and research foundation, Lawrence Erlbaum Associates, Mahwah, NJ,pp. 243–264.
Borjas, G., 1994. The economics of immigration. Journal of Economic Literature 32,1667–1717.
Borjas, G., 1999. The economic analysis of immigration. In: Ashenfelter, O., Card,D.E. (Eds.), Handbook of Labor Economics, North Holland, Amsterdam.
Brewer, M.B., 1979. Ingroup bias in the minimal intergroup situation: A cognitive-motivational analysis. Psychological Bulletin 86, 307–324.
Brewer, M.B., 1999. The psychology of prejudice: Ingroup love and outgroup hate?Journal of Social Issues 55 (3), 429–444.
30
Buchan, N.R., Brewer, M.B., Grimalda, G., Wilson, R.K., Fatas, E., Foddy, M., 2011.Global social identity and global cooperation. Psychological Science 22, 821 – 828.
Camerer, C.F., Malmendier, U., 2007. Behavioral organizational economics. In: Dia-mond, P., Vartiainen, H. (Eds.), Behavioral Economics and Its Applications, Prince-ton University Press, Princeton and Oxford.
Charness, G., Rigotti, L., Rustichini, A., 2007. Individual behavior and group mem-bership. Amer. Econ. Rev. 97, 1340 – 1352.
Chatman, J.A., Polzer, J.T., Barsade, S.G., Neale, M.A., 1998. Being different yet feel-ing similar: The influence of demographic composition and organizational cultureon work processes and outcomes. Administrative Science Quarterly 43, 741–780.
Chen, M., Bargh, J.A., 1997. Nonconscious behavioral confirmation processes: Theself-fulfilling consequences of automatic stereotype activation. Journal of Experi-mental Social Psychology 33, 541–560.
Chen, R., Chen, Y., 2011. The potential of social identity for equilibrium selection.American Economic Review 101 (6), 2562–2589.
Chen, Y., Li, S.X., 2009. Group identity and social preferences. American EconomicReview 99 (1), 431–457.
Cheryan, S., Plaut, V.C., Davies, P.G., Steele, C.M., 2009. Ambient belonging: Howstereotypical cues impact gender participation in computer science. Journal of Per-sonality and Social Psychology 97 (6), 1045–1060.
Cox, J., Orman, W., 2010. Immigrant assimilation, trust and social capital. IZA Dis-cussion Paper No. 5063.
Croizet, J.C., Claire, T., 1998. Extending the concept of stereotype threat to socialclass: The intellectual underperformance of students from low socioeconomic back-grounds. Personality and Social Psychology Bulletin 24, 588–594.
Crosby, F., Bromley, S., Saxe, L., 1980. Recent unobtrusive studies of black and whitediscrimination and prejudice: a literature review. Psychological Bulletin 87, 546–563.
Croson, R.T.A., Marks, M.B., Snyder, J., 2008. Groups work for women: Gender andgroup identity in the provision of public goods. Negotiation Journal 24 (4), 411–427.
Cunningham, G.B., 2005. The importance of a common in-group identity in ethnicallydiverse groups. Group Dynamics: Theory, Research and Practice 9, 251–260.
Deaux, K., 1996. Social identification. In: Higgins, E.T., Kruglanski, A.W. (Eds.),Social Psychology: Handbook of Basic Principles, The Guilford Press, New York.
Dovidio, J.F., Gaertner, S.L., Saguy, T., 1980. Commonality an the complexity of we:Social attitudes and social change. Personality and Social Psychology Review 13,3–20.
31
Eckel, C.C., Grossman, P.J., 2005. Managing diversity by creating team identity. Jour-nal of Economic Behavior & Organization 58 (3), 371–392.
Fatas, E., Morales, A.J., 2013. Step thinking and costly coordination. Eco-nomics Letters 120 (2), 181 – 183. URL http://www.sciencedirect.com/science/article/pii/S0165176513001419.
Fehr, E., Gaechter, S., 2000. Cooperation and punishment in public goods experiments.American Economic Review 90, 980–994.
Fershtman, C., Gneezy, U., 2001. Discrimination in a segmented society: An experi-mental approach. Quarterly Journal of Economics 116 (1), 351–377.
Figuières, C., Masclet, D., Willinger, M., 2012. Vanishing leadership and de-clining reciprocity in a sequential contribution experiment. Economic Inquiry50 (3), 567–584. URL http://dx.doi.org/10.1111/j.1465-7295.2011.00415.x.
Friesen, J., Arifovic, J., Wright, S.C., Ludwig, A., Giamo, L., Baray, G., 2012. Eth-nic identity and discrimination among children. Journal of Economic Psychology33 (6), 1156 – 1169. URL http://www.sciencedirect.com/science/article/pii/S016748701200089X.
Gaertner, S.L., Dovidio, J.F., 2000. Reducing intergroup bias: The common ingroupidentity model. The Psychology Press, Philadelphia, P.A.
Goeree, J.K., Holt, C.A., 2005. An experimental study of costly coordination. Gamesand Economic Behavior 51 (2), 349 – 364. Special Issue in Honor of Richard D.McKelvey.
Goette, L., Huffman, D., Meier, S., 2006. The impact of group membership on co-operation and norm enforcement: Evidence using random assignment to real socialgroups. Amer. Econ. Rev. 96 (2), 212–216.
Gruenfeld, D.H., Mannix, E.A., Williams, K.Y., Neale, M.A., 1996. Group compo-sition and decision making: How member familiarity and information distributionaffect process and performance. Organizational Behavior and Human Decision Pro-cesses 67, 1–15.
Hargreaves Heap, S.P., Zizzo, D.J., 2009. The value of groups. American EconomicReview 99, 295–323.
Healy, P.J., 2007. Group reputations, stereotypes, and cooperation in a repeated labormarket. Amer. Econ. Rev. .
Hedges, L.V., Nowell, A., 1995. Sex differences in mental test scores, variability, andnumbers of high-scoring individuals. Science 269, 41–45.
Hewstone, M., 1996. Contact and categorization: Social psychological interventionsto change intergroup relations. In: Macrae, N., Stangor, C., Hewstone, M. (Eds.),Stereotypes and stereotyping, Guilford Press, New York, p. 323368.
Hong, L., Page, S.E., 2001. Problem solving by heterogeneous agents. Journal ofEconomic Theory 97, 123–163.
Monderer, D., Shapley, L.S., 1996. Potential games. Games and Economic Behavior14, 124–143.
Nemeth, C.J., 1986. The differential contributions of majority and minority influence.Psychological Review 93, 23–32.
Pelled, L.H., Eisenhardt, K.M., Xin, K.R., 1999. Exploring the black box: An analysisof work group diversity, conflict and performance. Administrative Science Quarterly44, 1–28.
Perdue, C.W., Dovidio, J.F., Gurtman, M.B., Tyler, R.B., 1990. Us and them: Socialcategorization and the process of ingroup bias. Journal of Personality and SocialPsychology 59, 475–486.
Shih, M., Pittinsky, T.L., Ambady, N., 1999. Stereotype susceptibility: Identitysalience and shifts in quantitative performance. Psychological Science 10 (1), 81–84.
Shih, M., Pittinsky, T.L., Trahan, A., 2006. Domain-specific effects of stereotypes onperformance. Self and Identity 5, 1–14.
Simpson, B., 2006. Social identity and cooperation in social dilemmas. Rationalityand Society 18 (4), 443–470.
Spencer, S., Steele, C.M., Quinn, D.M., 1999. Stereotype threat and women’s mathperformance. Journal of Experimental Social Psychology 35, 4–28.
Steele, C.M., Aronson, J., 1995. Stereotype threat and the intellectual test performanceof african-americans. Journal of Personality and Social Psychology 69, 797–811.
Steen, L.A., 1987. Mathematics education: A predictor of scientific competitiveness.Science 237, 251–253.
Tajfel, H., Turner, J., 1979. An integrative theory of intergroup conflict. In: Worchel,S., Austin, W. (Eds.), The Social Psychology of Intergroup Relations, Brooks/Cole,Monterey, CA.
Tanaka, T., Camerer, C.F., 2013. Trait perceptions influence economic out-group bias:Lab and field evidence from vietnam. Manuscript.
Tushman, M.L., 1977. Special boundary roles in the innovation process. Administra-tive Science Quarterly 22, 587–605.
33
Van Der Zee, K., Paulus, P., 2008. Social psychology and modern organizations: Bal-ancing between innovativeness and comfort. In: Steg, L., Buunk, A.P., Rothengatter,T. (Eds.), Applied social psychology: Understanding and managing social problems,Cambridge University Press, New York, p. 271290.
Wilder, D.A., 1986. Social categorization: Implications for creation and reduction ofintergroup bias. In: Berkowitz, L. (Ed.), Advances in experimental social psychol-ogy, vol. 19, Academic Press, New York, p. 291355.
Yamagishi, T., Kiyonari, T., 2000. The group as the container of generalized reci-procity. Social Psychology Quarterly 63 (2), 116–132.
34
Appendix A: Pre-experiment Questionnaire
A.1 Control sessions
We are interested in your opinions and experiences about certain aspects of youngadult life.
1. Name:2. Age: (Mean 23.3, Std Dev 4.3, Median 22, Min 19, Max
4. How often do you watch television?(a) every day (17.5%)(b) 4− 5 times a week (22.5%)(c) 2− 3 times a week (22.5%)(d) a few times a month (25%)(e) a few times a year (5%)(f) rarely if ever (5%)(g) Never (2.5%)
5. Do you have cable television?(a) yes (70%)(b) no (30%)
6. How often do you eat out?(a) every day (7.5%)(b) 4− 5 times a week (12.5%)(c) 2− 3 times a week (27.5%)(d) a few times a month (42.5%)(e) a few times a year (7.5%)(f) rarely if ever (0%)(g) Never (2.5%)
7. How often do you attend movies?(a) every day (0%)(b) 4− 5 times a week (0%)(c) 2− 3 times a week (2.5%)(d) a few times a month (32.5%)(e) a few times a year (52.5%)(f) rarely if ever (7.5%)(g) Never (5%)
35
A.2 Ethnic Priming TreatmentWe are interested in your opinions and experiences about certain aspects of young
adult life.
1. Name:2. Age: (Mean 23.8, Std Dev 4.6, Median 22, Min 18, Max
4. Ethnicity:(a) African(b) Asian (48.7%)(c) European (51.3%)(d) Hispanic(e) Native(f) other
if it is other, please specify:
5. How many generations has your family lived in America?(a) First Generation (48.7%)(b) Second Generation (35.9%)(c) More than Two Generations (15.4%)
6. From which countries did you family originate?7. What languages do you speak?8. Are you involved in any student organizations?
(a) yes (46.2%)(b) no (53.9%)
If yes, which ones?
A.3 School Priming TreatmentWe are interested in your opinions and experiences about certain aspects of young
adult life.
1. Name:2. Age: (Mean 22.2, Std Dev 3.0, Median 21, Min 18, Max
(d) Senior (35.1%)(e) > 4 years (0%)(f) Graduate student (35.1%)
4. School:5. Did you consider any other schools?
(a) yes (62.2%)(b) no (37.8%)
If yes, what other schools?
6. Why did you decide to choose your specific school?
37
Appendix B: Experimental Instructions and Screen Shots
B1. Experimental InstructionsThis is an experiment in decision making. You will be asked to fill out a survey at
the beginning of the experiment. You will then make a series of decisions, and fill outanother survey at the end of the experiment.
The amount of money you earn will depend upon the decisions you make and on thedecisions other people make. In addition, you will be paid $5 for participation. Every-one will be paid in private and you are under no obligation to tell others how much youearned.
Please do not communicate with each other during the experiment. If you have a ques-tion, feel free to raise your hand, and an experimenter will come to help you.
Roles: This experiment has 8 participants, four of whom are player As and the otherfour are player Bs. Your assigned role will be the same for all the games. Therefore, ifyou are a player A, you will always be a player A. Similarly, if you are a player B, youwill always be a player B.
Matching: In each of the four rounds, a player A will be matched with a player B. Youwill never be matched with the same player twice.
Procedure: In each of the four rounds, both players A and B will make decisionson each of five games. The outcome of each game depends on the decisions of bothplayers.
For instance, in the Example for Review Questions on the next page, player A movesfirst, by choosing A1 or A2. After A makes a decision, A will be asked to guess whatB will choose.
Without knowing A’s decision, player B will be asked to first guess what player Ahas chosen. Then player B decides whether to choose B1 or B2 under each of twoscenarios: (1) Player A chooses A1; (2) Player A chooses A2.
Payoff for each game is determined by both players’ decisions. For example, if playerA chooses A1, and player B’s decision is B2 if A chooses A1, and B1 if A chooses A2,the outcome of the game is (A1, B2), with payoffs 40 for A and 30 for B. Note that allof A’s decisions and payoffs are in red, while B’s are in blue.
In addition, a player earns 2 points for each correct guess. For example, if playerA’s guess is that B will choose B2. If it turns out to be correct, A will get 2 points.Otherwise, A will get zero point.
Feedback: You will not get any feedback after each game. At the very end of theexperiment, you will be shown a history screen, with your decisions, your match’sdecisions, the accuracy of your guesses, and your payoff for each of the twenty games.
Total Payoffs: In each of the four rounds, your payoff will be the sum of your payoffsin all five games. Your total payoff will be the sum of your payoffs in all four rounds,i.e., in all 20 games. Your earnings are given in points. At the end of the experimentyou will be paid based on the following exchange rate:
38
$1 = 8 points.
In addition, you will be paid $5 for participation, and 25 cents for answering eachof the review questions correctly.
Review Questions: To help you understand the game, we will go over a number ofreview questions about the following made-up example. Each correct question is worth2 points.
Player A A1 A2
Player B Player B B1 B2 B1 B2
10 20
Player A’s payoff
Player B’s payoff
40 30
50 60
80 70
Example for Review Questions
1. If Player A chooses A1, and player B chooses B1 when A chooses A1,A’s payoff is , and B’s payoff is .
2. If Player A chooses A1, and player B chooses B2 when A chooses A1,A’s payoff is , and B’s payoff is .
3. If Player A chooses A2, and player B chooses B1 when A chooses A2,A’s payoff is , and B’s payoff is .
4. If Player A chooses A2, and player B chooses B2 when A chooses A2,A’s payoff is , and B’s payoff is .
5. Player B guessed that Player A had chosen A1.If Player A actually chooses A1, Player B’s payoff from her guess ispoints.If Player A actually chooses A2, Player B’s payoff from her guess ispoints.
6. True or False: you are always matched with the same player throughout theExperiment.
(a) True(b) False
39
Please raise your hand if you are finished with the review questions. An experimenterwill come over and grade it. Please check that you have written down your name andID number on the first page.
B2. Screen ShotsThis section contains screen shots from the z-Tree program, including player 1’s
decision screen (Figure 5) and belief elicitation screen (Figure 6), as well as player 2’sdecision screen (Figure 8) and belief elicitation screen (Figure 7). They are followedby the priming pictures in the control (Figure 9), ethnic (Figure 10) and school primingtreatments (Figure 11), respectively.
Figure 11: Priming Pictures: School Priming Treatment
44
Appendix C: Post-experiment Questionnaire
1. Please write five statements in answer to the question: “Who am I?"2. Gender
(a) Male (43.1%)(b) Female (56.9%)
3. Ethnicity:(a) African (0.9%)(b) Asian (48.3%)(c) European (48.3%)(d) Hispanic (0%)(e) Native (1.7%)(f) other (0.9%)
if it is other, please specify:
4. From which countries did you family originate?5. What do you think is the experiment about?6. How common do you think these stereotypes are in society?
(a) Asian Americans are strategic (Mean 5.1, Std Dev 1.4, Median 5, Min 1,Max 7)
(b) Asian Americans are trustworthy (Mean 4.0, Std Dev 1.4, Median 4, Min1, Max 7)
(c) Asian Americans are cooperative (Mean 4.3, Std Dev 1.7, Median 4, Min1, Max 7)
(d) Asian Americans are naive (Mean 3.5, Std Dev 1.6, Median 3, Min 1, Max7)
(e) Asian Americans are sneaky (Mean 3.8, Std Dev 1.5, Median 4, Min 1, Max7)
(f) Asian Americans are competitive (Mean 5.9, Std Dev 1.4, Median 6, Min1, Max 7)
(g) European Americans are strategic (Mean 4.0, Std Dev 1.8, Median 4, Min1, Max 7)
(h) European Americans are trustworthy (Mean 4.2, Std Dev 1.6, Median 4,Min 1, Max 7)
(i) European Americans are cooperative (Mean 4.3, Std Dev 1.5, Median 4,Min 1, Max 7)
(j) European Americans are naive (Mean 3.4, Std Dev 1.6, Median 3.5, Min 1,Max 7)
(k) European Americans are sneaky (Mean 3.4, Std Dev 1.5, Median 4, Min 1,Max 7)
(l) European Americans are competitive (Mean 4.8, Std Dev 1.3, Median 5,Min 1, Max 7)
7. Generally speaking, would you say that people can be trusted or that you can’tbe too careful in dealing with people?
(a) Always trusted (3.5%)(b) Usually trusted (69.8%)
45
(c) Usually not trusted (24.1%)(d) Always not trusted (2.6%)
8. How many siblings do you have:( Mean 1.3, Std Dev 1.3, Median 1, Min 0, Max 7)
9. How trusting are you?(a) Always trusting (16.4%)(b) Usually trusting (66.4%)(c) Usually not trusting (16.4%)(d) Always not trusting (0.9%)
10. There should be diversity programs to level the playing field for people fromminority groups
(a) Agree (73.3%)(b) Disagree (26.7%)
11. We should not allow special treatment based on race or gender. Merit should bethe sole criteria
(a) Agree (67.2%)(b) Disagree (32.8%)
12. Please write down the *Last *Name of your ten friends:13. How strong is your University of Michigan school spirit? (Mean 5.3, Std Dev
1.8, Median 6, Min 1, Max 7)14. During the experiment, how much did you pay attention to who your partner
was? (Mean 3.0, Std Dev 2.0, Median 2, Min 1, Max 7)15. During the experiment, I tried to maximize my own payoffs. (Mean 5.7, Std Dev
1.7, Median 6, Min 1, Max 7)16. During the experiment, I tried to maximize joint payoffs. (Mean 3.7, Std Dev
1.9, Median 4, Min 1, Max 7)17. For player As, during the experiment, if I chose A1 (the more generous option),
I hoped player B would see it as a sign of trust and reciprocate.(a) Agree (56.7%)(b) Disagree (20.0%)(c) Not applicable as I never chose A1(23.3%)
18. For player Bs, during the experiment, if player A chose A1 (the more generousoption), I felt I needed to reciprocate
(a) Agree (38.3%)(b) Disagree (53.3%)(c) Not applicable as A never chose A1 (8.3%)
19. Do you know any participants in today’s experiment(a) Yes (69.0%)(b) No (31.0%)
20. If so, please write down their last name:
21. What do you think is the ethnicity of the person with this name?(a) Chen
i. Asianii. European
iii. Otherif it is other, please specify:
iv. I don’t know( overall accuracy 91%; ingroup 85%; outgroup 97%.)
46
Appendix D: Additional Tables
In this appendix, we present the outcome distribution in each of the ME (PD) gamesfor different matches, including Asian-Asian (AA), Caucasian-Asian (CA), Caucasian-Caucasian (CC) and Asian-Caucasian (AC) matches. Additionally, 7 of out 60 playersB report their ethnicity as “other" in the ME games, so we have two more match cate-gories including Asian-Other (AO) and Caucasian-Other (CO) matches.
Table 9: Outcome Distribution in the Minimum-Effort Games: AA Match
ME 4 Control Ethnic SchoolHH LL HL LH HH LL HL LH HH LL HL LH
H 0 5 91 0 H 0 0 90 0 H 0 0 89 0L 0 0 5 0 L 0 0 10 0 L 0 0 11 0
ME 5 Control Ethnic SchoolHH LL HL LH HH LL HL LH HH LL HL LH
H 0 14 86 0 H 0 0 65 0 H 0 0 84 0L 0 0 0 0 L 0 0 35 0 L 0 0 16 0
ME 6 Control Ethnic SchoolHH LL HL LH HH LL HL LH HH LL HL LH
H 0 5 82 5 H 0 0 70 0 H 0 0 95 0L 0 5 5 0 L 0 0 30 0 L 0 0 5 0
ME 7 Control Ethnic SchoolHH LL HL LH HH LL HL LH HH LL HL LH
H 0 5 82 0 H 0 0 80 0 H 0 0 8 0L 0 5 9 0 L 0 0 20 0 L 0 0 16 0
ME 8 Control Ethnic SchoolHH LL HL LH HH LL HL LH HH LL HL LH
H 0 5 77 0 H 0 0 70 0 H 0 0 68 0L 0 5 14 0 L 0 0 30 0 L 0 0 32 0
Mean Control Ethnic SchoolHH LL HL LH HH LL HL LH HH LL HL LH
H 0 6 84 1 H 0 0 75 0 H 0 0 84 0L 0 3 6 0 L 0 0 25 0 L 0 0 16 0
Notes: The mode of distribution is boldfaced. The number of players is n1 = 30, n2 = 30.
47
Table 10: Outcome Distribution in the Minimum-Effort Games: CA Match
ME 4 Control Ethnic SchoolHH LL HL LH HH LL HL LH HH LL HL LH
H 0 0 100 0 H 0 0 95 0 H 0 0 100 0L 0 0 0 0 L 0 0 5 0 L 0 0 0 0
ME 5 Control Ethnic SchoolHH LL HL LH HH LL HL LH HH LL HL LH
H 0 6 89 0 H 0 0 74 0 H 0 0 100 0L 0 0 6 0 L 0 0 26 0 L 0 0 0 0
ME 6 Control Ethnic SchoolHH LL HL LH HH LL HL LH HH LL HL LH
H 0 6 83 0 H 0 0 79 0 H 0 0 95 0L 0 0 11 0 L 0 0 21 0 L 0 0 5 0
ME 7 Control Ethnic SchoolHH LL HL LH HH LL HL LH HH LL HL LH
H 0 0 72 6 H 0 0 74 0 H 0 0 95 0L 0 0 22 0 L 0 0 26 0 L 0 0 5 0
ME 8 Control Ethnic SchoolHH LL HL LH HH LL HL LH HH LL HL LH
H 0 6 67 0 H 0 0 68 0 H 0 5 85 0L 0 0 28 0 L 0 0 32 0 L 0 0 10 0
Mean Control Ethnic SchoolHH LL HL LH HH LL HL LH HH LL HL LH
H 0 3 82 1 H 0 0 78 0 H 0 1 95 0L 0 0 13 0 L 0 0 22 0 L 0 0 4 0
Notes: The mode of distribution is boldfaced. The number of players is n1 = 30, n2 = 30.
48
Table 11: Outcome Distribution in the Minimum-Effort Games: CC Match
ME 4 Control Ethnic SchoolHH LL HL LH HH LL HL LH HH LL HL LH
H 0 0 100 0 H 0 0 86 0 H 0 0 83 0L 0 0 0 0 L 0 0 14 0 L 0 0 17 0
ME 5 Control Ethnic SchoolHH LL HL LH HH LL HL LH HH LL HL LH
H 0 0 100 0 H 0 0 71 0 H 0 0 100 0L 0 0 0 0 L 0 0 29 0 L 0 0 0 0
ME 6 Control Ethnic SchoolHH LL HL LH HH LL HL LH HH LL HL LH
H 0 0 93 0 H 0 0 79 0 H 0 0 83 0L 0 0 7 0 L 0 0 21 0 L 0 0 17 0
ME 7 Control Ethnic SchoolHH LL HL LH HH LL HL LH HH LL HL LH
H 0 0 86 0 H 0 0 57 0 H 0 0 92 0L 0 0 14 0 L 0 0 43 0 L 0 0 8 0
ME 8 Control Ethnic SchoolHH LL HL LH HH LL HL LH HH LL HL LH
H 0 0 86 0 H 0 0 64 0 H 0 0 92 0L 0 0 14 0 L 0 0 36 0 L 0 0 8 0
Mean Control Ethnic SchoolHH LL HL LH HH LL HL LH HH LL HL LH
H 0 0 93 0 H 0 0 71 0 H 0 0 90 0L 0 0 7 0 L 0 0 29 0 L 0 0 10 0
Notes: The mode of distribution is boldfaced. The number of players is n1 = 21, n2 = 21.
49
Table 12: Outcome Distribution in the Minimum-Effort Games: AC Match
ME 4 Control Ethnic SchoolHH LL HL LH HH LL HL LH HH LL HL LH
H 0 0 95 0 H 0 0 93 0 H 0 0 100 0L 0 0 5 0 L 0 0 7 0 L 0 0 0 0
ME 5 Control Ethnic SchoolHH LL HL LH HH LL HL LH HH LL HL LH
H 0 0 100 0 H 0 0 100 0 H 0 0 86 0L 0 0 0 0 L 0 0 0 0 L 0 0 14 0
ME 6 Control Ethnic SchoolHH LL HL LH HH LL HL LH HH LL HL LH
H 0 0 90 0 H 0 0 64 0 H 0 0 86 0L 0 0 10 0 L 0 0 36 0 L 0 0 14 0
ME 7 Control Ethnic SchoolHH LL HL LH HH LL HL LH HH LL HL LH
H 0 0 90 0 H 0 0 64 0 H 7 0 86 0L 0 0 10 0 L 0 0 36 0 L 0 0 7 0
ME 8 Control Ethnic SchoolHH LL HL LH HH LL HL LH HH LL HL LH
H 0 0 90 0 H 0 0 79 0 H 0 0 79 0L 0 0 10 0 L 0 0 21 0 L 0 0 21 0
Mean Control Ethnic SchoolHH LL HL LH HH LL HL LH HH LL HL LH
H 0 0 93 0 H 0 0 80 0 H 1 0 87 0L 0 0 7 0 L 0 0 20 0 L 0 0 11 0
Notes: The mode of distribution is boldfaced. The number of players is n1 = 23, n2 = 23.
50
Table 13: Outcome Distribution in the Minimum-Effort Games: AO Match
ME 4 Control Ethnic SchoolHH LL HL LH HH LL HL LH HH LL HL LH
H 0 0 50 0 H 0 0 100 0 H 0 0 100 0L 0 0 50 0 L 0 0 0 0 L 0 0 0 0
ME 5 Control Ethnic SchoolHH LL HL LH HH LL HL LH HH LL HL LH
H 0 0 50 0 H 0 0 100 0 H 0 0 33 0L 0 0 50 0 L 0 0 0 0 L 0 0 67 0
ME 6 Control Ethnic SchoolHH LL HL LH HH LL HL LH HH LL HL LH
H 0 0 50 0 H 0 0 83 0 H 0 0 67 0L 0 0 50 0 L 0 0 17 0 L 0 0 33 0
ME 7 Control Ethnic SchoolHH LL HL LH HH LL HL LH HH LL HL LH
H 0 0 50 0 H 0 0 100 0 H 0 0 67 0L 0 0 50 0 L 0 0 0 0 L 0 0 33 0
ME 8 Control Ethnic SchoolHH LL HL LH HH LL HL LH HH LL HL LH
H 0 0 50 0 H 0 0 100 0 H 0 0 50 0L 0 0 50 0 L 0 0 0 0 L 0 0 50 0
Mean Control Ethnic SchoolHH LL HL LH HH LL HL LH HH LL HL LH
H 0 0 50 0 H 0 0 97 0 H 0 0 63 0L 0 0 50 0 L 0 0 3 0 L 0 0 37 0
Notes: The mode of distribution is boldfaced. The number of players is n1 = 7, n2 = 7.
51
Table 14: Outcome Distribution in the Minimum-Effort Games: CO Match
ME 4 Control Ethnic SchoolHH LL HL LH HH LL HL LH HH LL HL LH
H 0 0 50 0 H 0 0 83 0 H 0 0 80 0L 0 0 50 0 L 0 0 17 0 L 0 0 20 0
ME 5 Control Ethnic SchoolHH LL HL LH HH LL HL LH HH LL HL LH
H 0 0 100 0 H 0 0 67 0 H 0 0 80 0L 0 0 0 0 L 0 0 33 0 L 0 0 20 0
ME 6 Control Ethnic SchoolHH LL HL LH HH LL HL LH HH LL HL LH
H 0 0 50 0 H 0 0 83 0 H 0 0 80 0L 0 0 50 0 L 0 0 17 0 L 0 0 20 0
ME 7 Control Ethnic SchoolHH LL HL LH HH LL HL LH HH LL HL LH
H 0 0 100 0 H 0 0 67 0 H 0 0 80 0L 0 0 0 0 L 0 0 33 0 L 0 0 20 0
ME 8 Control Ethnic SchoolHH LL HL LH HH LL HL LH HH LL HL LH
H 0 0 50 0 H 0 0 83 0 H 0 0 80 0L 0 0 50 0 L 0 0 17 0 L 0 0 20 0
Mean Control Ethnic SchoolHH LL HL LH HH LL HL LH HH LL HL LH
H 0 0 70 0 H 0 0 77 0 H 0 0 80 0L 0 0 30 0 L 0 0 23 0 L 0 0 20 0
Notes: The mode of distribution is boldfaced. The number of players is n1 = 7, n2 = 7.
52
Table 15: Outcome Distribution in the Prisoner’s Dilemma Games: AA Match
PD 0 Control Ethnic SchoolCC DD CD DC CC DD CD DC CC DD CD DC
C 6 24 6 18 C 0 18 5 18 C 0 5 0 27D 0 18 6 24 D 0 9 23 27 D 5 14 0 50
PD 1 Control Ethnic SchoolCC DD CD DC CC DD CD DC CC DD CD DC
C 0 24 0 0 C 0 27 18 0 C 0 14 0 0D 12 41 6 18 D 5 32 9 9 D 14 68 5 0
PD 2 Control Ethnic SchoolCC DD CD DC CC DD CD DC CC DD CD DC
C 6 29 0 0 C 0 27 5 0 C 0 27 0 0D 0 47 12 6 D 5 45 18 0 D 5 59 9 0
PD 3 Control Ethnic SchoolCC DD CD DC CC DD CD DC CC DD CD DC
C 0 24 6 0 C 0 36 9 0 C 5 18 9 0D 18 35 18 0 D 5 32 18 0 D 5 59 5 0
PD 4 Control Ethnic SchoolCC DD CD DC CC DD CD DC CC DD CD DC
C 0 24 6 0 C 5 27 0 0 C 0 9 5 0D 12 47 12 0 D 5 41 23 0 D 0 77 9 0
Mean Control Ethnic SchoolCC DD CD DC CC DD CD DC CC DD CD DC
C 2 25 4 4 C 1 27 7 4 C 1 15 3 5D 8 38 11 9 D 4 32 18 7 D 5 55 5 10
Notes: The mode of distribution is boldfaced. The number of players is n1 = 31, n2 = 31.
53
Table 16: Outcome Distribution in the Prisoner’s Dilemma Games: CA Match
PD 0 Control Ethnic SchoolCC DD CD DC CC DD CD DC CC DD CD DC
C 0 21 0 5 C 0 5 10 19 C 0 0 0 19D 21 21 11 21 D 10 29 5 24 D 0 19 5 57
PD 1 Control Ethnic SchoolCC DD CD DC CC DD CD DC CC DD CD DC
C 5 21 0 5 C 5 43 5 5 C 0 19 0 0D 11 32 11 16 D 10 33 0 0 D 10 71 0 0
PD 2 Control Ethnic SchoolCC DD CD DC CC DD CD DC CC DD CD DC
C 5 16 0 0 C 0 14 5 0 C 0 19 0 0D 0 53 26 0 D 0 57 19 5 D 0 71 10 0
PD 3 Control Ethnic SchoolCC DD CD DC CC DD CD DC CC DD CD DC
C 0 16 0 5 C 0 24 5 0 C 0 14 0 0D 0 32 42 5 D 0 57 14 0 D 0 76 10 0
PD 4 Control Ethnic SchoolCC DD CD DC CC DD CD DC CC DD CD DC
C 0 11 0 0 C 0 24 14 0 C 0 24 0 0D 5 53 32 0 D 0 52 10 0 D 5 67 5 0
Mean Control Ethnic SchoolCC DD CD DC CC DD CD DC CC DD CD DC
C 2 17 0 3 C 1 22 8 5 C 0 15 0 4D 7 38 24 8 D 4 46 10 6 D 3 61 6 11
Notes: The mode of distribution is boldfaced. The number of players is n1 = 32, n2 = 32.
54
Table 17: Outcome Distribution in the Prisoner’s Dilemma Games: CC Match
PD 0 Control Ethnic SchoolCC DD CD DC CC DD CD DC CC DD CD DC
C 0 8 0 15 C 0 23 0 31 C 0 10 10 40D 0 23 0 54 D 0 23 0 23 D 0 10 0 30
PD 1 Control Ethnic SchoolCC DD CD DC CC DD CD DC CC DD CD DC
C 0 31 0 8 C 0 46 0 8 C 0 20 0 10D 0 62 0 0 D 0 46 0 0 D 0 60 10 0
PD 2 Control Ethnic SchoolCC DD CD DC CC DD CD DC CC DD CD DC
C 0 31 0 0 C 0 31 0 0 C 0 20 0 0D 0 62 8 0 D 0 54 15 0 D 0 70 0 10
PD 3 Control Ethnic SchoolCC DD CD DC CC DD CD DC CC DD CD DC
C 0 23 8 0 C 0 38 8 0 C 0 50 0 0D 0 54 15 0 D 0 54 0 0 D 10 40 0 0
PD 4 Control Ethnic SchoolCC DD CD DC CC DD CD DC CC DD CD DC
C 0 31 0 0 C 0 23 0 0 C 0 30 0 0D 0 62 8 0 D 0 77 0 0 D 0 70 0 0
Mean Control Ethnic SchoolCC DD CD DC CC DD CD DC CC DD CD DC
C 0 25 2 5 C 0 32 2 8 C 0 26 2 10D 0 52 6 11 D 0 51 3 5 D 2 50 2 8
Notes: The mode of distribution is boldfaced. The number of players is n1 = 24, n2 = 24.
55
Table 18: Outcome Distribution in the Prisoner’s Dilemma Games: AC Match
PD 0 Control Ethnic SchoolCC DD CD DC CC DD CD DC CC DD CD DC
C 4 12 0 23 C 0 0 0 14 C 0 5 0 24D 4 19 0 38 D 0 23 5 59 D 0 24 0 48
PD 1 Control Ethnic SchoolCC DD CD DC CC DD CD DC CC DD CD DC
C 4 15 0 0 C 0 41 0 0 C 0 14 0 5D 0 62 4 15 D 0 59 0 0 D 5 67 0 10
PD 2 Control Ethnic SchoolCC DD CD DC CC DD CD DC CC DD CD DC
C 0 15 4 0 C 0 27 5 0 C 0 29 0 0D 0 58 23 0 D 0 59 5 5 D 0 62 5 5
PD 3 Control Ethnic SchoolCC DD CD DC CC DD CD DC CC DD CD DC
C 0 12 4 0 C 0 18 0 0 C 0 14 5 0D 0 69 15 0 D 0 77 5 0 D 0 62 19 0
PD 4 Control Ethnic SchoolCC DD CD DC CC DD CD DC CC DD CD DC
C 0 8 12 0 C 0 27 0 0 C 0 19 5 0D 0 65 15 0 D 0 64 9 0 D 0 71 5 0
Mean Control Ethnic SchoolCC DD CD DC CC DD CD DC CC DD CD DC
C 2 12 4 5 C 0 23 1 3 C 0 16 2 6D 1 55 12 11 D 0 56 5 13 D 1 57 6 12
Notes: The mode of distribution is boldfaced. The number of players is n1 = 28, n2 = 28.