Wind Power Plant Transmission System Modelling for Harmonic Propagation and Small-signal Stability Analysis Łukasz Hubert Kocewiak 1 Electrical Systems DONG Energy Wind Power A/S Gentofte, Denmark 1 Bjørn Gustavsen 2 , Andrzej Hołdyk 2 Energy Systems SINTEF Energy Research Trondheim, Norway 2 Abstract— This paper presents the impact of wind power plant components modelling on harmonics propagation and harmonic small-signal stability studies. It is shown that the use of detailed cable and transformer models increases the overall damping estimation in the system, and therefore improves the resonance characteristics and small-signal stability margins of the investigated wind power plant. Different types of cable and transformer modelling techniques are taken into consideration, e.g. state-of-the-art standard models and latest academic development. The models are compared based on system-level studies in a real-life large offshore wind power plant. Keywords: harmonic propagation; harmonic stability; resonance damping; offshore wind power plant; power cable; power transformer I. INTRODUCTION A. General Large offshore wind power plants (WPPs) typically consist of wind turbines (WTs), medium voltage (MV) array network cables, grid transformers (GTs) placed at offshore substations, transmission high voltage alternating current (HVAC) cables from GT to shore, super grid transformers (SGTs) on shore, static synchronous compensators (STATCOMs), shunt compensators, and harmonic filters (HFs). Harmonic emission is inherent to power electronic devices in modern WPPs [1]. Even though the power electronic converters offer more efficiency and controllability, they may excite parallel and series resonances in the power system. They may also interact with each other or with passive network elements, and this might lead to instability and excessive harmonic distortion levels [2]. Therefore, the operation of the WPP with respect to stability and power quality must be verified for different situations in the design phase using harmonic analysis methods. The offshore AC electrical infrastructure in WPPs as connected via a HVAC transmission cable is a sensitive network in terms of resonances because of its low damping which is caused by the design being focused on low transmission losses. The use of long array and transmission cables results in large capacitances which together with the reactances of transformers and reactors creates resonances at low frequencies, where converters have significant emission levels. The combination of a complex configuration and low active power dissipation (due to low resistance to reduce active power losses) creates challenges in terms of harmonic performance, Grid Code compliance, and power transmission, and stability of grid-tied converters. The presence of undamped resonances means that whenever an oscillation appears in the system (e.g. due to non-linear components such as transformers and power electronic converters) it takes long time for it to be damped out. The problem becomes even more severe when the system is unloaded, e.g. during energization, when some WTs are out of service, and when the cable network is unloaded. When the system is loaded (active power is transmitted), the overall damping is higher and the harmonics are reduced faster than in an unloaded scenario. In addition, the resonance frequencies can shift due to changes in the system topology. Such topology changes typically occur due to variations in the number of connected WTs, transformer or transmission cable disconnection, interlink operation, etc. The variation in damping and the shift in resonance frequencies makes it challenging to introduce robust harmonic resonance mitigation measures. Typically, one can recognize two ways of mitigating unwanted harmonics in modern power systems, (i) passive filtering, (ii) active filtering (AF) by grid-tied converters. Variation of resonance frequencies caused by topology changes requires large passive filters (e.g. damped high-pass HFs such as C-type) which are not feasible, in many cases, to be installed offshore. Therefore, for optimization of offshore electrical infrastructure in WPPs, the use of AF (or a combination of active and passive filters) seems to be a solution that is more appropriate. It follows that appropriate and trustful modelling is critical in order to more precisely address uncertainties and electrical infrastructure optimization during the WPP design. Overall system damping estimation by means of harmonic losses (i.e. system frequency-dependent equivalent resistance) is important. Harmonic losses underestimation
Transcript
Wind Power Plant Transmission System Modelling for Harmonic Propagation
and Small-signal Stability Analysis
Łukasz Hubert Kocewiak1 Electrical Systems
DONG Energy Wind Power A/S Gentofte, Denmark1
Bjørn Gustavsen2, Andrzej Hołdyk2 Energy Systems
SINTEF Energy Research Trondheim, Norway2
Abstract— This paper presents the impact of wind power plant components modelling on harmonics propagation and harmonic small-signal stability studies. It is shown that the use of detailed cable and transformer models increases the overall damping estimation in the system, and therefore improves the resonance characteristics and small-signal stability margins of the investigated wind power plant. Different types of cable and transformer modelling techniques are taken into consideration, e.g. state-of-the-art standard models and latest academic development. The models are compared based on system-level studies in a real-life large offshore wind power plant.
Keywords: harmonic propagation; harmonic stability; resonance damping; offshore wind power plant; power cable; power transformer
I. INTRODUCTION
A. General
Large offshore wind power plants (WPPs) typically consist of wind turbines (WTs), medium voltage (MV) array network cables, grid transformers (GTs) placed at offshore substations, transmission high voltage alternating current (HVAC) cables from GT to shore, super grid transformers (SGTs) on shore, static synchronous compensators (STATCOMs), shunt compensators, and harmonic filters (HFs).
Harmonic emission is inherent to power electronic devices in modern WPPs [1]. Even though the power electronic converters offer more efficiency and controllability, they may excite parallel and series resonances in the power system. They may also interact with each other or with passive network elements, and this might lead to instability and excessive harmonic distortion levels [2]. Therefore, the operation of the WPP with respect to stability and power quality must be verified for different situations in the design phase using harmonic analysis methods.
The offshore AC electrical infrastructure in WPPs as connected via a HVAC transmission cable is a sensitive network in terms of resonances because of its low damping which is caused by the design being focused on low transmission losses. The use of long array and transmission cables results in large capacitances which together with the
reactances of transformers and reactors creates resonances at low frequencies, where converters have significant emission levels. The combination of a complex configuration and low active power dissipation (due to low resistance to reduce active power losses) creates challenges in terms of harmonic performance, Grid Code compliance, and power transmission, and stability of grid-tied converters.
The presence of undamped resonances means that whenever an oscillation appears in the system (e.g. due to non-linear components such as transformers and power electronic converters) it takes long time for it to be damped out. The problem becomes even more severe when the system is unloaded, e.g. during energization, when some WTs are out of service, and when the cable network is unloaded. When the system is loaded (active power is transmitted), the overall damping is higher and the harmonics are reduced faster than in an unloaded scenario.
In addition, the resonance frequencies can shift due to changes in the system topology. Such topology changes typically occur due to variations in the number of connected WTs, transformer or transmission cable disconnection, interlink operation, etc.
The variation in damping and the shift in resonance frequencies makes it challenging to introduce robust harmonic resonance mitigation measures. Typically, one can recognize two ways of mitigating unwanted harmonics in modern power systems, (i) passive filtering, (ii) active filtering (AF) by grid-tied converters. Variation of resonance frequencies caused by topology changes requires large passive filters (e.g. damped high-pass HFs such as C-type) which are not feasible, in many cases, to be installed offshore. Therefore, for optimization of offshore electrical infrastructure in WPPs, the use of AF (or a combination of active and passive filters) seems to be a solution that is more appropriate.
It follows that appropriate and trustful modelling is critical in order to more precisely address uncertainties and electrical infrastructure optimization during the WPP design. Overall system damping estimation by means of harmonic losses (i.e. system frequency-dependent equivalent resistance) is important. Harmonic losses underestimation
can lead to costly filter overdesign, while overestimation can cause such severe problems such as grid code compliance problems and system stability issues, potentially leading to loss of production. Therefore, more precise modelling enables further optimization of electrical infrastructure and operation principles, contributing to overall cost of electricity (COE) reduction.
B. Modelling and Associated Challenges
The ability to model WPP components accurately is becoming more and more important as the electrical infrastructure is increasing in size. Widespread submarine cables, GTs at the offshore substation(s), long HVAC transmission offshore and onshore cables, onshore SGTs and other components, which are connected together, create various resonance scenarios. Resonance characteristics, especially within the low-frequency range, create challenges for robust design of wind power plants electrical system.
Accurate resonance frequency and damping estimation is critical for optimized design of the WPP electrical infrastructure. The system is designed to assure as low as possible fundamental frequency power losses. Therefore, a special effort needs to be taken to model losses (i.e. damping) within the harmonic range. Inaccurate modelling can lead to excessive harmonic distortion estimation and consequently system overdesign. It can also lead to underestimated distortion and thereby system underdesign thereby resulting in a risk of non-compliance with Grid Code or even damaged components due to overheating, instability, noise etc. Furthermore, small-signal stability of grid-tied converters in WTs, STATCOMs or high voltage direct current (HVDC) systems can be of concern for poorly damped passive network within the WPP electrical infrastructure.
Therefore, it is of significant importance to be able to correctly estimate electrical damping (i.e. frequency-dependent equivalent resistance) to optimize the electrical infrastructure and consequently reduce the cost of electricity.
C. The Impact of Modelling Techniques
This paper shows state-of-the-art techniques for harmonic losses modelling including the latest academic achievements for submarine and underground cables and their impact on the overall WPP resonance characteristics profile. It is shown how appropriate and trustworthy damping modelling can affect the system design. Also, is shown the impact of representing the frequency-dependency of the grid transformer short-circuit impedance.
Harmonic propagation studies are presented which show how the damping modelling can affect the total harmonic distortion at the offshore point of connection (POC). Also, the impact of WT harmonic emission as well as external network background distortion is evaluated.
Furthermore, WT converter small-signal stability studies are presented which show how the stability margins can drastically change depending on modelling techniques. It is shown that conservative modelling can lead to system overdesign and unnecessary costs.
II. POWER SYSTEM COMPONENTS MODELLING
A. Power Cables
Proper design of underground and submarine cable systems requires the ability to calculate the cable impedances and conductor losses with adequate accuracy while
considering the frequency-dependent effects resulting from eddy current effects in the conductors (skin and proximity effects).
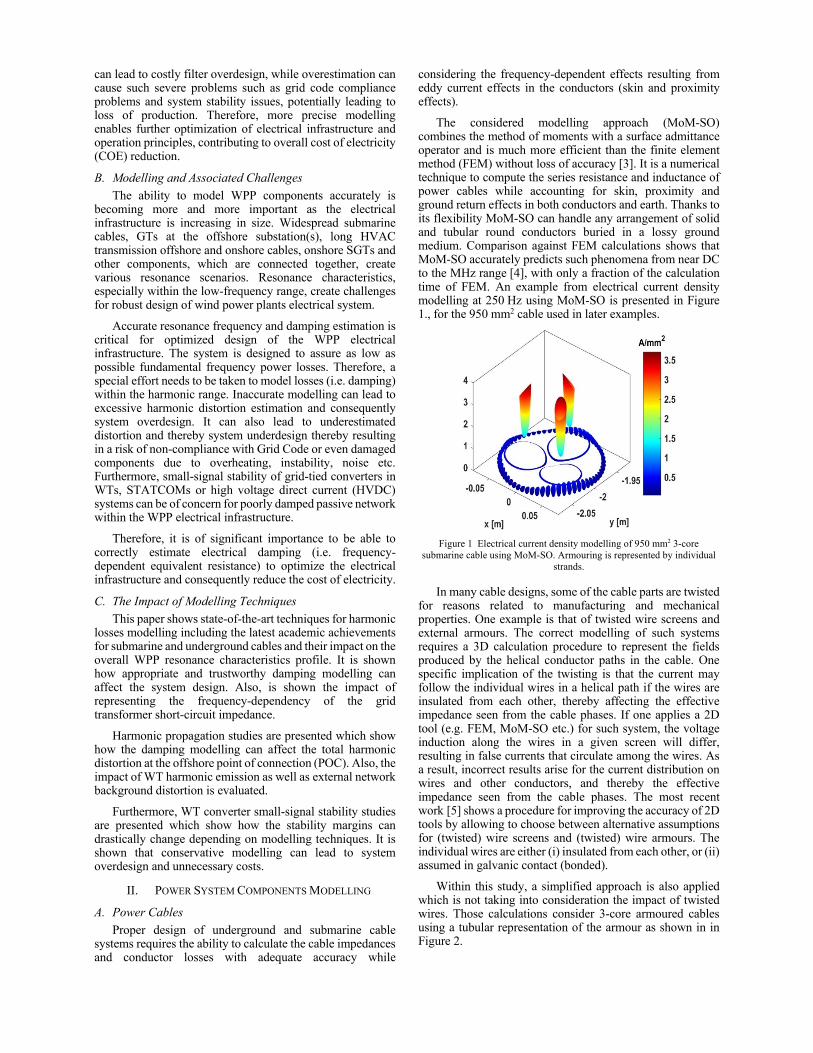
The considered modelling approach (MoM-SO) combines the method of moments with a surface admittance operator and is much more efficient than the finite element method (FEM) without loss of accuracy [3]. It is a numerical technique to compute the series resistance and inductance of power cables while accounting for skin, proximity and ground return effects in both conductors and earth. Thanks to its flexibility MoM-SO can handle any arrangement of solid and tubular round conductors buried in a lossy ground medium. Comparison against FEM calculations shows that MoM-SO accurately predicts such phenomena from near DC to the MHz range [4], with only a fraction of the calculation time of FEM. An example from electrical current density modelling at 250 Hz using MoM-SO is presented in Figure 1., for the 950 mm2 cable used in later examples.
Figure 1 Electrical current density modelling of 950 mm2 3-core
submarine cable using MoM-SO. Armouring is represented by individual strands.
In many cable designs, some of the cable parts are twisted for reasons related to manufacturing and mechanical properties. One example is that of twisted wire screens and external armours. The correct modelling of such systems requires a 3D calculation procedure to represent the fields produced by the helical conductor paths in the cable. One specific implication of the twisting is that the current may follow the individual wires in a helical path if the wires are insulated from each other, thereby affecting the effective impedance seen from the cable phases. If one applies a 2D tool (e.g. FEM, MoM-SO etc.) for such system, the voltage induction along the wires in a given screen will differ, resulting in false currents that circulate among the wires. As a result, incorrect results arise for the current distribution on wires and other conductors, and thereby the effective impedance seen from the cable phases. The most recent work [5] shows a procedure for improving the accuracy of 2D tools by allowing to choose between alternative assumptions for (twisted) wire screens and (twisted) wire armours. The individual wires are either (i) insulated from each other, or (ii) assumed in galvanic contact (bonded).
Within this study, a simplified approach is also applied which is not taking into consideration the impact of twisted wires. Those calculations consider 3-core armoured cables using a tubular representation of the armour as shown in in Figure 2.
Figure 2 Investigated 950 mm2 3-core submarine cable with tubular representation of armour.
The cable positive-sequence impedance as provided by the manufacturer is based on commonly known calculation procedures described by the industry standards. The resistance of a conductor is calculated according to formulas specified in IEC 60287-1-1:2006 taking also the skin and proximity effects into consideration. The comparison of equivalent frequency-dependent characteristics from MoM-SO and IEC is presented in Figure 3.
Resistance and inductance of transformer winding are highly frequency dependent, which is not represented in simulations when using models based only on nameplate data. In this study, we obtain frequency-dependent winding (short-circuit) resistance from analytical formula and from wide-band transformer measurements. Various analytical (or approximation) formulas have been developed to model the frequency dependence of power transformers [6]. The authors of [7] elaborate on the resistance and inductance frequency-dependent characteristic. However, in this paper only resistance is modelled to allow direct comparison of resonance damping.
Rseries=Rfn1+AR
f
fn
-1BR
(1)
where coefficients AR=0.2 and BR=1.5 depend on size and type of transformer.
Frequency-dependent characteristic of transformer's winding was obtained from wide-band admittance measurements performed on a 90 MVA wind farm transformer [8]. The measurements were performed with a commercial sweep frequency response analyser (sFRA) and their purpose was to develop a black box, or terminal, model [9]. Traditionally, measurement of admittance matrix is performed element by element with each element directly measured in frequency domain, i.e. for a transformer of terminals and ground as a reference, measurements is required. A two winding, three phase transformers require 36 measurements. They are done by applying sinusoidal voltage waveform of varying frequency to a terminal and measuring current at the same or another terminal, keeping all other terminals grounded [10]. However, this procedure is modified when using sFRA, which might influence accuracy of the measurements at harmonic frequencies [9]. Positive sequence impedance of transformer winding was obtained in the following steps. First, the admittance matrix is represented by four sub-matrices representing sides of a transformer:
IP(f)IS(f)
=YPP(f) YPS(f)YSP(f) YSS(f)
⋅VP(f)VS(f)
(2)
where each of the admittance sub-matrices is of dimension 3×3. P and S denote primary and secondary side, respectively.
Next step is to use Fortescue transformation on one of diagonal elements of admittance matrix in (2), here YSS(f) was chosen. Finally, frequency dependent resistance for the study was obtained from positive sequence admittance YSS+(f)
Rmeasurements f =real1
YSS+(f) (3)
The comparison of equivalent frequency-dependent characteristics is presented in Figure 4.
The WPP consists of almost 100 WTs with rated power of 6 MW, totalling almost 600 MW installed capacity. Power is transported to shore by means of a 34-kV collection grid, an offshore substation (OSS) with GTs, a 220 kV AC export cable and SGTs. The export system is of total length almost 100 km. The connection to the transmission network is at 400 kV level. The simplified single-line diagram (SLD) showing the most important electrical components is presented in Figure 5.
02468
1012141618
R1
[p.u
.]
f [Hz]
MoM-SO with S & P Effects (Stranded Armour)MoM-SO with Skin and Proximity EffectMoM-SO with Skin EffectIEC 60287-1-1:2006
0
100
200
300
400
500
600
50 1050 2050 3050 4050
R1
[p.u
.]
f [Hz]
Measurements Analitical
LongHVAC Cable
GT1
GT2
STATCOM1
External network
6 x 6 MW
6 x 6 MW
5 x 6 MW
6 x 6 MW
6 x 6 MW
5 x 6 MW
8 wind power plant arrays
34 kV
220 kV
400
kV
PCC
POC
5 x 6 MW
6 x 6 MW
SGT1
DRC1
Figure 5 Simplified single line diagram of the investigated wind farm.
B. Study cases
The WPP is investigated in intact operation. The only varying parameters are harmonic losses estimation of the offshore transformer as well as offshore 3-core submarine cable. No inductance frequency-dependent characteristic has been introduced in the study in order to directly compare the results with only frequency-dependent resistance.
The following modelling variations are included in the successive subsections:
a. No harmonic losses modelling, i.e. the resistance of all WPP components is equal to the fundamental frequency (50 Hz) value over entire range of frequency.
b. MoM-SO is applied to the 950 mm2 3-core submarine cable with the armour represented by a tubular conductor. The calculation includes the skin effect as function of frequency, but ignores the proximity effect. The remaining components assume only 50Hz resistance.
c. Same as b. but with cable modelling including proximity effects in addition to the skin effect.
d. This model is very similar to c. but with the cable armour represented by its individual strands (circular wires). This is believed to be most accurate cable model available until now.
e. The offshore transformer is modelled assuming measurement using sFRA. The rest of the WPP components, including also the submarine cable, are modelled assuming only the 50 Hz resistance over the entire frequency range.
f. The offshore transformer is modelled taking the analytical formula from [7].
g. Here, the 950 mm2 3-core armoured submarine cable is modelled taking the approach from d. and the offshore transformer is modelled assuming e. This is believed to be the most accurate modelling of the transformer and cable.
C. Impedance Sweep
In order to define possible resonances within the electrical system under consideration, the frequency sweep method is very useful. Combined with harmonic propagation studies it is a powerful way of performing harmonic studies and it gives a good overview of the system behaviour from a harmonic perspective. In this work, commercial tools were used to calculate the impedance frequency sweeps.
Since the resonance at the transmission level is mainly caused by the transmission cables and the onshore (or
offshore, depending on the busbar of interest) transformers, the difference in length of the transmission cables also has a strong impact. The results presented in Figure 6 are obtained for one specific external WPP grid frequency-dependent characteristic with the WPP in normal operation. The impedance profile is obtained at 220 kV from the HV side of the offshore GT, seen between the WPP offshore electrical infrastructure and almost 100-km long HVAC transmission cable connected to the onshore substation (POC in Figure 5).
Figure 6 The impact of the cable harmonic losses modelling on system
resonance damping at the offshore substation (frequency range: 100-1600Hz).
In Figure 6 it can be clearly seen that depending on the harmonic losses modelling, the resonances can be less or more effectively damped. In order to align all the resonance frequencies for the different cable models, the positive sequence inductance was assumed to be equal for all of the cases and only the (frequency-dependent) positive-sequence resistance characteristic was changed. Additionally, the impact of the offshore transformer equivalent resistance on resonance damping is shown in Figure 7.
Figure 7 The impact of the offshore transformer harmonic losses
modelling on system resonance damping at the offshore substation (frequency range: 100-2500Hz).
Looking more in details on Figure 6 and Figure 7 one can see that the resonances introduced by the cable and transformer are well damped by the harmonic losses in the 950 mm2 transmission cable. However, there is not so much influence on damping from the transformer. Comparing the data derived based on the IEC standard with those obtained from the MoM-SO tool it is seen that the damping is much more pronounced for MoM-SO when including skin and proximity effects. Furthermore, it can be observed that the resonances by the different calculation methods in Figure 6, Figure 7 and Figure 8 do in reality not align as the calculated inductances are different. Therefore, the use of a more high-quality model is in reality even more important than what is seen in the figures. It is also to be noted that the calculation of resonance frequencies is affected by uncertainties, e.g. due
1
10
100
1000
10000
100 600 1100 1600
|Z1|
[Ω]
f [Hz]
a. b. c. d.
1
10
100
1000
10000
100 600 1100 1600 2100
|Z1|
[Ω]
f [Hz]
a. e. f.
to cable parameters tolerances, external network modelling etc.
Figure 8 The impact of the offshore cable and transformer harmonic losses modelling on system resonance damping at offshore substation
(frequency range: 100-2500Hz).
The frequency sweeps add useful information about the impedance profile of the WPP. This allows for a more qualified interpretation of the harmonic propagation studies, energization studies and also constitutes a useful input to the control stability studies [1].
D. Harmonic propagation studies
Based on results from harmonic propagation studies which are presented in Table 1 and Table 2 in terms of total harmonic distortion (THD), one can see that the most significant impact on harmonic resonance damping in the transmission system is that by the cable modelling. In Table 1 the results are reflecting the case when only the damping in the 950 mm2 submarine cable is modelled while in Table 2 the damping of the offshore GT as well as other WPP components is included (e.g. WT transformers, array cable system, underground HV cable, SGT). One can see from Table 1 that at the offshore substation, the IEC modelling reduces the THD by 40% while the MoM-SO modelling gives a 50% reduction. Of course, the THD level is very much dependent on the harmonic emission in the system. In this investigation, the harmonic emission is only from the WTs.
Table 1 Total harmonic distortion calculation of the wind power plant harmonic content generated by wind turbines to the transmission system
(including only the submarine cable).
Location No damping
IEC 60287-1-1
MoM-SO (S)
MoM-SO (S+P)
MoM-SO (S+P)
stranded Offshore 220kV 0.42 0.36 0.28 0.30 0.30
Table 2 Total harmonic distortion calculation of the wind power plant harmonic content generated by wind turbines to the transmission system
(including transformers as well as all other components).
Location No damping
Funk & Hantel sFRA
MoM-SO (S+P)
stranded & sFRA
All components
Offshore 220kV 0.418 0.416 0.418 0.296 0.052
Based on results presented in Table 1 and Table 2 it can be seen that the power cable harmonic losses modelling has much bigger impact than modelling of resistance frequency-dependent characteristic of the offshore transformer. This result is, however, expected considering the long length of the cable. Furthermore, appropriate modelling of the whole system can significantly reduce the harmonic distortion estimation within the WPP electrical infrastructure and, thus,
can allow to optimise the system design, even reducing the size and quantity of passive filters.
E. Small-Signal Stability
Power electronic-based grid-tied converters such as WTs, STATCOMs, high voltage direct current (HVDC) transmission units are more and more common in modern power system including WPPs. Thus, resonance interactions above the fundamental frequency can be potentially observed in the grid. These resonance interactions at high frequencies, also called harmonic small-signal stability, will lead to high harmonics within the grid. Therefore, resonance damping is crucial in grid-converters robust operation as well as harmonic attenuation.
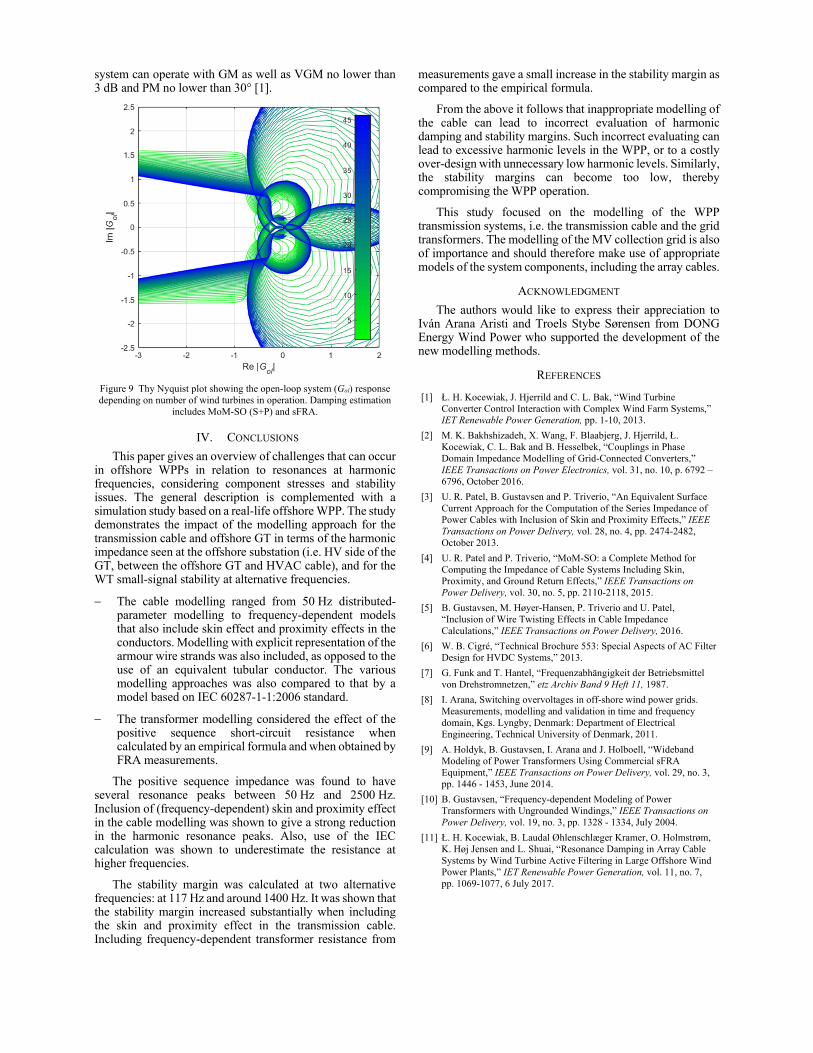
To evaluate the stability and assure robust coordination of converter systems in the grid gain margin (GM), phase margin (PM) and vector (gain) margin (VGM) are introduced. The GM is the factor by which the gain can be increased before causing the system to be unstable, and is the inverse of the magnitude of the open-loop control system when its phase is 180°. The PM is the difference between -180° and the phase of the open-loop control system when its amplitude is 1. The PM is a measure of how much additional phase lag or time delay can be tolerated in the loop before instability results. The VGM is given in terms of the sensitivity function and provides one-point stability measure [1], [11]. Figure 9 shows the Nyquist plot of the open-loop system (Gol) response depending on number of WTs in operation with damping estimation including MoM-SO (S+P) and sFRA.
Table 4 Stability margins variation depending on transformer and transmission cable damping (harmonic losses) estimation.
Stability margin No damping Funk &
Hantel sFRA MoM-SO (S+P) &
sFRA
GM in [dB] 4.62dB
@ 1400 Hz
4.63dB @
1400 Hz
4.64dB @
1400 Hz
5.28dB@
1404 Hz
PM in [°] 40.6°
@ 117 Hz
40.7° @
117 Hz
40.7° @
117 Hz
40.15°@
117 Hz
VGM in [dB] 4.13dB
@ 1384 Hz
4.16dB @
1384 Hz
4.17dB @
1384 Hz
4.92dB@
1387 Hz
Based on the results from small-signal analysis presented in Table 3 and Table 4 it can be seen that more accurate damping estimation using MoM-SO and sFRA can improve the stability margins. This is especially the case for the higher frequency range as observed for GM and VGM around 1400 Hz. PM is not much affected by harmonic losses modelling because it is measured for frequencies close to the WPP system fundamental frequency (i.e. 117 Hz). The higher stability margins the better. Typically, it is assumed that the
0
500
1000
1500
100 600 1100 1600 2100
|Z1|
[Ω]
f [Hz]
a. g.
system can operate with GM as well as VGM no lower than 3 dB and PM no lower than 30° [1].
Figure 9 Thy Nyquist plot showing the open-loop system (Gol) response depending on number of wind turbines in operation. Damping estimation
includes MoM-SO (S+P) and sFRA.
IV. CONCLUSIONS
This paper gives an overview of challenges that can occur in offshore WPPs in relation to resonances at harmonic frequencies, considering component stresses and stability issues. The general description is complemented with a simulation study based on a real-life offshore WPP. The study demonstrates the impact of the modelling approach for the transmission cable and offshore GT in terms of the harmonic impedance seen at the offshore substation (i.e. HV side of the GT, between the offshore GT and HVAC cable), and for the WT small-signal stability at alternative frequencies.
The cable modelling ranged from 50 Hz distributed-parameter modelling to frequency-dependent models that also include skin effect and proximity effects in the conductors. Modelling with explicit representation of the armour wire strands was also included, as opposed to the use of an equivalent tubular conductor. The various modelling approaches was also compared to that by a model based on IEC 60287-1-1:2006 standard.
The transformer modelling considered the effect of the positive sequence short-circuit resistance when calculated by an empirical formula and when obtained by FRA measurements.
The positive sequence impedance was found to have several resonance peaks between 50 Hz and 2500 Hz. Inclusion of (frequency-dependent) skin and proximity effect in the cable modelling was shown to give a strong reduction in the harmonic resonance peaks. Also, use of the IEC calculation was shown to underestimate the resistance at higher frequencies.
The stability margin was calculated at two alternative frequencies: at 117 Hz and around 1400 Hz. It was shown that the stability margin increased substantially when including the skin and proximity effect in the transmission cable. Including frequency-dependent transformer resistance from
measurements gave a small increase in the stability margin as compared to the empirical formula.
From the above it follows that inappropriate modelling of the cable can lead to incorrect evaluation of harmonic damping and stability margins. Such incorrect evaluating can lead to excessive harmonic levels in the WPP, or to a costly over-design with unnecessary low harmonic levels. Similarly, the stability margins can become too low, thereby compromising the WPP operation.
This study focused on the modelling of the WPP transmission systems, i.e. the transmission cable and the grid transformers. The modelling of the MV collection grid is also of importance and should therefore make use of appropriate models of the system components, including the array cables.
ACKNOWLEDGMENT
The authors would like to express their appreciation to Iván Arana Aristi and Troels Stybe Sørensen from DONG Energy Wind Power who supported the development of the new modelling methods.
REFERENCES
[1] Ł. H. Kocewiak, J. Hjerrild and C. L. Bak, “Wind Turbine Converter Control Interaction with Complex Wind Farm Systems,” IET Renewable Power Generation, pp. 1-10, 2013.
[2] M. K. Bakhshizadeh, X. Wang, F. Blaabjerg, J. Hjerrild, Ł. Kocewiak, C. L. Bak and B. Hesselbek, “Couplings in Phase Domain Impedance Modelling of Grid-Connected Converters,” IEEE Transactions on Power Electronics, vol. 31, no. 10, p. 6792 – 6796, October 2016.
[3] U. R. Patel, B. Gustavsen and P. Triverio, “An Equivalent Surface Current Approach for the Computation of the Series Impedance of Power Cables with Inclusion of Skin and Proximity Effects,” IEEE Transactions on Power Delivery, vol. 28, no. 4, pp. 2474-2482, October 2013.
[4] U. R. Patel and P. Triverio, “MoM-SO: a Complete Method for Computing the Impedance of Cable Systems Including Skin, Proximity, and Ground Return Effects,” IEEE Transactions on Power Delivery, vol. 30, no. 5, pp. 2110-2118, 2015.
[5] B. Gustavsen, M. Høyer-Hansen, P. Triverio and U. Patel, “Inclusion of Wire Twisting Effects in Cable Impedance Calculations,” IEEE Transactions on Power Delivery, 2016.
[6] W. B. Cigré, “Technical Brochure 553: Special Aspects of AC Filter Design for HVDC Systems,” 2013.
[7] G. Funk and T. Hantel, “Frequenzabhängigkeit der Betriebsmittel von Drehstromnetzen,” etz Archiv Band 9 Heft 11, 1987.
[8] I. Arana, Switching overvoltages in off-shore wind power grids. Measurements, modelling and validation in time and frequency domain, Kgs. Lyngby, Denmark: Department of Electrical Engineering, Technical University of Denmark, 2011.
[9] A. Holdyk, B. Gustavsen, I. Arana and J. Holboell, “Wideband Modeling of Power Transformers Using Commercial sFRA Equipment,” IEEE Transactions on Power Delivery, vol. 29, no. 3, pp. 1446 - 1453, June 2014.
[10] B. Gustavsen, “Frequency-dependent Modeling of Power Transformers with Ungrounded Windings,” IEEE Transactions on Power Delivery, vol. 19, no. 3, pp. 1328 - 1334, July 2004.
[11] Ł. H. Kocewiak, B. Laudal Øhlenschlæger Kramer, O. Holmstrøm, K. Høj Jensen and L. Shuai, “Resonance Damping in Array Cable Systems by Wind Turbine Active Filtering in Large Offshore Wind Power Plants,” IET Renewable Power Generation, vol. 11, no. 7, pp. 1069-1077, 6 July 2017.