83
Papua New Guinea Initial National Communication Under the United Nations Framework Convention on Climate Change November, 2000
P a p u a N e w G u i n e aI n i t i a l N a t i o n a l C o m m u n i c a t i o n
U n d e r t h e U n i t e d N a t i o n sF r a m e w o r k
C o n v e n t i o n o n C l i m a t e C h a n g e
November, 2000
P R E F A C E
Papua New Guinea (PNG) signed the United Nations Framework Convention on ClimateChange (UNFCCC) at the UNCED in Rio de Janeiro, Brazil in June 1992. The UNFCCC wasratified by the Government of Papua New Guinea (GoPNG) in April 1993. The signing andratification of the UNFCCC by the GoPNG is a testimony of our strong commitment to fulfillingour obligations to the Convention. It also signifies the concerns that PNG has about the issuespertaining to the likely impacts of climate change and sea-level rise.
One of the cornerstones of this climate Convention is the commitment by all Parties to take thenecessary steps and measures to reduce greenhouse gas (GHG) emissions. This is furtherstrengthened by the commitment of all Parties to submit to the Conference of the Parties (COP)National Communication under Articles 4 and 12 of the UNFCCC.
This document has been prepared to fulfill PNG’s commitment. It contains the necessaryinformation about the country’s major sources of GHG emissions and sinks, vulnerability andadaptation options together with the necessary mitigation measures, which PNG will implementto adapt to climate change impacts and further contribute to the global efforts in reducing GHGemissions.
The GovPNG has also gone ahead in embarking on a number of new initiatives aimed atsupporting our commitment to the UNFCCC. These included the establishment of a PNGGreenhouse Office to develop appropriate policies and where required, necessary legislation toaddress the issues relating to climate change.
Although our GHG emissions as shown in this document are relatively insignificant, we areseverely affected by the impacts of climate change resulting from global warming due toincreased GHG concentrations in the atmosphere. Faced with this eminent problem, PNG wantsto take the lead in meeting its obligation to the UNFCCC and that we hope that those countryparties whose emissions are much higher would take positive steps to do more towards reducingtheir GHG emissions. The direction PNG is taking is not only for meeting our commitment tothe UNFCCC, but importantly to address the issues relating to the future of our social andeconomic developments under the prevailing environment of climate change.
I am optimistic that the programmes and projects that will eventuate from this Initial NationalCommunication will go a long way in assisting PNG to better manage the effects of climatechange more effectively, for the well being of our environment and people of which we hold sodearly.
Rt. Honourable, Sir Mekere Morauta Kt MPPrime Minister of Papua New Guinea
i
F O R E W O R D
Papua New Guinea is highly vulnerable to the impacts of climate change as it encompasses morethan 17,000 km of coastline and 600 islands, most of which are low lying, and has almost 2,000coastal villages with a population of about 500,000 making it much vulnerable to sea level riseand other weather-related manifestations of climate change.
Since PNG is highly vulnerable to the impacts of climate change, the mitigation and adaptationmeasures highlighted in this initial National Communication are very important. They provideus the opportunity to pursue our efforts for mitigating GHG emissions and adaptive measures.Such approach would also assist us in our endeavour to promote the conservation of a uniqueand rich biological diversity, which has been estimated to contain between 5-7% of the globalbiodiversity. Further, the measures would go a long way in assisting us to implement ourpending strategies for sustainable development of our natural resources.
The experiences we had during the 1997/98 prolonged drought has taught us a number oflessons, especially the vulnerability of our agricultural crops (both for food and cash), waterresources and health related problems. Further, our fisheries resources, including the 2.4 millionkm2 of the exclusive economic zone, although currently abundant and least less exploited, couldprove susceptible to temperature and other changes. Already we are experiencing the increasingbleaching of our coral reefs as well as impacts of the rising sea levels.
Our terrestrial ecosystems are particularly diverse and complex and the impacts of climatechange on them are not well understood.
I am pleased to submit this initial National Communication in fulfillment of our obligation to theUNFCCC, which have already signed and ratified.
This report has been prepared by the PNG country team on climate change with the technicalassistance from SPREP and the National Tidal Facility, Flinders University, South Australia,with the financial assistance from the UNDP-GEF programme. The PNG country teamcomprises both the Steering and Technical Committees, drawn from various governmentagencies, national institutions, NGOs and the private sector.
The aim of this report is to produce document information about the country’s sources of GHGemissions and sinks, vulnerability and adaptation as well as providing a number of adaptationand abatement option measures for reducing GHG emissions and adapt to changingenvironmental conditions resulting from climate change.
Honourable Herowa Agiwa, MPMinister for the Environment and Conservation
ii
CONTENTS
PREFACE……………………….………………………………………………… iFOREWORD……………………………………………………………………… iiCONTENTS……………………………………………………………………… iii-ivEDITORS………………………………………………………………………… vCONTRIBUTORS………………………………………………………………… vACKNOWLEDGMENTS………………………………………………………… viLIST OF ABBREVIATIONS AND ACRONYMS……………………………… viiEXECUTIVE SUMMARY………………………….…………………………… 1-3Projections, Policies and Plans…………..……………………………………… 4Conclusion………………………………………………………………………… 41. NATIONAL CIRCUMSTANCES…….……………………………………… 5Background………………………………………………………………………… 5Geography………………………………………………………………………… 5-6History…………………………………………………………………………… 6-7Climate and Weather……………………………………………………………… 7-8Country and Provincial Climate Trends…………………………………………… 8-9Weather and Climate trends……………………………………………………… 9-13Sea level rise……………………………………………………………………… 13ENSO and Climate Variability…………………………………………………… 13-15Population and Welfare…………………………………………………………… 15-16Education and Training…………………………………………………………… 16The Economy……………………………………………………………………… 16-17Agriculture………………………………………………………………………… 17-18Land Use Change………………………………………………………………… 18Forestry…………………………………………………………………………… 18-19Fish Resources…………………………………………………………………… 19-20Coastal Resources………………………………………………………………… 21Non renewable resources………………………………………………………… 21-22Energy…………………………………………………………………………… 22-23Tourism…………………………………………………………………………… 23Transport………………………………………………………………………… 23Biodiversity……………………………………………………………………… 24-262. NATIONAL INVENTORY OF GREENHOUSE GASES…………………… 27Introduction……………………………………………………………………… 27Inventory Process………………………………………………………………… 27-28Greenhouse Gases………………………………………………………………… 28Organisation……………………………………………………………………… 28-30Emissions………………………………………………………………………… 31-32Memo Items……………………………………………………………………… 32Agriculture………………………………………………………………………… 32-33Land use & Forestry……………………………………………………………… 33-34Waste……………………………………………………………………………… 35-37Conclusion………………………………………………………………………… 373. VULNERABILITY ASSESSMENT AND ADAPTATION OPTIONS……… 38Introduction………………………………………………………………………… 38Climate Change and Sea Level Rise Scenarios…………………………………… 38-40Vulnerability……………………………………………………………………… 41-50
iii
Adaptive Measures………………………………………………………………… 50-56Conclusion………………………………………………………………………… 574. MIGITATION OPTIONS - ENERGY, TRANSPORT, FORESTRY AND WASTE 58Introduction………………………………………………………………………… 58-62Conclusion………………………………………………………………………… 625. SYSTEMATIC OBSERVATION AND RESEARCH..………………………… 63Introduction………………………………………………………………………… 63Data Collection, systematic Observations and Institutions………………………… 63-64Bilateral, Regional and International……………………………………………… 64National Institutions……………………………………………………………… 64Research Programmes……………………………………………………………… 64-66Forestry…………..………………………………………………………………… 67Future Research…………………………………………………………………… 68Conclusion………………………………………………………………………… 686. EDUCATION, TRAINING AND AWARENESS………………..…………… 69Introduction………………………………………………………………………… 69-70Conclusion………………………………………………………………………… 707. PROJECTIONS, POLICIES AND PLANS…………………………………… 71Introduction………………………………………………………………………… 71Policy Development Goals in the Area of Climate Change……………………… 71-72Trends and Policy Measures……………………………………………………… 72-73Conclusion………………………………………………………………………… 738.REFERENCES…………………………………………………………………… 74-75
iv
E D I T 0 R S
Chalapan KaluwinSouth Pacific Regional Environment ProgrammeApia, Samoa
James Ashton19 Murray Street, North WardTownsville, QueenslandAustralia
Simon SauleiBiology DepartmentSchool of Physical & Natural SciencesUniversity of Papua New GuineaPapua New Guinea
C O N T R I B U T O R S
Martin Bonou Department of Petroleum & EnergyChalapan Kaluwin South Pacific Regional Environment ProgrammePhilip Kaupa National Fisheries AuthorityIdau Kopi Department of Petroleum & EnergyKevin Luana National Weather ServiceGabriel Luluaki Division of Environment Science, UPNGSamuel Maiha National Weather ServiceGerard Natera Office of Environment & ConservationJob Opu Office of Environment & ConservationWaine Pane Biology Department, UPNGJames Sabi Office of Environment & ConservationSimon Saulei Biology Department, UPNGGraham Sem South Pacific Regional Environment ProgrammeSobi Wape Division of Environment Science, UPNGBarnabas Wilmot Office of Environment & ConservationMaino Virobo Office of Environment & ConservationKatrina Solien Office of Environment & Conservation
v
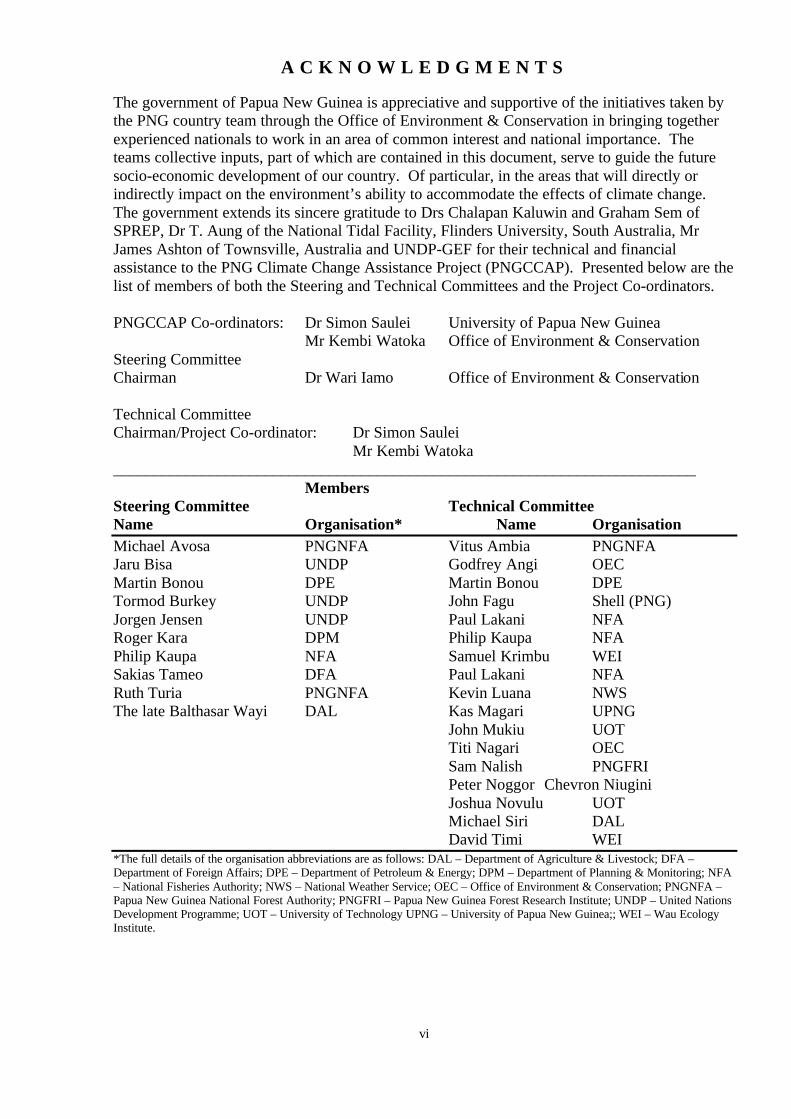
A C K N O W L E D G M E N T S
The government of Papua New Guinea is appreciative and supportive of the initiatives taken bythe PNG country team through the Office of Environment & Conservation in bringing togetherexperienced nationals to work in an area of common interest and national importance. Theteams collective inputs, part of which are contained in this document, serve to guide the futuresocio-economic development of our country. Of particular, in the areas that will directly orindirectly impact on the environment’s ability to accommodate the effects of climate change.The government extends its sincere gratitude to Drs Chalapan Kaluwin and Graham Sem ofSPREP, Dr T. Aung of the National Tidal Facility, Flinders University, South Australia, MrJames Ashton of Townsville, Australia and UNDP-GEF for their technical and financialassistance to the PNG Climate Change Assistance Project (PNGCCAP). Presented below are thelist of members of both the Steering and Technical Committees and the Project Co-ordinators.
PNGCCAP Co-ordinators: Dr Simon Saulei University of Papua New GuineaMr Kembi Watoka Office of Environment & Conservation
Steering CommitteeChairman Dr Wari Iamo Office of Environment & Conservation
Technical CommitteeChairman/Project Co-ordinator: Dr Simon Saulei
Mr Kembi Watoka_________________________________________________________________________
MembersSteering Committee Technical CommitteeName Organisation* Name OrganisationMichael Avosa PNGNFA Vitus Ambia PNGNFAJaru Bisa UNDP Godfrey Angi OECMartin Bonou DPE Martin Bonou DPETormod Burkey UNDP John Fagu Shell (PNG)Jorgen Jensen UNDP Paul Lakani NFARoger Kara DPM Philip Kaupa NFAPhilip Kaupa NFA Samuel Krimbu WEISakias Tameo DFA Paul Lakani NFARuth Turia PNGNFA Kevin Luana NWSThe late Balthasar Wayi DAL Kas Magari UPNG
John Mukiu UOTTiti Nagari OECSam Nalish PNGFRIPeter Noggor Chevron NiuginiJoshua Novulu UOTMichael Siri DALDavid Timi WEI
*The full details of the organisation abbreviations are as follows: DAL – Department of Agriculture & Livestock; DFA –Department of Foreign Affairs; DPE – Department of Petroleum & Energy; DPM – Department of Planning & Monitoring; NFA– National Fisheries Authority; NWS – National Weather Service; OEC – Office of Environment & Conservation; PNGNFA –Papua New Guinea National Forest Authority; PNGFRI – Papua New Guinea Forest Research Institute; UNDP – United NationsDevelopment Programme; UOT – University of Technology UPNG – University of Papua New Guinea;; WEI – Wau EcologyInstitute.
vi
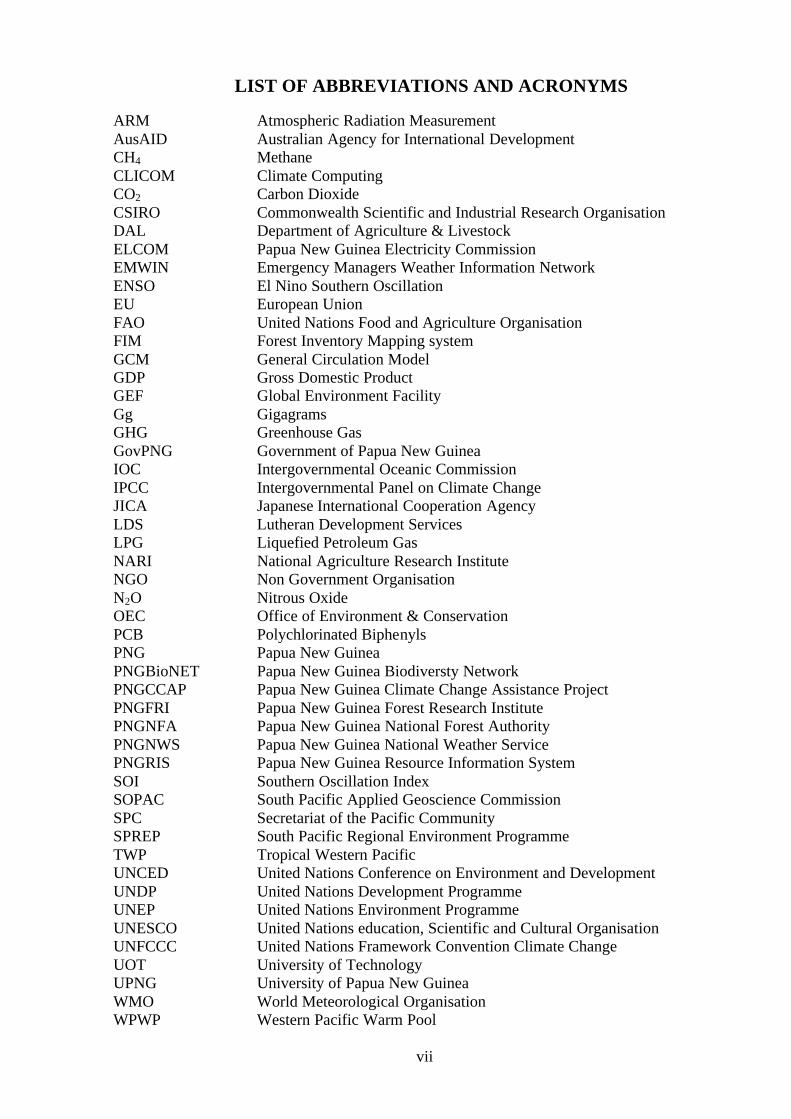
LIST OF ABBREVIATIONS AND ACRONYMS
ARM Atmospheric Radiation MeasurementAusAID Australian Agency for International DevelopmentCH4 MethaneCLICOM Climate ComputingCO2 Carbon DioxideCSIRO Commonwealth Scientific and Industrial Research OrganisationDAL Department of Agriculture & LivestockELCOM Papua New Guinea Electricity CommissionEMWIN Emergency Managers Weather Information NetworkENSO El Nino Southern OscillationEU European UnionFAO United Nations Food and Agriculture OrganisationFIM Forest Inventory Mapping systemGCM General Circulation ModelGDP Gross Domestic ProductGEF Global Environment FacilityGg GigagramsGHG Greenhouse GasGovPNG Government of Papua New GuineaIOC Intergovernmental Oceanic CommissionIPCC Intergovernmental Panel on Climate ChangeJICA Japanese International Cooperation AgencyLDS Lutheran Development ServicesLPG Liquefied Petroleum GasNARI National Agriculture Research InstituteNGO Non Government OrganisationN2O Nitrous OxideOEC Office of Environment & ConservationPCB Polychlorinated BiphenylsPNG Papua New GuineaPNGBioNET Papua New Guinea Biodiversty NetworkPNGCCAP Papua New Guinea Climate Change Assistance ProjectPNGFRI Papua New Guinea Forest Research InstitutePNGNFA Papua New Guinea National Forest AuthorityPNGNWS Papua New Guinea National Weather ServicePNGRIS Papua New Guinea Resource Information SystemSOI Southern Oscillation IndexSOPAC South Pacific Applied Geoscience CommissionSPC Secretariat of the Pacific CommunitySPREP South Pacific Regional Environment ProgrammeTWP Tropical Western PacificUNCED United Nations Conference on Environment and DevelopmentUNDP United Nations Development ProgrammeUNEP United Nations Environment ProgrammeUNESCO United Nations education, Scientific and Cultural OrganisationUNFCCC United Nations Framework Convention Climate ChangeUOT University of TechnologyUPNG University of Papua New GuineaWMO World Meteorological OrganisationWPWP Western Pacific Warm Pool
vii
E X E C U T I V E S U M M A R Y
BACKGROUND
This Initial National Communication contains a series of activities implemented by theGovernment of Papua New Guinea (GoPNG) in consultation with communities and non-government organisations since 1998. The Office of the Environment and Conservation (OEC)was tasked to co-ordinate the implementation of the initiative with UNDP and the appointed Co-ordinator to manage the project. National country teams comprising both the Steering andTechnical Committees were established with the support of government departments,universities, and assisted by the private sector and NGOs to complete the activities and reportsunder the Initial Communication.
Resources were identified from the government departments including a consultant from theUniversity of Papua New Guinea (UPNG) and support from SPREP, enabling the compilation offield studies reports for the national greenhouse gas inventory for sinks and sources andassessment of vulnerability and adaptation to climate change, variability and sea level rise. Theabatement analysis was conducted, but due to insufficient and unavailable of data, only anassessment of potential mitigative measures were carried out instead.
The completion of the PNG Initial National Communication is a product of the efforts of thenational country teams and guidance provided by SPREP. Financial assistance was obtainedthrough the Global Environment Facility (GEF) administered by UNDP and implementedthrough the OEC. In addition, the GoPNG co-financed this activity as part of its commitment tothe UNFCCC obligations.
The Initial National Communication report contains the following chapters:
1. National Circumstances2. National Inventory of Greenhouse Gases3. Vulnerability Assessment and Adaptation Options4. Mitigation Options5. Systematic Observation and Research6. Education, Training and Awareness7. Projections, Policies and Plans
National Circumstances
PNG is a country rich in natural resources, people and culture. It has a relatively large land masswith high mountain ranges, islands and atolls, a large scattered population and a complex systemof customary land tenure. The economy is largely dominated by exports and incomes frommining and petroleum, agriculture, forestry, fishing and, to a lesser extent, construction andtransport sectors. The broadly distributed access to the natural resource base provides for thebasic needs of people, but not necessarily real growth per person.
The rugged terrain, unique and rich biodiversity and range of environments, cultures, languages,and the legacies of former colonial powers have heavily influenced the process of change anddevelopment. Although biodiversity is outstanding with many species unique to PNG, much ofthe land and habitats have been modified by erosion and land clearing, resulting mainly fromtraditional agriculture systems and the harvesting of timber. Commercial logging is fairlywidespread throughout all regions of the country with one million hectares already logged.About one fifth of the land in PNG is subject to inundation.
1
As an island surrounded by the vast Pacific Ocean and the adjacent large land masses ofAustralia and Asia, the climate and weather pattern of PNG is heavily influenced by excessheating due to its proximity to the equator. Likewise, the biannual east–west circulation of warmair masses, weather patterns of Australia and the variable topography of the country with highmountain ranges also has an influence. In recent times, surface temperatures have increased byabout half a degree Celcius since the mid 70s, while rainfall has reduced in some areas by asmuch as 15%. Nevertheless, there is still a relatively clear regional pattern of distribution. Sealevel changes of up to 30 mm per year have been directly related to El Nino Southern Oscillation(ENSO).
National Inventory for Greenhouse Gases
The PNG Inventory for GHG has been calculated starting from 1994 using the 1996 IPCCGuidelines provided to the country teams. While this is the first attempt to complete the GHGInventory, there were some deficiencies in data collection and its appropriate format for land usechanges and forestry, waste, agriculture and livestock sectors.
Due to the unique characteristics of PNG, the application of the IPCC methodology in certainsectors created some difficulties and modification of the guidelines took place.
The GHG emissions for PNG are:
• Carbon Dioxide 1,553.57Gg• Methane 4.27Gg• Nitrous Oxide 12.2 Gg
The results suggest that these are relatively small per capita emissions and therefore, anyreductions of these levels are practically insignificant.
The results of this work has clearly identified the need for improvement in the IPCC Guidelines,(using of emission factors), collection of data for future GHG to centralised in the mostappropriate institution, more education and training on understanding the GHG interactionsbetween forestry, land use and soils.
Vulnerability Assessment and Adaptation Options
The natural environments of the country have developed a capacity over the years to adjust tohuman activity and changes to the climate. However, in the past few decades, the rapidlychanging climate patterns, increasing population growth and intensity and levels of uses ofnatural ecosystems may affect the ability of these systems to respond to such change.
PNG has already been buffeted by extreme weather and climate events such as those broughtabout by the El Nino in 1997/98 with further changes in temperatures and sea level rise predictedover the next 100 years. These events will lead to inundation of low lying inland and coastalareas, including the atoll islands, bleaching and loss of coastal defences. Loss of wetlands,changes to the fisheries, forestry and agriculture sectors, alteration to water resources and landuse practices and impacts on health, particularly vector borne diseases such as Malaria otherrelated water and air borne disease are also expected.
2
In general, the range of adaptation strategies to minimise and adjust to the impacts of climatechange do not need extensive new interventions, but rather by enhancing current practices.However, the ability of the country to adapt to climate change is a function of a range ofinstitutional, technological and cultural factors, which will need a fundamental shift attributed tothe importance of sound management practices and mainstreaming of environmentalconsiderations at planning and policy levels.
Mitigation Options for Energy, Transport, Forestry and Waste
The GHG inventory results underline the importance for the government to give priority attentionfor reducing the emission of greenhouse gases from the following sectors: energy, transport,forestry and waste to achieve economic and environment sustainability. The need for promotingrenewable sources of energy, review current mitigation policies, create subsidies for transportsystems and increase awareness and education are some important options. Table 4.1 provides awide range of important mitigation options for the country to closely examine and developappropriate program of actions.
Systematic Observations and Research
Reducing the uncertainty of science, impacts, adaptation and mitigation options of climatechange is a challenge, especially when the country is already dealing with the presence ofclimate variability, sea level rise and extreme events.
The need for national research institutions in collaboration with international organisations todeal with any surprises that climate change, coupled with climate variability would impact on theeconomy, environment and people should be encouraged.
Education, Training and Awareness
While, literacy levels and the educational status of people is fairly low, training to increase thecompetency, skills and knowledge of people has been a priority for successive governments.These include using new scientific methodologies and techniques to calculate GHG emissionsfrom sinks and sources from various sectors, assessing climate change vulnerabilities andadaptation options and raising community awareness on the impacts of climate change andvariability. Training institutions from UPNG, University of Technology (UOT), University ofWaikato in New Zealand, National Tidal Facility, Flinders University, South Australia andSPREP can contribute positively to capacity building in this area.
The climate change, variability and extreme events have potential impacts on the socio-economic and environmental well-being of the nation and its people. However, in the area ofawareness, capacity building and human resources development to address this area in anintegrated approach has not been well address and therefore, must be given priority.
Educational institutions need to incorporate climate change, variability and sea level rise intotheir curriculum and should be given a priority with appropriate financial support.
3
PROJECTIONS, POLICIES AND PLANS
The current legislative base of PNG provides for environmental planning measures and codes ofpractice to be included as an integral part of project planning for developments with significantenvironmental risk. The OEC provides policy advice and technical advisory support for thesustainable development of key sectors such as coastal and marine ecosystems, water resources,agriculture and forestry; health and fisheries, while implementation of policy measures has beendevolved to the provinces. Increased efforts are needed to strengthen the capacity of localinstitutions and communities in dealing with climate change impacts. This will require moreeffective systems and networks of extracting and sharing resources and experiences within andbetween communities, towns and provinces.
CONCLUSION
The time to act to reduce the vulnerability of PNG is now. As such action will go a long waytoward reducing the magnitude of problems that may be brought about by climate change andhuman activities on the environment in the future. The challenge will be to convince people ofsuch potential impacts and start adapting and mitigating long before the anticipated impactsoccur. This will require making adjustments to current development practices, whilst trading offsome short term economic gains, without over capitalizing or investing in high cost or badlyconceived solutions.
4
5
CHAPTER 1
NATIONAL CIRCUMSTANCES
BACKGROUND
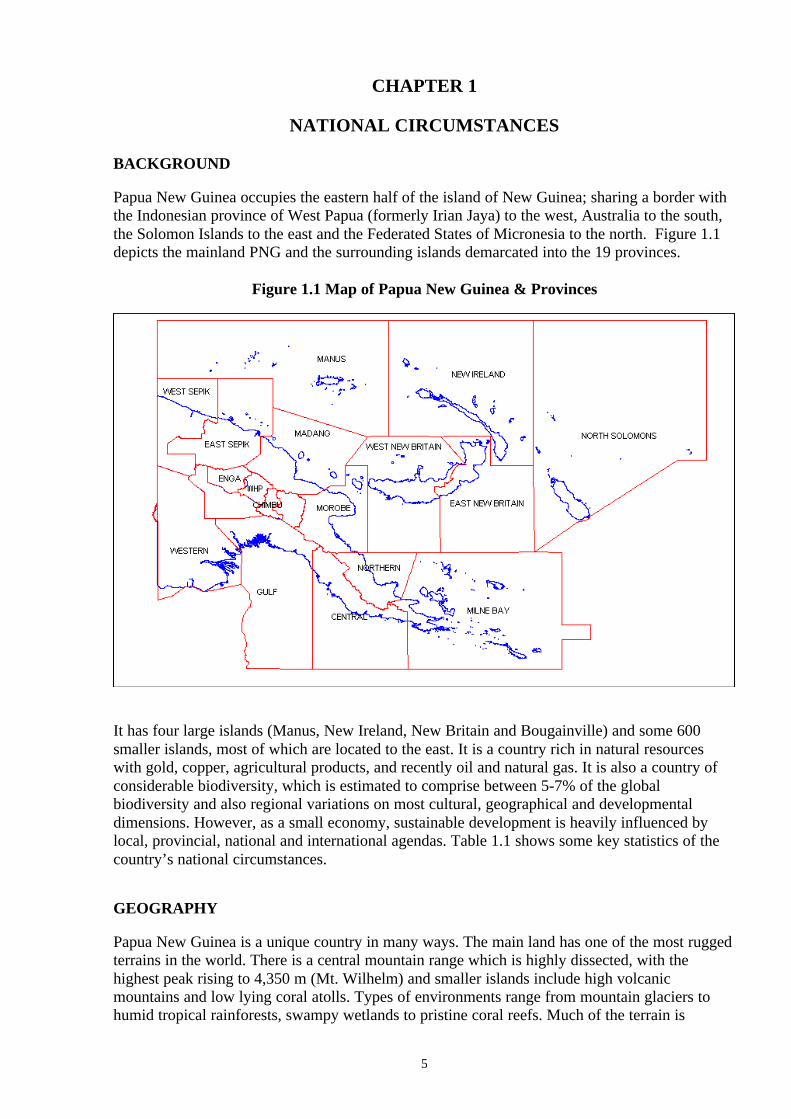
Papua New Guinea occupies the eastern half of the island of New Guinea; sharing a border withthe Indonesian province of West Papua (formerly Irian Jaya) to the west, Australia to the south,the Solomon Islands to the east and the Federated States of Micronesia to the north. Figure 1.1depicts the mainland PNG and the surrounding islands demarcated into the 19 provinces.
Figure 1.1 Map of Papua New Guinea & Provinces
It has four large islands (Manus, New Ireland, New Britain and Bougainville) and some 600smaller islands, most of which are located to the east. It is a country rich in natural resourceswith gold, copper, agricultural products, and recently oil and natural gas. It is also a country ofconsiderable biodiversity, which is estimated to comprise between 5-7% of the globalbiodiversity and also regional variations on most cultural, geographical and developmentaldimensions. However, as a small economy, sustainable development is heavily influenced bylocal, provincial, national and international agendas. Table 1.1 shows some key statistics of thecountry’s national circumstances.
GEOGRAPHY
Papua New Guinea is a unique country in many ways. The main land has one of the most ruggedterrains in the world. There is a central mountain range which is highly dissected, with thehighest peak rising to 4,350 m (Mt. Wilhelm) and smaller islands include high volcanicmountains and low lying coral atolls. Types of environments range from mountain glaciers tohumid tropical rainforests, swampy wetlands to pristine coral reefs. Much of the terrain is
6
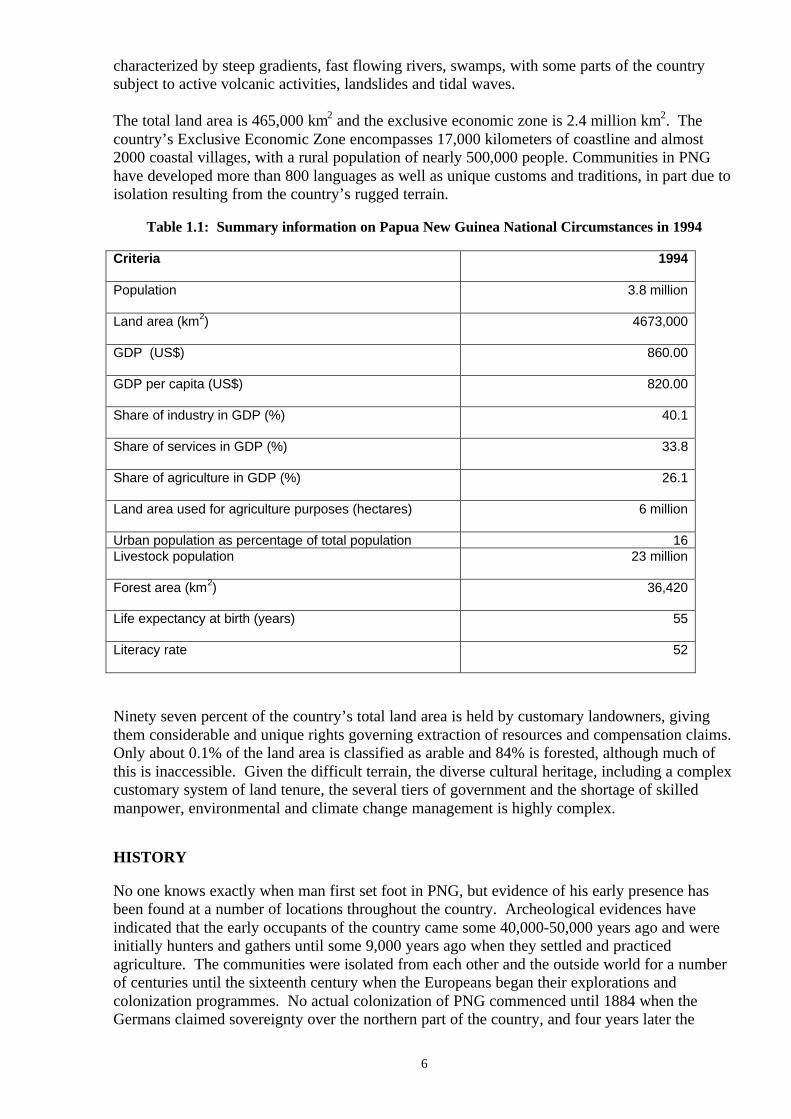
characterized by steep gradients, fast flowing rivers, swamps, with some parts of the countrysubject to active volcanic activities, landslides and tidal waves.
The total land area is 465,000 km2 and the exclusive economic zone is 2.4 million km2. Thecountry’s Exclusive Economic Zone encompasses 17,000 kilometers of coastline and almost2000 coastal villages, with a rural population of nearly 500,000 people. Communities in PNGhave developed more than 800 languages as well as unique customs and traditions, in part due toisolation resulting from the country’s rugged terrain.
Table 1.1: Summary information on Papua New Guinea National Circumstances in 1994
Criteria 1994
Population 3.8 million
Land area (km2) 4673,000
GDP (US$) 860.00
GDP per capita (US$) 820.00
Share of industry in GDP (%) 40.1
Share of services in GDP (%) 33.8
Share of agriculture in GDP (%) 26.1
Land area used for agriculture purposes (hectares) 6 million
Urban population as percentage of total population 16Livestock population 23 million
Forest area (km2) 36,420
Life expectancy at birth (years) 55
Literacy rate 52
Ninety seven percent of the country’s total land area is held by customary landowners, givingthem considerable and unique rights governing extraction of resources and compensation claims.Only about 0.1% of the land area is classified as arable and 84% is forested, although much ofthis is inaccessible. Given the difficult terrain, the diverse cultural heritage, including a complexcustomary system of land tenure, the several tiers of government and the shortage of skilledmanpower, environmental and climate change management is highly complex.
HISTORY
No one knows exactly when man first set foot in PNG, but evidence of his early presence hasbeen found at a number of locations throughout the country. Archeological evidences haveindicated that the early occupants of the country came some 40,000-50,000 years ago and wereinitially hunters and gathers until some 9,000 years ago when they settled and practicedagriculture. The communities were isolated from each other and the outside world for a numberof centuries until the sixteenth century when the Europeans began their explorations andcolonization programmes. No actual colonization of PNG commenced until 1884 when theGermans claimed sovereignty over the northern part of the country, and four years later the
7
British claimed the southern part and governed them as two separate colonies: German NewGuinea and British Papua.
At the end of the First World War in 1919, Australia took over the administration of bothcolonies as the Trust Territories of Papua and New Guinea under the mandate of the League ofNations. In 1942 when the Second World War came to the Pacific, the Japanese took over thenorthern Territory of New Guinea until the end of the war when Australia again took control.Australia continued its administration of both territories until 1973 when the two territoriesbecame united and gained self-government. In 1975 Papua New Guinea gained politicalindependence from Australia.
The overall picture of change in PNG since independence is one of a gradual broadening of asmall, fragmented economy, based on natural resource production. Today, after 25 years of selfrule, the major pressures being exerted on the environment are accelerated population growthand the extraction of natural resources to provide for the physical and growing needs of thecountry.
The progression from an economy based on complex farming and subsistence systems to aformal capitalistic economy over the last 100 years has seen rapid change throughout many partsof the country.
CLIMATE AND WEATHER
INFLUENCE OF CLIMATE AND WEATHER ON PAPUA NEW GUINEA.
The oceans and land masses surrounding the country are the key determinants of its weather andclimate. Key factors, in order of significance, are:
(i) Excess heating due to incoming solar radiation at the equator where the ocean-atmosphere interactions provide the favorable moisture source for abundantprecipitation typical of tropical environments.
(ii) Year to year variability of the tropical east- west or walker circulation. PNG liesat the heart of the region where the warm air rises and flows eastwards in theupper troposphere to subside in the eastern pacific high pressure system and thenwestwards in the surface layers across the tropical pacific ocean. In so called ElNiño years this pattern is disrupted, the central and eastern pacific warm ("warmpool") and the main area of ascent associated with cloud and high rainfall movesto the central Pacific.
(iii) Location, just north of the Australian continent. Despite its tropical location andexpected deep tropical weather, the south coasts of the mainland are actually dryover the period corresponding to the Southern Hemisphere winter.
The prevailing southeast trade winds during the months June to October act as a medium for dryair movement responsible for dry conditions over this period. The influence of this southeasttrade winds gradually fade towards the equator where deep tropical weather dominates. Over theremaining months from December – April, which correspond to the southern summer, the majorinfluences are the northwest monsoons originating in Asia. This airflow transports moist humidair and provides abundant moisture over the whole country, thereby enhancing precipitation overthis period. Coupled with the warm sea surfaces of the Southern Hemisphere during the periodand other factors, this is also the cyclone season. In between the two seasons are months wherethe wind regimes are less dominant. These are referred to as transitional months, such as the
8
month of May immediately after the North West monsoon season and the months of October andNovember just preceding the North West monsoon season or just after the south east season.
(iv) Topography including the orientation of major mountain ranges. The main islandof New Guinea lies in the west/east direction, while most of the ranges are alignedin a NW/SE direction. Periodic diurnal shifts in the wind direction may thereforehave a real potential to alter the rainfall pattern of any given location.
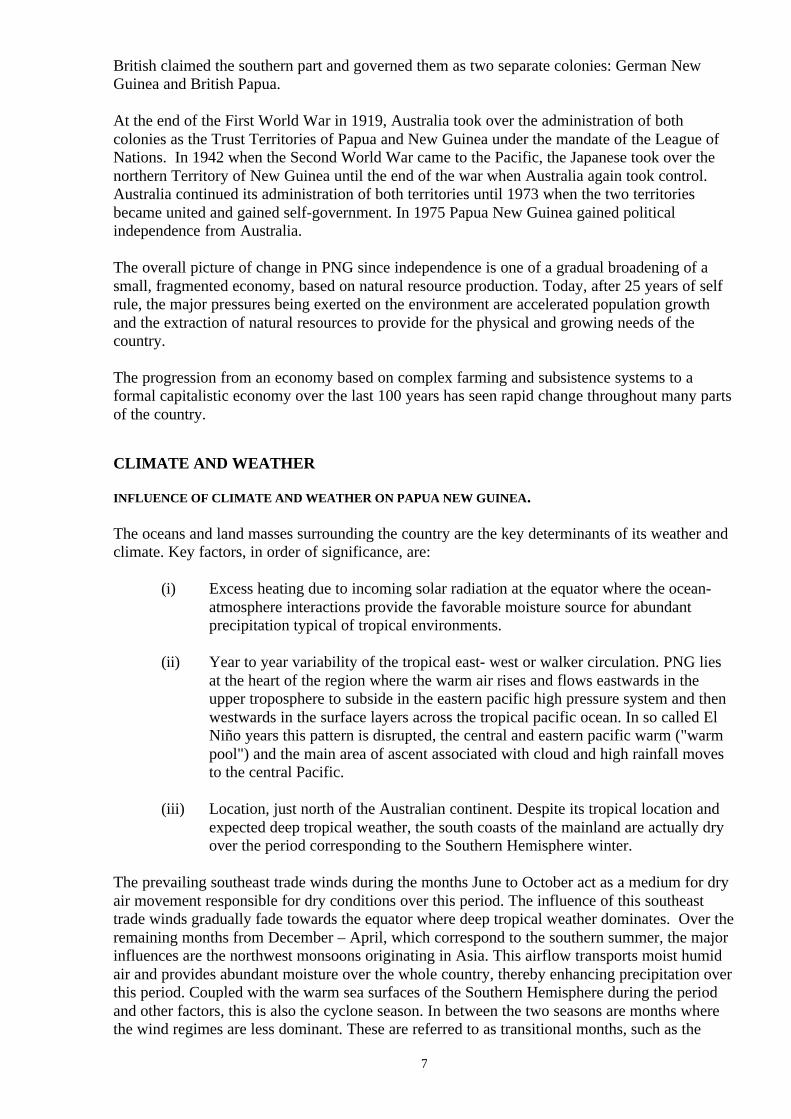
The Papua New Guinea Weather Service (PNGNWS) is mandated to collect and archive data onweather, climate change, variability and sea level rise for research, predictions, marine forecastsand economic applications. There are 13 established meteorological observation stations networkaround the country staffed with a total of 95 professional and technical officers (plus supportstaff). The stations include: Port Moresby, Daru, Kiunga, Gurney (Milne Bay), Misima (MilneBay) Nadzap (Lae), Madang, Vanimo, Momotee (Manus), Kavieng, Tokua (Rabaul), Wewakand Hoskins (see Figure 1.2 below). Port Moresby is the headquarters of the National WeatherServices under the Ministry of Civil Aviation. All the data and information on weather, climatevariability, change and sea level is quality controlled, and archived in the PNGNWS climatedatabase.
Figure 1.2 National Meteorological Network (Source: NWS)
COUNTRY AND PROVINCIAL CLIMATE TRENDS
The PNGNWS existing network is 90% aviation oriented. The data and information from thenetwork provide some understanding of the climate and weather from the atoll islands, to coastalprovinces and into the hinterlands. Due to limited data from the highlands region, thetemperature and precipitation patterns have been derived by extrapolating data from the southernPapuan coasts. Furthermore, there is a popular consensus that the potential climate variabilityand any changes in climate being sought in PNG are predominantly related to the ENSOphenomenon.
TEMPERATURE
Global average surface temperature analyses indicated that the weather and climate waschanging all over the world (see Figure 1.3 IPCC, 1995), and that the issue needed moreresearch to improve the understanding on the science of climate change, variability and sea levelrise. This meant that the individual countries, like PNG needs to address this global challenge.
9
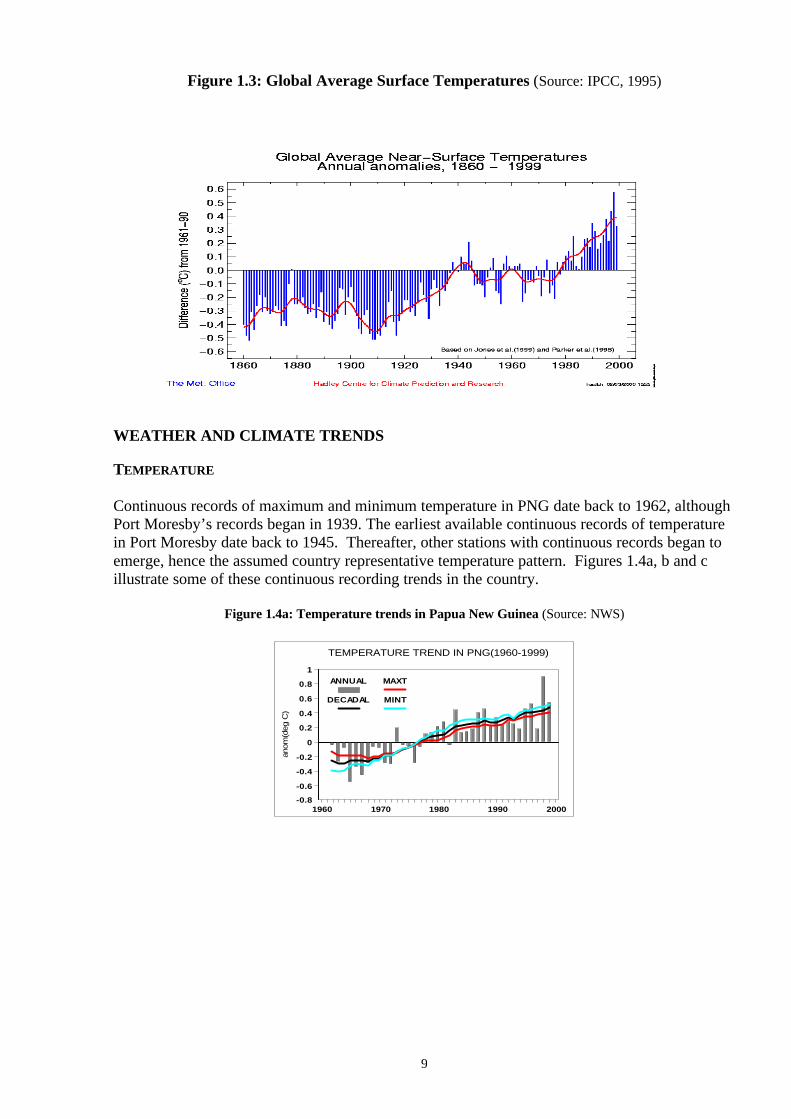
Figure 1.3: Global Average Surface Temperatures (Source: IPCC, 1995)
WEATHER AND CLIMATE TRENDS
TEMPERATURE
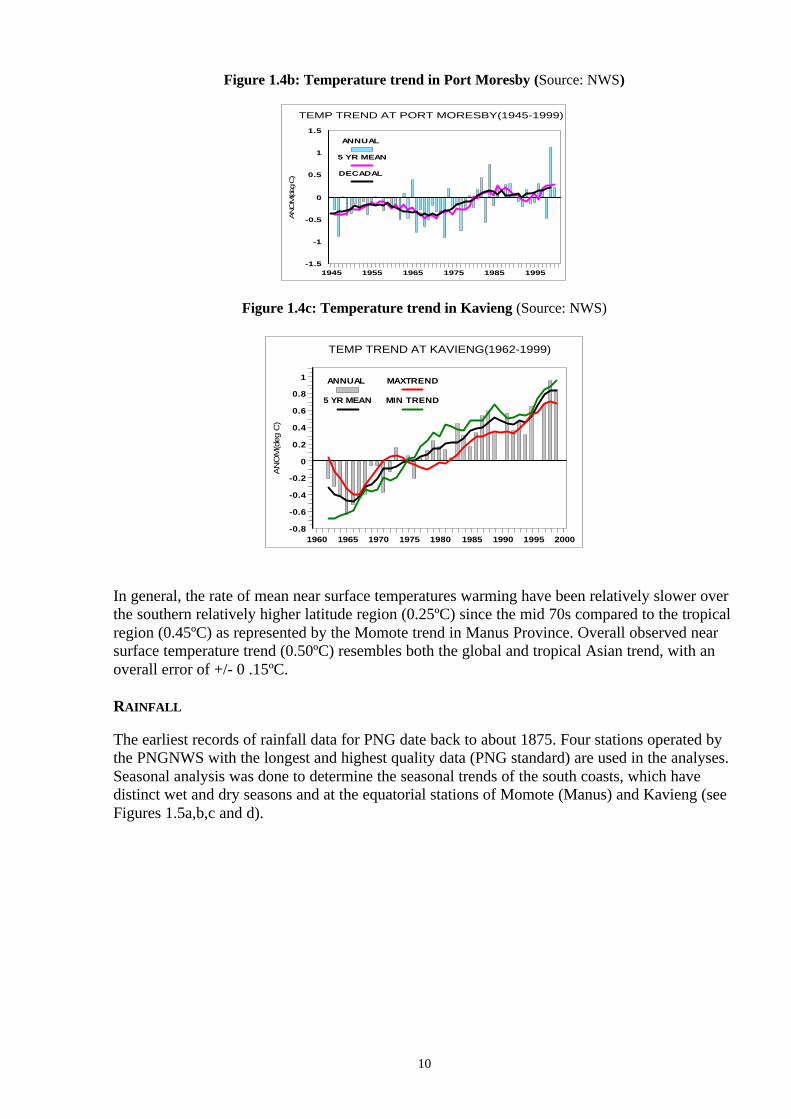
Continuous records of maximum and minimum temperature in PNG date back to 1962, althoughPort Moresby’s records began in 1939. The earliest available continuous records of temperaturein Port Moresby date back to 1945. Thereafter, other stations with continuous records began toemerge, hence the assumed country representative temperature pattern. Figures 1.4a, b and cillustrate some of these continuous recording trends in the country.
Figure 1.4a: Temperature trends in Papua New Guinea (Source: NWS)
1960 1970 1980 1990 2000-0.8
-0.6
-0.4
-0.2
0
0.2
0.4
0.6
0.8
1
anom
(deg
C)
ANNUAL
DECADAL
MAXT
MINT
TEMPERATURE TREND IN PNG(1960-1999)
10
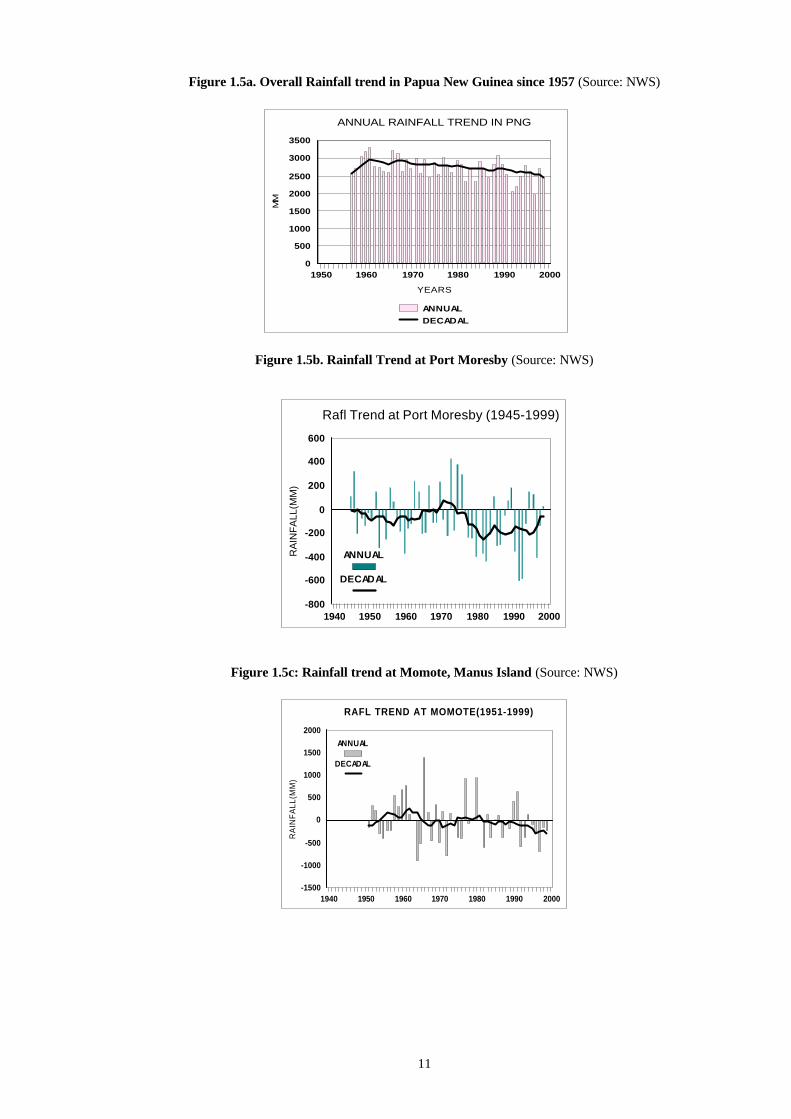
Figure 1.4b: Temperature trend in Port Moresby (Source: NWS)
1945 1955 1965 1975 1985 1995-1.5
-1
-0.5
0
0.5
1
1.5
ANO
M(deg
C)
ANNUAL
5 YR MEAN
DECADAL
TEMP TREND AT PORT MORESBY(1945-1999)
Figure 1.4c: Temperature trend in Kavieng (Source: NWS)
1960 1965 1970 1975 1980 1985 1990 1995 2000-0.8
-0.6
-0.4
-0.2
0
0.2
0.4
0.6
0.8
1
AN
OM
(deg
C)
ANNUAL
5 YR MEAN
MAXTREND
MIN TREND
TEMP TREND AT KAVIENG(1962-1999)
In general, the rate of mean near surface temperatures warming have been relatively slower overthe southern relatively higher latitude region (0.25ºC) since the mid 70s compared to the tropicalregion (0.45ºC) as represented by the Momote trend in Manus Province. Overall observed nearsurface temperature trend (0.50ºC) resembles both the global and tropical Asian trend, with anoverall error of +/- 0 .15ºC.
RAINFALL
The earliest records of rainfall data for PNG date back to about 1875. Four stations operated bythe PNGNWS with the longest and highest quality data (PNG standard) are used in the analyses.Seasonal analysis was done to determine the seasonal trends of the south coasts, which havedistinct wet and dry seasons and at the equatorial stations of Momote (Manus) and Kavieng (seeFigures 1.5a,b,c and d).
11
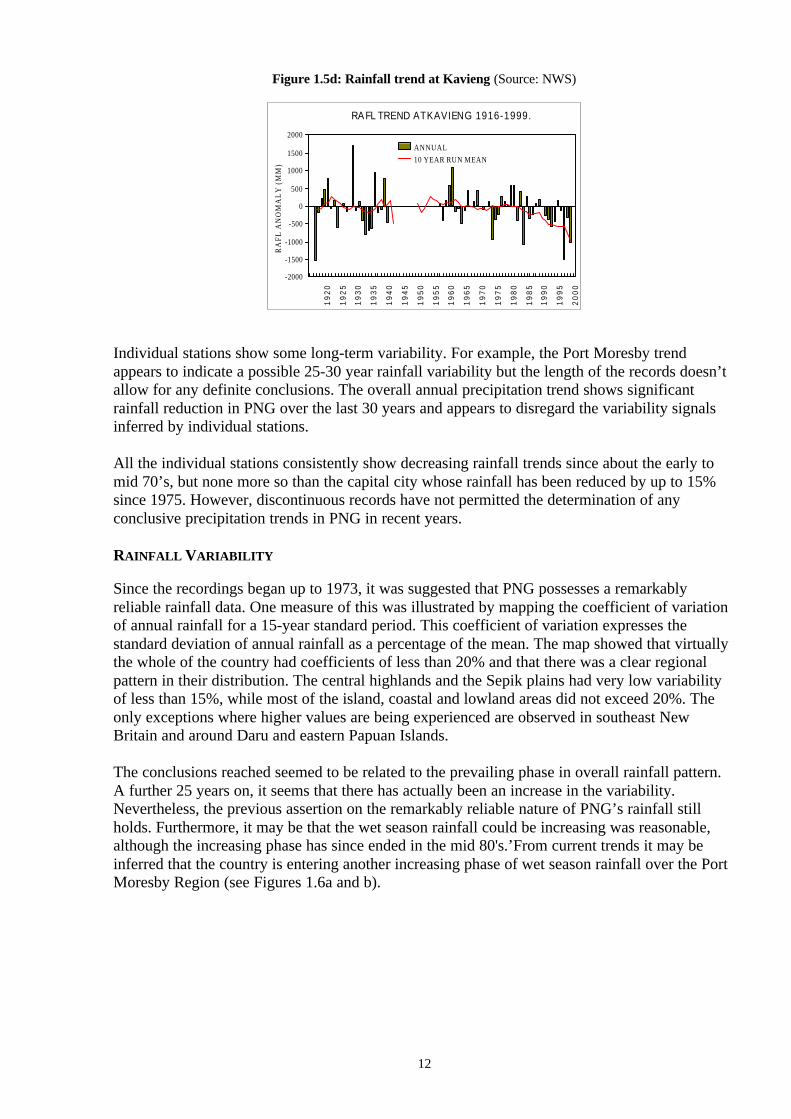
Figure 1.5a. Overall Rainfall trend in Papua New Guinea since 1957 (Source: NWS)
1950 1960 1970 1980 1990 2000
YEARS
0
500
1000
1500
2000
2500
3000
3500
MM
ANNUALDECADAL
ANNUAL RAINFALL TREND IN PNG
Figure 1.5b. Rainfall Trend at Port Moresby (Source: NWS)
1940 1950 1960 1970 1980 1990 2000-800
-600
-400
-200
0
200
400
600
RA
INF
ALL
(MM
)
ANNUAL
DECADAL
Rafl Trend at Port Moresby (1945-1999)
Figure 1.5c: Rainfall trend at Momote, Manus Island (Source: NWS)
1940 1950 1960 1970 1980 1990 2000-1500
-1000
-500
0
500
1000
1500
2000
RA
INF
ALL
(MM
)
ANNUAL
DECADAL
RAFL TREND AT MOMOTE(1951-1999)
12
Figure 1.5d: Rainfall trend at Kavieng (Source: NWS)
19
20
19
25
19
30
19
35
19
40
19
45
19
50
19
55
19
60
19
65
19
70
19
75
19
80
19
85
19
90
19
95
20
00
-2000
-1500
-1000
-500
0
500
1000
1500
2000
RA
FL A
NO
MA
LY
(M
M)
ANNUAL10 YEAR RUN MEAN
RA FL TREND ATKAVIENG 1916-1999.
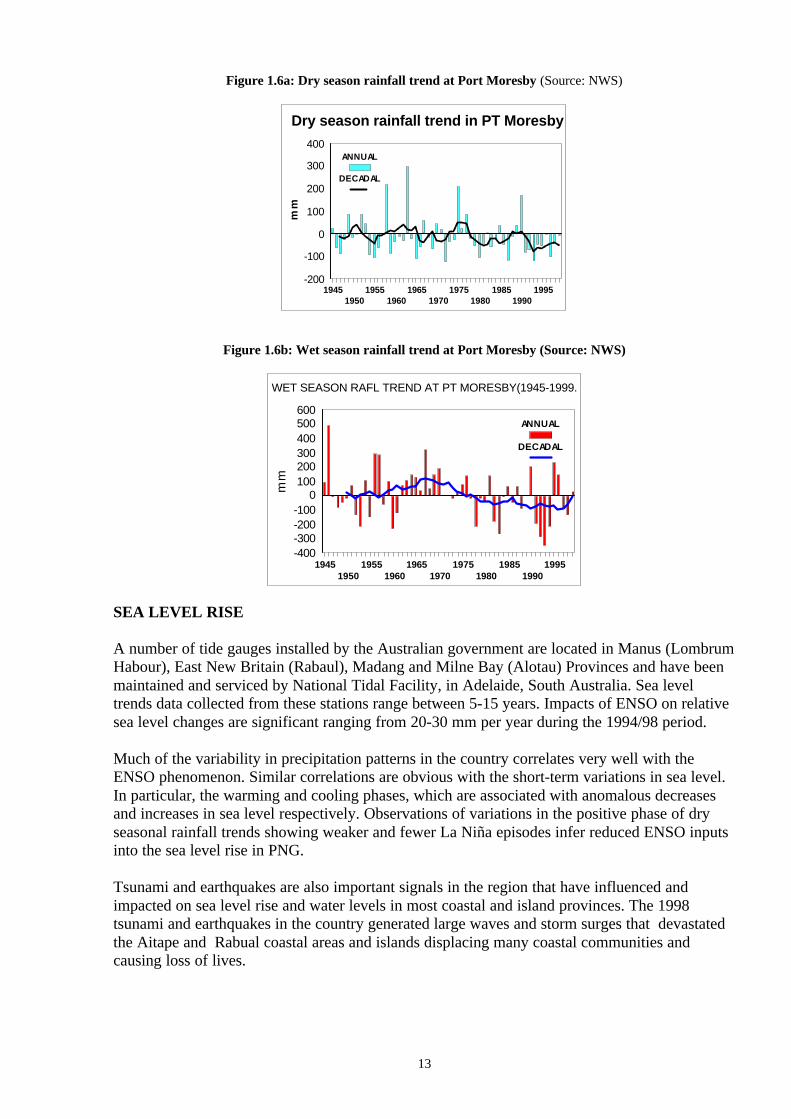
Individual stations show some long-term variability. For example, the Port Moresby trendappears to indicate a possible 25-30 year rainfall variability but the length of the records doesn’tallow for any definite conclusions. The overall annual precipitation trend shows significantrainfall reduction in PNG over the last 30 years and appears to disregard the variability signalsinferred by individual stations.
All the individual stations consistently show decreasing rainfall trends since about the early tomid 70’s, but none more so than the capital city whose rainfall has been reduced by up to 15%since 1975. However, discontinuous records have not permitted the determination of anyconclusive precipitation trends in PNG in recent years.
RAINFALL VARIABILITY
Since the recordings began up to 1973, it was suggested that PNG possesses a remarkablyreliable rainfall data. One measure of this was illustrated by mapping the coefficient of variationof annual rainfall for a 15-year standard period. This coefficient of variation expresses thestandard deviation of annual rainfall as a percentage of the mean. The map showed that virtuallythe whole of the country had coefficients of less than 20% and that there was a clear regionalpattern in their distribution. The central highlands and the Sepik plains had very low variabilityof less than 15%, while most of the island, coastal and lowland areas did not exceed 20%. Theonly exceptions where higher values are being experienced are observed in southeast NewBritain and around Daru and eastern Papuan Islands.
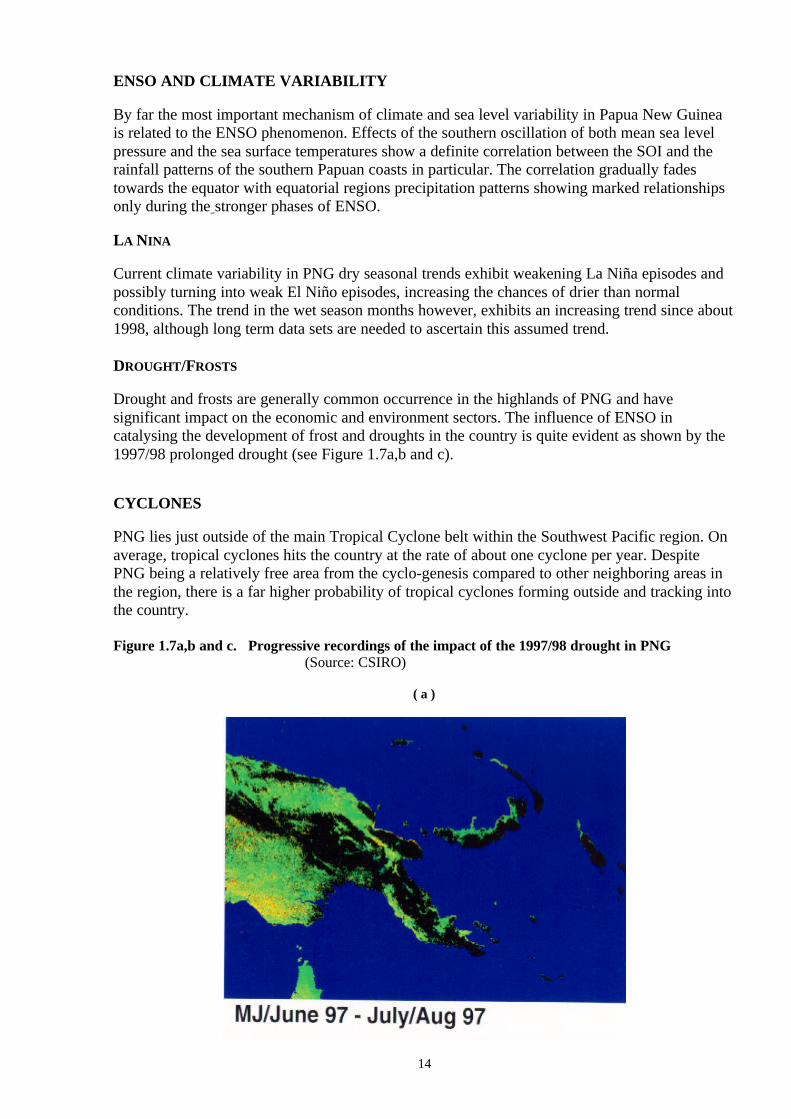
The conclusions reached seemed to be related to the prevailing phase in overall rainfall pattern.A further 25 years on, it seems that there has actually been an increase in the variability.Nevertheless, the previous assertion on the remarkably reliable nature of PNG’s rainfall stillholds. Furthermore, it may be that the wet season rainfall could be increasing was reasonable,although the increasing phase has since ended in the mid 80's.’From current trends it may beinferred that the country is entering another increasing phase of wet season rainfall over the PortMoresby Region (see Figures 1.6a and b).
13
Figure 1.6a: Dry season rainfall trend at Port Moresby (Source: NWS)
19451950
19551960
19651970
19751980
19851990
1995-200
-100
0
100
200
300
400
mm
ANNUAL
DECADAL
Dry season rainfall trend in PT Moresby
Figure 1.6b: Wet season rainfall trend at Port Moresby (Source: NWS)
19451950
19551960
19651970
19751980
19851990
1995-400-300-200-100
0100200300400500600
mm
ANNUAL
DECADAL
WET SEASON RAFL TREND AT PT MORESBY(1945-1999.
SEA LEVEL RISE
A number of tide gauges installed by the Australian government are located in Manus (LombrumHabour), East New Britain (Rabaul), Madang and Milne Bay (Alotau) Provinces and have beenmaintained and serviced by National Tidal Facility, in Adelaide, South Australia. Sea leveltrends data collected from these stations range between 5-15 years. Impacts of ENSO on relativesea level changes are significant ranging from 20-30 mm per year during the 1994/98 period.
Much of the variability in precipitation patterns in the country correlates very well with theENSO phenomenon. Similar correlations are obvious with the short-term variations in sea level.In particular, the warming and cooling phases, which are associated with anomalous decreasesand increases in sea level respectively. Observations of variations in the positive phase of dryseasonal rainfall trends showing weaker and fewer La Niña episodes infer reduced ENSO inputsinto the sea level rise in PNG.
Tsunami and earthquakes are also important signals in the region that have influenced andimpacted on sea level rise and water levels in most coastal and island provinces. The 1998tsunami and earthquakes in the country generated large waves and storm surges that devastatedthe Aitape and Rabual coastal areas and islands displacing many coastal communities andcausing loss of lives.
14
ENSO AND CLIMATE VARIABILITY
By far the most important mechanism of climate and sea level variability in Papua New Guineais related to the ENSO phenomenon. Effects of the southern oscillation of both mean sea levelpressure and the sea surface temperatures show a definite correlation between the SOI and therainfall patterns of the southern Papuan coasts in particular. The correlation gradually fadestowards the equator with equatorial regions precipitation patterns showing marked relationshipsonly during the stronger phases of ENSO.
LA NINA
Current climate variability in PNG dry seasonal trends exhibit weakening La Niña episodes andpossibly turning into weak El Niño episodes, increasing the chances of drier than normalconditions. The trend in the wet season months however, exhibits an increasing trend since about1998, although long term data sets are needed to ascertain this assumed trend.
DROUGHT/FROSTS
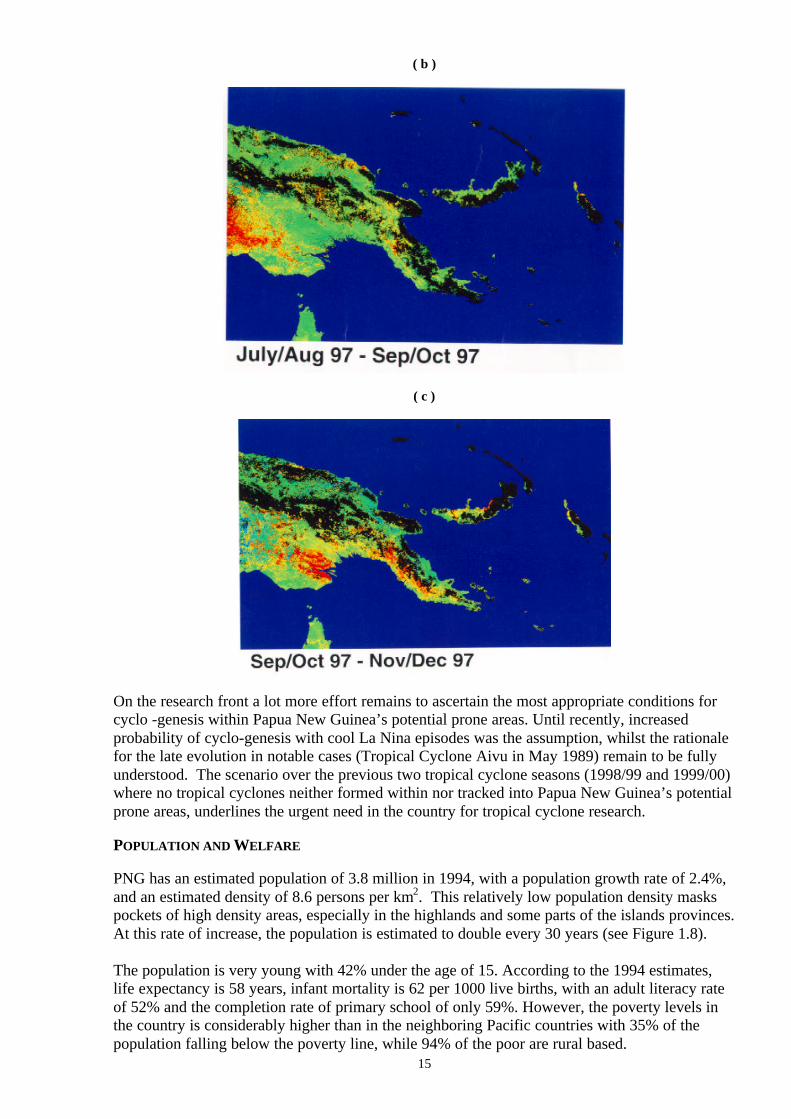
Drought and frosts are generally common occurrence in the highlands of PNG and havesignificant impact on the economic and environment sectors. The influence of ENSO incatalysing the development of frost and droughts in the country is quite evident as shown by the1997/98 prolonged drought (see Figure 1.7a,b and c).
CYCLONES
PNG lies just outside of the main Tropical Cyclone belt within the Southwest Pacific region. Onaverage, tropical cyclones hits the country at the rate of about one cyclone per year. DespitePNG being a relatively free area from the cyclo-genesis compared to other neighboring areas inthe region, there is a far higher probability of tropical cyclones forming outside and tracking intothe country.
Figure 1.7a,b and c. Progressive recordings of the impact of the 1997/98 drought in PNG(Source: CSIRO)
( a )
15
( b )
( c )
On the research front a lot more effort remains to ascertain the most appropriate conditions forcyclo -genesis within Papua New Guinea’s potential prone areas. Until recently, increasedprobability of cyclo-genesis with cool La Nina episodes was the assumption, whilst the rationalefor the late evolution in notable cases (Tropical Cyclone Aivu in May 1989) remain to be fullyunderstood. The scenario over the previous two tropical cyclone seasons (1998/99 and 1999/00)where no tropical cyclones neither formed within nor tracked into Papua New Guinea’s potentialprone areas, underlines the urgent need in the country for tropical cyclone research.
POPULATION AND WELFARE
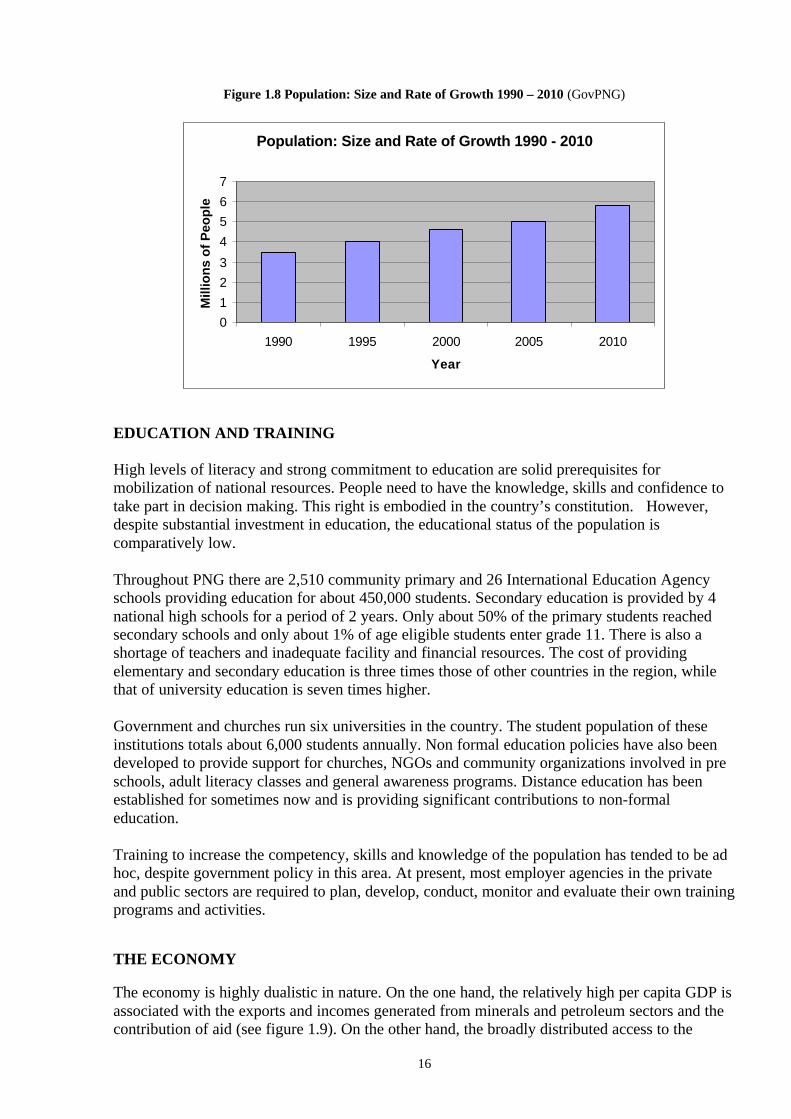
PNG has an estimated population of 3.8 million in 1994, with a population growth rate of 2.4%,and an estimated density of 8.6 persons per km2. This relatively low population density maskspockets of high density areas, especially in the highlands and some parts of the islands provinces.At this rate of increase, the population is estimated to double every 30 years (see Figure 1.8).
The population is very young with 42% under the age of 15. According to the 1994 estimates,life expectancy is 58 years, infant mortality is 62 per 1000 live births, with an adult literacy rateof 52% and the completion rate of primary school of only 59%. However, the poverty levels inthe country is considerably higher than in the neighboring Pacific countries with 35% of thepopulation falling below the poverty line, while 94% of the poor are rural based.
16
Figure 1.8 Population: Size and Rate of Growth 1990 – 2010 (GovPNG)
Population: Size and Rate of Growth 1990 - 2010
0
1
2
3
4
5
6
7
1990 1995 2000 2005 2010
Year
Mill
ion
s o
f Peo
ple
EDUCATION AND TRAINING
High levels of literacy and strong commitment to education are solid prerequisites formobilization of national resources. People need to have the knowledge, skills and confidence totake part in decision making. This right is embodied in the country’s constitution. However,despite substantial investment in education, the educational status of the population iscomparatively low.
Throughout PNG there are 2,510 community primary and 26 International Education Agencyschools providing education for about 450,000 students. Secondary education is provided by 4national high schools for a period of 2 years. Only about 50% of the primary students reachedsecondary schools and only about 1% of age eligible students enter grade 11. There is also ashortage of teachers and inadequate facility and financial resources. The cost of providingelementary and secondary education is three times those of other countries in the region, whilethat of university education is seven times higher.
Government and churches run six universities in the country. The student population of theseinstitutions totals about 6,000 students annually. Non formal education policies have also beendeveloped to provide support for churches, NGOs and community organizations involved in preschools, adult literacy classes and general awareness programs. Distance education has beenestablished for sometimes now and is providing significant contributions to non-formaleducation.
Training to increase the competency, skills and knowledge of the population has tended to be adhoc, despite government policy in this area. At present, most employer agencies in the privateand public sectors are required to plan, develop, conduct, monitor and evaluate their own trainingprograms and activities.
THE ECONOMY
The economy is highly dualistic in nature. On the one hand, the relatively high per capita GDP isassociated with the exports and incomes generated from minerals and petroleum sectors and thecontribution of aid (see figure 1.9). On the other hand, the broadly distributed access to the
17
natural resource base provides the basic needs of people, but not necessarily real growth perperson.
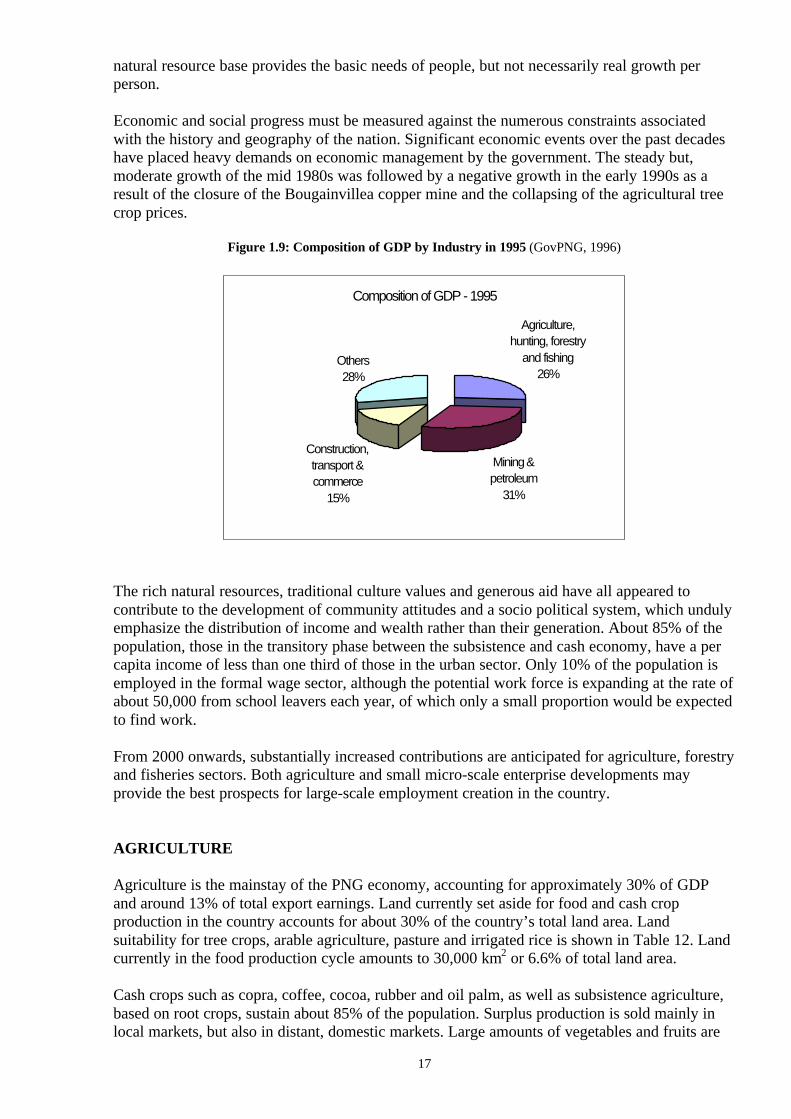
Economic and social progress must be measured against the numerous constraints associatedwith the history and geography of the nation. Significant economic events over the past decadeshave placed heavy demands on economic management by the government. The steady but,moderate growth of the mid 1980s was followed by a negative growth in the early 1990s as aresult of the closure of the Bougainvillea copper mine and the collapsing of the agricultural treecrop prices.
Figure 1.9: Composition of GDP by Industry in 1995 (GovPNG, 1996)
Composition of GDP - 1995
Agriculture, hunting, forestry
and fishing26%
Mining & petroleum
31%
Construction, transport & commerce
15%
Others28%
The rich natural resources, traditional culture values and generous aid have all appeared tocontribute to the development of community attitudes and a socio political system, which undulyemphasize the distribution of income and wealth rather than their generation. About 85% of thepopulation, those in the transitory phase between the subsistence and cash economy, have a percapita income of less than one third of those in the urban sector. Only 10% of the population isemployed in the formal wage sector, although the potential work force is expanding at the rate ofabout 50,000 from school leavers each year, of which only a small proportion would be expectedto find work.
From 2000 onwards, substantially increased contributions are anticipated for agriculture, forestryand fisheries sectors. Both agriculture and small micro-scale enterprise developments mayprovide the best prospects for large-scale employment creation in the country.
AGRICULTURE
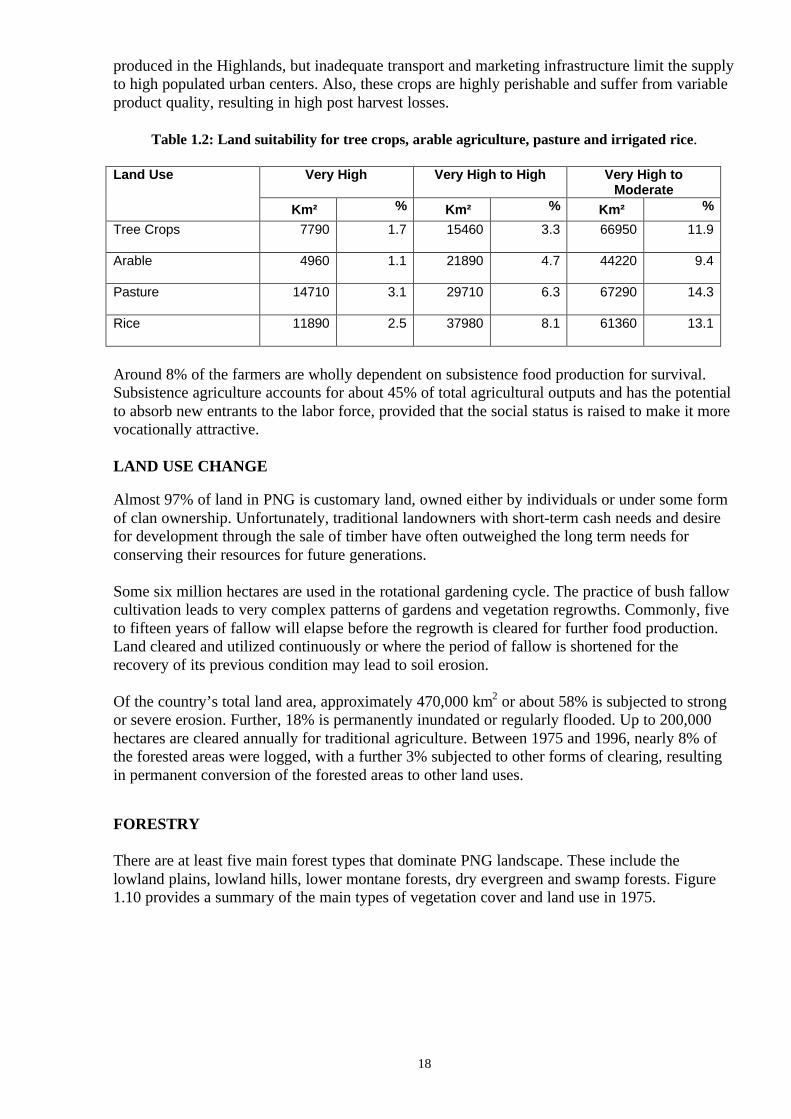
Agriculture is the mainstay of the PNG economy, accounting for approximately 30% of GDPand around 13% of total export earnings. Land currently set aside for food and cash cropproduction in the country accounts for about 30% of the country’s total land area. Landsuitability for tree crops, arable agriculture, pasture and irrigated rice is shown in Table 12. Landcurrently in the food production cycle amounts to 30,000 km2 or 6.6% of total land area.
Cash crops such as copra, coffee, cocoa, rubber and oil palm, as well as subsistence agriculture,based on root crops, sustain about 85% of the population. Surplus production is sold mainly inlocal markets, but also in distant, domestic markets. Large amounts of vegetables and fruits are
18
produced in the Highlands, but inadequate transport and marketing infrastructure limit the supplyto high populated urban centers. Also, these crops are highly perishable and suffer from variableproduct quality, resulting in high post harvest losses.
Table 1.2: Land suitability for tree crops, arable agriculture, pasture and irrigated rice.
Very High Very High to High Very High toModerate
Land Use
Km² % Km² % Km² %
Tree Crops 7790 1.7 15460 3.3 66950 11.9
Arable 4960 1.1 21890 4.7 44220 9.4
Pasture 14710 3.1 29710 6.3 67290 14.3
Rice 11890 2.5 37980 8.1 61360 13.1
Around 8% of the farmers are wholly dependent on subsistence food production for survival.Subsistence agriculture accounts for about 45% of total agricultural outputs and has the potentialto absorb new entrants to the labor force, provided that the social status is raised to make it morevocationally attractive.
LAND USE CHANGE
Almost 97% of land in PNG is customary land, owned either by individuals or under some formof clan ownership. Unfortunately, traditional landowners with short-term cash needs and desirefor development through the sale of timber have often outweighed the long term needs forconserving their resources for future generations.
Some six million hectares are used in the rotational gardening cycle. The practice of bush fallowcultivation leads to very complex patterns of gardens and vegetation regrowths. Commonly, fiveto fifteen years of fallow will elapse before the regrowth is cleared for further food production.Land cleared and utilized continuously or where the period of fallow is shortened for therecovery of its previous condition may lead to soil erosion.
Of the country’s total land area, approximately 470,000 km2 or about 58% is subjected to strongor severe erosion. Further, 18% is permanently inundated or regularly flooded. Up to 200,000hectares are cleared annually for traditional agriculture. Between 1975 and 1996, nearly 8% ofthe forested areas were logged, with a further 3% subjected to other forms of clearing, resultingin permanent conversion of the forested areas to other land uses.
FORESTRY
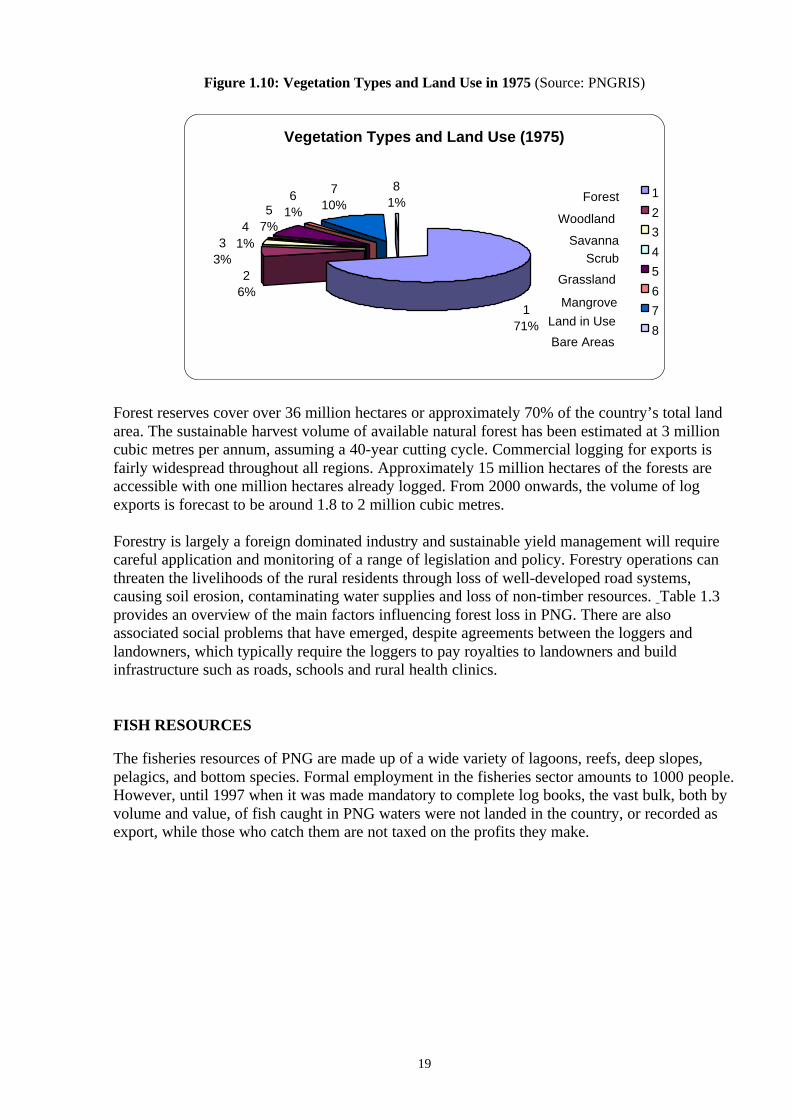
There are at least five main forest types that dominate PNG landscape. These include thelowland plains, lowland hills, lower montane forests, dry evergreen and swamp forests. Figure1.10 provides a summary of the main types of vegetation cover and land use in 1975.
19
Figure 1.10: Vegetation Types and Land Use in 1975 (Source: PNGRIS)
Vegetation Types and Land Use (1975)
171%
26%
57%
61%
710%
81%
41%3
3%
1
2
3
4
5
6
7
8
Forest
Woodland
SavannaScrub
Grassland
MangroveLand in Use
Bare Areas
Forest reserves cover over 36 million hectares or approximately 70% of the country’s total landarea. The sustainable harvest volume of available natural forest has been estimated at 3 millioncubic metres per annum, assuming a 40-year cutting cycle. Commercial logging for exports isfairly widespread throughout all regions. Approximately 15 million hectares of the forests areaccessible with one million hectares already logged. From 2000 onwards, the volume of logexports is forecast to be around 1.8 to 2 million cubic metres.
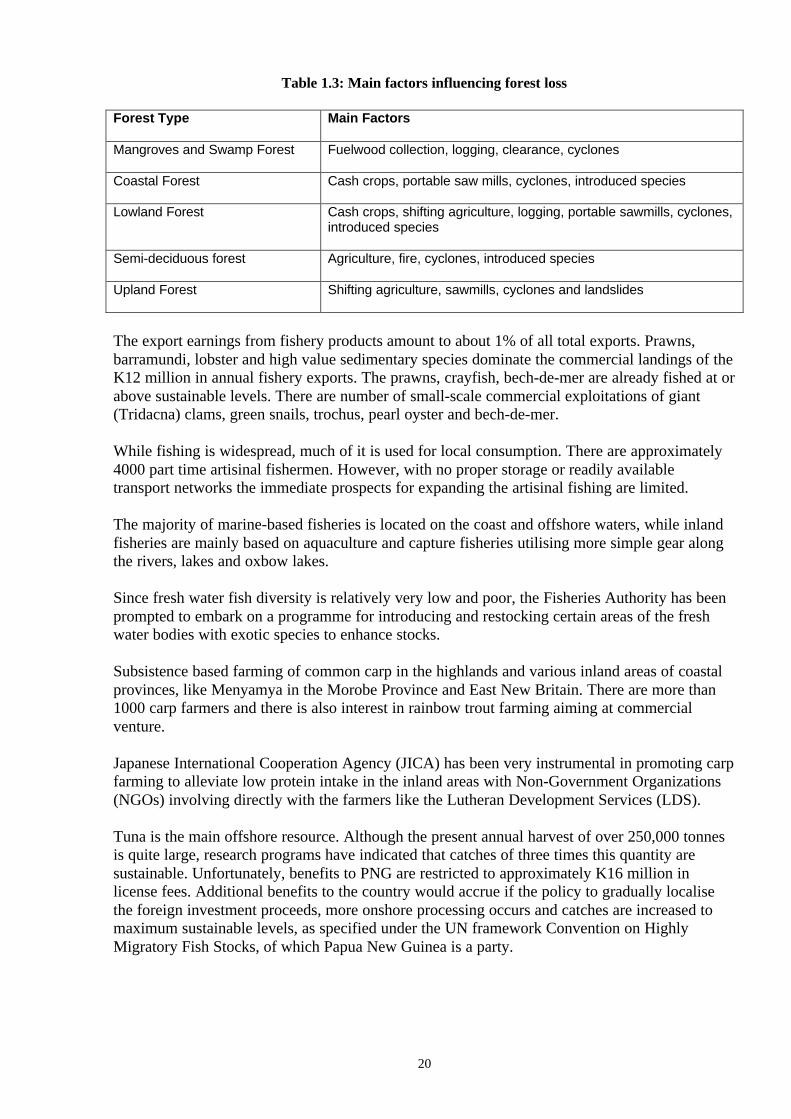
Forestry is largely a foreign dominated industry and sustainable yield management will requirecareful application and monitoring of a range of legislation and policy. Forestry operations canthreaten the livelihoods of the rural residents through loss of well-developed road systems,causing soil erosion, contaminating water supplies and loss of non-timber resources. Table 1.3provides an overview of the main factors influencing forest loss in PNG. There are alsoassociated social problems that have emerged, despite agreements between the loggers andlandowners, which typically require the loggers to pay royalties to landowners and buildinfrastructure such as roads, schools and rural health clinics.
FISH RESOURCES
The fisheries resources of PNG are made up of a wide variety of lagoons, reefs, deep slopes,pelagics, and bottom species. Formal employment in the fisheries sector amounts to 1000 people.However, until 1997 when it was made mandatory to complete log books, the vast bulk, both byvolume and value, of fish caught in PNG waters were not landed in the country, or recorded asexport, while those who catch them are not taxed on the profits they make.
20
Table 1.3: Main factors influencing forest loss
Forest Type Main Factors
Mangroves and Swamp Forest Fuelwood collection, logging, clearance, cyclones
Coastal Forest Cash crops, portable saw mills, cyclones, introduced species
Lowland Forest Cash crops, shifting agriculture, logging, portable sawmills, cyclones,introduced species
Semi-deciduous forest Agriculture, fire, cyclones, introduced species
Upland Forest Shifting agriculture, sawmills, cyclones and landslides
The export earnings from fishery products amount to about 1% of all total exports. Prawns,barramundi, lobster and high value sedimentary species dominate the commercial landings of theK12 million in annual fishery exports. The prawns, crayfish, bech-de-mer are already fished at orabove sustainable levels. There are number of small-scale commercial exploitations of giant(Tridacna) clams, green snails, trochus, pearl oyster and bech-de-mer.
While fishing is widespread, much of it is used for local consumption. There are approximately4000 part time artisinal fishermen. However, with no proper storage or readily availabletransport networks the immediate prospects for expanding the artisinal fishing are limited.
The majority of marine-based fisheries is located on the coast and offshore waters, while inlandfisheries are mainly based on aquaculture and capture fisheries utilising more simple gear alongthe rivers, lakes and oxbow lakes.
Since fresh water fish diversity is relatively very low and poor, the Fisheries Authority has beenprompted to embark on a programme for introducing and restocking certain areas of the freshwater bodies with exotic species to enhance stocks.
Subsistence based farming of common carp in the highlands and various inland areas of coastalprovinces, like Menyamya in the Morobe Province and East New Britain. There are more than1000 carp farmers and there is also interest in rainbow trout farming aiming at commercialventure.
Japanese International Cooperation Agency (JICA) has been very instrumental in promoting carpfarming to alleviate low protein intake in the inland areas with Non-Government Organizations(NGOs) involving directly with the farmers like the Lutheran Development Services (LDS).
Tuna is the main offshore resource. Although the present annual harvest of over 250,000 tonnesis quite large, research programs have indicated that catches of three times this quantity aresustainable. Unfortunately, benefits to PNG are restricted to approximately K16 million inlicense fees. Additional benefits to the country would accrue if the policy to gradually localisethe foreign investment proceeds, more onshore processing occurs and catches are increased tomaximum sustainable levels, as specified under the UN framework Convention on HighlyMigratory Fish Stocks, of which Papua New Guinea is a party.
21
COASTAL RESOURCES
PNG supports a plethora of coastal habitats, resources and environments including deltaic floodplains, estuaries, tidal flats, mangroves, beaches near shore environments such as bays, lagoons,sea grass beds, coral reefs and the offshore environment.
Of particular regional significance are the extensive and well developed mangrove systems. InPNG there some 37 species of mangroves belonging to 20 different genera, which are associatedwith the major river systems throughout the country. The most extensive of these occur along thesouthwest coast associated with the Fly, Kikori and Purari River systems. Apart from benefitssuch as opportunities for research, education, recreation and tourism development, mangrovesprovide a variety of products of direct use to the local people including firewood, buildingmaterials and medicines. Further, the mangrove forests are also important as major breedinggrounds for fishes.
While specific clan groups tend to own the land, in many areas, outside groups are free to go andcollect coastal resources. Consequently, large tracts of mangrove forests have been cut down tomake gardens and used for firewood. Opening up of mangrove canopies has resulted in theestablishment of short, stunted forms of some species.
Coral reefs in Papua New Guinea cover a total area of 40,000 km2. For the most part, the coralreefs are relatively unaffected by human activities, but this largely reflects the country’sdispersed and relatively isolated population as well as a lack of material development. Importantanthropogenic threats to PNG reefs are considered to be unsustainable fishing, including bothoverexploitation and destructive practices; sediment mobilization as a result of deforestationfrom forestry, agriculture, and other activities, as well as population increase and urbanization.Localized threats include industrial pollution, oil spills, port development, land reclamation, andship groundings.
NON RENEWABLE RESOURCES
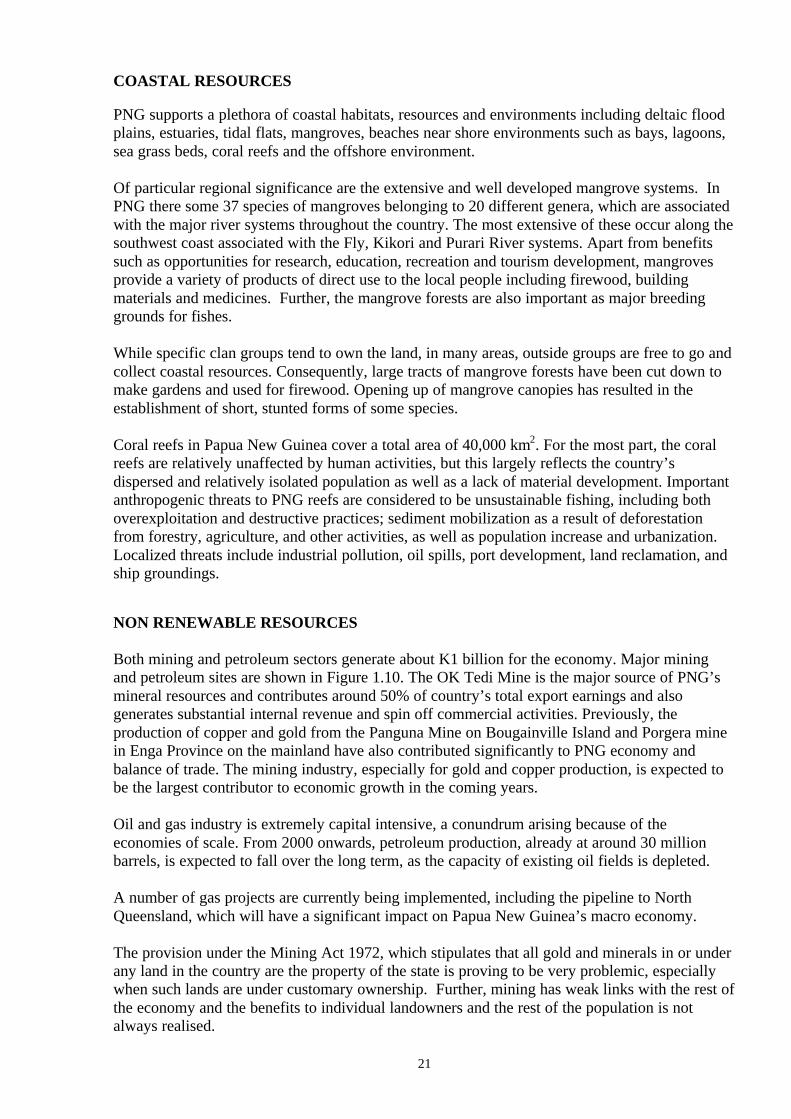
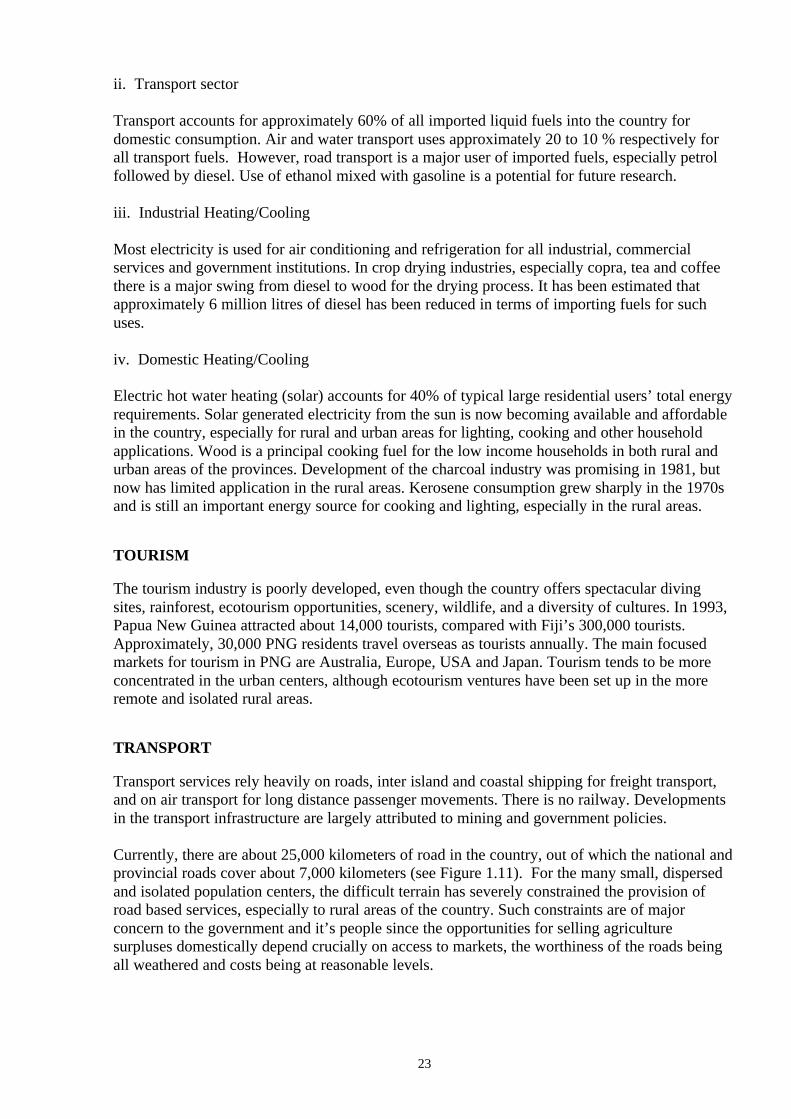
Both mining and petroleum sectors generate about K1 billion for the economy. Major miningand petroleum sites are shown in Figure 1.10. The OK Tedi Mine is the major source of PNG’smineral resources and contributes around 50% of country’s total export earnings and alsogenerates substantial internal revenue and spin off commercial activities. Previously, theproduction of copper and gold from the Panguna Mine on Bougainville Island and Porgera minein Enga Province on the mainland have also contributed significantly to PNG economy andbalance of trade. The mining industry, especially for gold and copper production, is expected tobe the largest contributor to economic growth in the coming years.
Oil and gas industry is extremely capital intensive, a conundrum arising because of theeconomies of scale. From 2000 onwards, petroleum production, already at around 30 millionbarrels, is expected to fall over the long term, as the capacity of existing oil fields is depleted.
A number of gas projects are currently being implemented, including the pipeline to NorthQueensland, which will have a significant impact on Papua New Guinea’s macro economy.
The provision under the Mining Act 1972, which stipulates that all gold and minerals in or underany land in the country are the property of the state is proving to be very problemic, especiallywhen such lands are under customary ownership. Further, mining has weak links with the rest ofthe economy and the benefits to individual landowners and the rest of the population is notalways realised.
22
Figure 1.11: Mining and Petroleum sites of Papua New Guinea (GovPNG, 1996)
ENERGY
Since independence, there has been little progress in the development of any real capacity in theenergy sector to plan and systemically develop a stable supply of energy for the country. PNG iscurrently heavily dependent on fossil fuels, with petroleum products accounting for an estimated60% of its primary energy consumption. Renewable energy, mostly hydro electricity, isestimated to contribute less than 40% of the country's energy use.
The use of fossil fuels in the country is mostly in power generation and transportation. Whiletransportation is totally dependent on it, power generation is heavily weighted towards it too.The share of fossil fuel and renewable energy in the country's power generation is 60 and 40%respectively.
It is estimated that electricity comprises only 24 % of the total energy use in PNG. Interestingly,46 % of this electricity is used in the capital city of Port Moresby. Annual consumption ofelectrical energy has rapidly increased over the years mainly due to: i) an increase in the numberof customers from industrial to household sectors; and ii) an increase in average consumption percustomer.
The principal use of primary energy source in the country includes the following:
i. Electricity generation
The use of hydro (run by rivers) backed up with standby diesel is commonly used in theprovinces and mining sectors. In addition, co-generation (use of agricultural products; e.g. oilpalm and sugar cane) are important, but are relatively small in size.
23
ii. Transport sector
Transport accounts for approximately 60% of all imported liquid fuels into the country fordomestic consumption. Air and water transport uses approximately 20 to 10 % respectively forall transport fuels. However, road transport is a major user of imported fuels, especially petrolfollowed by diesel. Use of ethanol mixed with gasoline is a potential for future research.
iii. Industrial Heating/Cooling
Most electricity is used for air conditioning and refrigeration for all industrial, commercialservices and government institutions. In crop drying industries, especially copra, tea and coffeethere is a major swing from diesel to wood for the drying process. It has been estimated thatapproximately 6 million litres of diesel has been reduced in terms of importing fuels for suchuses.
iv. Domestic Heating/Cooling
Electric hot water heating (solar) accounts for 40% of typical large residential users’ total energyrequirements. Solar generated electricity from the sun is now becoming available and affordablein the country, especially for rural and urban areas for lighting, cooking and other householdapplications. Wood is a principal cooking fuel for the low income households in both rural andurban areas of the provinces. Development of the charcoal industry was promising in 1981, butnow has limited application in the rural areas. Kerosene consumption grew sharply in the 1970sand is still an important energy source for cooking and lighting, especially in the rural areas.
TOURISM
The tourism industry is poorly developed, even though the country offers spectacular divingsites, rainforest, ecotourism opportunities, scenery, wildlife, and a diversity of cultures. In 1993,Papua New Guinea attracted about 14,000 tourists, compared with Fiji’s 300,000 tourists.Approximately, 30,000 PNG residents travel overseas as tourists annually. The main focusedmarkets for tourism in PNG are Australia, Europe, USA and Japan. Tourism tends to be moreconcentrated in the urban centers, although ecotourism ventures have been set up in the moreremote and isolated rural areas.
TRANSPORT
Transport services rely heavily on roads, inter island and coastal shipping for freight transport,and on air transport for long distance passenger movements. There is no railway. Developmentsin the transport infrastructure are largely attributed to mining and government policies.
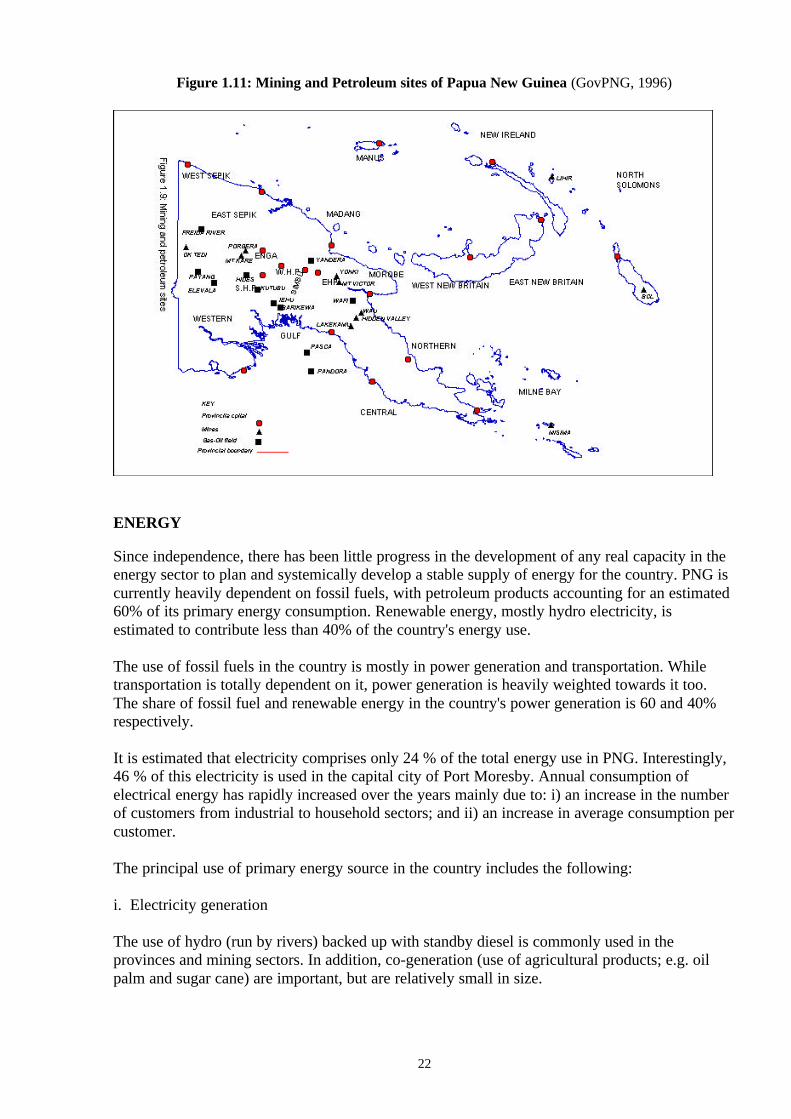
Currently, there are about 25,000 kilometers of road in the country, out of which the national andprovincial roads cover about 7,000 kilometers (see Figure 1.11). For the many small, dispersedand isolated population centers, the difficult terrain has severely constrained the provision ofroad based services, especially to rural areas of the country. Such constraints are of majorconcern to the government and it’s people since the opportunities for selling agriculturesurpluses domestically depend crucially on access to markets, the worthiness of the roads beingall weathered and costs being at reasonable levels.
24
BIODIVERSITY
The environments and biota of PNG are extremely rich, diverse and unique. It is estimated thatthe country probably harbors between 5 - 7% of the worlds’ biodiversity, which is remarkablegiven that the land mass of Papua New Guinea is less than 1% of the worlds’ total land area.
The country’s biota has biogeographic similarities to West Papua, the Solomon Islands, andnorthern Australia. The island is large enough to host many centers of endemism with more than6,789 endemic species of plants and animals, the largest of any Pacific island.
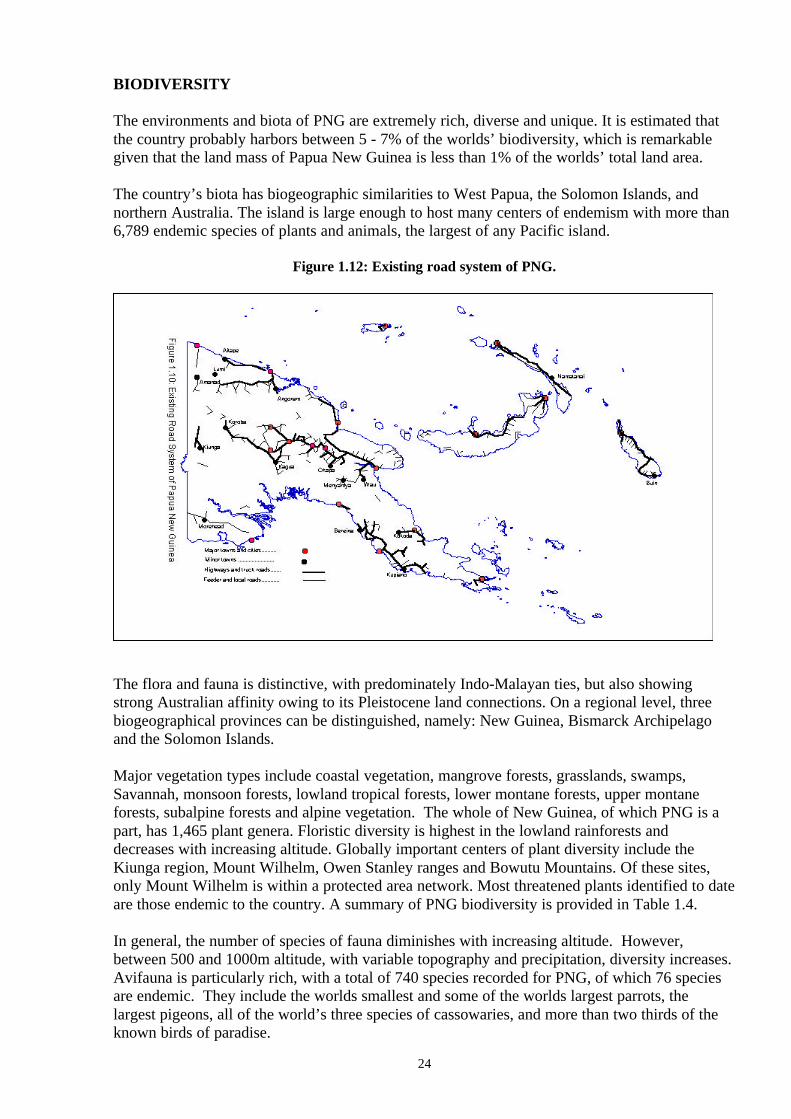
Figure 1.12: Existing road system of PNG.
The flora and fauna is distinctive, with predominately Indo-Malayan ties, but also showingstrong Australian affinity owing to its Pleistocene land connections. On a regional level, threebiogeographical provinces can be distinguished, namely: New Guinea, Bismarck Archipelagoand the Solomon Islands.
Major vegetation types include coastal vegetation, mangrove forests, grasslands, swamps,Savannah, monsoon forests, lowland tropical forests, lower montane forests, upper montaneforests, subalpine forests and alpine vegetation. The whole of New Guinea, of which PNG is apart, has 1,465 plant genera. Floristic diversity is highest in the lowland rainforests anddecreases with increasing altitude. Globally important centers of plant diversity include theKiunga region, Mount Wilhelm, Owen Stanley ranges and Bowutu Mountains. Of these sites,only Mount Wilhelm is within a protected area network. Most threatened plants identified to dateare those endemic to the country. A summary of PNG biodiversity is provided in Table 1.4.
In general, the number of species of fauna diminishes with increasing altitude. However,between 500 and 1000m altitude, with variable topography and precipitation, diversity increases.Avifauna is particularly rich, with a total of 740 species recorded for PNG, of which 76 speciesare endemic. They include the worlds smallest and some of the worlds largest parrots, thelargest pigeons, all of the world’s three species of cassowaries, and more than two thirds of theknown birds of paradise.
25
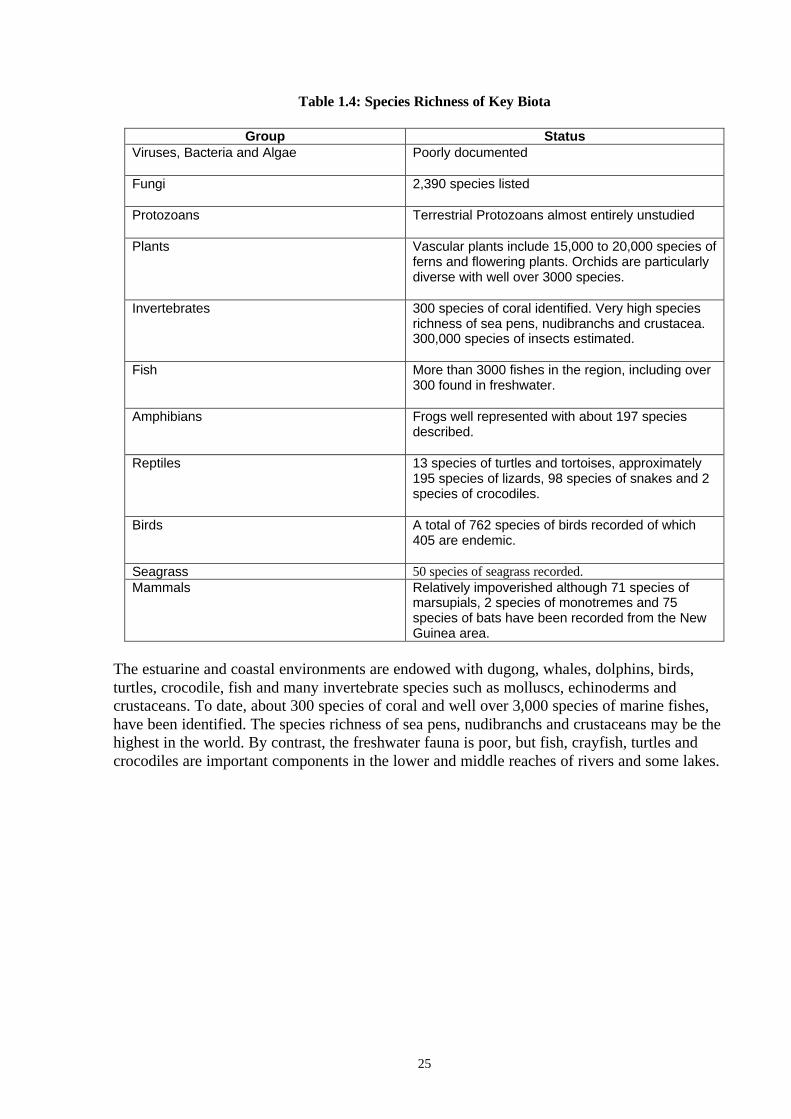
Table 1.4: Species Richness of Key Biota
Group StatusViruses, Bacteria and Algae Poorly documented
Fungi 2,390 species listed
Protozoans Terrestrial Protozoans almost entirely unstudied
Plants Vascular plants include 15,000 to 20,000 species offerns and flowering plants. Orchids are particularlydiverse with well over 3000 species.
Invertebrates 300 species of coral identified. Very high speciesrichness of sea pens, nudibranchs and crustacea.300,000 species of insects estimated.
Fish More than 3000 fishes in the region, including over300 found in freshwater.
Amphibians Frogs well represented with about 197 speciesdescribed.
Reptiles 13 species of turtles and tortoises, approximately195 species of lizards, 98 species of snakes and 2species of crocodiles.
Birds A total of 762 species of birds recorded of which405 are endemic.
Seagrass 50 species of seagrass recorded.Mammals Relatively impoverished although 71 species of
marsupials, 2 species of monotremes and 75species of bats have been recorded from the NewGuinea area.
The estuarine and coastal environments are endowed with dugong, whales, dolphins, birds,turtles, crocodile, fish and many invertebrate species such as molluscs, echinoderms andcrustaceans. To date, about 300 species of coral and well over 3,000 species of marine fishes,have been identified. The species richness of sea pens, nudibranchs and crustaceans may be thehighest in the world. By contrast, the freshwater fauna is poor, but fish, crayfish, turtles andcrocodiles are important components in the lower and middle reaches of rivers and some lakes.
26
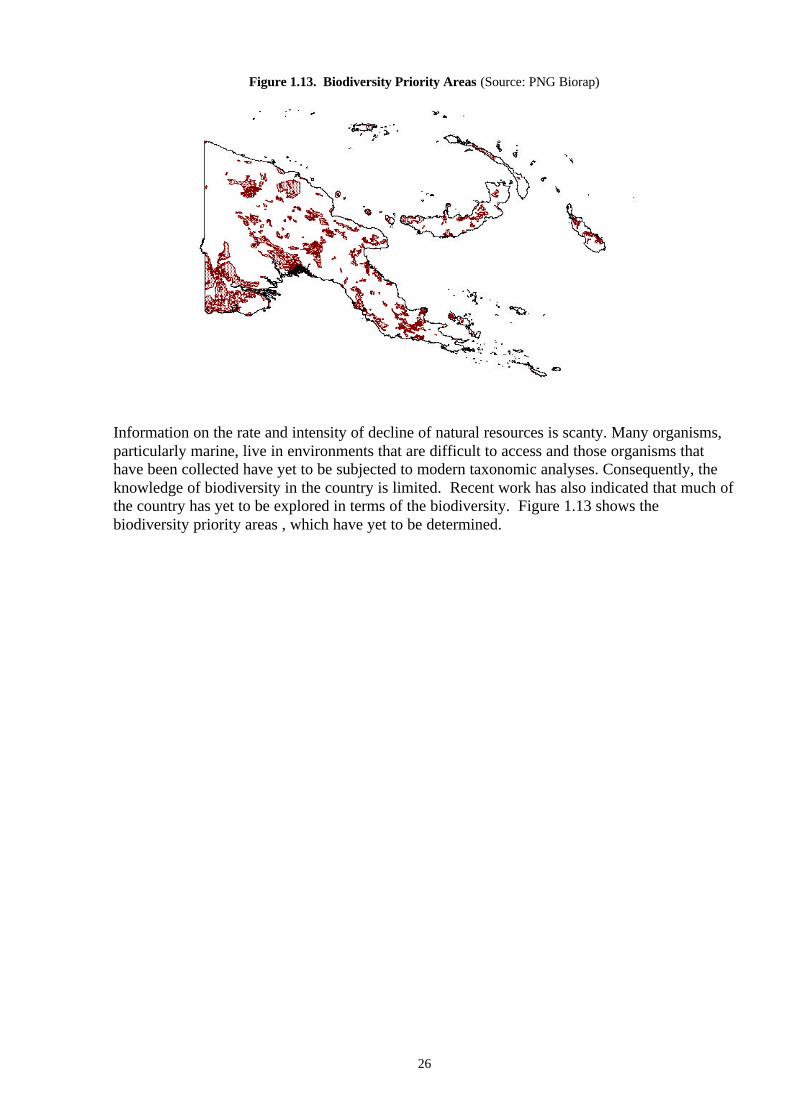
Figure 1.13. Biodiversity Priority Areas (Source: PNG Biorap)
Information on the rate and intensity of decline of natural resources is scanty. Many organisms,particularly marine, live in environments that are difficult to access and those organisms thathave been collected have yet to be subjected to modern taxonomic analyses. Consequently, theknowledge of biodiversity in the country is limited. Recent work has also indicated that much ofthe country has yet to be explored in terms of the biodiversity. Figure 1.13 shows thebiodiversity priority areas , which have yet to be determined.
27
CHAPTER 2
NATIONAL INVENTORY OF GREENHOUSE GASES
INTRODUCTION
One of the cornerstones of the UNFCCC is the commitment by all Parties to take the necessarysteps and measures to reduce GHG emissions (Article 2). This is further strengthened by thecommitment of all Parties to submit to the Conference of the Parties national inventories ofanthropogenic emissions of GHG sources and sinks (Article 4). The main objective of the GHGinventory is to identify and evaluate the anthropogenic emissions of GHGs and to criticallyreview and draw lessons from the initial inventory experience. Particular reference is directedtowards the design, implementation and improvement of future inventories as well asinterventions that may be necessary for GHG abatement over the long term.
INVENTORY PROCESS
The Revised 1996 IPCC Guidelines for National Greenhouse Gas Inventories was used toundertake the inventory and a "reference approach" was followed. It is based on the informationsought from a number of sources from government, non-government and private sectors. Thedata were collected by a team of national experts, who have been trained on the inventorymethodology. The inventory covers emissions of carbon dioxide (CO2), Methane (CH4) andoxides of nitrogen (N2O) as guided by Decision 10/CP.2. The reference year for theseinventories is 1994.
For PNG the inventory only covers four of the six categories of emission sources and sinks,namely, energy, industrial processes, land use and agriculture. There is no existing methodologyfor estimating emissions from solvents and other product use and therefore were left out of theinventory. Limited data are available for emissions and removals from land use change andforestry and waste and thus being left out of the inventory. The reported emission figures thusshould be taken as “work in progress” since only three categories of emissions are reported here.Table 2.1 provides a summary of the results of the GHG inventory on the four sources of GHGemissions.
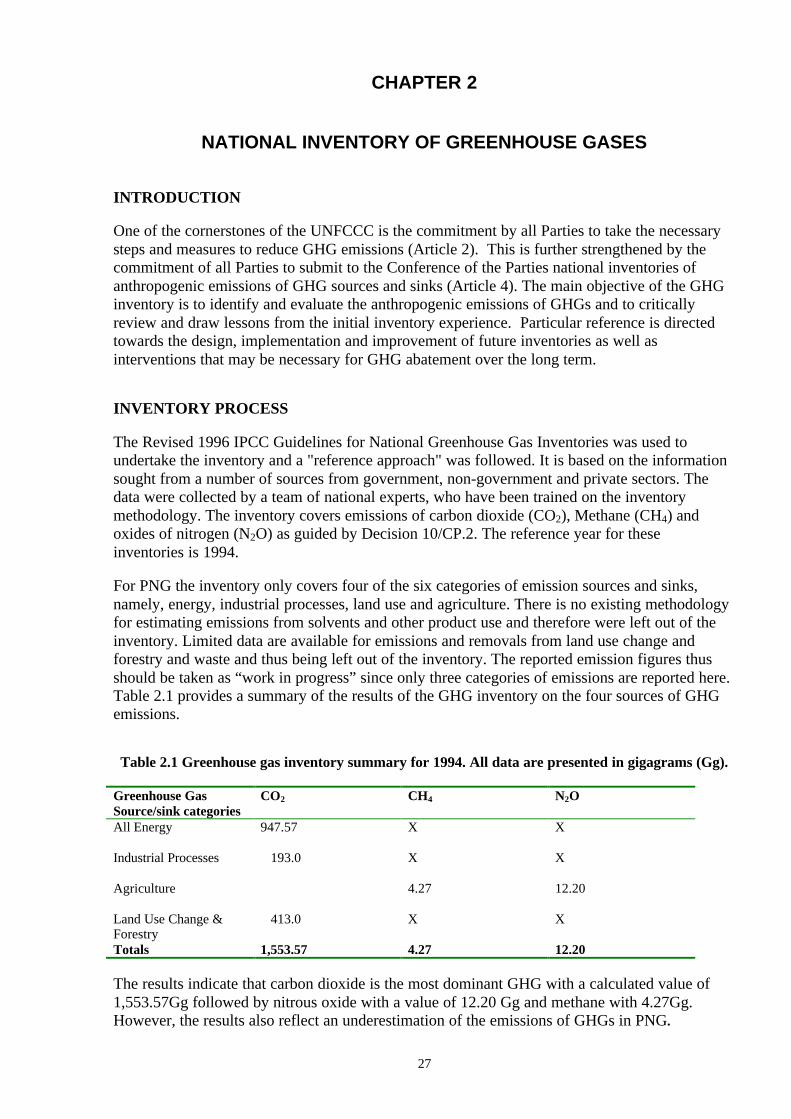
Table 2.1 Greenhouse gas inventory summary for 1994. All data are presented in gigagrams (Gg).
Greenhouse GasSource/sink categories
CO2 CH4 N2O
All Energy 947.57 X X
Industrial Processes 193.0 X X
Agriculture 4.27 12.20
Land Use Change &Forestry
413.0 X X
Totals 1,553.57 4.27 12.20
The results indicate that carbon dioxide is the most dominant GHG with a calculated value of1,553.57Gg followed by nitrous oxide with a value of 12.20 Gg and methane with 4.27Gg.However, the results also reflect an underestimation of the emissions of GHGs in PNG.
28
DATA GAPS
There exists serious data gaps in emissions inventory and these are discussed in this section. Notall energy sources have been accounted for in this inventory, which only covered liquid fuels.Emissions from waste, land-use change and forestry and solvents need to be included in theinventory so that comprehensive emissions total can be obtained. Agriculture emissions mainlyfocused on domestic livestock, but no attempt has been made to estimate emissions from soilcultivation and from burning of forests and grasslands, since there are no data from such sourcesor if available were not accessible.
Given these limitations with the data the inventory as presented can only be regarded as "work-in-progress". It is therefore anticipated that the next inventory for the second nationalcommunication will be much improved by addressing these data gaps. The estimation ofemissions and removals from land use change and forestry will be critical due to its potential foroffsetting GHG emissions from other categories of sources.
GREENHOUSE GASES
Petroleum is a major export earner for the country and at the same time PNG continues to importfossil fuel to meet its energy requirements. Natural gas reserves have been identified and largepotential for its financial gains with the large emissions of carbon dioxide is expected. Themain source of fuel combustion is derived from energy and transformation industries, transport,and residential sectors.
As indicated in the Table 2.1, the focus of the GHG inventory centred on Carbon Dioxide (C02),Methane (CH4) and Nitrous Oxide (N20).
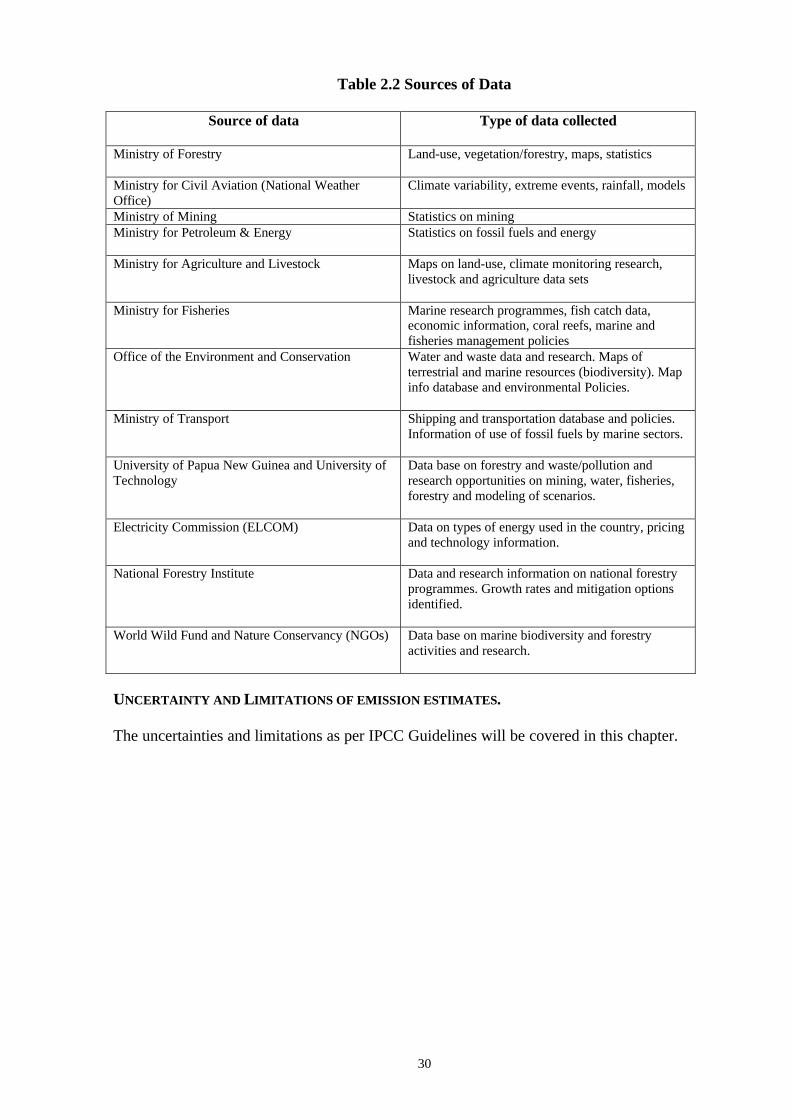
SOURCES OF DATA
Table 2.2 provides the information on the ministries and departments, private institutions, non-government organisations which provided time, resources and data to the Climate ChangeCountry Team to enable them to calculate the GHG gas emissions levels in each of the sectors.The data and information used to complete the PNG GHG Inventory were collected from eachsector and verified before recorded.
ORGANISATION
The National Inventory has been organised into four parts corresponding to the four majorsource sections as described in the IPCC Guidelines (1996). Due to lack of data collected forthese two major sections namely; emissions from soil cultivation (agriculture) and from burningof forests and grasslands and solvents and other product use, no emission estimates have beendetermined. In addition, there is no methodology available as yet to calculate the emissions fromthe solvents and other product use.
The IPCC Guidelines (1996) are:
Energy Activities
• Fuel combustion activities• Fugitive emissions• Memo items (international bunkers)
29
Industrial Processes
Solvent and other Products Use
Agriculture
• Enteric fermentation• Manure management• Agriculture soils
Land use Change and Forestry
• Managed lands• Grassland conversion• Managed Forestry• Clearing Forestry
Waste
• Solid waste disposal on land• Waste water handling.
30
Table 2.2 Sources of Data
Source of data Type of data collected
Ministry of Forestry Land-use, vegetation/forestry, maps, statistics
Ministry for Civil Aviation (National WeatherOffice)
Climate variability, extreme events, rainfall, models
Ministry of Mining Statistics on miningMinistry for Petroleum & Energy Statistics on fossil fuels and energy
Ministry for Agriculture and Livestock Maps on land-use, climate monitoring research,livestock and agriculture data sets
Ministry for Fisheries Marine research programmes, fish catch data,economic information, coral reefs, marine andfisheries management policies
Office of the Environment and Conservation Water and waste data and research. Maps ofterrestrial and marine resources (biodiversity). Mapinfo database and environmental Policies.
Ministry of Transport Shipping and transportation database and policies.Information of use of fossil fuels by marine sectors.
University of Papua New Guinea and University ofTechnology
Data base on forestry and waste/pollution andresearch opportunities on mining, water, fisheries,forestry and modeling of scenarios.
Electricity Commission (ELCOM) Data on types of energy used in the country, pricingand technology information.
National Forestry Institute Data and research information on national forestryprogrammes. Growth rates and mitigation optionsidentified.
World Wild Fund and Nature Conservancy (NGOs) Data base on marine biodiversity and forestryactivities and research.
UNCERTAINTY AND LIMITATIONS OF EMISSION ESTIMATES.
The uncertainties and limitations as per IPCC Guidelines will be covered in this chapter.
31
EMISSIONS
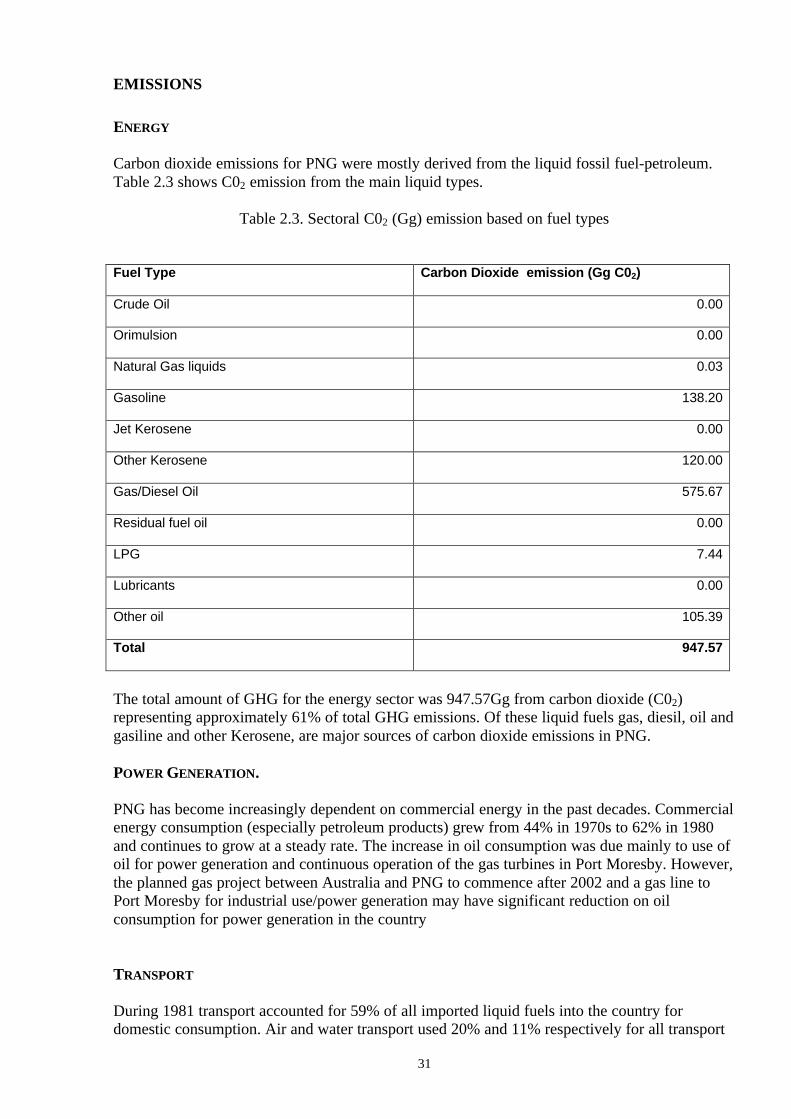
ENERGY
Carbon dioxide emissions for PNG were mostly derived from the liquid fossil fuel-petroleum.Table 2.3 shows C02 emission from the main liquid types.
Table 2.3. Sectoral C02 (Gg) emission based on fuel types
Fuel Type Carbon Dioxide emission (Gg C02)
Crude Oil 0.00
Orimulsion 0.00
Natural Gas liquids 0.03
Gasoline 138.20
Jet Kerosene 0.00
Other Kerosene 120.00
Gas/Diesel Oil 575.67
Residual fuel oil 0.00
LPG 7.44
Lubricants 0.00
Other oil 105.39
Total 947.57
The total amount of GHG for the energy sector was 947.57Gg from carbon dioxide (C02)representing approximately 61% of total GHG emissions. Of these liquid fuels gas, diesil, oil andgasiline and other Kerosene, are major sources of carbon dioxide emissions in PNG.
POWER GENERATION.
PNG has become increasingly dependent on commercial energy in the past decades. Commercialenergy consumption (especially petroleum products) grew from 44% in 1970s to 62% in 1980and continues to grow at a steady rate. The increase in oil consumption was due mainly to use ofoil for power generation and continuous operation of the gas turbines in Port Moresby. However,the planned gas project between Australia and PNG to commence after 2002 and a gas line toPort Moresby for industrial use/power generation may have significant reduction on oilconsumption for power generation in the country
TRANSPORT
During 1981 transport accounted for 59% of all imported liquid fuels into the country fordomestic consumption. Air and water transport used 20% and 11% respectively for all transport
32
fuels. It has been estimated that these figures have risen to 25 % and 15% for both sectors. Roadtransport is the major user of imported fuels, especially. Petrol is the major source of importedfuel used by road transport followed by diesel.
Attempts to collect data from the responsible ministries and line departments proved difficult.
MEMO ITEMS
INTERNATIONAL BUNKERS
International bunkering for the GHG from international marine and aviation is important for thecountry to note and understand for future international reporting. Two major suppliers anddistributers of gas/diesel/jet gas in the country; Shell (PNG) and Mobil, have access to theseimportant data and information. However, these have not been included in this nationalcalculation.
AGRICULTURE
Agriculture is the main economic backbone of PNG accounting for 13% of total export earnings.Land currently set aside for food and cash crop production in the country accounts for about 30%of the total land area. Land suitability for tree crops, arable agriculture, pasture and irrigated riceis important (see Table 1.2). Land currently under food production cycle amounts to 30,000 km2
or 6.6% of total land area.
Cash crops such as copra, coffee, cocoa, rubber and oil palm, as well as subsistence agriculture,based on root crops, sustain about 85% of the population. Large amounts of vegetables and fruitsare produced in the Highlands, but inadequate transport and marketing infrastructure limit thesupply to the larger populace urban centers. These crops are highly perishable and suffer fromvariable product quality, and high post harvest losses.
Around 8 % of the farmers are wholly dependent on subsistence food production for survival.Subsistence agriculture accounts for about 45% of total agricultural output and has the potentialto absorb new entrants to the labor force, providing that the social status is raised to make it morevocationally attractive.
Livestock mainly pigs, cattle, poultry, goats, horses and sheep are raised in the country mainlyfor national and domestic use mainly. There are more than four large private companies involvedin poultry ventures. The Department of Agriculture’s National Agriculture Research Institute(NARI) and FAO are the main institutions involved in agricultural research initiatives in thecountry.
Methane levels are relatively low compared to some countries of similar size in the Pacificregion. The results in Table 2.4 show emissions of methane from the range of animals farmed inthe country. The Climate Team believes that the total CH4 emissions are of low value, but this donot reflection a true picture of the PNG's potential. Some difficulties were encountered incollecting data from the most important departments, this included the data not being centralised.Many institutions around the country were involved in data collections, but the information werenot in the correct format for the GHG Inventory studies.
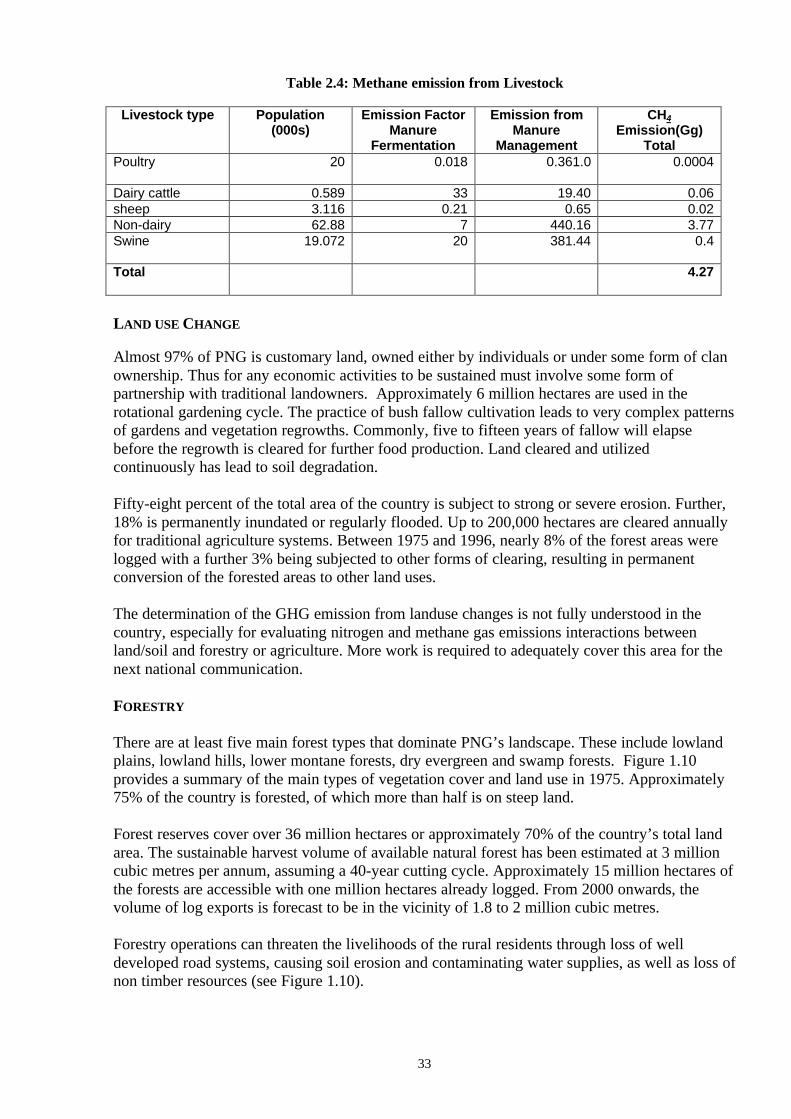
33
Table 2.4: Methane emission from Livestock
Livestock type Population(000s)
Emission FactorManure
Fermentation
Emission fromManure
Management
CH4
Emission(Gg)Total
Poultry 20 0.018 0.361.0 0.0004
Dairy cattle 0.589 33 19.40 0.06sheep 3.116 0.21 0.65 0.02Non-dairy 62.88 7 440.16 3.77Swine 19.072 20 381.44 0.4
Total 4.27
LAND USE CHANGE
Almost 97% of PNG is customary land, owned either by individuals or under some form of clanownership. Thus for any economic activities to be sustained must involve some form ofpartnership with traditional landowners. Approximately 6 million hectares are used in therotational gardening cycle. The practice of bush fallow cultivation leads to very complex patternsof gardens and vegetation regrowths. Commonly, five to fifteen years of fallow will elapsebefore the regrowth is cleared for further food production. Land cleared and utilizedcontinuously has lead to soil degradation.
Fifty-eight percent of the total area of the country is subject to strong or severe erosion. Further,18% is permanently inundated or regularly flooded. Up to 200,000 hectares are cleared annuallyfor traditional agriculture systems. Between 1975 and 1996, nearly 8% of the forest areas werelogged with a further 3% being subjected to other forms of clearing, resulting in permanentconversion of the forested areas to other land uses.
The determination of the GHG emission from landuse changes is not fully understood in thecountry, especially for evaluating nitrogen and methane gas emissions interactions betweenland/soil and forestry or agriculture. More work is required to adequately cover this area for thenext national communication.
FORESTRY
There are at least five main forest types that dominate PNG’s landscape. These include lowlandplains, lowland hills, lower montane forests, dry evergreen and swamp forests. Figure 1.10provides a summary of the main types of vegetation cover and land use in 1975. Approximately75% of the country is forested, of which more than half is on steep land.
Forest reserves cover over 36 million hectares or approximately 70% of the country’s total landarea. The sustainable harvest volume of available natural forest has been estimated at 3 millioncubic metres per annum, assuming a 40-year cutting cycle. Approximately 15 million hectares ofthe forests are accessible with one million hectares already logged. From 2000 onwards, thevolume of log exports is forecast to be in the vicinity of 1.8 to 2 million cubic metres.
Forestry operations can threaten the livelihoods of the rural residents through loss of welldeveloped road systems, causing soil erosion and contaminating water supplies, as well as loss ofnon timber resources (see Figure 1.10).
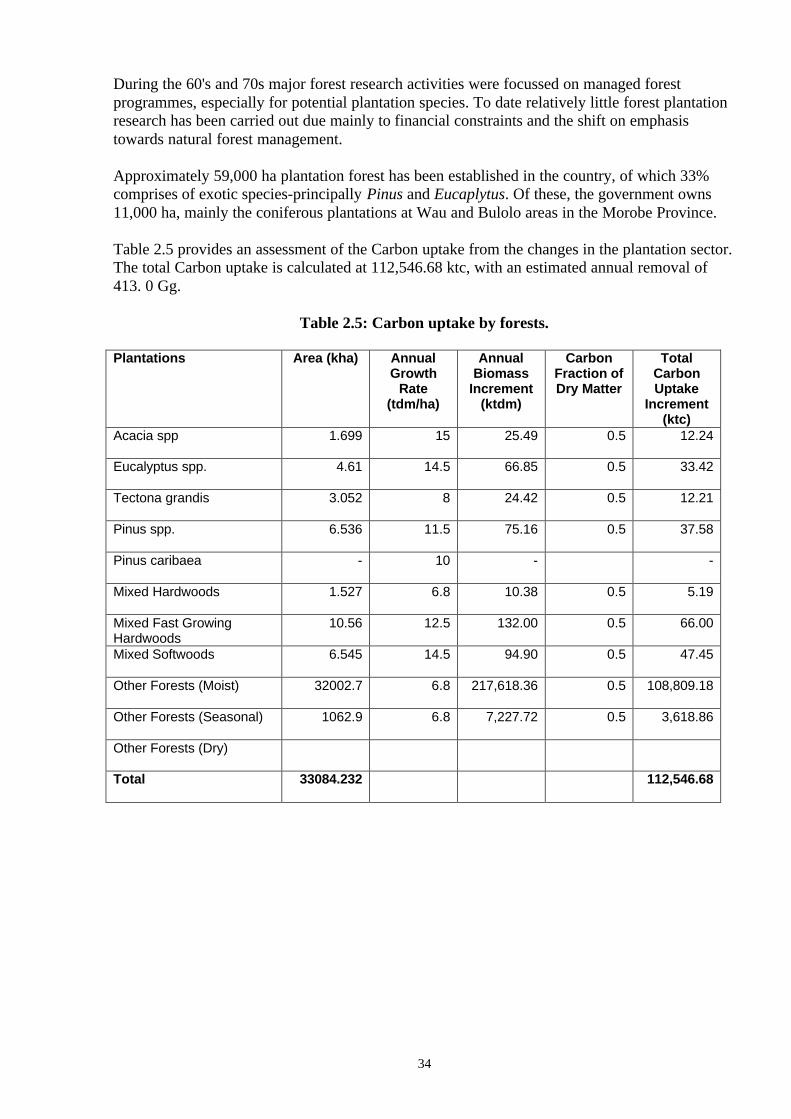
34
During the 60's and 70s major forest research activities were focussed on managed forestprogrammes, especially for potential plantation species. To date relatively little forest plantationresearch has been carried out due mainly to financial constraints and the shift on emphasistowards natural forest management.
Approximately 59,000 ha plantation forest has been established in the country, of which 33%comprises of exotic species-principally Pinus and Eucaplytus. Of these, the government owns11,000 ha, mainly the coniferous plantations at Wau and Bulolo areas in the Morobe Province.
Table 2.5 provides an assessment of the Carbon uptake from the changes in the plantation sector.The total Carbon uptake is calculated at 112,546.68 ktc, with an estimated annual removal of413. 0 Gg.
Table 2.5: Carbon uptake by forests.
Plantations Area (kha) AnnualGrowth
Rate(tdm/ha)
AnnualBiomass
Increment(ktdm)
CarbonFraction ofDry Matter
TotalCarbonUptake
Increment(ktc)
Acacia spp 1.699 15 25.49 0.5 12.24
Eucalyptus spp. 4.61 14.5 66.85 0.5 33.42
Tectona grandis 3.052 8 24.42 0.5 12.21
Pinus spp. 6.536 11.5 75.16 0.5 37.58
Pinus caribaea - 10 - -
Mixed Hardwoods 1.527 6.8 10.38 0.5 5.19
Mixed Fast GrowingHardwoods
10.56 12.5 132.00 0.5 66.00
Mixed Softwoods 6.545 14.5 94.90 0.5 47.45
Other Forests (Moist) 32002.7 6.8 217,618.36 0.5 108,809.18
Other Forests (Seasonal) 1062.9 6.8 7,227.72 0.5 3,618.86
Other Forests (Dry)
Total 33084.232 112,546.68
35
WASTE
Traditionally and culturally, the people have strong ties with their coastal environments. Poorwaste disposal (solid, liquid and hazardous) practices definitely have negative impacts on bothfreshwater and coastal marine environments affecting public health, ecosystems and theeconomy of the country. Greater efforts and resources are required at national, provincial andindividual levels to better manage waste disposal and to minimise the impacts on the fragileenvironment of the country.
CURRENT WASTE MANAGEMENT PRACTICE
Generally, there has been a lack of sound waste management in areas of solid, liquid andhazardous wastes in PNG due to a number of factors including problems with legislation,policies, infrastructure, planning, public awareness, and both human and financial resources toimplement sound waste management practices throughout the country.
Methane emission originates from several sources, including anaerobic decomposition of organicwastes in solid waste sites, in sludge and residual solid by products. Calculation of methaneemission from solid and liquid waste sites proved to be difficult, mainly through lack of data andits format. The sections below will briefly discuss the constraints and data gaps in determiningthe levels of methane and nitrous oxide emissions.
i. Solid Wastes
Solid waste management problems have escalated over the past few decades as a result ofpopulation growth and rural populations shifting to urban centres seeking improved life style,employment and educational opportunities. This has further overloaded existing waste disposalsystems that were already struggling to cope in the first place. Also the type and volume ofwastes generated in the country have become more abundant and complex as demands forimported canned, plastic-wrapped, or bottled goods have increased. The dumping of wastes frommining activities into the rivers and the ocean has also increased substantially.
The search for environmentally safe and socially acceptable areas for disposal of wastes is anunending problem faced by all the towns and villages. No one wants a dump located in his or her“backyard”. All too often mangrove areas, oceans, rivers and/or beaches become landfills bydefault. For example in Port Moresby city, two landfill sites at 6 Mile and Baruni cater for dailydomestic waste generated from a population of more than 300,000 people. It is estimated that theaverage daily waste from the commercial, domestic and industrial varied between 0.21- 0.4Kgper person per day, of which 53% is biodegradable.
Due to the lack of data available from the private sector and related government departments,quantification of total emission of methane from solid waste has not been possible.
ii. Hazardous Wastes
Hazardous or special wastes are dangerous to the people and have harmful effects on theenvironment, such as shallow groundwater lenses and marine resources. Thus special care andpractices are required to deal with these types of waste, which include the following: batteries(vehicle, and small household), waste oil, pesticides, medical waste, paint and solvent, industrialwaste (timber treatment and processing, mining processing), transformers (PCB), and septic tankcleanings.
36
Ideally, these wastes should be collected, stored and removed from the country for safe disposalor recycling overseas. However there are substantial costs and logistical problems in thisapproach. Export of wastes must be in accordance with the requirements of the Basel Convention(Convention on the Control of Trans-boundary Movements of Hazardous Wastes and theirDisposal) and the Waigani Convention (Convention to Ban the Importation into Forum IslandCountries Hazardous and Radioactive Waste and to Control the Trans-boundary Movement andManagement of Hazardous Wastes within the South Pacific Region).
There are three aspects to the management of hazardous wastes in the country. Firstly there is theproblem of dealing with accumulations of waste or unwanted chemicals or hazardous materialswhich are in storage in the absence of any organised disposal programme. Secondly there are thesituations where contamination of soil or groundwater has occurred. This may be due toaccidental spillage and leakage of stored chemicals or deliberate burying in an attempt to disposeof such materials. These first two situations are in large part, the legacy of unsatisfactory wasteand hazardous material management in the past.
The third aspect of hazardous waste and chemicals management is to take a more positive viewand to ensure procedures and structures are in place to ensure that no more waste accumulationsor contaminated sites are allowed to develop as a result of current activities. Unfortunately, the“out of sight/out of mind” approach has generally been taken. For example, the burning ofmedical waste is commonly practised in country.
iii. Liquid Wastes
Unfortunately there is a lack of sufficient available data to assess typical characteristics ofwastewater produced in the country.
Based on the country’s estimated population using various methods of treatment an estimatedconcentrations for each characteristic, such as biological oxygen demand, nitrogen content andphosphorous are calculated as follows: 5,665.0; 3,106.0 and 374.0 tons per year respectively. The country's wastewater treatment plants indicated that industrial wastes were not allowed intotheir collection systems. Major industries in the country include edible oils, oil export andproduction, oil palm production, agricultural and livestock processing, sugar refining, fishcanning and beer brewing. Most industrial operations provide some sort of treatment anddisposal systems, but again there is little information available, plus a lack of dischargemonitoring system. Potential economic opportunities exist with expanding industrial growth.This growth comes with increased industrial waste types and volumes that will have to be dealtwith to protect the environment. More control over discharges will therefore need to be exercisedby government authorities to minimise adverse effects to the environment.

37
Mining activities in PNG all produce wastewater that is potentially dangerous to the environmentif not treated appropriately. Each mining operation should have its own treatment facilities andmust be continually monitored.
Calculation of nitrous oxide emissions from human and animal waste management systems hasnot been possible.
CONCLUSION
There is still a lot of gap in data from the following sectors; land use, livestock, agriculture,bunker fuels calculations and waste.
Although reduction of the emission will not impact the average person, significant savings oneconomic, environment and health of the country would be gained if the government and privatesectors changed their attitudes as well as policies to seriously place renewable energy as priorityprogram of actions. A range of mitigation options is discussed under mitigation in chapter 4.
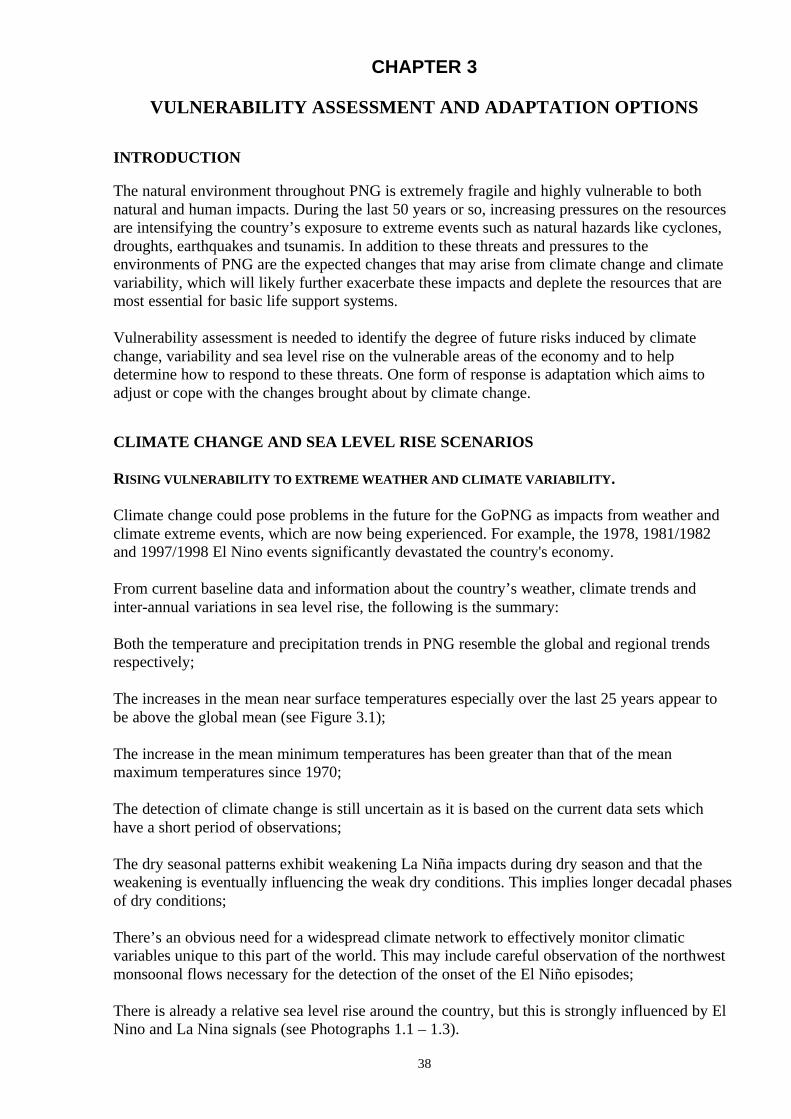
38
CHAPTER 3
VULNERABILITY ASSESSMENT AND ADAPTATION OPTIONS
INTRODUCTION
The natural environment throughout PNG is extremely fragile and highly vulnerable to bothnatural and human impacts. During the last 50 years or so, increasing pressures on the resourcesare intensifying the country’s exposure to extreme events such as natural hazards like cyclones,droughts, earthquakes and tsunamis. In addition to these threats and pressures to theenvironments of PNG are the expected changes that may arise from climate change and climatevariability, which will likely further exacerbate these impacts and deplete the resources that aremost essential for basic life support systems.
Vulnerability assessment is needed to identify the degree of future risks induced by climatechange, variability and sea level rise on the vulnerable areas of the economy and to helpdetermine how to respond to these threats. One form of response is adaptation which aims toadjust or cope with the changes brought about by climate change.
CLIMATE CHANGE AND SEA LEVEL RISE SCENARIOS
RISING VULNERABILITY TO EXTREME WEATHER AND CLIMATE VARIABILITY.
Climate change could pose problems in the future for the GoPNG as impacts from weather andclimate extreme events, which are now being experienced. For example, the 1978, 1981/1982and 1997/1998 El Nino events significantly devastated the country's economy.
From current baseline data and information about the country’s weather, climate trends andinter-annual variations in sea level rise, the following is the summary:
Both the temperature and precipitation trends in PNG resemble the global and regional trendsrespectively;
The increases in the mean near surface temperatures especially over the last 25 years appear tobe above the global mean (see Figure 3.1);
The increase in the mean minimum temperatures has been greater than that of the meanmaximum temperatures since 1970;
The detection of climate change is still uncertain as it is based on the current data sets whichhave a short period of observations;
The dry seasonal patterns exhibit weakening La Niña impacts during dry season and that theweakening is eventually influencing the weak dry conditions. This implies longer decadal phasesof dry conditions;
There’s an obvious need for a widespread climate network to effectively monitor climaticvariables unique to this part of the world. This may include careful observation of the northwestmonsoonal flows necessary for the detection of the onset of the El Niño episodes;
There is already a relative sea level rise around the country, but this is strongly influenced by ElNino and La Nina signals (see Photographs 1.1 – 1.3).
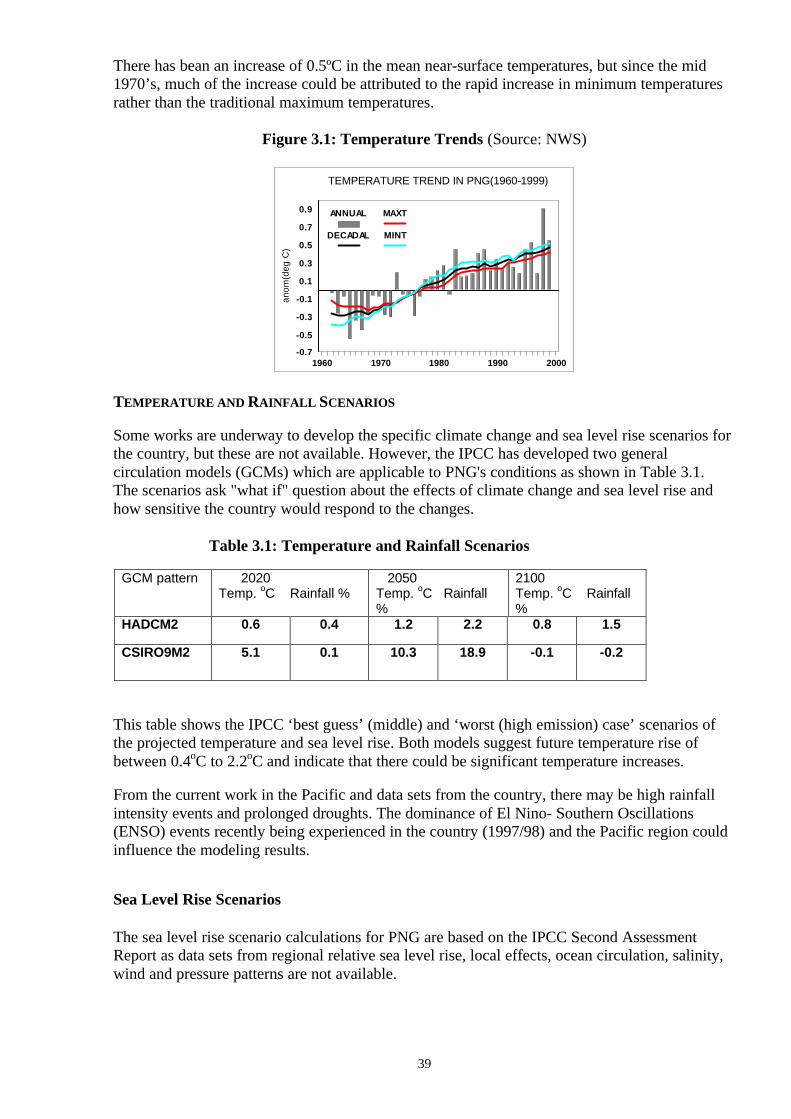
39
There has bean an increase of 0.5ºC in the mean near-surface temperatures, but since the mid1970’s, much of the increase could be attributed to the rapid increase in minimum temperaturesrather than the traditional maximum temperatures.
Figure 3.1: Temperature Trends (Source: NWS)
1960 1970 1980 1990 2000-0.7
-0.5
-0.3
-0.1
0.1
0.3
0.5
0.7
0.9
anom
(deg
C)
ANNUAL
DECADAL
MAXT
MINT
TEMPERATURE TREND IN PNG(1960-1999)
TEMPERATURE AND RAINFALL SCENARIOS
Some works are underway to develop the specific climate change and sea level rise scenarios forthe country, but these are not available. However, the IPCC has developed two generalcirculation models (GCMs) which are applicable to PNG's conditions as shown in Table 3.1.The scenarios ask "what if" question about the effects of climate change and sea level rise andhow sensitive the country would respond to the changes.
Table 3.1: Temperature and Rainfall Scenarios
GCM pattern 2020Temp. oC Rainfall %
2050Temp. oC Rainfall%
2100Temp. oC Rainfall%
HADCM2 0.6 0.4 1.2 2.2 0.8 1.5
CSIRO9M2 5.1 0.1 10.3 18.9 -0.1 -0.2
This table shows the IPCC ‘best guess’ (middle) and ‘worst (high emission) case’ scenarios ofthe projected temperature and sea level rise. Both models suggest future temperature rise ofbetween 0.4oC to 2.2oC and indicate that there could be significant temperature increases.
From the current work in the Pacific and data sets from the country, there may be high rainfallintensity events and prolonged droughts. The dominance of El Nino- Southern Oscillations(ENSO) events recently being experienced in the country (1997/98) and the Pacific region couldinfluence the modeling results.
Sea Level Rise Scenarios
The sea level rise scenario calculations for PNG are based on the IPCC Second AssessmentReport as data sets from regional relative sea level rise, local effects, ocean circulation, salinity,wind and pressure patterns are not available.
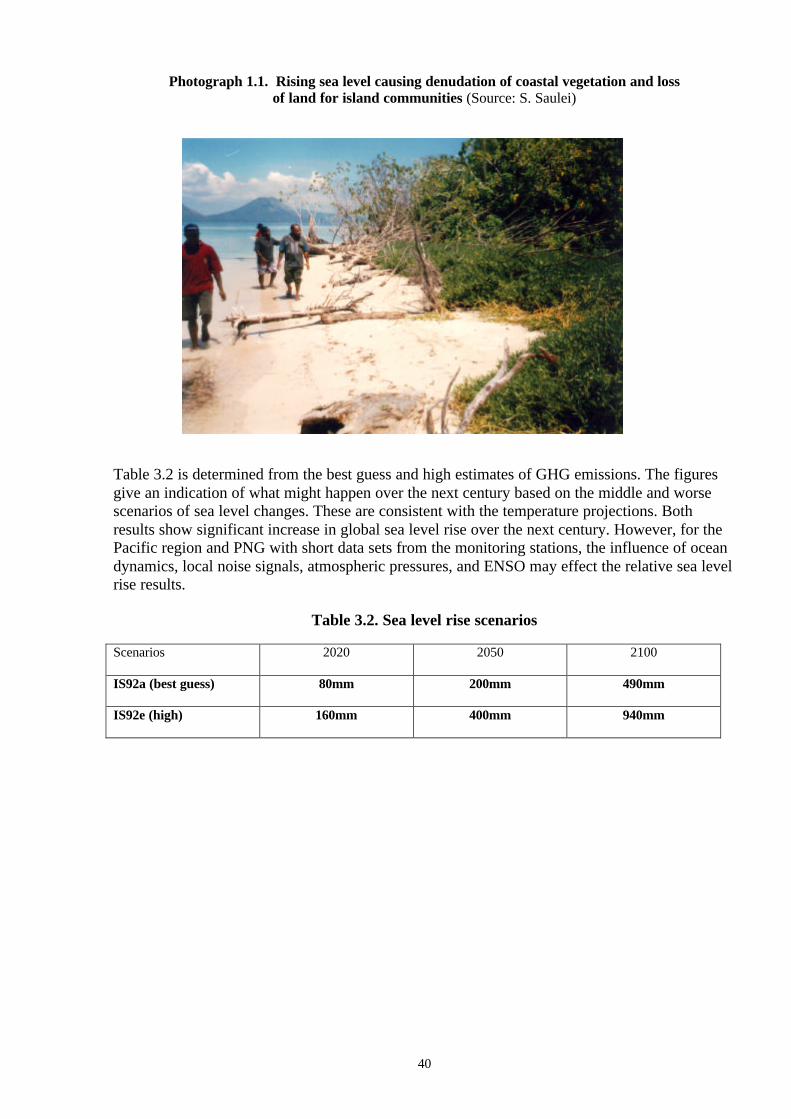
40
Photograph 1.1. Rising sea level causing denudation of coastal vegetation and lossof land for island communities (Source: S. Saulei)
Table 3.2 is determined from the best guess and high estimates of GHG emissions. The figuresgive an indication of what might happen over the next century based on the middle and worsescenarios of sea level changes. These are consistent with the temperature projections. Bothresults show significant increase in global sea level rise over the next century. However, for thePacific region and PNG with short data sets from the monitoring stations, the influence of oceandynamics, local noise signals, atmospheric pressures, and ENSO may effect the relative sea levelrise results.
Table 3.2. Sea level rise scenarios
Scenarios 2020 2050 2100
IS92a (best guess) 80mm 200mm 490mm
IS92e (high) 160mm 400mm 940mm
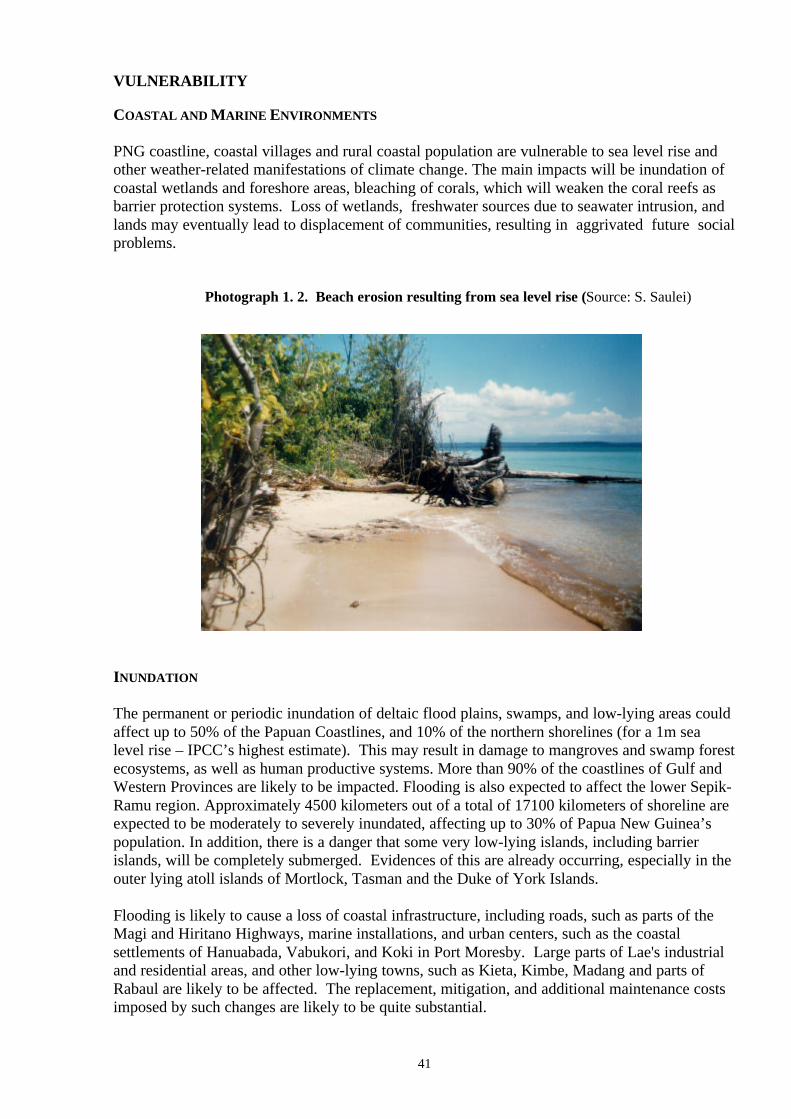
41
VULNERABILITY
COASTAL AND MARINE ENVIRONMENTS
PNG coastline, coastal villages and rural coastal population are vulnerable to sea level rise andother weather-related manifestations of climate change. The main impacts will be inundation ofcoastal wetlands and foreshore areas, bleaching of corals, which will weaken the coral reefs asbarrier protection systems. Loss of wetlands, freshwater sources due to seawater intrusion, andlands may eventually lead to displacement of communities, resulting in aggrivated future socialproblems.
Photograph 1. 2. Beach erosion resulting from sea level rise (Source: S. Saulei)
INUNDATION
The permanent or periodic inundation of deltaic flood plains, swamps, and low-lying areas couldaffect up to 50% of the Papuan Coastlines, and 10% of the northern shorelines (for a 1m sealevel rise – IPCC’s highest estimate). This may result in damage to mangroves and swamp forestecosystems, as well as human productive systems. More than 90% of the coastlines of Gulf andWestern Provinces are likely to be impacted. Flooding is also expected to affect the lower Sepik-Ramu region. Approximately 4500 kilometers out of a total of 17100 kilometers of shoreline areexpected to be moderately to severely inundated, affecting up to 30% of Papua New Guinea’spopulation. In addition, there is a danger that some very low-lying islands, including barrierislands, will be completely submerged. Evidences of this are already occurring, especially in theouter lying atoll islands of Mortlock, Tasman and the Duke of York Islands.
Flooding is likely to cause a loss of coastal infrastructure, including roads, such as parts of theMagi and Hiritano Highways, marine installations, and urban centers, such as the coastalsettlements of Hanuabada, Vabukori, and Koki in Port Moresby. Large parts of Lae's industrialand residential areas, and other low-lying towns, such as Kieta, Kimbe, Madang and parts ofRabaul are likely to be affected. The replacement, mitigation, and additional maintenance costsimposed by such changes are likely to be quite substantial.
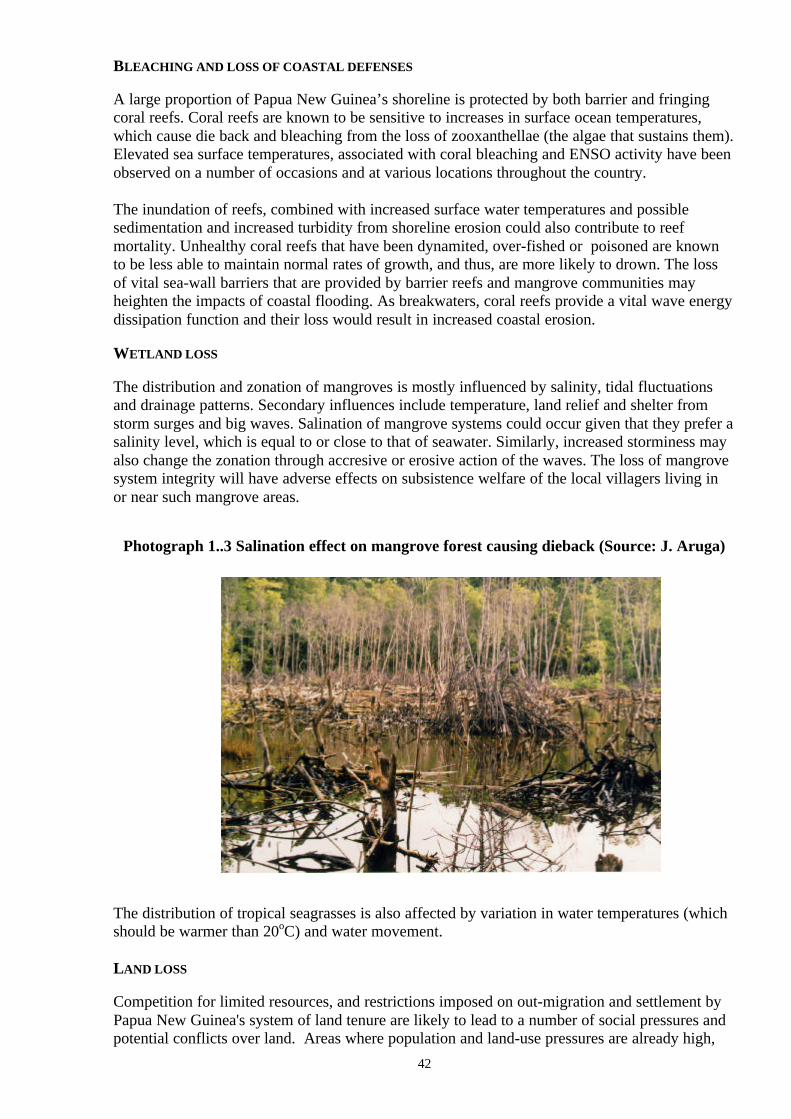
42
BLEACHING AND LOSS OF COASTAL DEFENSES
A large proportion of Papua New Guinea’s shoreline is protected by both barrier and fringingcoral reefs. Coral reefs are known to be sensitive to increases in surface ocean temperatures,which cause die back and bleaching from the loss of zooxanthellae (the algae that sustains them).Elevated sea surface temperatures, associated with coral bleaching and ENSO activity have beenobserved on a number of occasions and at various locations throughout the country.
The inundation of reefs, combined with increased surface water temperatures and possiblesedimentation and increased turbidity from shoreline erosion could also contribute to reefmortality. Unhealthy coral reefs that have been dynamited, over-fished or poisoned are knownto be less able to maintain normal rates of growth, and thus, are more likely to drown. The lossof vital sea-wall barriers that are provided by barrier reefs and mangrove communities mayheighten the impacts of coastal flooding. As breakwaters, coral reefs provide a vital wave energydissipation function and their loss would result in increased coastal erosion.
WETLAND LOSS
The distribution and zonation of mangroves is mostly influenced by salinity, tidal fluctuationsand drainage patterns. Secondary influences include temperature, land relief and shelter fromstorm surges and big waves. Salination of mangrove systems could occur given that they prefer asalinity level, which is equal to or close to that of seawater. Similarly, increased storminess mayalso change the zonation through accresive or erosive action of the waves. The loss of mangrovesystem integrity will have adverse effects on subsistence welfare of the local villagers living inor near such mangrove areas.
Photograph 1..3 Salination effect on mangrove forest causing dieback (Source: J. Aruga)
The distribution of tropical seagrasses is also affected by variation in water temperatures (whichshould be warmer than 20oC) and water movement.
LAND LOSS
Competition for limited resources, and restrictions imposed on out-migration and settlement byPapua New Guinea's system of land tenure are likely to lead to a number of social pressures andpotential conflicts over land. Areas where population and land-use pressures are already high,
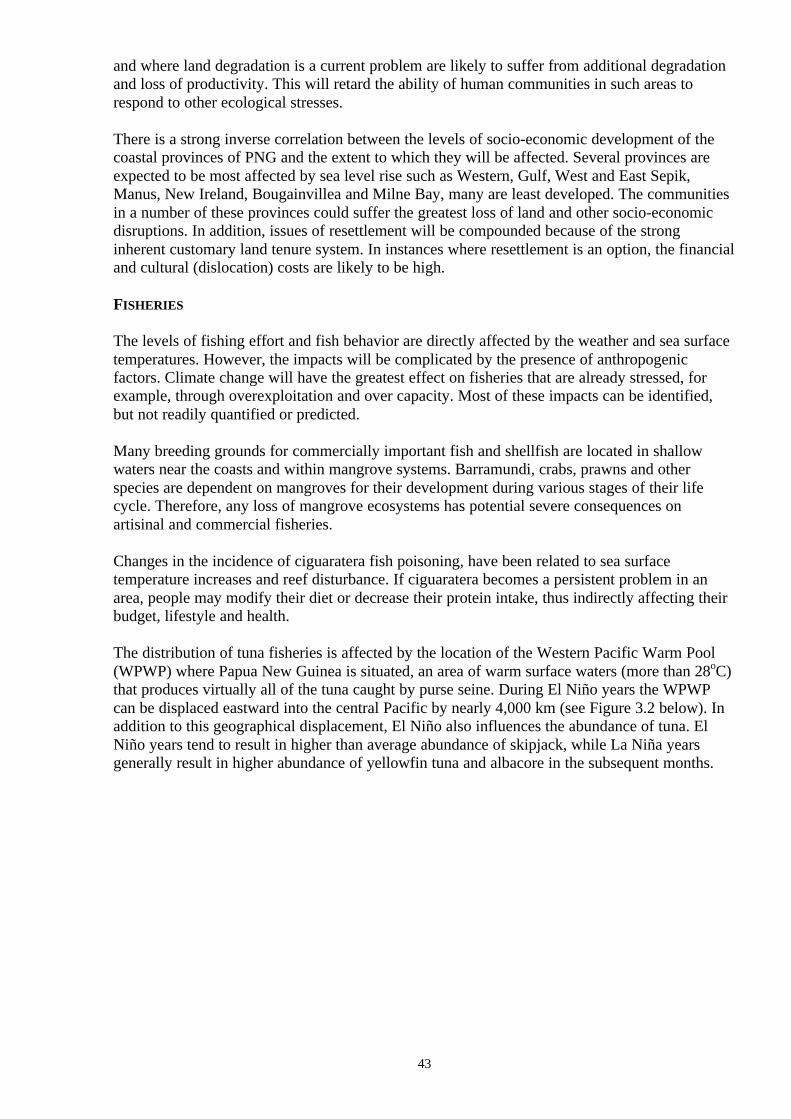
43
and where land degradation is a current problem are likely to suffer from additional degradationand loss of productivity. This will retard the ability of human communities in such areas torespond to other ecological stresses.
There is a strong inverse correlation between the levels of socio-economic development of thecoastal provinces of PNG and the extent to which they will be affected. Several provinces areexpected to be most affected by sea level rise such as Western, Gulf, West and East Sepik,Manus, New Ireland, Bougainvillea and Milne Bay, many are least developed. The communitiesin a number of these provinces could suffer the greatest loss of land and other socio-economicdisruptions. In addition, issues of resettlement will be compounded because of the stronginherent customary land tenure system. In instances where resettlement is an option, the financialand cultural (dislocation) costs are likely to be high.
FISHERIES
The levels of fishing effort and fish behavior are directly affected by the weather and sea surfacetemperatures. However, the impacts will be complicated by the presence of anthropogenicfactors. Climate change will have the greatest effect on fisheries that are already stressed, forexample, through overexploitation and over capacity. Most of these impacts can be identified,but not readily quantified or predicted.
Many breeding grounds for commercially important fish and shellfish are located in shallowwaters near the coasts and within mangrove systems. Barramundi, crabs, prawns and otherspecies are dependent on mangroves for their development during various stages of their lifecycle. Therefore, any loss of mangrove ecosystems has potential severe consequences onartisinal and commercial fisheries.
Changes in the incidence of ciguaratera fish poisoning, have been related to sea surfacetemperature increases and reef disturbance. If ciguaratera becomes a persistent problem in anarea, people may modify their diet or decrease their protein intake, thus indirectly affecting theirbudget, lifestyle and health.
The distribution of tuna fisheries is affected by the location of the Western Pacific Warm Pool(WPWP) where Papua New Guinea is situated, an area of warm surface waters (more than 28oC)that produces virtually all of the tuna caught by purse seine. During El Niño years the WPWPcan be displaced eastward into the central Pacific by nearly 4,000 km (see Figure 3.2 below). Inaddition to this geographical displacement, El Niño also influences the abundance of tuna. ElNiño years tend to result in higher than average abundance of skipjack, while La Niña yearsgenerally result in higher abundance of yellowfin tuna and albacore in the subsequent months.
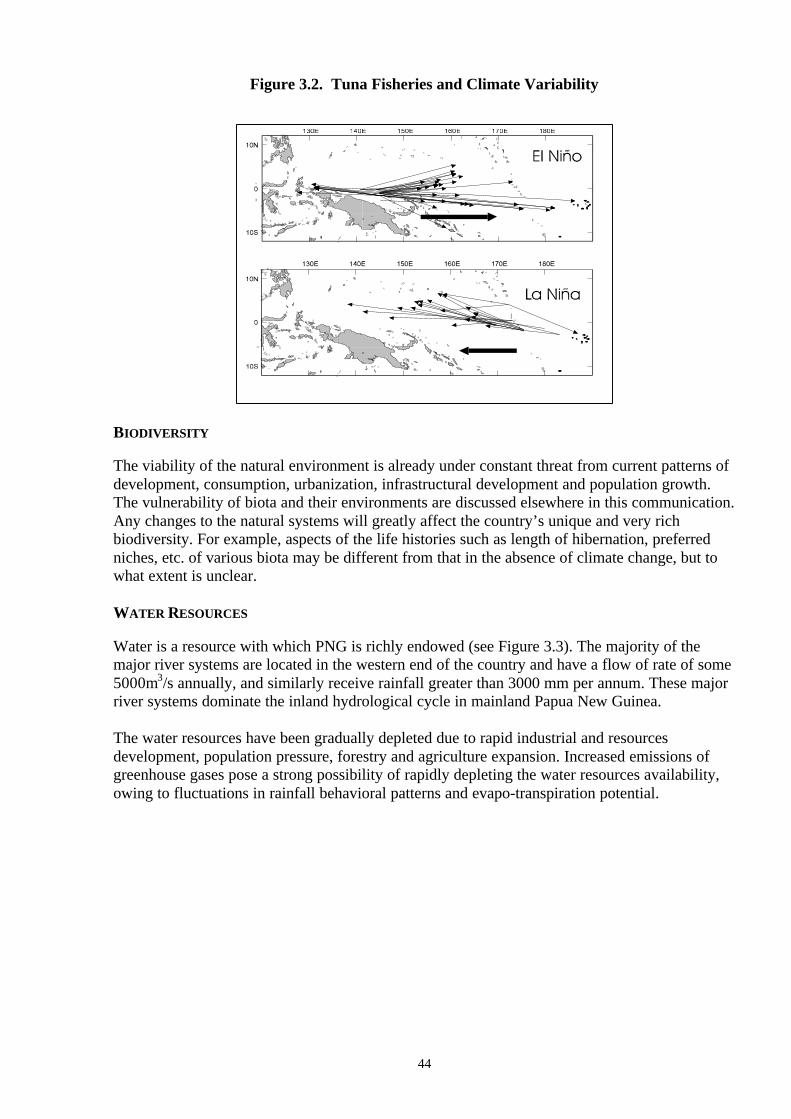
44
Figure 3.2. Tuna Fisheries and Climate Variability
BIODIVERSITY
The viability of the natural environment is already under constant threat from current patterns ofdevelopment, consumption, urbanization, infrastructural development and population growth.The vulnerability of biota and their environments are discussed elsewhere in this communication.Any changes to the natural systems will greatly affect the country’s unique and very richbiodiversity. For example, aspects of the life histories such as length of hibernation, preferredniches, etc. of various biota may be different from that in the absence of climate change, but towhat extent is unclear.
WATER RESOURCES
Water is a resource with which PNG is richly endowed (see Figure 3.3). The majority of themajor river systems are located in the western end of the country and have a flow of rate of some5000m3/s annually, and similarly receive rainfall greater than 3000 mm per annum. These majorriver systems dominate the inland hydrological cycle in mainland Papua New Guinea.
The water resources have been gradually depleted due to rapid industrial and resourcesdevelopment, population pressure, forestry and agriculture expansion. Increased emissions ofgreenhouse gases pose a strong possibility of rapidly depleting the water resources availability,owing to fluctuations in rainfall behavioral patterns and evapo-transpiration potential.
45
Figure 3.3. Major river systems in Papua New Guinea
Vulnerability to water resources is induced by changes in climatic conditions such as increases intemperature, rises in sea level and depletion in carbon dioxide gas. For example, increased CO2
concentration would reduce stomatal conductance in many plants, implying a reduction intranspiration although the effects vary considerable between species. These changes are likely toupset the overall normal water availability, water balance and hydrological cycle.
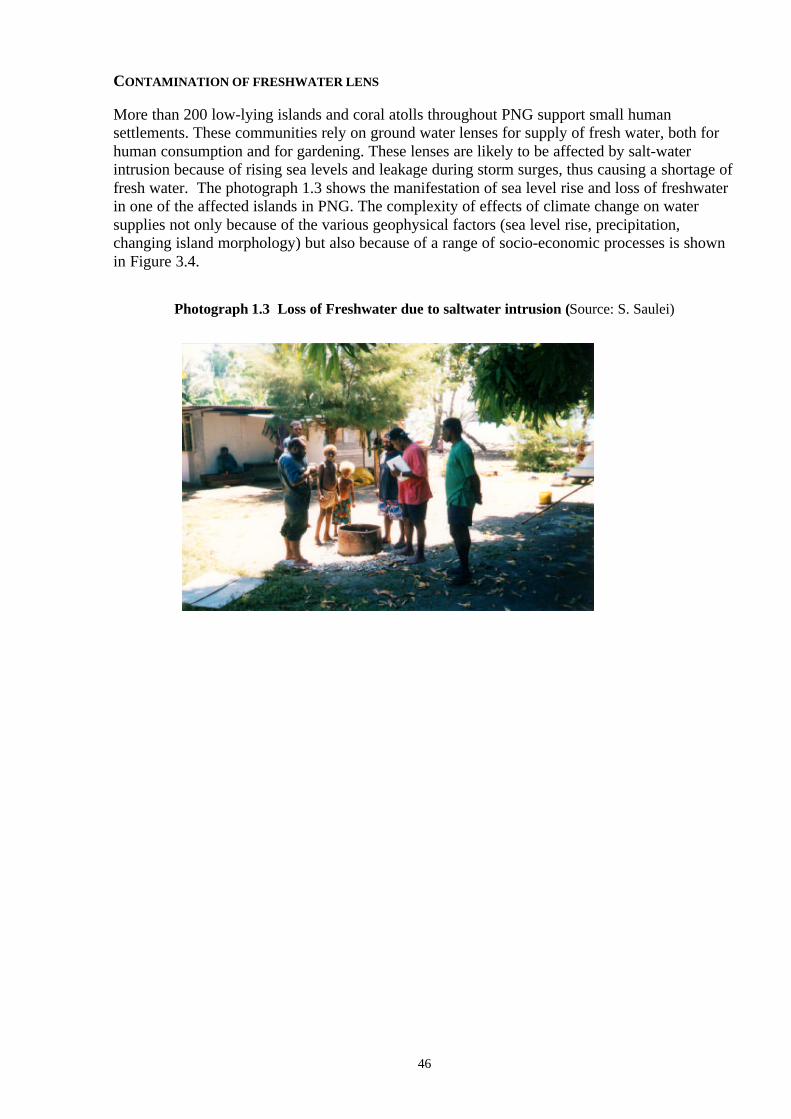
46
CONTAMINATION OF FRESHWATER LENS
More than 200 low-lying islands and coral atolls throughout PNG support small humansettlements. These communities rely on ground water lenses for supply of fresh water, both forhuman consumption and for gardening. These lenses are likely to be affected by salt-waterintrusion because of rising sea levels and leakage during storm surges, thus causing a shortage offresh water. The photograph 1.3 shows the manifestation of sea level rise and loss of freshwaterin one of the affected islands in PNG. The complexity of effects of climate change on watersupplies not only because of the various geophysical factors (sea level rise, precipitation,changing island morphology) but also because of a range of socio-economic processes is shownin Figure 3.4.
Photograph 1.3 Loss of Freshwater due to saltwater intrusion (Source: S. Saulei)
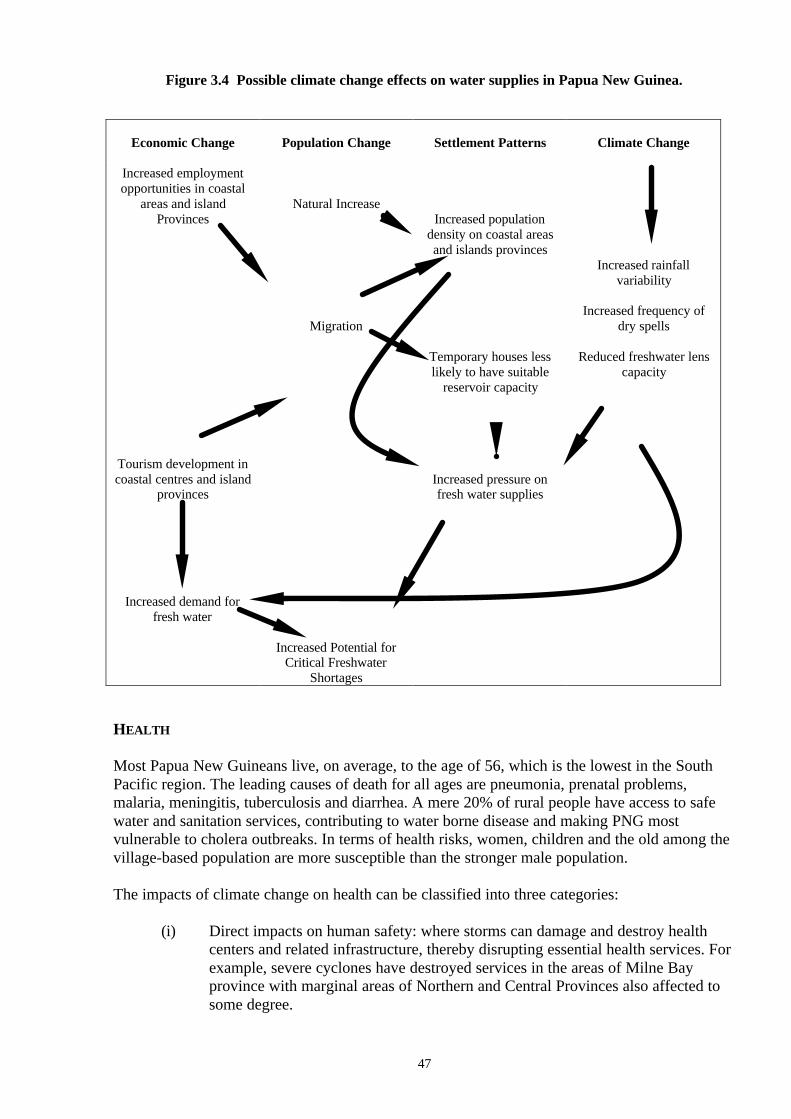
47
Figure 3.4 Possible climate change effects on water supplies in Papua New Guinea.
Economic Change Population Change Settlement Patterns Climate Change
Increased employmentopportunities in coastal
areas and islandProvinces
Tourism development incoastal centres and island
provinces
Increased demand forfresh water
Natural Increase
Migration
Increased Potential forCritical Freshwater
Shortages
Increased populationdensity on coastal areasand islands provinces
Temporary houses lesslikely to have suitable
reservoir capacity
Increased pressure onfresh water supplies
Increased rainfallvariability
Increased frequency ofdry spells
Reduced freshwater lenscapacity
HEALTH
Most Papua New Guineans live, on average, to the age of 56, which is the lowest in the SouthPacific region. The leading causes of death for all ages are pneumonia, prenatal problems,malaria, meningitis, tuberculosis and diarrhea. A mere 20% of rural people have access to safewater and sanitation services, contributing to water borne disease and making PNG mostvulnerable to cholera outbreaks. In terms of health risks, women, children and the old among thevillage-based population are more susceptible than the stronger male population.
The impacts of climate change on health can be classified into three categories:
(i) Direct impacts on human safety: where storms can damage and destroy healthcenters and related infrastructure, thereby disrupting essential health services. Forexample, severe cyclones have destroyed services in the areas of Milne Bayprovince with marginal areas of Northern and Central Provinces also affected tosome degree.
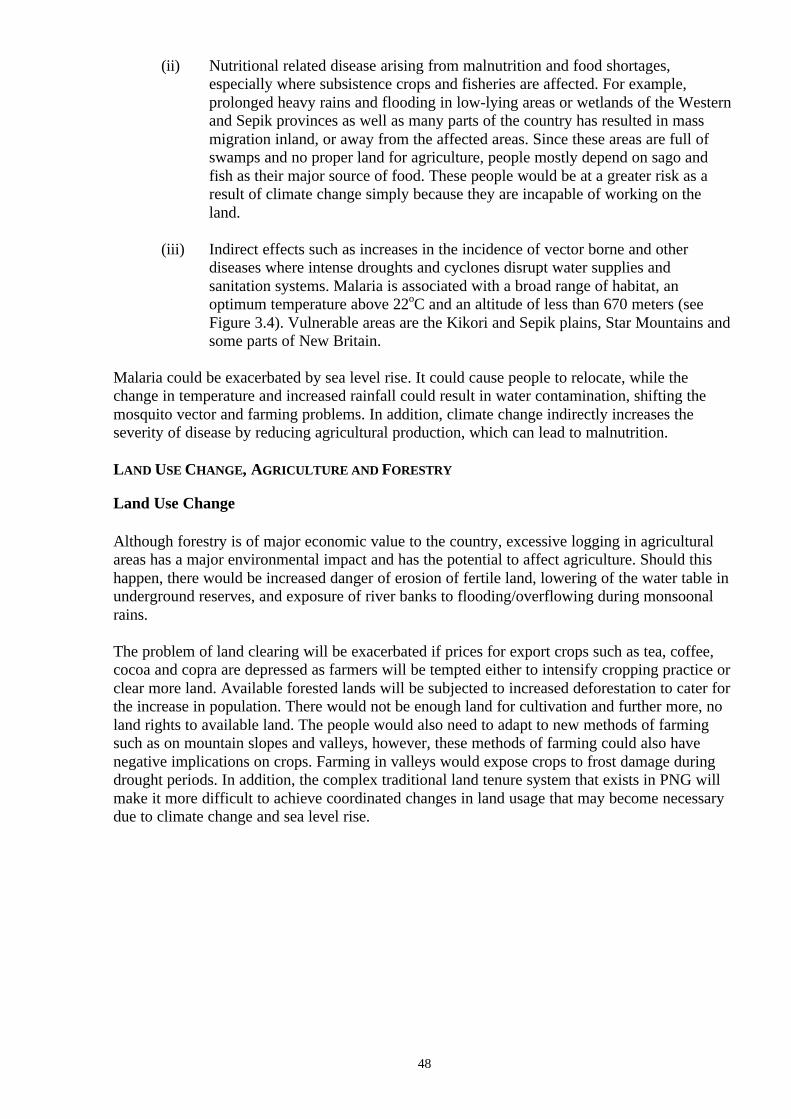
48
(ii) Nutritional related disease arising from malnutrition and food shortages,especially where subsistence crops and fisheries are affected. For example,prolonged heavy rains and flooding in low-lying areas or wetlands of the Westernand Sepik provinces as well as many parts of the country has resulted in massmigration inland, or away from the affected areas. Since these areas are full ofswamps and no proper land for agriculture, people mostly depend on sago andfish as their major source of food. These people would be at a greater risk as aresult of climate change simply because they are incapable of working on theland.
(iii) Indirect effects such as increases in the incidence of vector borne and otherdiseases where intense droughts and cyclones disrupt water supplies andsanitation systems. Malaria is associated with a broad range of habitat, anoptimum temperature above 22oC and an altitude of less than 670 meters (seeFigure 3.4). Vulnerable areas are the Kikori and Sepik plains, Star Mountains andsome parts of New Britain.
Malaria could be exacerbated by sea level rise. It could cause people to relocate, while thechange in temperature and increased rainfall could result in water contamination, shifting themosquito vector and farming problems. In addition, climate change indirectly increases theseverity of disease by reducing agricultural production, which can lead to malnutrition.
LAND USE CHANGE, AGRICULTURE AND FORESTRY
Land Use Change
Although forestry is of major economic value to the country, excessive logging in agriculturalareas has a major environmental impact and has the potential to affect agriculture. Should thishappen, there would be increased danger of erosion of fertile land, lowering of the water table inunderground reserves, and exposure of river banks to flooding/overflowing during monsoonalrains.
The problem of land clearing will be exacerbated if prices for export crops such as tea, coffee,cocoa and copra are depressed as farmers will be tempted either to intensify cropping practice orclear more land. Available forested lands will be subjected to increased deforestation to cater forthe increase in population. There would not be enough land for cultivation and further more, noland rights to available land. The people would also need to adapt to new methods of farmingsuch as on mountain slopes and valleys, however, these methods of farming could also havenegative implications on crops. Farming in valleys would expose crops to frost damage duringdrought periods. In addition, the complex traditional land tenure system that exists in PNG willmake it more difficult to achieve coordinated changes in land usage that may become necessarydue to climate change and sea level rise.
49
Figure 3.4: Malaria trends and possible habitats (source Natera, 1999).
LEGEND: Coloured habitats: Light Blue – Lake; Hash Blue: Differentiated Swamp; Hash Dark Blue: BlockedSwamp; Dotted Yellow: Esturines; Cris-cross Blue: Mangrove Swamp. Coloured Letters: F – Anopheles farauti; P– A. punctulatus; K – A. koliensis; W – A. karwari; S – A. subpictus; B – A. bancroffii
AGRICULTURE
Agriculture production is very sensitive to climate and climate variability. Crop yields areinfluenced by inter-annual variations in weather, nutrient status of soils and temperature. Climatechange will affect soils primarily through changes in soil moisture, soil temperature and soilorganic matter content.
The vulnerability of crops to climate change may either be increased or diminished by futuretechnological changes. If technological advances narrow the optimal range of input conditionsfor agricultural production (e.g. need for high levels of fertilizer), and if climate change results inincreased variability such as increases in frequency of droughts as well, production risks mayalso be expected to increase.
The direct effect of increased temperature generally decreases photosynthesis at temperaturesabove 25°C for tropical crops like sweet potato, cassava, taro and yams. In PNG (high islandcountry), rising temperature will raise the upper altitude limits at which tropical crops can becultivated. Higher temperatures will affect agricultural productivity, whereby farmers will besubjected to heat stress due to high temperature and humidity.
50
Other effects of rising temperatures include:
• rapid post-harvest deterioration of crops;
• greater rate of water loss through evaporation, especially in limestone areas, leading togreater occurrences of droughts in low-lying areas, and a decline in soil fertility;
• flooding of low lying areas if accompanied by higher rainfall. Soils will suffer greaterleaching and loss of fertility and the humid conditions will favor increased incubation ofagricultural pests and diseases;
• shorter time for crops to mature, hence smaller produce and thus, a lower overall yield.
Carbon dioxide will have the greatest potential effect on agricultural yields, especially for majortropical C3 plants that depend on carbon dioxide for photosynthesis, like sweet potato, cassava,taro and yams. Experiments based on doubling of CO2 concentrations have confirmed that “CO2
fertilization” can increase mean yield of C3 crops by 30%. These tropical plants are a staple dietto PNG subsistence farming population. With more carbon dioxide in the atmosphere, the rate ofphotosynthesis in these plants will increase. Although this may be of benefit to these tropicaltuber crops, increased carbon dioxide would also enhance weed growth, which could adverselyaffect yields.
FORESTRY
Natural forests are disappearing through shifting agriculture at a rate of between 200,000-250,000 ha annually, logging by some 60,000ha and other forms of developments (infrastructure,large-scale commercial agriculture, settlements, etc.). At present, the extent of plantation forestrycovers only about 59,000ha, while treated natural forests only accounts for about 6,600hacompared to the rate of forest removals. At this rate of removals and replacements, it becomesvery obvious that the current estimated acreage of productive forests (ca. 14 million ha) wouldnot last further than 50-60 years.
Changes in temperature may affect the formation of cloud forests, which occupy a very narrowgeographical and climatological niche. A slight shift in temperature or precipitation patternscould cause this zone to shift upwards enough to be eliminated.
ADAPTIVE MEASURES
INTRODUCTION
The capacity to adapt to climate variability and climate change is affected by a range ofinstitutional, technological and cultural features. There needs to be a fundamental shift in theimportance given to sound environmental management with a mainstreaming of environmentalconsiderations at planning and policy levels. There is probably a role here for large internationalorganizations (e.g., UNDP, EU) to assist however, various past efforts in this regard have beenless than successful.
Careful thoughts should also be given to the level of implementation of any intervention. Thatis, whether it is site specific or at a generic level, or whether it should be from the bottom up ortop down, or whether it is culturally acceptable, or whether the timing is right and what costs andbenefits will these bring. Table 3.4 below summarises the range of adaptation measures in eachof the sectors.
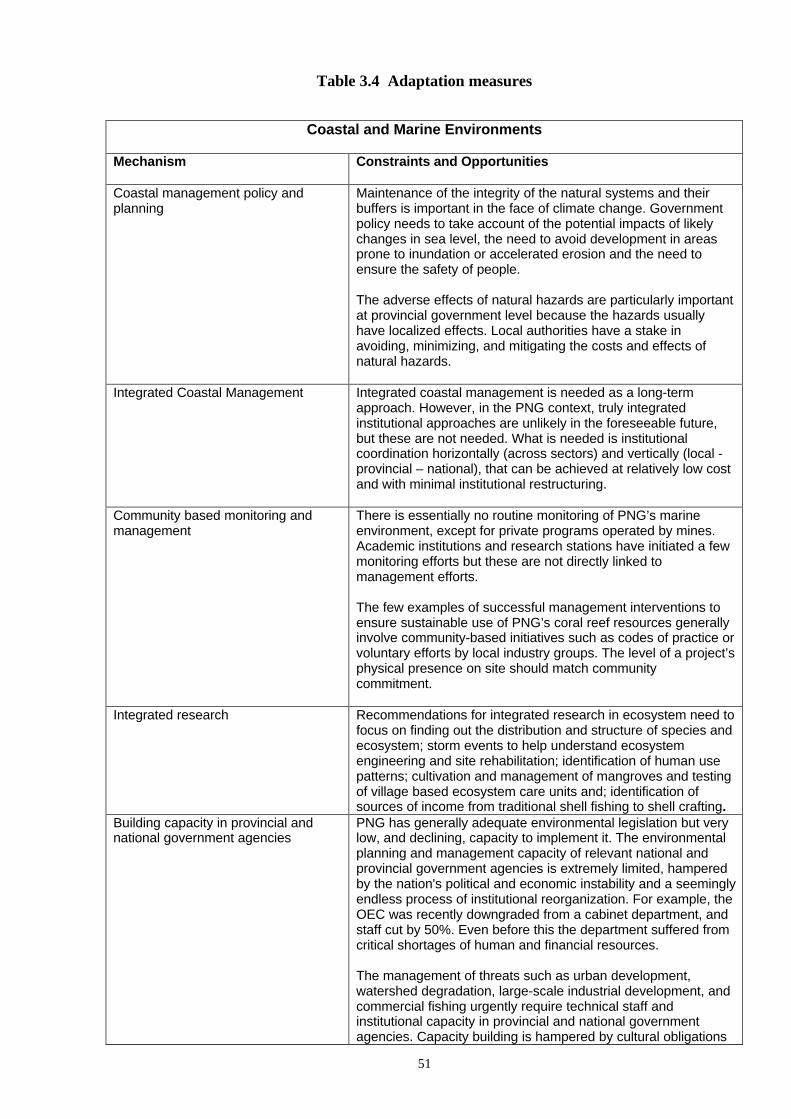
51
Table 3.4 Adaptation measures
Coastal and Marine Environments
Mechanism Constraints and Opportunities
Coastal management policy andplanning
Maintenance of the integrity of the natural systems and theirbuffers is important in the face of climate change. Governmentpolicy needs to take account of the potential impacts of likelychanges in sea level, the need to avoid development in areasprone to inundation or accelerated erosion and the need toensure the safety of people.
The adverse effects of natural hazards are particularly importantat provincial government level because the hazards usuallyhave localized effects. Local authorities have a stake inavoiding, minimizing, and mitigating the costs and effects ofnatural hazards.
Integrated Coastal Management Integrated coastal management is needed as a long-termapproach. However, in the PNG context, truly integratedinstitutional approaches are unlikely in the foreseeable future,but these are not needed. What is needed is institutionalcoordination horizontally (across sectors) and vertically (local -provincial – national), that can be achieved at relatively low costand with minimal institutional restructuring.
Community based monitoring andmanagement
There is essentially no routine monitoring of PNG’s marineenvironment, except for private programs operated by mines.Academic institutions and research stations have initiated a fewmonitoring efforts but these are not directly linked tomanagement efforts.
The few examples of successful management interventions toensure sustainable use of PNG’s coral reef resources generallyinvolve community-based initiatives such as codes of practice orvoluntary efforts by local industry groups. The level of a project’sphysical presence on site should match communitycommitment.
Integrated research Recommendations for integrated research in ecosystem need tofocus on finding out the distribution and structure of species andecosystem; storm events to help understand ecosystemengineering and site rehabilitation; identification of human usepatterns; cultivation and management of mangroves and testingof village based ecosystem care units and; identification ofsources of income from traditional shell fishing to shell crafting.
Building capacity in provincial andnational government agencies
PNG has generally adequate environmental legislation but verylow, and declining, capacity to implement it. The environmentalplanning and management capacity of relevant national andprovincial government agencies is extremely limited, hamperedby the nation's political and economic instability and a seeminglyendless process of institutional reorganization. For example, theOEC was recently downgraded from a cabinet department, andstaff cut by 50%. Even before this the department suffered fromcritical shortages of human and financial resources.
The management of threats such as urban development,watershed degradation, large-scale industrial development, andcommercial fishing urgently require technical staff andinstitutional capacity in provincial and national governmentagencies. Capacity building is hampered by cultural obligations
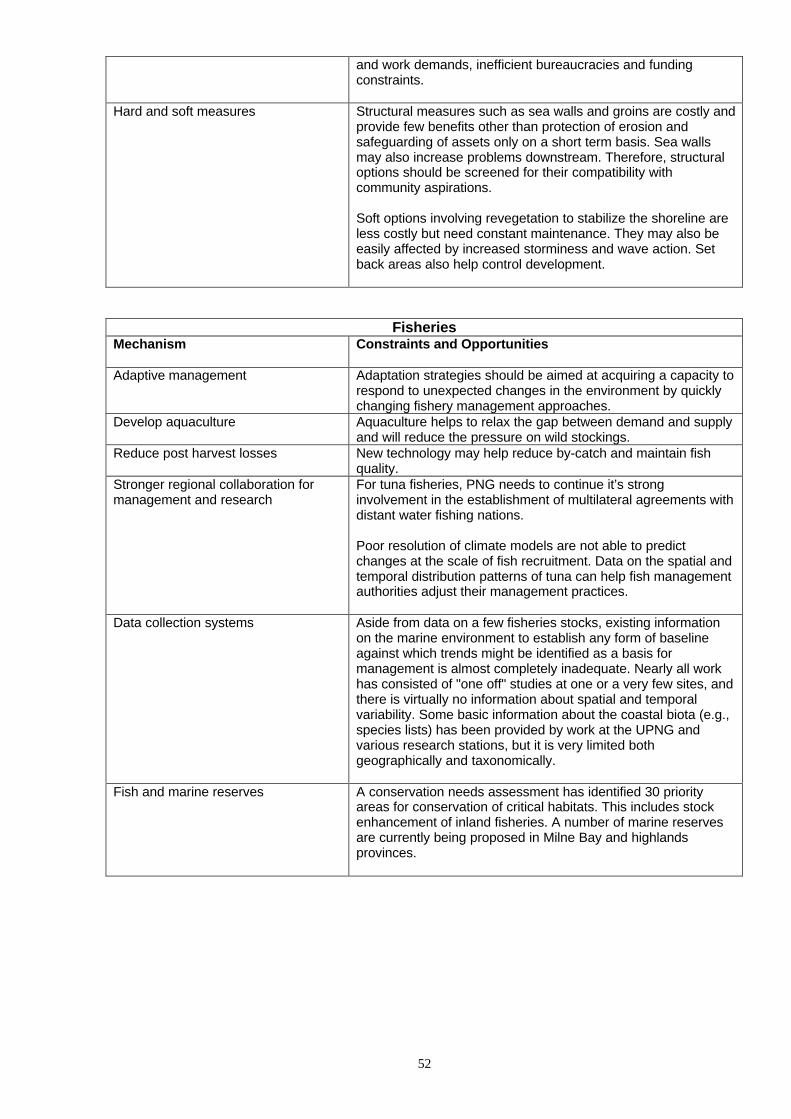
52
and work demands, inefficient bureaucracies and fundingconstraints.
Hard and soft measures Structural measures such as sea walls and groins are costly andprovide few benefits other than protection of erosion andsafeguarding of assets only on a short term basis. Sea wallsmay also increase problems downstream. Therefore, structuraloptions should be screened for their compatibility withcommunity aspirations.
Soft options involving revegetation to stabilize the shoreline areless costly but need constant maintenance. They may also beeasily affected by increased storminess and wave action. Setback areas also help control development.
FisheriesMechanism Constraints and Opportunities
Adaptive management Adaptation strategies should be aimed at acquiring a capacity torespond to unexpected changes in the environment by quicklychanging fishery management approaches.
Develop aquaculture Aquaculture helps to relax the gap between demand and supplyand will reduce the pressure on wild stockings.
Reduce post harvest losses New technology may help reduce by-catch and maintain fishquality.
Stronger regional collaboration formanagement and research
For tuna fisheries, PNG needs to continue it’s stronginvolvement in the establishment of multilateral agreements withdistant water fishing nations.
Poor resolution of climate models are not able to predictchanges at the scale of fish recruitment. Data on the spatial andtemporal distribution patterns of tuna can help fish managementauthorities adjust their management practices.
Data collection systems Aside from data on a few fisheries stocks, existing informationon the marine environment to establish any form of baselineagainst which trends might be identified as a basis formanagement is almost completely inadequate. Nearly all workhas consisted of "one off" studies at one or a very few sites, andthere is virtually no information about spatial and temporalvariability. Some basic information about the coastal biota (e.g.,species lists) has been provided by work at the UPNG andvarious research stations, but it is very limited bothgeographically and taxonomically.
Fish and marine reserves A conservation needs assessment has identified 30 priorityareas for conservation of critical habitats. This includes stockenhancement of inland fisheries. A number of marine reservesare currently being proposed in Milne Bay and highlandsprovinces.
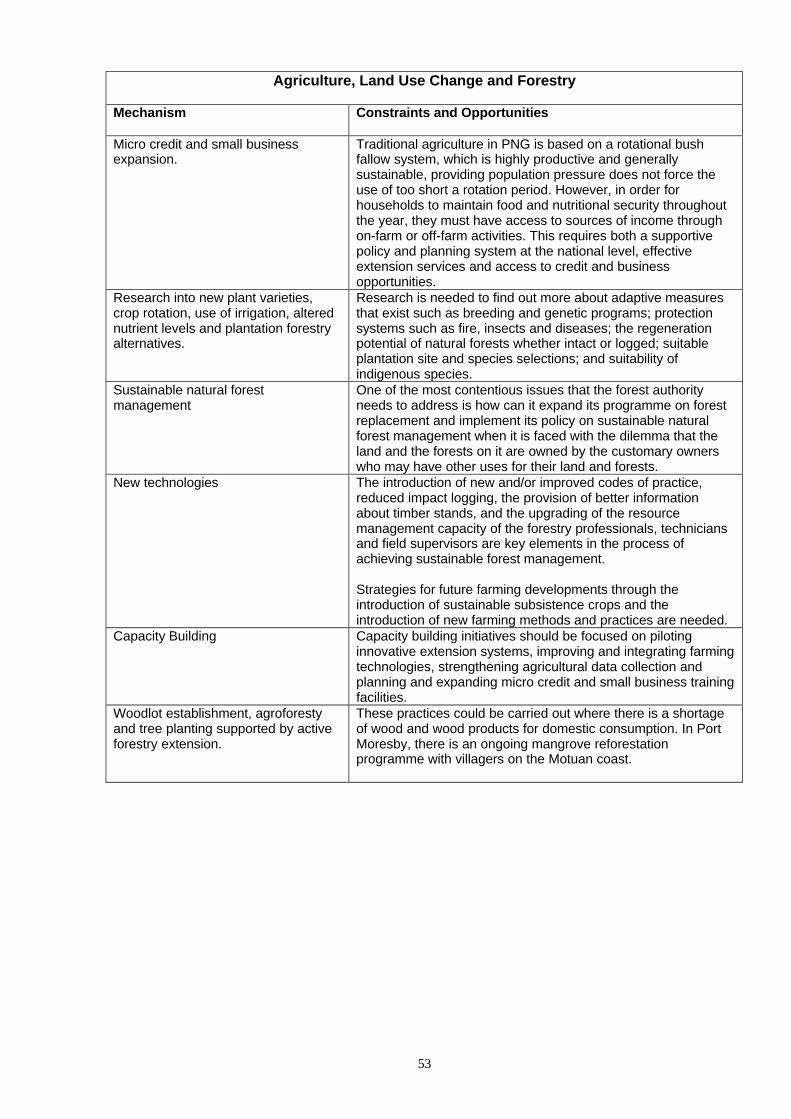
53
Agriculture, Land Use Change and Forestry
Mechanism Constraints and Opportunities
Micro credit and small businessexpansion.
Traditional agriculture in PNG is based on a rotational bushfallow system, which is highly productive and generallysustainable, providing population pressure does not force theuse of too short a rotation period. However, in order forhouseholds to maintain food and nutritional security throughoutthe year, they must have access to sources of income throughon-farm or off-farm activities. This requires both a supportivepolicy and planning system at the national level, effectiveextension services and access to credit and businessopportunities.
Research into new plant varieties,crop rotation, use of irrigation, alterednutrient levels and plantation forestryalternatives.
Research is needed to find out more about adaptive measuresthat exist such as breeding and genetic programs; protectionsystems such as fire, insects and diseases; the regenerationpotential of natural forests whether intact or logged; suitableplantation site and species selections; and suitability ofindigenous species.
Sustainable natural forestmanagement
One of the most contentious issues that the forest authorityneeds to address is how can it expand its programme on forestreplacement and implement its policy on sustainable naturalforest management when it is faced with the dilemma that theland and the forests on it are owned by the customary ownerswho may have other uses for their land and forests.
New technologies The introduction of new and/or improved codes of practice,reduced impact logging, the provision of better informationabout timber stands, and the upgrading of the resourcemanagement capacity of the forestry professionals, techniciansand field supervisors are key elements in the process ofachieving sustainable forest management.
Strategies for future farming developments through theintroduction of sustainable subsistence crops and theintroduction of new farming methods and practices are needed.
Capacity Building Capacity building initiatives should be focused on pilotinginnovative extension systems, improving and integrating farmingtechnologies, strengthening agricultural data collection andplanning and expanding micro credit and small business trainingfacilities.
Woodlot establishment, agroforestyand tree planting supported by activeforestry extension.
These practices could be carried out where there is a shortageof wood and wood products for domestic consumption. In PortMoresby, there is an ongoing mangrove reforestationprogramme with villagers on the Motuan coast.
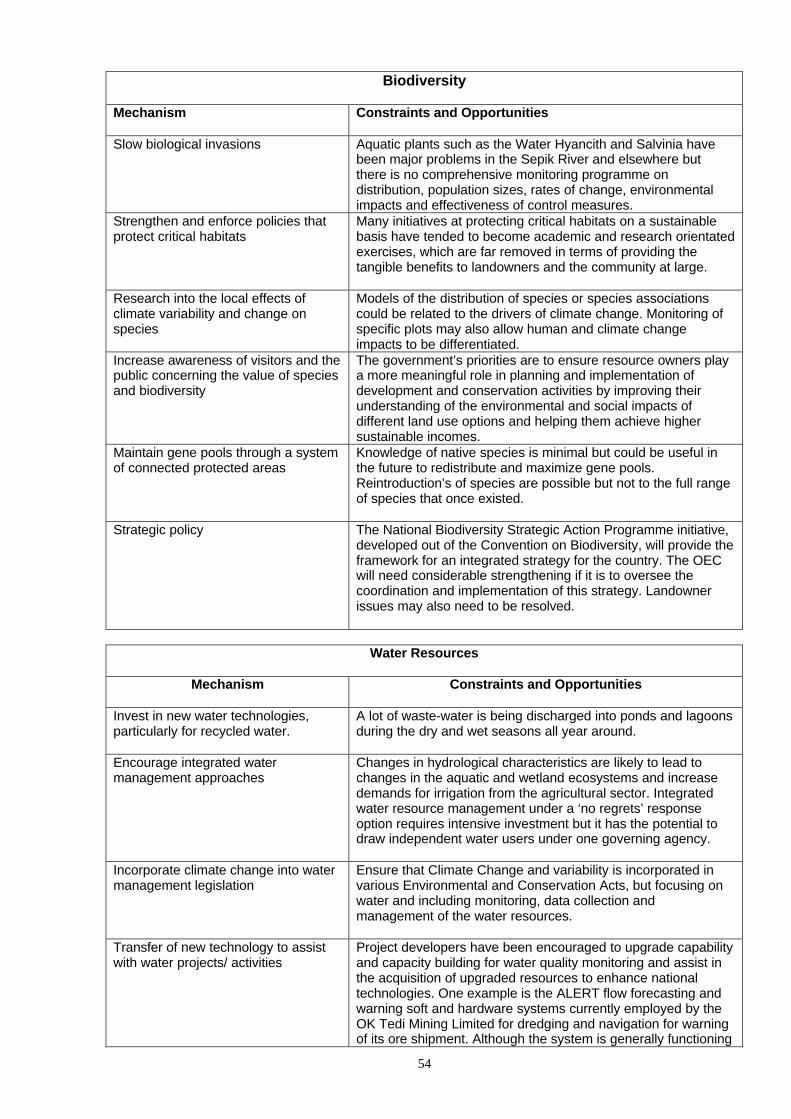
54
Biodiversity
Mechanism Constraints and Opportunities
Slow biological invasions Aquatic plants such as the Water Hyancith and Salvinia havebeen major problems in the Sepik River and elsewhere butthere is no comprehensive monitoring programme ondistribution, population sizes, rates of change, environmentalimpacts and effectiveness of control measures.
Strengthen and enforce policies thatprotect critical habitats
Many initiatives at protecting critical habitats on a sustainablebasis have tended to become academic and research orientatedexercises, which are far removed in terms of providing thetangible benefits to landowners and the community at large.
Research into the local effects ofclimate variability and change onspecies
Models of the distribution of species or species associationscould be related to the drivers of climate change. Monitoring ofspecific plots may also allow human and climate changeimpacts to be differentiated.
Increase awareness of visitors and thepublic concerning the value of speciesand biodiversity
The government’s priorities are to ensure resource owners playa more meaningful role in planning and implementation ofdevelopment and conservation activities by improving theirunderstanding of the environmental and social impacts ofdifferent land use options and helping them achieve highersustainable incomes.
Maintain gene pools through a systemof connected protected areas
Knowledge of native species is minimal but could be useful inthe future to redistribute and maximize gene pools.Reintroduction’s of species are possible but not to the full rangeof species that once existed.
Strategic policy The National Biodiversity Strategic Action Programme initiative,developed out of the Convention on Biodiversity, will provide theframework for an integrated strategy for the country. The OECwill need considerable strengthening if it is to oversee thecoordination and implementation of this strategy. Landownerissues may also need to be resolved.
Water Resources
Mechanism Constraints and Opportunities
Invest in new water technologies,particularly for recycled water.
A lot of waste-water is being discharged into ponds and lagoonsduring the dry and wet seasons all year around.
Encourage integrated watermanagement approaches
Changes in hydrological characteristics are likely to lead tochanges in the aquatic and wetland ecosystems and increasedemands for irrigation from the agricultural sector. Integratedwater resource management under a ‘no regrets’ responseoption requires intensive investment but it has the potential todraw independent water users under one governing agency.
Incorporate climate change into watermanagement legislation
Ensure that Climate Change and variability is incorporated invarious Environmental and Conservation Acts, but focusing onwater and including monitoring, data collection andmanagement of the water resources.
Transfer of new technology to assistwith water projects/ activities
Project developers have been encouraged to upgrade capabilityand capacity building for water quality monitoring and assist inthe acquisition of upgraded resources to enhance nationaltechnologies. One example is the ALERT flow forecasting andwarning soft and hardware systems currently employed by theOK Tedi Mining Limited for dredging and navigation for warningof its ore shipment. Although the system is generally functioning
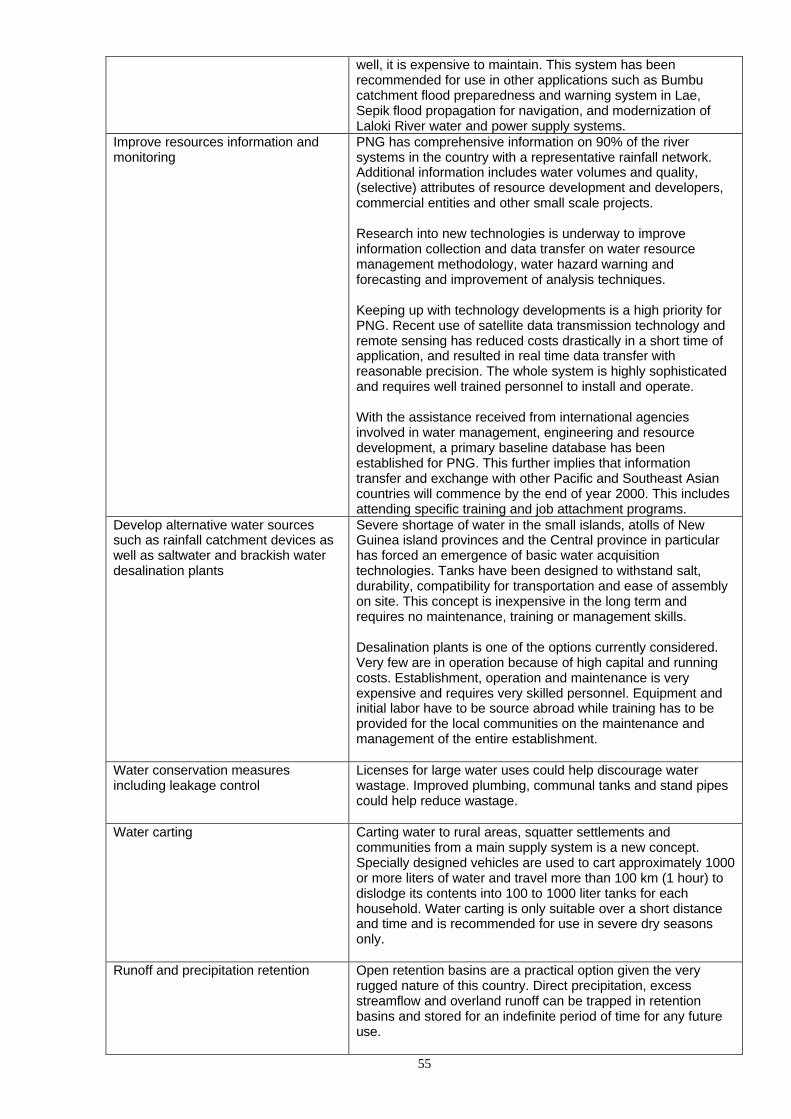
55
well, it is expensive to maintain. This system has beenrecommended for use in other applications such as Bumbucatchment flood preparedness and warning system in Lae,Sepik flood propagation for navigation, and modernization ofLaloki River water and power supply systems.
Improve resources information andmonitoring
PNG has comprehensive information on 90% of the riversystems in the country with a representative rainfall network.Additional information includes water volumes and quality,(selective) attributes of resource development and developers,commercial entities and other small scale projects.
Research into new technologies is underway to improveinformation collection and data transfer on water resourcemanagement methodology, water hazard warning andforecasting and improvement of analysis techniques.
Keeping up with technology developments is a high priority forPNG. Recent use of satellite data transmission technology andremote sensing has reduced costs drastically in a short time ofapplication, and resulted in real time data transfer withreasonable precision. The whole system is highly sophisticatedand requires well trained personnel to install and operate.
With the assistance received from international agenciesinvolved in water management, engineering and resourcedevelopment, a primary baseline database has beenestablished for PNG. This further implies that informationtransfer and exchange with other Pacific and Southeast Asiancountries will commence by the end of year 2000. This includesattending specific training and job attachment programs.
Develop alternative water sourcessuch as rainfall catchment devices aswell as saltwater and brackish waterdesalination plants
Severe shortage of water in the small islands, atolls of NewGuinea island provinces and the Central province in particularhas forced an emergence of basic water acquisitiontechnologies. Tanks have been designed to withstand salt,durability, compatibility for transportation and ease of assemblyon site. This concept is inexpensive in the long term andrequires no maintenance, training or management skills.
Desalination plants is one of the options currently considered.Very few are in operation because of high capital and runningcosts. Establishment, operation and maintenance is veryexpensive and requires very skilled personnel. Equipment andinitial labor have to be source abroad while training has to beprovided for the local communities on the maintenance andmanagement of the entire establishment.
Water conservation measuresincluding leakage control
Licenses for large water uses could help discourage waterwastage. Improved plumbing, communal tanks and stand pipescould help reduce wastage.
Water carting Carting water to rural areas, squatter settlements andcommunities from a main supply system is a new concept.Specially designed vehicles are used to cart approximately 1000or more liters of water and travel more than 100 km (1 hour) todislodge its contents into 100 to 1000 liter tanks for eachhousehold. Water carting is only suitable over a short distanceand time and is recommended for use in severe dry seasonsonly.
Runoff and precipitation retention Open retention basins are a practical option given the veryrugged nature of this country. Direct precipitation, excessstreamflow and overland runoff can be trapped in retentionbasins and stored for an indefinite period of time for any futureuse.
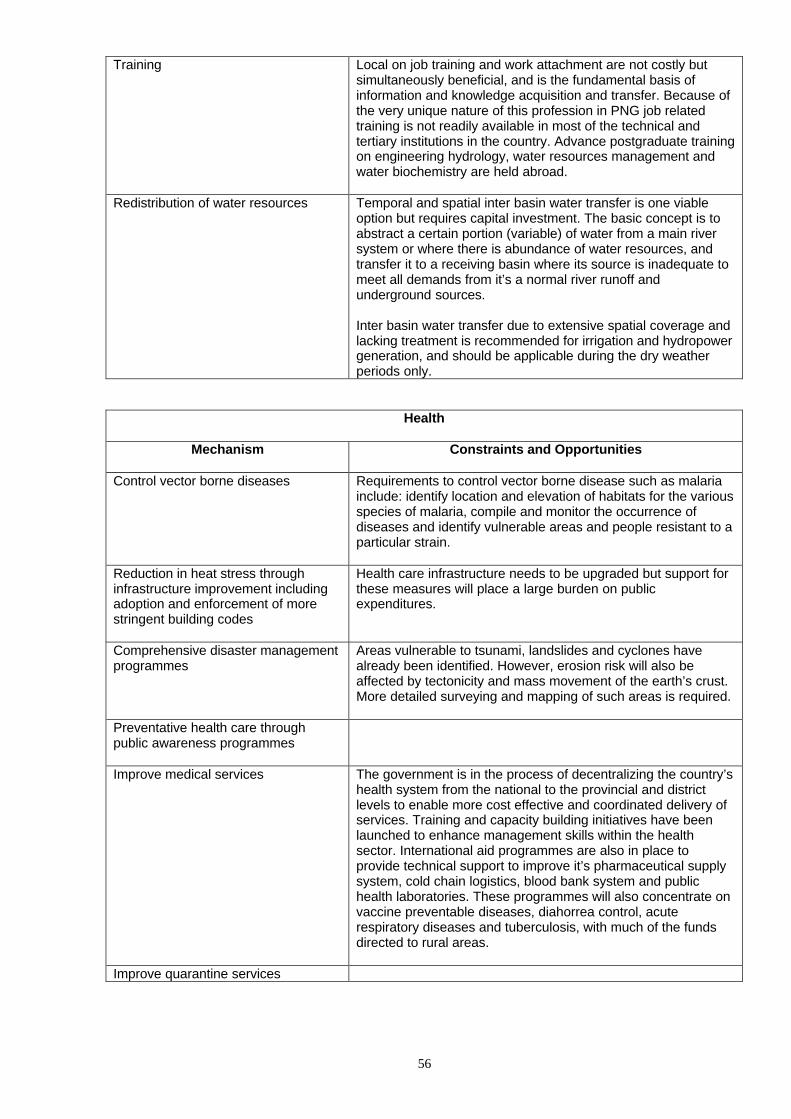
56
Training Local on job training and work attachment are not costly butsimultaneously beneficial, and is the fundamental basis ofinformation and knowledge acquisition and transfer. Because ofthe very unique nature of this profession in PNG job relatedtraining is not readily available in most of the technical andtertiary institutions in the country. Advance postgraduate trainingon engineering hydrology, water resources management andwater biochemistry are held abroad.
Redistribution of water resources Temporal and spatial inter basin water transfer is one viableoption but requires capital investment. The basic concept is toabstract a certain portion (variable) of water from a main riversystem or where there is abundance of water resources, andtransfer it to a receiving basin where its source is inadequate tomeet all demands from it’s a normal river runoff andunderground sources.
Inter basin water transfer due to extensive spatial coverage andlacking treatment is recommended for irrigation and hydropowergeneration, and should be applicable during the dry weatherperiods only.
Health
Mechanism Constraints and Opportunities
Control vector borne diseases Requirements to control vector borne disease such as malariainclude: identify location and elevation of habitats for the variousspecies of malaria, compile and monitor the occurrence ofdiseases and identify vulnerable areas and people resistant to aparticular strain.
Reduction in heat stress throughinfrastructure improvement includingadoption and enforcement of morestringent building codes
Health care infrastructure needs to be upgraded but support forthese measures will place a large burden on publicexpenditures.
Comprehensive disaster managementprogrammes
Areas vulnerable to tsunami, landslides and cyclones havealready been identified. However, erosion risk will also beaffected by tectonicity and mass movement of the earth’s crust.More detailed surveying and mapping of such areas is required.
Preventative health care throughpublic awareness programmes
Improve medical services The government is in the process of decentralizing the country’shealth system from the national to the provincial and districtlevels to enable more cost effective and coordinated delivery ofservices. Training and capacity building initiatives have beenlaunched to enhance management skills within the healthsector. International aid programmes are also in place toprovide technical support to improve it’s pharmaceutical supplysystem, cold chain logistics, blood bank system and publichealth laboratories. These programmes will also concentrate onvaccine preventable diseases, diahorrea control, acuterespiratory diseases and tuberculosis, with much of the fundsdirected to rural areas.
Improve quarantine services
57
CONCLUSION
Climate change, variability and sea level rise are important issues, which affect the developmentand environment of PNG. The adaptation strategies to minimise impacts do not need extensivenew interventions, but rather the enhancement of current practices. The development choicesmade today and mistakes magnified in the face of climate change will be felt by futuregenerations. The resilience of economic, social and environmental systems is expected todecrease and the country may feel the full magnitude of climate change impacts.
In PNG, the most vulnerable would be the village-based population, which depend onsubsistence farming for their livelihood and means of cash income. Those who are dependent onfarming, fishing or forestry would see their livelihoods degraded by the changes in rainfallpatterns, degraded soils, forests and fishing grounds. They would find it more difficult to changeover to new crops and farming practices and methods, adopt effective irrigation methods, acquirecultivable land for continued farming and adopt better fishing methods.
The time to act to reduce the vulnerability of the country is now. Appropriate actions will haveto be implemented as these will go a long way toward reducing the magnitude of the damagesbrought about by climate change and human activities on the environment in the future. Thechallenge will be to determine how to make some adjustments to the current path ofdevelopment, whilst still achieving economic gains without investing in high cost or badlyconceived solutions.
58
CHAPTER 4
MITIGATION OPTIONS - ENERGY, TRANSPORT, FORESTRY ANDWASTE
INTRODUCTION
The energy, transport and forestry sectors are important as the economic backbone of thecountry. The different types of waste (solid, liquid and hazardous) as by-products of differentsectors, including energy, transport and forestry, require urgent attention to reduce theemissions of GHG. For the people of PNG to seriously mitigate the impacts of climatechange and variability so that their actions have long term environment and economicsustainability; identification of range of mitigation and adaptation options especially the"non-regrets" types should be given priority.
In Papua New Guinea, the options to use forests as a major sink is quite obvious, with largetracts of forests still intact and the potential for establishing reforestation and afforestationneeds to be explored. The use of intact forests for mitigation GHG emissions would alsoenhance PNG’s approaches to conserving its unique and very rich biological diversity.Similarly, the options for use of biomass, biogas, hydro-power, etc., from the availableresources in the country needs to be considered.
Presented below in Table 4.1are some important mitigation options in the energy, forestry,transport and waste that have been identified. However, no analysis of mitigation optionmeasures were not done due to lack of data. Some activities/programmes are currently beingimplemented to reduce GHG emissions and to cope with the climate change and extremevariability signals. The government (provincial), landowners and private groups ought toassess the potential of these mitigation options and develop them as programmes for thecountry.
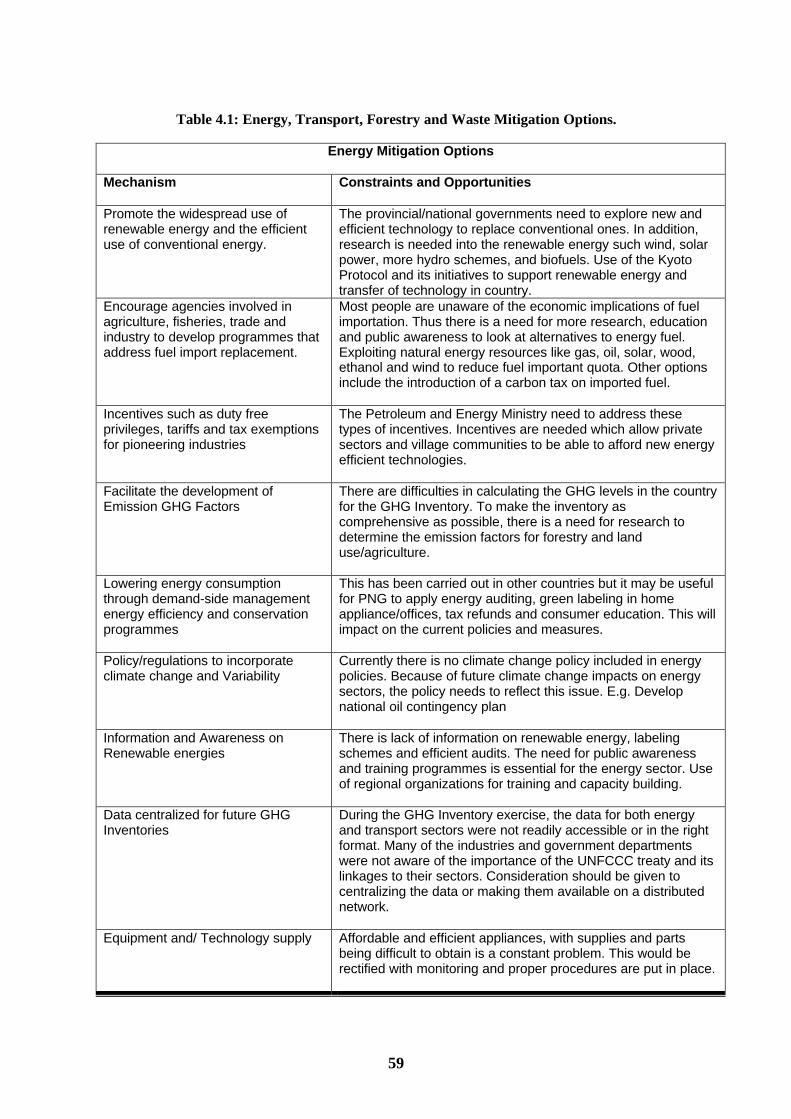
59
Table 4.1: Energy, Transport, Forestry and Waste Mitigation Options.
Energy Mitigation Options
Mechanism Constraints and Opportunities
Promote the widespread use ofrenewable energy and the efficientuse of conventional energy.
The provincial/national governments need to explore new andefficient technology to replace conventional ones. In addition,research is needed into the renewable energy such wind, solarpower, more hydro schemes, and biofuels. Use of the KyotoProtocol and its initiatives to support renewable energy andtransfer of technology in country.
Encourage agencies involved inagriculture, fisheries, trade andindustry to develop programmes thataddress fuel import replacement.
Most people are unaware of the economic implications of fuelimportation. Thus there is a need for more research, educationand public awareness to look at alternatives to energy fuel.Exploiting natural energy resources like gas, oil, solar, wood,ethanol and wind to reduce fuel important quota. Other optionsinclude the introduction of a carbon tax on imported fuel.
Incentives such as duty freeprivileges, tariffs and tax exemptionsfor pioneering industries
The Petroleum and Energy Ministry need to address thesetypes of incentives. Incentives are needed which allow privatesectors and village communities to be able to afford new energyefficient technologies.
Facilitate the development ofEmission GHG Factors
There are difficulties in calculating the GHG levels in the countryfor the GHG Inventory. To make the inventory ascomprehensive as possible, there is a need for research todetermine the emission factors for forestry and landuse/agriculture.
Lowering energy consumptionthrough demand-side managementenergy efficiency and conservationprogrammes
This has been carried out in other countries but it may be usefulfor PNG to apply energy auditing, green labeling in homeappliance/offices, tax refunds and consumer education. This willimpact on the current policies and measures.
Policy/regulations to incorporateclimate change and Variability
Currently there is no climate change policy included in energypolicies. Because of future climate change impacts on energysectors, the policy needs to reflect this issue. E.g. Developnational oil contingency plan
Information and Awareness onRenewable energies
There is lack of information on renewable energy, labelingschemes and efficient audits. The need for public awarenessand training programmes is essential for the energy sector. Useof regional organizations for training and capacity building.
Data centralized for future GHGInventories
During the GHG Inventory exercise, the data for both energyand transport sectors were not readily accessible or in the rightformat. Many of the industries and government departmentswere not aware of the importance of the UNFCCC treaty and itslinkages to their sectors. Consideration should be given tocentralizing the data or making them available on a distributednetwork.
Equipment and/ Technology supply Affordable and efficient appliances, with supplies and partsbeing difficult to obtain is a constant problem. This would berectified with monitoring and proper procedures are put in place.
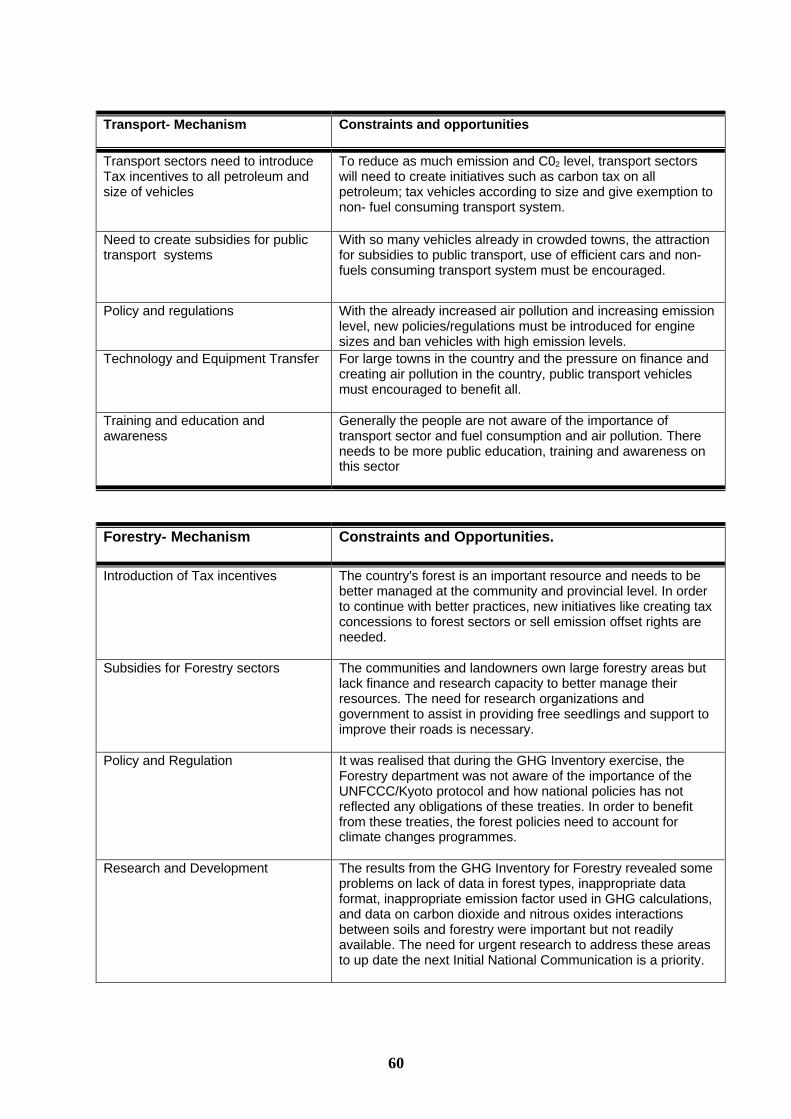
60
Transport- Mechanism Constraints and opportunities
Transport sectors need to introduceTax incentives to all petroleum andsize of vehicles
To reduce as much emission and C02 level, transport sectorswill need to create initiatives such as carbon tax on allpetroleum; tax vehicles according to size and give exemption tonon- fuel consuming transport system.
Need to create subsidies for publictransport systems
With so many vehicles already in crowded towns, the attractionfor subsidies to public transport, use of efficient cars and non-fuels consuming transport system must be encouraged.
Policy and regulations With the already increased air pollution and increasing emissionlevel, new policies/regulations must be introduced for enginesizes and ban vehicles with high emission levels.
Technology and Equipment Transfer For large towns in the country and the pressure on finance andcreating air pollution in the country, public transport vehiclesmust encouraged to benefit all.
Training and education andawareness
Generally the people are not aware of the importance oftransport sector and fuel consumption and air pollution. Thereneeds to be more public education, training and awareness onthis sector
Forestry- Mechanism Constraints and Opportunities.
Introduction of Tax incentives The country's forest is an important resource and needs to bebetter managed at the community and provincial level. In orderto continue with better practices, new initiatives like creating taxconcessions to forest sectors or sell emission offset rights areneeded.
Subsidies for Forestry sectors The communities and landowners own large forestry areas butlack finance and research capacity to better manage theirresources. The need for research organizations andgovernment to assist in providing free seedlings and support toimprove their roads is necessary.
Policy and Regulation It was realised that during the GHG Inventory exercise, theForestry department was not aware of the importance of theUNFCCC/Kyoto protocol and how national policies has notreflected any obligations of these treaties. In order to benefitfrom these treaties, the forest policies need to account forclimate changes programmes.
Research and Development The results from the GHG Inventory for Forestry revealed someproblems on lack of data in forest types, inappropriate dataformat, inappropriate emission factor used in GHG calculations,and data on carbon dioxide and nitrous oxides interactionsbetween soils and forestry were important but not readilyavailable. The need for urgent research to address these areasto up date the next Initial National Communication is a priority.
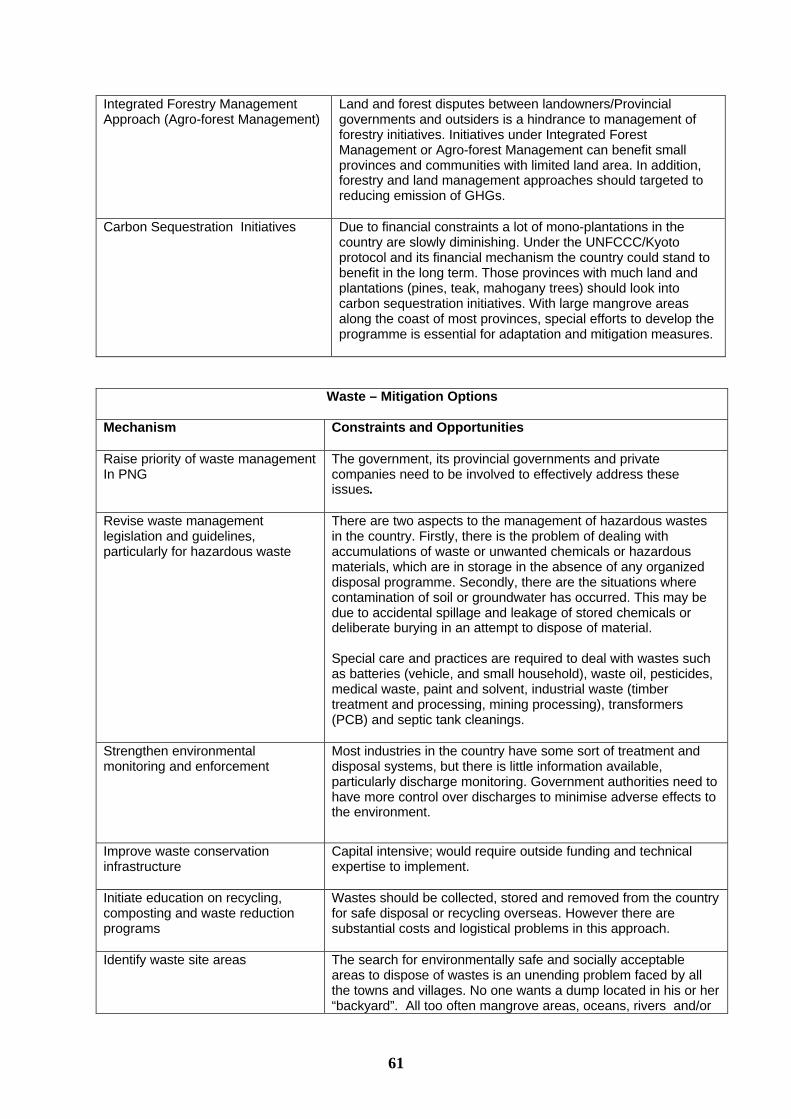
61
Integrated Forestry ManagementApproach (Agro-forest Management)
Land and forest disputes between landowners/Provincialgovernments and outsiders is a hindrance to management offorestry initiatives. Initiatives under Integrated ForestManagement or Agro-forest Management can benefit smallprovinces and communities with limited land area. In addition,forestry and land management approaches should targeted toreducing emission of GHGs.
Carbon Sequestration Initiatives Due to financial constraints a lot of mono-plantations in thecountry are slowly diminishing. Under the UNFCCC/Kyotoprotocol and its financial mechanism the country could stand tobenefit in the long term. Those provinces with much land andplantations (pines, teak, mahogany trees) should look intocarbon sequestration initiatives. With large mangrove areasalong the coast of most provinces, special efforts to develop theprogramme is essential for adaptation and mitigation measures.
Waste – Mitigation Options
Mechanism Constraints and Opportunities
Raise priority of waste managementIn PNG
The government, its provincial governments and privatecompanies need to be involved to effectively address theseissues.
Revise waste managementlegislation and guidelines,particularly for hazardous waste
There are two aspects to the management of hazardous wastesin the country. Firstly, there is the problem of dealing withaccumulations of waste or unwanted chemicals or hazardousmaterials, which are in storage in the absence of any organizeddisposal programme. Secondly, there are the situations wherecontamination of soil or groundwater has occurred. This may bedue to accidental spillage and leakage of stored chemicals ordeliberate burying in an attempt to dispose of material.
Special care and practices are required to deal with wastes suchas batteries (vehicle, and small household), waste oil, pesticides,medical waste, paint and solvent, industrial waste (timbertreatment and processing, mining processing), transformers(PCB) and septic tank cleanings.
Strengthen environmentalmonitoring and enforcement
Most industries in the country have some sort of treatment anddisposal systems, but there is little information available,particularly discharge monitoring. Government authorities need tohave more control over discharges to minimise adverse effects tothe environment.
Improve waste conservationinfrastructure
Capital intensive; would require outside funding and technicalexpertise to implement.
Initiate education on recycling,composting and waste reductionprograms
Wastes should be collected, stored and removed from the countryfor safe disposal or recycling overseas. However there aresubstantial costs and logistical problems in this approach.
Identify waste site areas The search for environmentally safe and socially acceptableareas to dispose of wastes is an unending problem faced by allthe towns and villages. No one wants a dump located in his or her“backyard”. All too often mangrove areas, oceans, rivers and/or
62
beaches become landfills by default. Export of wastes should bein accordance with international conventions.
Education, Training and awareness Waste is priority issue for the country and its towns and villages,especially cleanness and health reasons. The importance ofpublic awareness, training and education for the whole countrymust be given priority.
Integrated Waste Management The different types of waste (solid, liquid and hazardous)introduced into the towns and villages are long term concern. Anywaste management programmes implemented should beintegrated with other sectors like water, coastal, agriculture andenvironmental ones. Reduction of emissions of GHG in the wasteareas is any important component of the plan.
CONCLUSION
There are a range of mitigation options but these are not necessarily currently realised bygovernment, industry or communities. Mitigation options need not be capital intensive butcan involve low impact and low cost technologies or management practices not too differentfrom those currently in use.
63
CHAPTER 5
SYSTEMATIC OBSERVATION AND RESEARCH
INTRODUCTION
The GoPNG and it’s scientists have realised the importance of climate change and are nowcoordinating and implementing programmes/activities to improve their understanding of thescience, impacts and adaptation measures of climate change and variability. The country is alsocommitted to implementing its obligations, which often have a strong research or informationcomponent under the following international treaties: United Nations Framework Convention forClimate Change (UNFCCC) and the Kyoto Protocol, Convention of the World MeteorologicalOrganization, the Vienna Convention and Montreal Protocol, and the Convention to CombatDesertification and Agenda 21. The implementation of these treaties is usually at the nationallevel in partnership with other bilateral and international organizations.
PNG is fully involved in the activities and programmes of the following organizations:
• Intergovernmental Panel for Climate Change• World Climate Program of WMO• UNFCCC/Kyoto Protocol financed through GEF• Montreal Protocol programmes• United Nations Environment Program• UNESCO/Intergovernmental Oceanic Commission (IOC)• United Nations Biodiversity Convention
These are well established organizations and institutions who are committed to improving theunderstanding of the science of climate change and variability. Funding from the GEF hasenhanced studies and increased capacity building to address the issues such as the GHGInventory, impacts, vulnerability and adaptation and mitigation options.
DATA COLLECTION, SYSTEMATIC OBSERVATIONS AND INSTITUTIONS.
The PNGNWS has a national responsibility for climate and weather forecasting. The basic andessential functions of a National Meteorological Service can be summarized as follows:
• To plan, implement, operate and maintain surface and upper air observing networks over itsterritory;
• To provide and maintain systems for the collection, and quality control of observational dataand their processing in support of meteorological research, the provision of real time weatherand climate services, and assembly of a national climate record;
• To advance meteorological science and the development and improvement of its operationsand services through supporting research and development;
• To provide a range of weather information, forecast and warning services to the communityat large, usually through the mass media;
• To provide a range of sector-specific operational meteorological services through the massmedia and through other channels to major user groups such as agriculture, shipping, aviationand national defense;
• To keep and maintain a national climate archives and the provisions for climate data andclimate monitoring and prediction services;
• To provide advice on meteorological and climatological matters to other governmentagencies and to its national community;
64
• To fulfill its obligations under regional and international conventions such as the SPREPConvention, the Convention of the World Meteorological Organization, the United NationsFramework Convention on Climate Change, the Vienna Convention, and the Convention toCombat Desertification and Agenda 21.
The PNGNWS has been the main institution involved in researching climate and weather.However, with the recent interest at the international level on climate change and variability andits potential impacts on the country's economy and its people, there is now a strong shift by theinstitutions to work with all national and international organization to address this issue. Thefollowing institutions are involved in research in climate change, variability and sea level riseissues.
BILATERAL, REGIONAL AND INTERNATIONAL
Some of the partners involved in climate related research in the PNG include, the WorldMeteorological Organization (WMO), South Pacific Regional Environment Programme(SPREP), South Pacific Applied Geoscience Commission (SOPAC), Secretariat of the PacificCommunity (SPC), Australian Government (AusAID and Bureau of Meteorology), IsraelGovernment on impacts of agriculture and the USA (Energy Department).
NATIONAL INSTITUTIONS
The following government department and non-government organizations are involved in relatedresearch on climate change matters:
OEC, Department of Energy and Petroleum, UPNG, UOT, National Forestry Institute(PNGFRI), Transport Department, PNGNFA, NARI, National Fisheries Authority, NatureConservancy, Foundation of the South Pacific, World Wildlife Fund and Greenpeace.
RESEARCH PROGRAMMES
PNG network of meteorological stations in the country involves other partners in collecting,arching and managing the data and information on climate change, variability and weather.There are number of important research programmes in the short to long term being undertakenin the country. These have been established and coordinated in the following areas:
METEOROLOGICAL SERVICES SYSTEMATIC AND OBSERVATIONAL NETWORKS
The PNGNWS has about 95 professional and technical staff to manage its programmes in 13meteorological centers around the country. It is from these centres that data are continuouslycollected, collated, archived and disseminated throughout the country, regional and internationalbodies, especially the WMO. Plans to increase the number of meteorological stations areunderway. It recently re-commissioned its upper air program in Port Moresby, in addition to theMomote Upper Air Program operated by the TWP/ARM programme in Manus.The surfaceobserving programme continues to operate with support from satellite imaging system to providelow-resolution data both for general and aviation weather forecasting purposes. An EMWINsystem provides alternative access to a range of weather information for national andinternational presentation. Climate services, in which almost all available professionally trainedmeteorologists are involved, is well developed and coupled to the CLImate COMputing(CLICOM) applications.
65
The institutions involved in implementing and co-ordinating two international researchprogrammes with PNG are:
i) Measurement of GHG signals in the oceans/seas in the country and the Pacific region, indetecting sea level rise, funded by Australian government since 1999;
ii) Measurement of solar radiation in the ocean, clouds and the islands of the Pacific,financed by USA Department of Energy since 1996.
These programmes are addressing the global climate change issues and data is made available toIPCC process and international communities, especially in improving their climate changemodels and scenarios.
The main users of meteorological services are the general public, the media, aviation, marine,disaster management (severe weather, including drought), agriculture, forestry, mining,petroleum, energy, water resources and tourism sectors.
INFORMATION GAPS
• Lack of quality data and collection• Early storm surges warnings• Early predictions of El Nino and La Nina signals
SPECIFIC CAPACITY NEEDS
• Education and awareness• Training and technology upgrades• Network and data transfer capabilities
DISASTER MANAGEMENT
The country is very vulnerable to the effects of climate change and natural and man madehazards, such as cyclones, storm surges, high abnormal sea tides, floods, fire, mining activitiesand droughts. These events are very much linked to the climate change impacts on the countryand its people and are now being an area of priority for the government to address. A nationalDisaster Management plan is in place to enable correct response options to be executed.
To enable resilience and adaptation strategies to be implemented, the following information gapsand capacity needs have been identified as ‘no regrets’ approach to deal with disasters.
INFORMATION GAPS.
• Lack of information on vulnerable areas/sites• Lack of information on the ocean circulation and tides• Lack of information on water/rivers and drainage systems
SPECIFIC CAPACITY NEEDS.
• Lack of early warning systems• More education and awareness• Training on new technology• Training of human resources
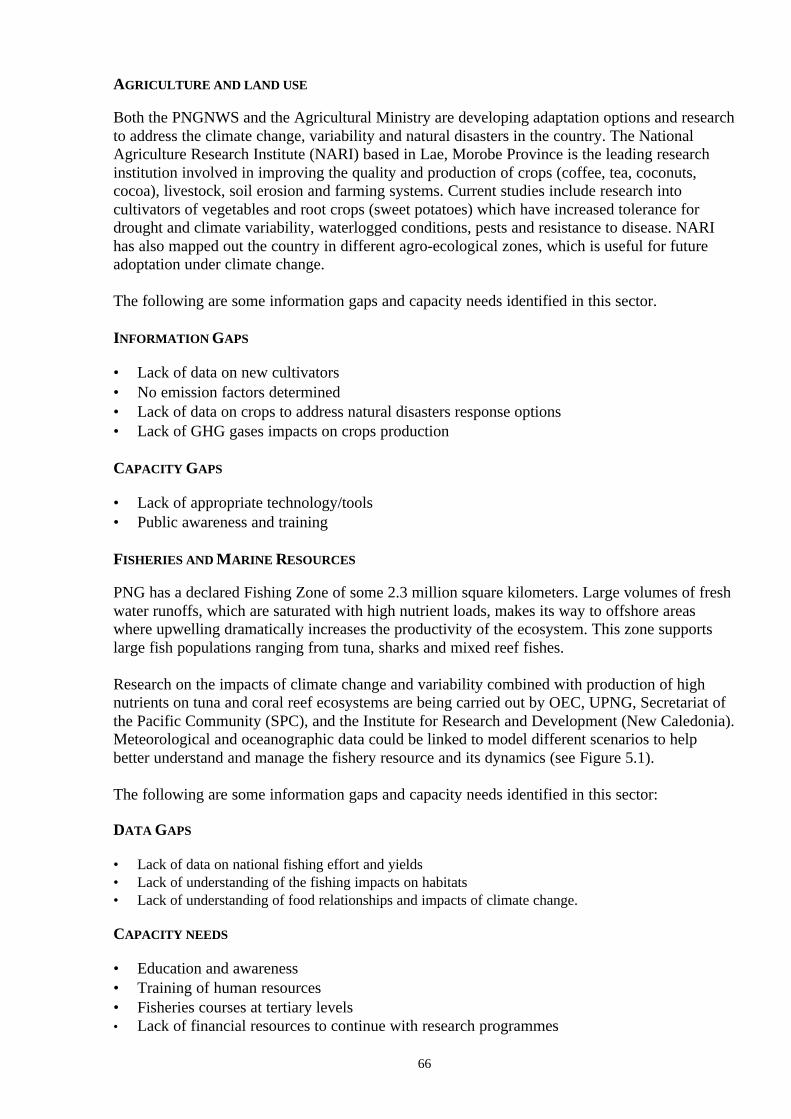
66
AGRICULTURE AND LAND USE
Both the PNGNWS and the Agricultural Ministry are developing adaptation options and researchto address the climate change, variability and natural disasters in the country. The NationalAgriculture Research Institute (NARI) based in Lae, Morobe Province is the leading researchinstitution involved in improving the quality and production of crops (coffee, tea, coconuts,cocoa), livestock, soil erosion and farming systems. Current studies include research intocultivators of vegetables and root crops (sweet potatoes) which have increased tolerance fordrought and climate variability, waterlogged conditions, pests and resistance to disease. NARIhas also mapped out the country in different agro-ecological zones, which is useful for futureadoptation under climate change.
The following are some information gaps and capacity needs identified in this sector.
INFORMATION GAPS
• Lack of data on new cultivators• No emission factors determined• Lack of data on crops to address natural disasters response options• Lack of GHG gases impacts on crops production
CAPACITY GAPS
• Lack of appropriate technology/tools• Public awareness and training
FISHERIES AND MARINE RESOURCES
PNG has a declared Fishing Zone of some 2.3 million square kilometers. Large volumes of freshwater runoffs, which are saturated with high nutrient loads, makes its way to offshore areaswhere upwelling dramatically increases the productivity of the ecosystem. This zone supportslarge fish populations ranging from tuna, sharks and mixed reef fishes.
Research on the impacts of climate change and variability combined with production of highnutrients on tuna and coral reef ecosystems are being carried out by OEC, UPNG, Secretariat ofthe Pacific Community (SPC), and the Institute for Research and Development (New Caledonia).Meteorological and oceanographic data could be linked to model different scenarios to helpbetter understand and manage the fishery resource and its dynamics (see Figure 5.1).
The following are some information gaps and capacity needs identified in this sector:
DATA GAPS
• Lack of data on national fishing effort and yields• Lack of understanding of the fishing impacts on habitats• Lack of understanding of food relationships and impacts of climate change.
CAPACITY NEEDS
• Education and awareness• Training of human resources• Fisheries courses at tertiary levels• Lack of financial resources to continue with research programmes
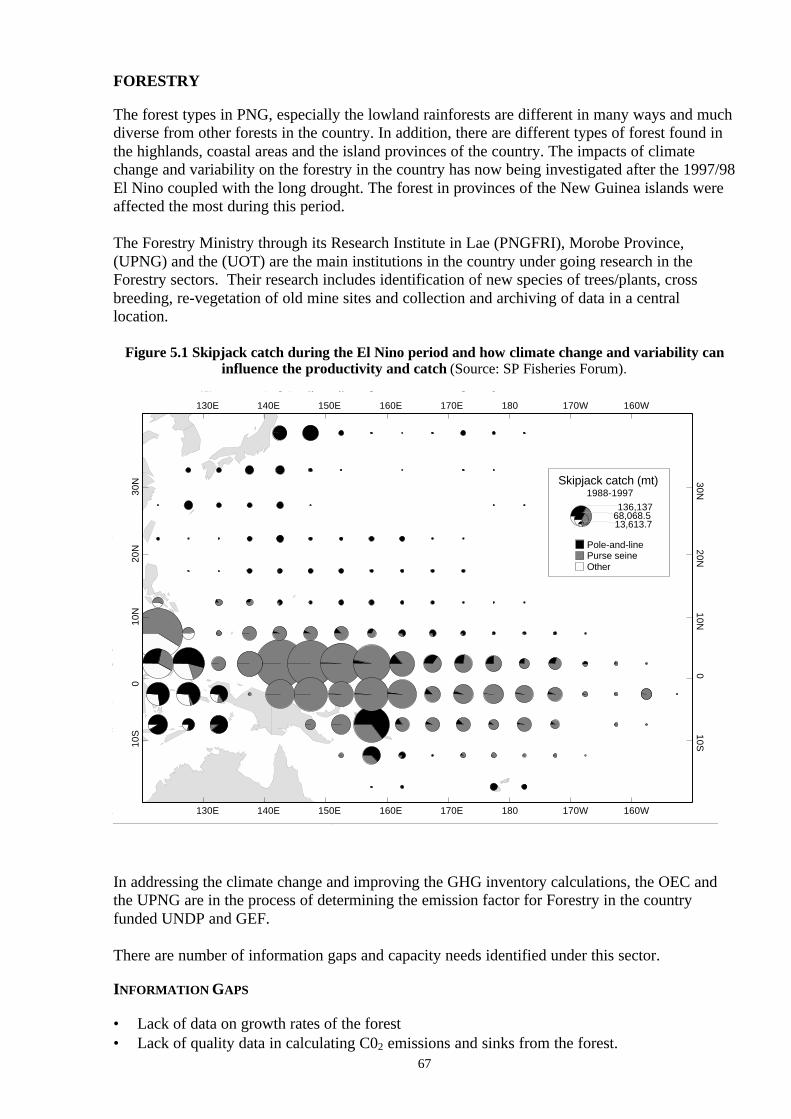
67
FORESTRY
The forest types in PNG, especially the lowland rainforests are different in many ways and muchdiverse from other forests in the country. In addition, there are different types of forest found inthe highlands, coastal areas and the island provinces of the country. The impacts of climatechange and variability on the forestry in the country has now being investigated after the 1997/98El Nino coupled with the long drought. The forest in provinces of the New Guinea islands wereaffected the most during this period.
The Forestry Ministry through its Research Institute in Lae (PNGFRI), Morobe Province,(UPNG) and the (UOT) are the main institutions in the country under going research in theForestry sectors. Their research includes identification of new species of trees/plants, crossbreeding, re-vegetation of old mine sites and collection and archiving of data in a centrallocation.
Figure 5.1 Skipjack catch during the El Nino period and how climate change and variability caninfluence the productivity and catch (Source: SP Fisheries Forum).
10N
20N
30N
130E
10S
0
130E 140E 150E
140E 150E 160E 170E 180
160E 170E 180 170W 160W
170W 160W
10S0
10N20N
30N
Skipjack catch (mt)1988-1997
136,13768,068.513,613.7
Pole-and-linePurse seineOther
In addressing the climate change and improving the GHG inventory calculations, the OEC andthe UPNG are in the process of determining the emission factor for Forestry in the countryfunded UNDP and GEF.
There are number of information gaps and capacity needs identified under this sector.
INFORMATION GAPS
• Lack of data on growth rates of the forest• Lack of quality data in calculating C02 emissions and sinks from the forest.
68
• Lack of data on forestry and soil types.
CAPACITY NEEDS
• Training of human resources• Education and awareness
FUTURE RESEARCH
More targeted research is needed to address the science, impacts, adaptation and mitigation ofclimate change and should include:
• Determination of emission factors is assisting the calculations of GHG inventory• Effects of C02 fertilization on crops growth, development and productivity• Calculations of sinks and sources from the forestry, land use change and agriculture• Identifying traditional adaptation options• Renewable energy sources• Better understanding of EL Nino impacts on the country's economic sectors• Relationship with fish catch and climate change and variability• Relationship of oceans, solar radiation and clouds• GHG signals in the oceans and sea level rise• Impacts of climate change on cultural and traditional aspects• Effects of Ozone and climate change of human health• Development of Integrated coastal area management• Relations between climate change and coral bleaching• Technology transfer• Soft and hard adaptation options
CONCLUSION
There are critical information gaps and uncertainties, which must be addressed in order to betterunderstand and properly apply vulnerability and adaptive measures in PNG. A network ofclimate change observation systems have been established around the country, but these may notbe enough to fully appreciate the scenarios under climate change, climatic variability and sealevel rise in the next 5 to 50 years. Even in the international arena, there are relatively fewresources being devoted to relevant empirical research and observations, which could be appliedto the PNG circumstances.
Climate change, variability and sea level should be the priority areas of interest for PNG.However for this to occur, human resources and capacity building is needed to facilitate theunderstanding of the science, impacts and adaptation options on climate change, particularly forpolicy development and planning.
69
CHAPTER 6
EDUCATION, TRAINING AND AWARENESS
INTRODUCTION
In 1990 and 1995, scientists from the IPCC worked on ways to reduce or minimise theuncertainties in differentiating between the greenhouse energy signals and natural climatevariability; the magnitudes of the potential impacts of sea level rise. They determined thatclimate change is serious and action must be taken now (even where all the data are notavailable) in order to manage the risks.
Since 1989, the PNG Prime Minister and his colleagues from the Forum Island Countries alsoagreed that sea level rise and climate change is one of the priority issues affecting the coastalareas and atoll nations of the region. However, they also recognize that the national capacity todeal with these problems whilst stimulating economic development are limited by traditionalland management systems, unique population dynamics, the complexity and vulnerability ofislands' ecosystems, limited natural resource bases, and heavy reliance on foreign aid. Havingratified the UNFCCC and signed the Kyoto protocol, the country will need resources to fulfill itsinternational obligations. At the national level, education, training of human resources and publicawareness programmes/activities will set the platform for the government to address the climatechange and achieve sustainability in the long term.
Through the efforts of the UPNG in 1989, a Climate Change Coordination Group consisting ofrepresentatives from government ministries was formed to advise the government on the climatechange and sea level issues. The OEC was then given the responsibility to the coordinate allprogrammes and activities on the issue.
Since then, the tertiary institutions and some Government Ministries (especially, Foreign Affairs,Civil Aviation and OEC) are generally aware of the climate change and variability activities.These institutions have made some attempts to educate, train and raise awareness on the issues aspart of their programmes with some major constraints especially with financial and humanresources support. Further, these institutions have commenced working on policy to address theissues of climate change and sea level rise.
While limited training, education and awareness are conducted in the government offices and thetertiary institutions, the majority of the population of the country have little knowledge ofclimate change and variability, its implication and consequences to them and the country as awhole. Therefore special efforts will need to be made through education and awareness to ensurethat the people are aware of the impacts of climate change and variability to be able to adapt tothese situations.
ACTIVITIES
From 1991,the country has been able to attract bilateral and regional climate change funding toimplement their education, training and public awareness activities through several initiativesincluding:
• The South Pacific Sea Level and Climate Monitoring Project funded by the Australiangovernment
• The Atmospheric Radiation Measurement Project, funded by USA• World Meteorological Organization• Australian Bureau of Meteorology
70
• Climate and Agricultural Project funded by Israel• South Pacific Regional Environment Program.
Through these projects and programmes, the government has made some efforts to includeclimate change in some provinces (Manus and Central) and national educational curriculum.Some activities include: school visits, public displays, training primary and secondary teacherson climate change modules, public campaign, daily climate and updates, newsletters, media andpublic awareness in schools.
The UPNG and PNGNWS are the two main institutions which offer formal education trainingcourses to address the climate change and sea level rise.
INFORMAL EDUCATION
To raise awareness on the climate change and variability is a challenge in the country whereilliteracy rate is very high, and informal education activities will be the most effective method ofdiscussing and creating interest and awareness. This should include the following activities:
• Use of Television programmes• Weekly articles on newspaper• Mitigation and adaptation awareness campaign in private and village communities• Use of University students to annually raise awareness in the provinces and villages• NGOs to promote and raise awareness through community discussions.• Annual international occasions such as World Environment Day and the World Water Day
While formal and informal education and training are being implemented, the number and role ofNGOs in the country is an important vehicle to raise awareness on the climate change andvariability. Partnerships with the government (especially provincial), schools and NGOs areimportant to share and disseminate information on climate change, variability and sea level riseand its consequences on the lives of the people.
CONCLUSION
The current knowledge and understanding of climate change, variability and sea level rise posestremendous challenges to the country's environment, economy and the comfort of its people inthe long term. Improving the understanding and communicating of the science, impacts,adaptation and mitigation of climate change and variability through the education, training andawareness will facilitate appropriate policy developments in this area. One way to do this is toset up a sustainable development network that links NGO and community based initiativesaround the country. Such as awareness raising, needs assessment, project planning, leadershipskills, etc., to provide better access to resources and information.
71
CHAPTER 7
PROJECTIONS, POLICIES AND PLANS
INTRODUCTION
The environmental legislation of PNG provides for environmental planning measures to beincluded as an integral component of project planning for developments with significantenvironmental risk. Specific areas covered by the legislation include mechanisms for licensing ofcontaminants discharged into the environment as well as planning and regulating the use ofwater resources. An Environmental Bill, still in draft form, provides statutory tools, proceduresand processes to enable local and provincial governments to formulate by that are within theobject of the Act. Environmental codes of practice and guidelines provide a means to definepractices for specific sectors, including hydrocarbon storage, oil palm processing, roads andbridges, landfill and sewage.
With the redirection of funding to the provinces, government organisations responsible for theenvironment such as OEC now only retain the responsibility for policy and technical advisorysupport. Like all other government agencies, the OEC has been restructured and its activitiesstreamlined, incorporating ways and means of increasing revenue.
POLICY DEVELOPMENT GOALS IN THE AREA OF CLIMATE CHANGE
COASTAL AND MARINE AREAS
• Protection of critical ecosystems• Protection of towns and assets• Land use policies• Control of erosion
WATER RESOURCES
• Water resource management• Catchment management• Alternative water supply• Flood control
AGRICULTURE AND FORESTRY
• Community sustainability programmes (e.g. in involving landowners with spin-off and noncore activities)
• Sustainable production systems• Research• Land Use policies
HEALTH
• Control of diseases, particularly vector borne diseases such as malaria and cholera• Poverty reduction
72
FISHERIES
• Stronger regional collaboration• Modeling and research• Fleet management• Development of a fishing industry that is internationally competitive, generates employment,
expands local food supplies and reduces imports.
TRENDS AND POLICY MEASURES
FUTURE POPULATION TRENDS
• Increasing population density, especially in urban areas, Highlands, East Sepik and EastNew Britain Provinces as well as some other coastal areas, flood prone areas and marginallands.
• Greater social demand for services such as health, education and job creation• Land area per person will continue to decrease, especially in urban centers• Increasing infrastructure• Changes in demographic profile with a large youthful population base, more alienated from
traditional structures, with different standard of living expectations.
POLICY MEASURES
• Reduce population growth and maintain it at a sustainable level and assess requirements forfuture levels of public service and infrastructure.
• Increase spacing between birth to realize health and welfare benefits to women and children• Conduct public information and awareness campaigns, improved primary care services,
increased counseling and improved contraception.
FUTURE ECONOMIC TRENDS
• Subsistence agriculture will continue to be important• Continued dependence on natural resources and foreign aid.• Growing indebtedness likely to increase pressure on natural assets• Revenue base insufficient to meet planned expenditure• Possible higher returns from offshore pelagic fish stocks.
POLICY MEASURES
• Organic Law which will bring about greater decentralization of powers, resources andresponsibilities to the Provincial and Local Levels of governments.
FUTURE ENVIRONMENTAL TRENDS
• Environmental degradation in densely populated areas• Increase in deforestation• Increase in problems of waste disposal• Lack of adherence to sustainable parameters in natural resource use leading to increases in
rural impoverishment.
73
POLICY MEASURES
• Increased outsourcing of conservation initiatives and some responsibilities to NGOs andlocal communities.
• Strengthening of the OEC through training of staff, review of the various Acts, design ofpolicy guidelines for environmental monitoring and legislation and enforcement processes.
• Development of specific policies such as the National Environment and Conservation policy,NGO - OEC Partnership policy, which aims to guide cooperation between the two parties inorder to maximize benefits to landowners. The National Biodiversity Strategic Action Planand PNGBioNET research programmes, which are aimed at protecting and using plants andanimals on an ecologically sustainable basis should be promoted and supported.
• Enactment of the Environment Bill.• Introduction of a moratorium on all new forestry licenses, extensions and conversions and to
review all existing licenses, that logging practices are carried out in a sustainable way andthat all landowners get their fair share of benefits from resource use.
FUTURE SOCIO-CULTURAL TRENDS
• Highly skewed income distribution and social problems, especially in urban areas• Increase in preference to imported foods• Increases in non-communicable diseases with nutritional and lifestyle changes
POLICY MEASURES
• Future application of social impact assessment
CONCLUSION
In light of predicted impacts of climate change such as the flooding of low-lying islands andlowland areas, the possible increase in frequency and intensity of strong tropical cyclones, heavyrainfalls, etc., the following political and economical strategies should be taken intoconsiderations, not only within the country, but also within the Pacific region:
• Increase efforts to strengthen the abilities of local institutions and communities to effectivelydeal with climate change impacts, including other social and economic development issues;
• Increase in the amount of responsibility and degree of authority given to regional andinternational institutions, and key national communities which are in a better position or aremore capable of administering the affairs of island communities that are more likely to suffersocial and economic impacts brought about by climate change;
• Increase efforts to develop more effective systems of extracting and sharing resources andexperiences within and between island states at all levels. This is especially important in theprovision of basic services for people who may migrate away from low-lying islands andlowland areas, which would be at higher risk from the impacts of sea level rise.
74
REFERENCES
Bualia, L. & Sullivan, M. E. 1990. The impacts of possible global warming generated sealevel rise on selected coastal environments in Papua New Guinea. In J. C Pernetta &
P.J Hughes (eds) Implications of expected climatic changes in the South PacificRegion: an overview. UNEP Regional Seas Report and Studies 128:193-199.
Commonwealth of Australia. 1992. The Papua New Guinean Economy. Prospects forRecovery, Reform and Sustained Growth. International Development Issues No. 27.Australian Government Publishing Service, Canberra. 133 pp.
Conservation International 1993. Biodiversity Priorities for Papua New Guinea. A Reportfor the GovPNG prepared by Conservation International and funded by the USBiodiversity Support Program. Washington, D.C.
Department of Environment and Conservation. 1995. Papua New Guinea CountryStudy on Biological Diversity. Eds. N. Sekhran and S. Miller. A study prepared by theDepartment of Environment and Conservation, Conservation Resource Centre and theAfrica Centre for Resources and Environment. 438 pp.
Government of Papua New Guinea. 1994. Economic and Development Policies. Volume1. Presented by Sir Julius Chan on the occasion of the 1994 Budget.
Government of Papua New Guinea. 1994. Yumi Wankain. Report of the United NationsJoint Inter-Agency Mission to Papua New Guinea on Sustainable Development.72 pp.
Government of Papua New Guinea. 1996. Medium Term Development Strategy 1997 –2002: Bridge Into the 21st Century. Presented to Parliament by Hon Moi Avei,Minister for National Planning.
Government of Papua New Guinea. 2000. Economic and Development Policies. Volume 1.Presented by Sir Mekere Morauta on the occasion of the 2000 budget.
Government of Papua New Guinea. 2000. The State of Education in Papua New Guinea.Education Reform Facilitating and Monitoring Unit, National Department ofEducation. 88 pp.
IPCC, OECD and IEA 1997. Greenhouse Gas inventory Workbook: Revised 1996 IPCCGuidelines for National Greenhouse Gas Inventories, edited by Houghton, J.T., L.G.Meira Filho, B. Lim. K. Teanton, J.Mamaty, Y. Bonduki, D. Griggs and B.A.Callander.
IPCC. 1998. IPCC Workshop on Adaptation to Climate Variability and Change. SanJose, Costa Rica, 29 March to 1 April, 1998. Ed. D. C MacIver, Canada. 55 pp.
McAlpine J. & Quigley, J. 1998. Forest Resources of Papua New Guinea. SummaryStatistics from the Forest Inventory Mapping (FIM) System. Prepared for AusAIDand the Papua New Guinea National Forest Service. 14 pp.
75
Mitchell, W., Chitleborough J., Ronai, B. and Lennon, G.W. 2000. Sea Level Rise inAustralia and the Pacific. Paper presented at the Pacific Islands Conference onClimate Variability and Sea Level Rise, at the National Auditorium, Rarotonga, CookIslands, 3-7 April, 2000.
Natera. G. P. 1999. Malaria: Current and Future Trends. Produced for the Papua NewGuinea Climate Change Assistance Project.
Nix, H A., Faith, D.P., Hutchinson, M.F., Margules, C.R., West, J., Allison, A., Kesteven,J.L., Natera, G., Slater, W., Stein, J.L., Walker, P (2000). The Biorap Toolbox – ANational Study of Biodiversity Assessment and Planning for Papua New Guinea,Consultancy Report to the World Bank, Centre for Resource & Environmental Studies(CRES), Australian National University (ANU), 48 pp.
Papua New Guinea Climate Change Assistance Programme (PNGCCAP). In prep.Vulnerability and Adaptation Assessments. Coastal Zones of Papua New Guinea: TheEast Hiri Coast, Central Province, Papua New Guinea.
Piddington, K. Baines, G. Barry, G. & Huber, M. 1997. Environment ProgrammingMission to Papua New Guinea. Report prepared for the UNDP. 84 pp.
Saulei, S.M. In prep. Mitigation assessment in Papua New Guinea, PNGCCAP, OEC,Waigani
Saunders, J.C. 1993. Agricultural Land Use of Papua New Guinea. Explanatory Notes toMap. PNGRIS Publication No. 1. CSIRO and AusAID. 12 pp.
Sinclair Knight Merz. 2000. Solid Waste Charcterisation Study and Management Planfor Papua New Guinea. South Pacific Regional Environment Programme and theEuropean Union. Fiji. 46 pp.
UNDP & Government of Papua New Guinea. 1997. Country Strategy Note 1997 – 2001.Sustainable Human Development: Integrating economic, social and environmentaldevelopment in Papua New Guinea. 26 pp.
Unisearch Papua New Guinea. 1991. UNCED Papua New Guinea National Report.Prepared for the Government of Papua New Guinea. University of Papua NewGuinea, Port Moresby. 178 pp.
Wilmott, B, Natera G. and Sabi, J. 1999. Vulnerability and Disaster Classifications:Identification and Manipulation of PNGRIS Data sets, including Land Use Updates.Report produced for Papua New Guinea Climate Change Assistance Programme. 22pp.
WWF. 1993. Melanesian Forest Conservation Review. Sydney, Australia. 49 pp.


