27
PAPUA NEW GUINEA’S EXPANDING MALARIA PROGRAM MMV, BALI. OCTOBER, 2017 Leo S Makita National Malaria Control Program
| Date post: | 30-Jun-2018 |
| Category: |
Documents |
| Upload: | vuonghuong |
| View: | 216 times |
| Download: | 0 times |
PAPUA NEW GUINEA’S EXPANDING MALARIA PROGRAM
MMV, BALI. OCTOBER, 2017
Leo S Makita National Malaria Control Program

Province Population 2012
% Population
Malaria Transmission
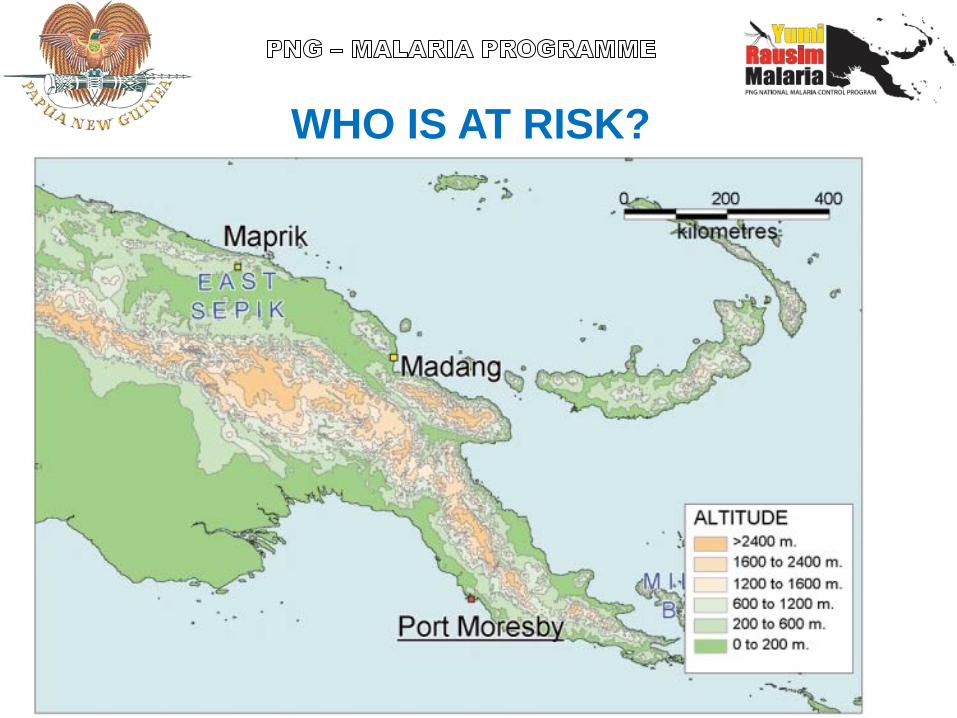
0-400m 3,688,540 48.1 Very High Stable 400-800m 335,750 4.4 High Stable 800-1200m 246,517 3.2 Stable 1200-1600m 942,092 12.3 Unstable Epidemic 1600-2000m 1,738,389 22.7 Very Low 2000-2400m 581,203 7.6 Absent Above 2400m 128,299 1.7 Absent
Total Population 2012 7,660,790 100
WHO IS AT RISK?
WHO IS AT RISK?

Background: Historical impact of malaria on health services
• One of the leading causes of consultations, admissions and of recorded deaths (2011).
• In 2011: only 184K out of 1,151K reported malaria cases were tested, of which 70K (38%) were positive (confirmed)
• Out of 17K malaria admissions: 431 deaths malaria deaths representing a case fatality rate of 2.4%
• Cases from Aid posts (representing approximately 40% of patient consultations) not reported through NHIS

Background: Malaria as a proportion of all causes
morbidity, PNG 2008 - 2011
Year Out patient attendance (new)
Admissions
All cause Malaria All cause Malaria 2008 8,838,540 1,606,843
(18.2%) 199,508 23,508
(11.8%) 2009 5,034,900 1,431,395
(28.4%) 216,489 22,896
(10.6%) 2010 5,680,608 1,379,787
(24.3%) 214,968 24,250
(11.3%) 2011 3,780,786 1,151,353
(30%) 115,912 17,065 (15%)
5

• Until 2011, most treatment of malaria had been based on clinical symptoms as the only form of malaria control for decades after the Eradication Programme was abandoned in the 1980s.
• Chloroquine was the first line treatment for many years.
• Chloroquine resistance to P. falciparum was first noted in 1976 and P. vivax in the late 1980’s with very much treatment failure noted in the 1990’s.
• In 2000 SP was added to CQ as the first line treatment.
Background: Treatment and Drug Resistance

• In 2010, chloroquine and SP combination was finally abandoned and ACTs were introduced (Coartem: artemether lumefantrine).
• Together with Coartem, RDTs (Rapid Diagnostic Tests) were introduced for compulsory diagnosis.
• 2011 saw the full implementation of ACTs and RDTs ensuring universal coverage.
• While LLIN distribution started in 2004, access and use of LLINs accelerated between 2009-2014
A Change Came: New Treatments and Vector Control
0.1
.2.3
.4Fr
actio
n of
con
firm
ed m
alar
ia c
ases
trea
ted
with
AC
Ts
2009 2010 2011 2012 2013
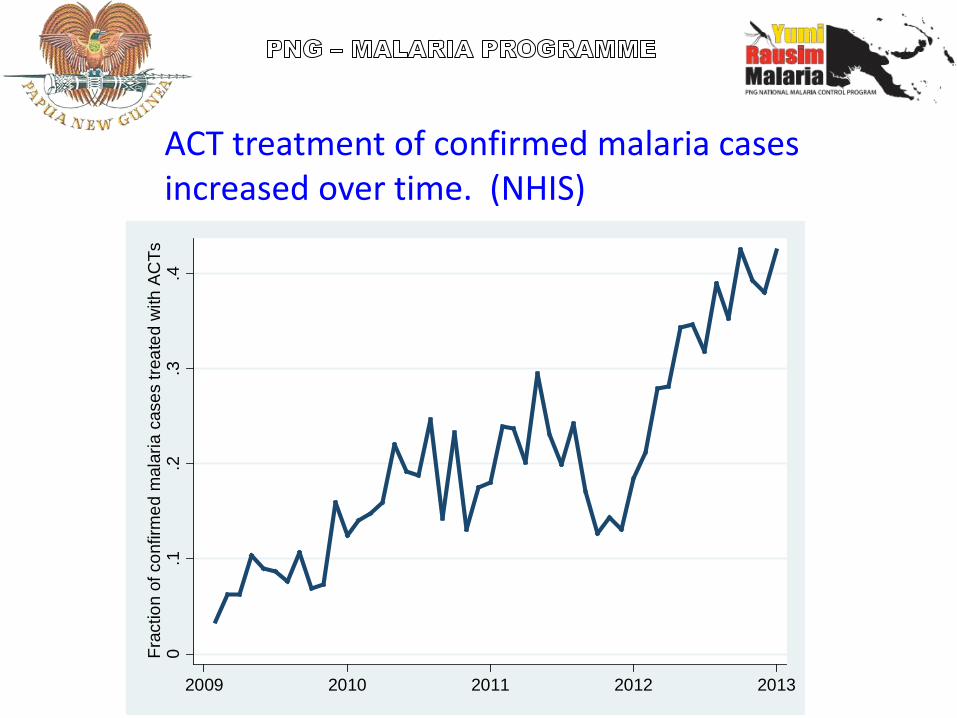
ACT treatment of confirmed malaria cases increased over time. (NHIS)

Summary of first and second line treatment
Classification Condition First line Second line
Uncomplicated Falciparum malaria AL tablets DHP tablets
Vivax malaria AL plus PQ tablets DHP plus PQ tablets
Mixed infection of pf/pv
Same as falciparum; give PQ if pv/po confirmed
Severe Falciparum or vivax Artesunate IV/IM or artemether IM followed by AL
QN injection followed by oral plus doxycycline when able to swallow

Management of Malaria in Pregnancy
• Uncomplicated malaria – First trimester: QN plus Fansidar – Second & third trimesters:
• First line: AL • Second line: QN + Fansidar
• Severe malaria – Artesunate IV or IM (or artemether IM or QN IM) followed by
oral QN and Fansidar when patient able to swallow • Intermittent preventive Treatment (IPTp): 3 doses of Fansidar
starting after 16 weeks (quickening) and then after at least 4 weeks

Progress in LLIN coverage
Ownership, access and use increased substantially over Round 3 & 8 grants.
Lowest ownership in Highlands, lowest use (if access) in Highlands, Islands, Northern P. & Milne Bay P. (2013/14) [PNGIMR Malaria Indicator Surveys 2008/09 (1,958 HH; 10,258 indiv.), 2010/11 (1,996 HH; 12,548 indiv.), 2013/14 (2167 HH; 11,665 indiv.)]

LLIN access (% individuals with access to LLIN in household)
LLIN use (% individuals sleeping under LLIN last night)
Progress in mosquito net coverage and Usage

The Change Showed Results: Malaria Incidence per year
after interventions (2000-2014)
0
50
100
150
200
250
300
350
2000 2001 2002 2003 2004 2005 2006 2007 2008 2009 2010 2011 2012 2013 2014
Mal
aria
Inci
denc
e Pe
r 100
0
Year
|------ITNS---------|---------------LLINs-------------|
|--ACTs/RDTS-|


Successful large-scale LLIN campaign
Introduction and massive scale up of RDT and continued distribution of ACTs
Gradual increase of reported confirmed malaria
diagnosed by RDTs & microscopy
Result: a marked reduction in the reported prevalence and incidence
Recapping: Drivers of Progress


• Malaria in PNG has seen many changes in prevalence and incidence due to malaria control, treatment practices and drug resistance.
• The introduction of LLINs, ACTs and RDTs has led to a decline of 70% or more in malaria incidence and prevalence in most areas.
• However, some areas are not responding as well as others have.
• Sustained programme support and uniform access to interventions across all endemic settings remains a challenge for the future.
CONCLUSION

Acknowledgements • The PNG government • Department of Health • The Global fund • Defat • PNG IMR • World Health Organization • Rotarians Against Malaria • Population services international • CPHL • PIMI • Tri lateral Malaria Project • Provincial health departments • DWU
Next Steps (3)
Initial Data From Chasing Malaria Project Showing Malaria Cases Recorded In NCD and Hiri and Kairuku District Of Central Province
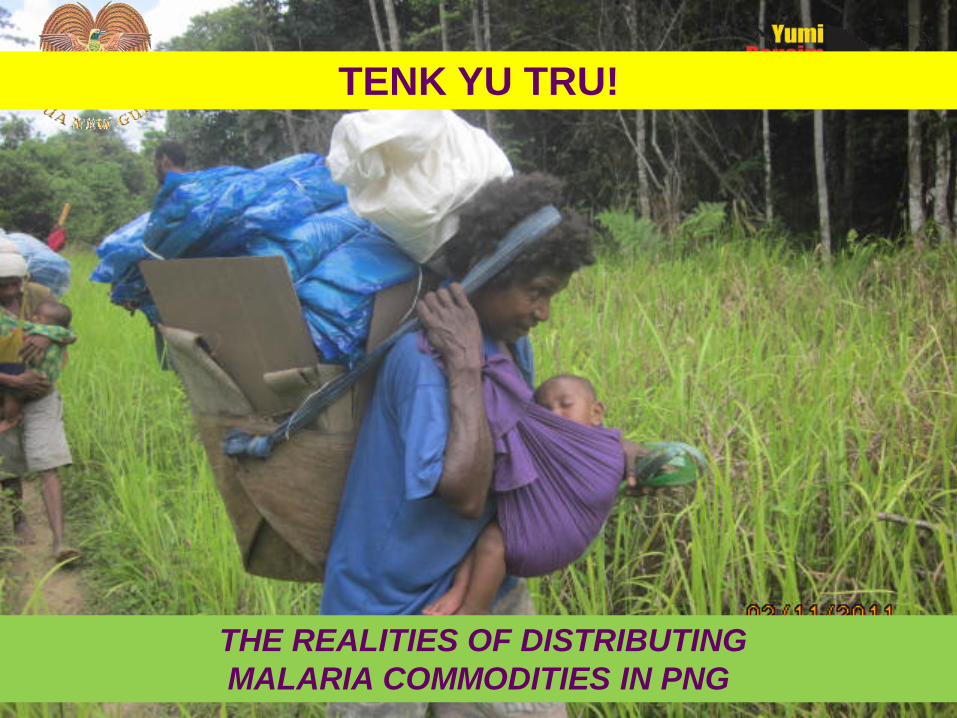
THE REALITIES OF DISTRIBUTING MALARIA COMMODITIES IN PNG
TENK YU TRU!


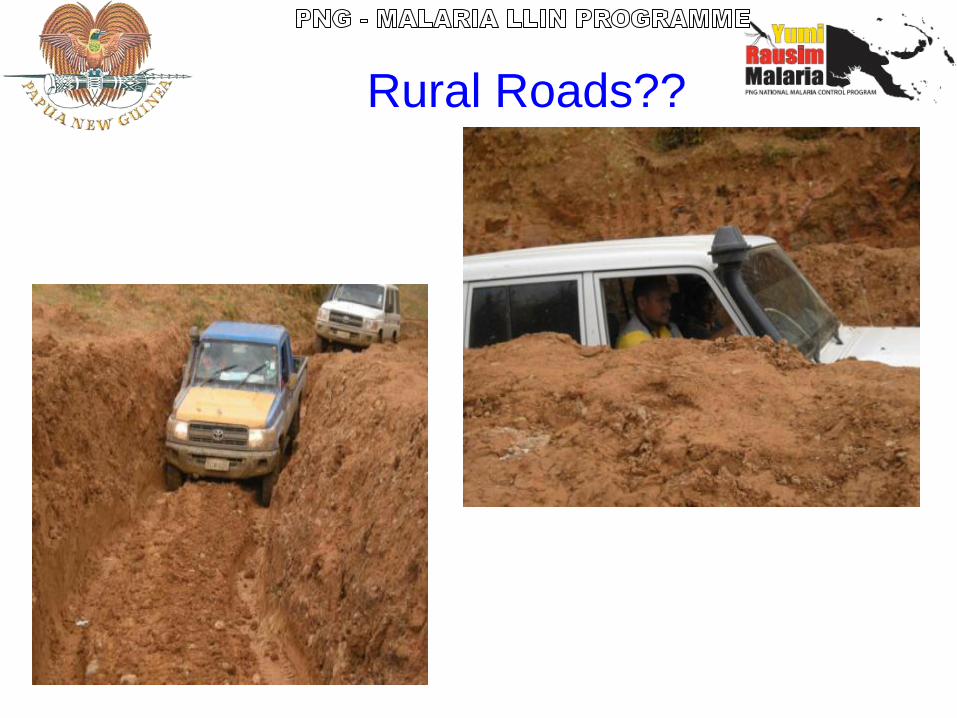
Rural Roads??

Mountains and rivers


![MALARIA [Descriptive Epidemiology of Malaria] Dr …wp.cune.org/.../11/MALARIA-descriptive-epidemiology-of-malaria.pdfMALARIA [Descriptive Epidemiology of Malaria] Dr Adeniyi Mofoluwake](https://static.documents.pub/doc/80x56/5ac17de07f8b9ad73f8cf6b2/malaria-descriptive-epidemiology-of-malaria-dr-wpcuneorg11malaria-descriptive-epidemiology-of-.jpg)


