65
Paradigm 1 ABDBM © Ron Shamir Some slide sources: Josh Stuart (UCSC) AACR 12 slides Carl Edward Rasmussen (Cambridge) Factor graphs slides

Paradigm
1 ABDBM © Ron Shamir
Some slide sources: Josh Stuart (UCSC) AACR 12 slides
Carl Edward Rasmussen (Cambridge) Factor graphs slides

Inference of patient-specific pathway activities from multi-dimensional cancer
genomics data using PARADIGM
Charles J. Vaske, Stephen C. Benz, J. Zachary Sanborn, Dent Earl, Christopher
Szeto, Jingchun Zhu, David Haussler Joshua M. Stuart,
UC Santa Cruz, CA, USA Bioinformatics 2010
2 ABDBM © Ron Shamir

The challenge of cancer • 25% of breast cancer patients show
amplification/over-expression of ERBB2 – can be treated by trastuzumab
• But <50% of them show any improvement • Why?
– We do not understand enough about the cancer process – What we call cancer types are actually composites of
many subtypes – Each patient is different
• Can integrating multiple data sources help? • Can taking a pathway perspective to cancer help? • Can patient-specific perspective help?
ABDBM © Ron Shamir 3
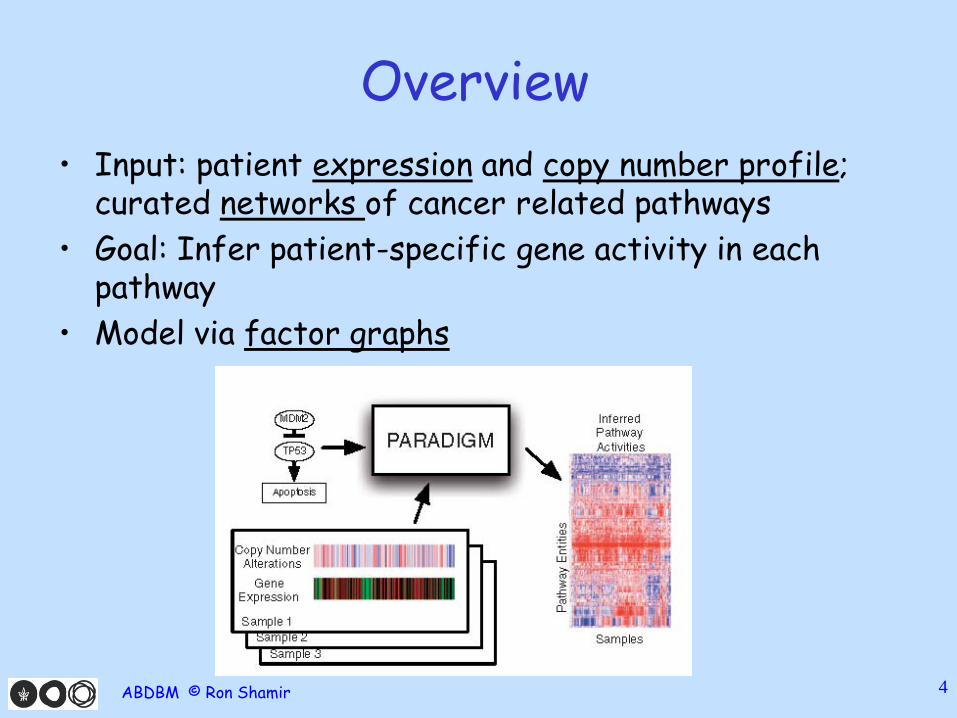
Overview • Input: patient expression and copy number profile;
curated networks of cancer related pathways • Goal: Infer patient-specific gene activity in each
pathway • Model via factor graphs
4 ABDBM © Ron Shamir

First – some background Copy number prifles Biological networks
Factor graphs
ABDBM © Ron Shamir 5

Copy number changes in cancer
ABDBM © Ron Shamir 6 http://helacellblog2.blogspot.co.il/
Cancer cells undergo numerical and structural aberrations Numerical changes: gain/loss of chromosomal segments or whole chromosomes

Copy number profiles
ABDBM © Ron Shamir 7
Adam Shlien et al. PN
AS 2008;105:11264-11269
https://genome-cancer.ucsc.edu/
One patient
933 patients

9
Biological Networks
http://www.grt.kyushu-u.ac.jp/spad/pathway/tnf.html
www.genome.ad.jp/kegg/kegg2.html
http://endo.edoc.com
www.biology.iupui.edu/research/bard/
ABDBM © Ron Shamir
10 http://www.ebi.ac.uk/research/pfmp ABDBM © Ron Shamir

11 http://www.ebi.ac.uk/research/pfmp ABDBM © Ron Shamir
12 http://www.ebi.ac.uk/research/pfmp ABDBM © Ron Shamir

13 http://www.ebi.ac.uk/research/pfmp ABDBM © Ron Shamir

14 http://www.ebi.ac.uk/research/pfmp ABDBM © Ron Shamir

G1/S signaling pathway
ABDBM © Ron Shamir 15 http://www.cs.tau.ac.il/~spike/

16
Genetic network controlling early development of sea urchin endomesoderm.
www.its.caltech.edu/~mirsky/endomeso.htm ABDBM © Ron Shamir

17
Eric Davidson
ABDBM © Ron Shamir

Biological network resources • Many great databases summarizing
– Specific pathways: everything we know about interactions of genes/proteins in pathway X of species Y
– Protein interactions of various types (some with confidence values)
• Lots of data • Very noisy
ABDBM © Ron Shamir 18

ABDBM © Ron Shamir 19
A typical hairball

Factor Graphs • x1,..xn variables over domains A1,..An
• g(x1,..xn ) : A1 x..x An R
• g factors into local functions g(x1,..xn ) = Πj fj(Xj)
• Each Xj is a subset of {x1,..xn} • fj(Xj) is a function with arguments from Xj
• A factor graph has a variable node for each variable xi, a factor node for each local function fj and an edge-connecting xi to fj iff xi is an argument of fj.
• A factor graph expresses the structure of the factorization
ABDBM © Ron Shamir 20
x1
x2
x3 x4
f fA
fB
fC
1 4 1 2 2 3 4 3 4( ,. .) ( , ) ( , , ) ( , )A B Cg x x f x x f x x x f x x=

Marginal functions • For g(x1,..xn) define marginal function gi(xi) • gi(a) = sum of g over all configurations with xi=a • E.g. if h(x1,x2,x3)
• So
• For g corresponding to joint probability distribution this will be the marginal prob (perhaps up to a normalization factor)
ABDBM © Ron Shamir 21
1 2 3 1 2 3~{ 2} 1 1 3 3
( , , } ( , , )x x A x A
h x x x h x x x∈ ∈
=∑ ∑ ∑
1~{ }
( ) ( ,.., }i i nxi
g x g x x= ∑

Rasmussen’s slides on factor graphs
http://mlg.eng.cam.ac.uk/teaching/4f13/1718/
ABDBM © Ron Shamir 22

The algorithm • Sum-product theorem: If the factor graph
for some function f has no cycles, then
• Alg called sum-product alg or message passing or belief propagation.
• Compute from the leaves in – and then out to get all marginals
ABDBM © Ron Shamir 23
( ) ( )if wi
p w m w→=∏

ABDBM © Ron Shamir 24

Alg for factor graphs with cycles • Iterate until change is < ε or the num of
iterations exceeds an input limit • No guarantee, but often practical • Numerous applications from optimization,
statistics, information theory (Kalman filtering, error correcting codes…), ML (HMM, BN,..) !
Sources: • Kschischang et al. IEEE Trans Inf Theo 01 • Leoliger IEEE Sig Proce Magazine 04
ABDBM © Ron Shamir 25

Back to Paradigm
ABDBM © Ron Shamir 26

Integration key to interpret gene function
• Expression not always an indicator of activity
• Downstream effects often provide clues
TF
Inference: TF is OFF
(high expression but inactive)
TF
Inference: TF is ON
(low-expression but active )
TF
Inference: TF is ON (expression
reflects activity)
high high low

Integration key to interpret gene function
• Need multiple data modalities to get it right.
TF
Expression -> TF ON
BUT, targets are amplified
Lowers our belief in active TF
because explained away by
CN evidence.
Copy Number -> TF OFF

Integration Approach: Detailed models of gene expression and interaction
MDM2
TP53

Integration Approach: Detailed models of expression and interaction
MDM2
TP53
Two Parts:
1. Gene Level Model (central dogma)
2. Interaction Model (regulation)

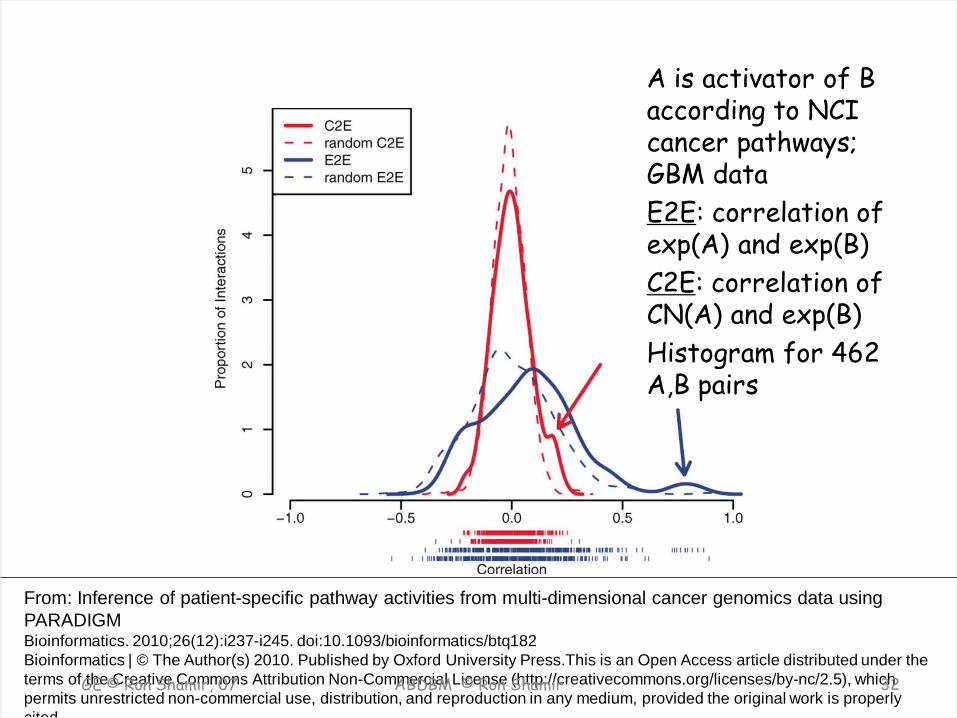
Assumption s • If gene A is an activator and is upstream
from B in some pathway, – their expression should be correlated – The copy number of A and the expression of B
should be correlated, though less
• Is this observable on real data?
31 ABDBM © Ron Shamir
From: Inference of patient-specific pathway activities from multi-dimensional cancer genomics data using PARADIGM Bioinformatics. 2010;26(12):i237-i245. doi:10.1093/bioinformatics/btq182 Bioinformatics | © The Author(s) 2010. Published by Oxford University Press.This is an Open Access article distributed under the terms of the Creative Commons Attribution Non-Commercial License (http://creativecommons.org/licenses/by-nc/2.5), which permits unrestricted non-commercial use, distribution, and reproduction in any medium, provided the original work is properly cited
A is activator of B according to NCI cancer pathways; GBM data E2E: correlation of exp(A) and exp(B) C2E: correlation of CN(A) and exp(B) Histogram for 462 A,B pairs
GE © Ron Shamir, 07 32 ABDBM © Ron Shamir

Factor Graph representation of a pathway
33
Variables - states of entities in a cell, (e.g. a particular mRNA or complex) represent the differential state of each entity in comparison with a ‘control’ or normal level. Each of X={X1, … Xn } is a random variable taking values -1, 0, or 1 Factors - interactions and information flow between these entities. Constrain the entities to take biologically meaningful values. j-th factor ϕj (Xj) is a probability distribution over a subset Xj of X
Joint probability distribution of all entities:
ABDBM © Ron Shamir

Toy example
34 ABDBM © Ron Shamir

Integrated Pathway Analysis for Cancer
Integrated dataset for downstream analysis
Inferred activities reflect neighborhood of influence around a gene.
Can boost signal for survival analysis (later: also mutation impact)
Multimodal Data
CNV
mRNA
meth
Pathway Model of Cancer
Cohort Inferred Activities
…

ABDBM © Ron Shamir
Model construction • Create a directed graph. For each gene, nodes: DNA,
exp, protein, active protein – Edges have positive/negative label – Pos edges DNA exp protein active-protein – Pos/neg edges active-prot1 prot2 using the pathway info
• For variable xj add a factor ϕj (Xj) where Xj={xj}∪Parents (xj)
• Expected value is set by majority vote of parent edges: positive: +1*state, negative: -1*state
• Other rules for AND, OR relations
36

Inference • Observed variables:
– DNA: copy number – mRNA: transcription level
• All values of the same data type from all samples are ranked from smallest to largest and mapped to [0,1]
• All variable values discretized to ternary values • Different observed data D for each patient, same
factor graph Φ (per pathway) • Inference: Compute P(xi=a|Φ) and P(xi=a,D|Φ)
using belief propagation
37 ABDBM © Ron Shamir

Inference • D={x1=s1,…xk=sk} the observed data for a patient • Let represent the set of all possible
assignments to a set of variables X that are consistent with the assignments in D
• Want to estimate the state of a hidden vbl xi
• Pr xi=a along with all the patient data:
ABDBM © Ron Shamir 38
DS X⊂
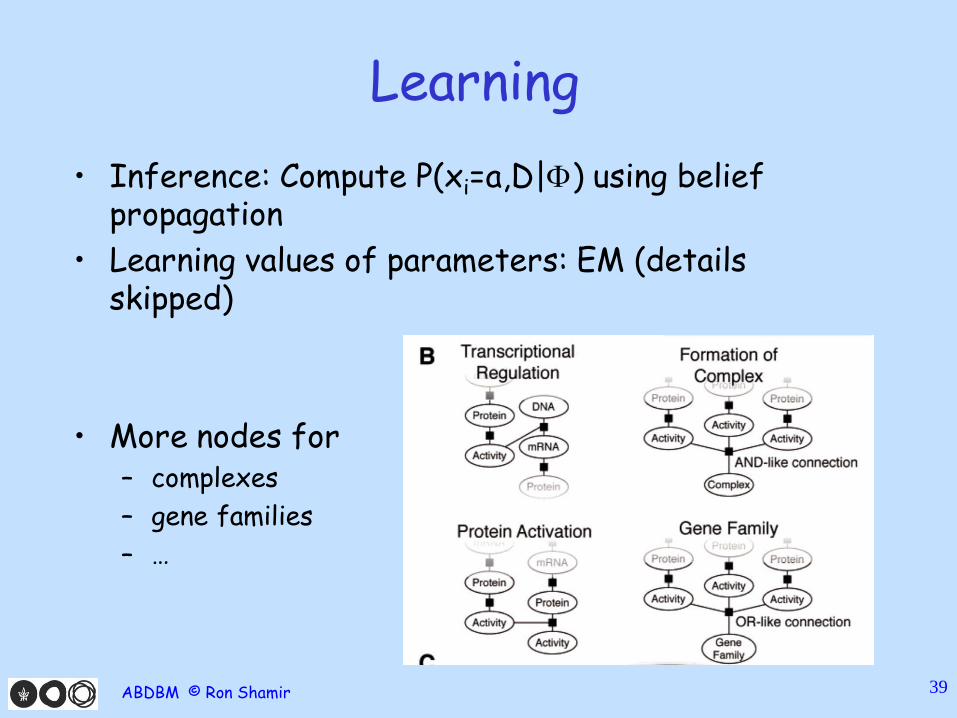
Learning • Inference: Compute P(xi=a,D|Φ) using belief
propagation • Learning values of parameters: EM (details
skipped)
• More nodes for – complexes – gene families – …
39 ABDBM © Ron Shamir

IPA scores • Compute IPA: integrated pathway activity score
per gene similar to log-likelihood ratios • Use log likelihood ratio: how much the data D
increases our belief that the entity is up/down
• The IPA is L value of the best option + its sign:
ABDBM © Ron Shamir 40
Significance assessment • Create 1000 permuted datasets where GE+CN of a
gene are taken from a random sample and a random gene in the pathway. (“within”)
• Create 1000 permuted datasets where GE+CN of a gene are taken from a random sample and a random gene in the genome. (“any”)
• Empirical p-values are measured against the distribution of the scores obtained on the permuted datasets
ABDBM © Ron Shamir 41

Testing
42
Problem: Most NCI pathways are cancer related. Need surely negative pathways. Created “decoy pathways” – same topology on random genes Ran Paradigm and SPIA (Tarca et al 09) on the combination of real and decoy pathways. Used each method to rank all the pathways. Computed ROC curve.
ABDBM © Ron Shamir
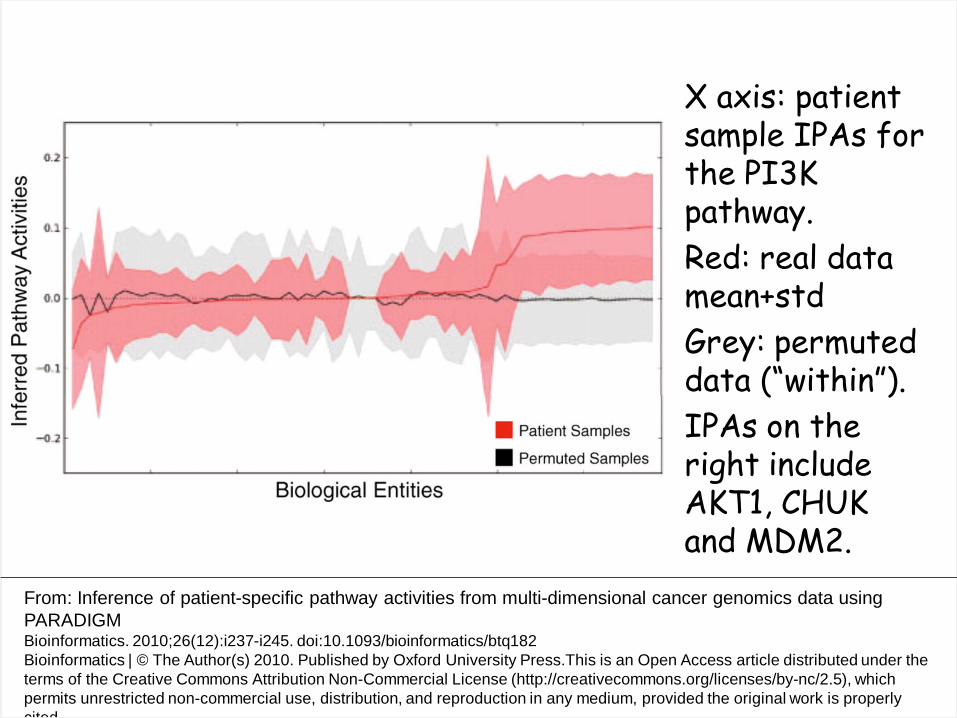
From: Inference of patient-specific pathway activities from multi-dimensional cancer genomics data using PARADIGM Bioinformatics. 2010;26(12):i237-i245. doi:10.1093/bioinformatics/btq182 Bioinformatics | © The Author(s) 2010. Published by Oxford University Press.This is an Open Access article distributed under the terms of the Creative Commons Attribution Non-Commercial License (http://creativecommons.org/licenses/by-nc/2.5), which permits unrestricted non-commercial use, distribution, and reproduction in any medium, provided the original work is properly cited
X axis: patient sample IPAs for the PI3K pathway. Red: real data mean+std Grey: permuted data (“within”). IPAs on the right include AKT1, CHUK and MDM2.

ErbB2 pathway in breast cancer
44
For each node, ER status, IPAs, expression data and copy-number data are displayed as concentric circles, from innermost to outermost, respectively. The apoptosis node and the ErbB2/ErbB3/ neuregulin 2 complex node have circles only for ER status and for IPAs, as there are no direct observations of these entities. Each patient’s data is displayed along one angle from the circle center to edge.
ABDBM © Ron Shamir

Clustering of IPAs for GBM patients. Rows: 1755 entities with IPA>0.25 in ≥75 of 229 samples. Cols: samples
Cluster 4 signif. different from rest (Cox PH p<2.11x 10⁻⁵)

TCGA Ovarian Cancer Inferred Pathway Activities
Patient Samples (247) Pa
thw
ay C
once
pts (
867)
TCGA Network. 2011. Nature (lead by Paul Spellman)

Ovarian: FOXM1 pathway altered in majority of serous ovarian tumors
FOXM1 Transcription Network
Patient Samples (247)
Path
way
Con
cept
s (86
7)
TCGA Network. 2011. Nature (lead by Paul Spellman)

FOXM1 central to cross-talk between DNA repair and cell proliferation
in Ovarian Cancer
TCGA Network. 2011. Nature (lead by Paul Spellman)

PARADIGM-SHIFT predicts the function of mutations in multiple cancers using
pathway impact analysis
Sam Ng, Eric A. Collisson, Artem Sokolov ,Theodore Goldstein,Abel Gonzalez-Perez, Nuria Lopez-
Bigas, Christopher Benz, David Haussler, Joshua M. Stuart UC Santa Cruz, CA, USA Bioinformatics 2012
49 ABDBM © Ron Shamir

Pathway signatures of mutations
Mutated genes are the focus of many targeted approaches. Some patients with “right” mutation don’t respond. Why? Many cancers have several “novel” mutations. Can these
be targeted with current approaches? Pathway-motivated approach: A mutated gene can alter its
neighborhood Gain-of-function (GOF): new activity of gene/pathway Loss-of-function (LOF): deactivated gene/pathway/function A mutation in a gene can be manifest through the effect on
its neighbors in the pathway

FG FG
High Inferred Activity
Low Inferred Activity
Predicted Loss-Of-Function
Predicted Gain-Of-Function
PARADIGM-Shift: Pathway context of GOF and LOF events
Use pathways to predict the impact of observed mutations in patient tumors
FG: focus gene

PARADIGM-Shift Predicting the Impact of Mutations On Genetic Pathways
FG
Inference using all neighbors
FG
Inference using downstream neighbors
FG
Inference using upstream neighbors
SHIFT
High Inferred Activity
Low Inferred Activity
mutated gene

FG
PARADIGM-Shift Calculation Overview

FG FG
1. Identify Local
Neighbor-
hood
PARADIGM-Shift Calculation Overview

FG FG
1. Identify Local
Neighbor-
hood
FG
FG
2a. Regulators
Run
2b. Targets
Run
PARADIGM-Shift Calculation Overview
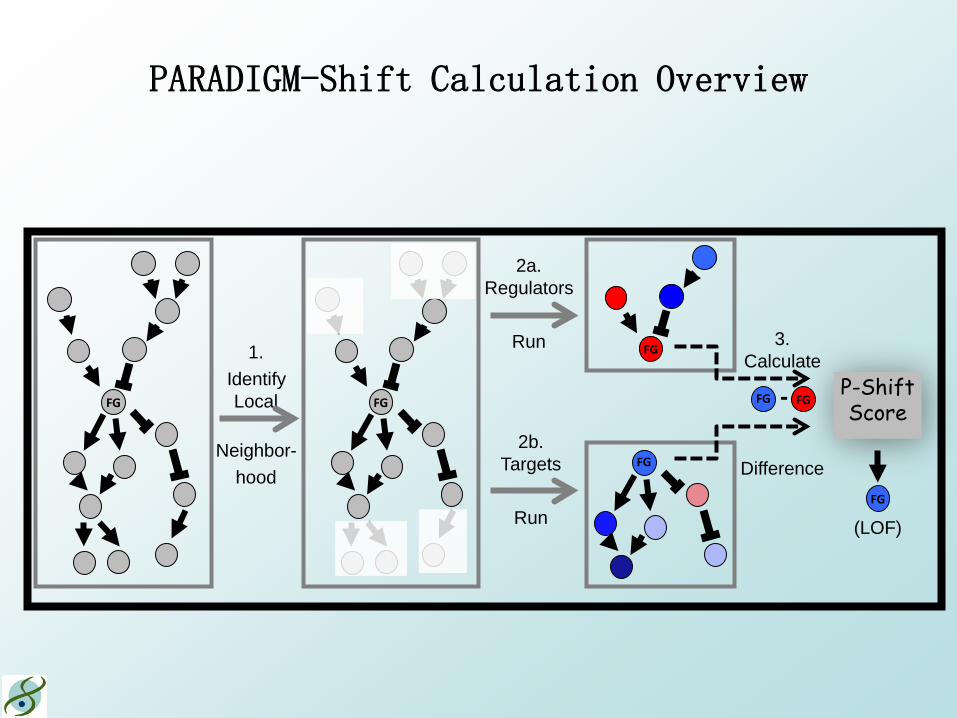
FG FG
1. Identify Local
Neighbor-
hood
FG
FG
2a. Regulators
Run
2b. Targets
Run
P-Shift Score
3. Calculate
Difference
FG FG -
FG
(LOF)
PARADIGM-Shift Calculation Overview

PS score • f – the focus gene. • Want PS(f) = log (observed(f)/expected(f)) • Expected – activity based on upstream regulators • Observed – activity based on downstream targets • R-run: Paradigm run with regulators only, T-run: targets only • D(R), D(T), D(f): observed data for regulators, targets, f only • LR(Y|xa,Z)=P(Y|xa,Z)/P(Y|x¬a,Z) likelihood ratio for data
given x=a vs. the alternative x≠a • Φ(T) model limited to f & its targets, Φ(R) f & its regulators
57 ABDBM © Ron Shamir
( ( ) | , ( ))( ) log
( ( ) | , ( ))
afaf
LR D T x TPS f
LR D R x R Φ
= Φ ( ( ), | ( )) ( ( ), | ( ))
log log( ( ), | ( )) ( ( ), | ( ))
a af fa a
f f
LR D T x T LR D R x Rprior
LR D T x T LR D R x R¬ ¬
Φ Φ= − − Φ Φ

PS score computation • Use IPLs from PARADIGM PS(f)=IPLT(f)-IPLR(f) • Transforming to Z-scores showed improvement in
practice: – Create 100 random samples for gene f by shuffling data – Compute PS(f) scores, average µ and std σ. – Z-normalize the score s on the real data to (s-µ)/σ
• Running P-Shift: 2k Paradigm runs for k mutated genes per patient (typically k = 10-30).
• Paradigm runs are faster on the reduced neighborhoods.
ABDBM © Ron Shamir 58
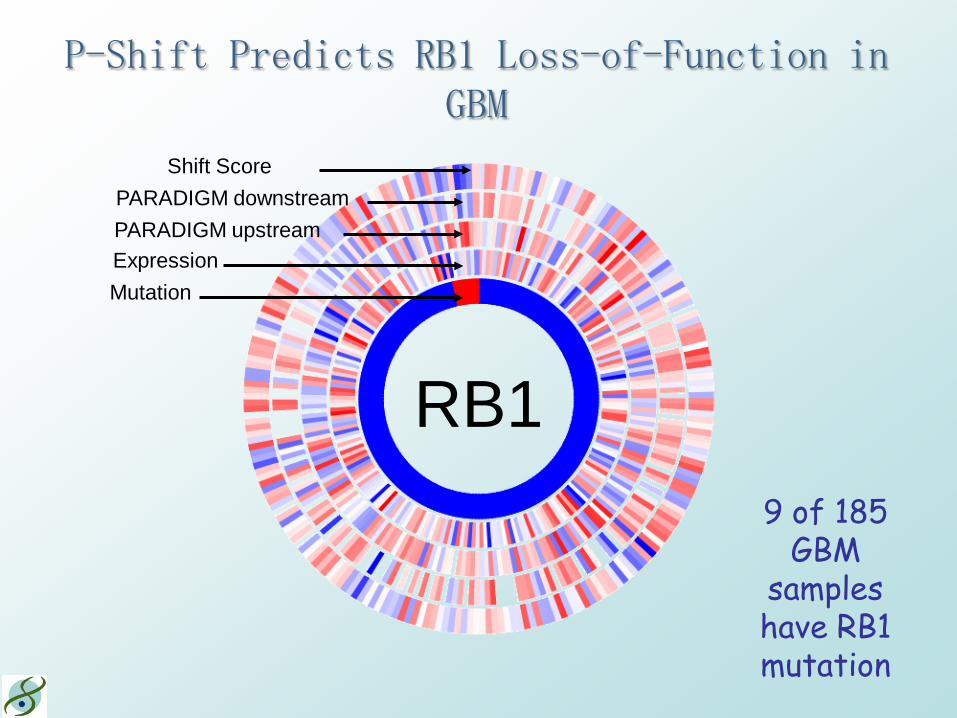
P-Shift Predicts RB1 Loss-of-Function in GBM
Shift Score PARADIGM downstream PARADIGM upstream Expression Mutation
RB1 9 of 185
GBM samples have RB1 mutation

RB1 Network (GBM)
Neighbor Gene Key
Activity
Expression
RB1 Mutation
Focus Gene Key P-Shift
Expression Mutation
T-Run R-Run

RB1 Discrepancy Scores distinguish mutated vs non-mutated samples
Mutated Non-mutated Distribution of
M-sep scores on 1000 background
models: same topology with permuted gene data tuples
Distinction is
significant
Observed
Background

TP53 Network in GBM
48 of 185 GBM samples have TP53 mutations
LOF – tumor suppressor
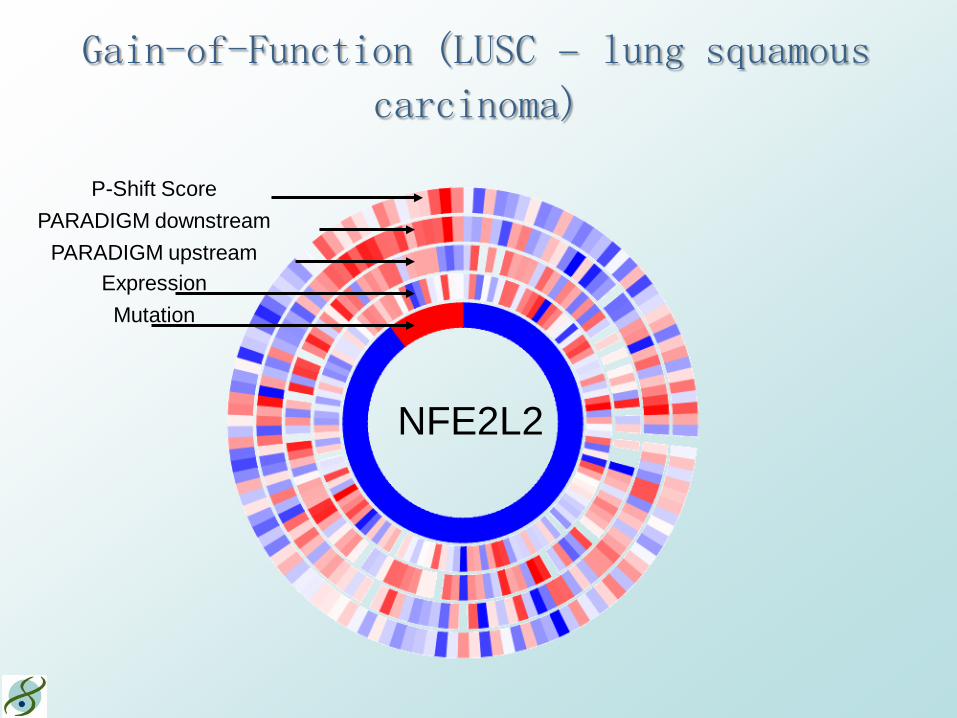
Gain-of-Function (LUSC – lung squamous carcinoma)
NFE2L2
P-Shift Score PARADIGM downstream
PARADIGM upstream Expression Mutation

NFE2L2 Network (LUSC)
Neighbor Gene Key
Activity
Expression
RB1 Mutation
Focus Gene Key P-Shift
Expression Mutation
T-Run R-Run
NFE2L2
17 of 184 LUSC samples have NFE2L2 mutations A known proto-oncogene

PARADIGM-Shift gives orthogonal view of the importance of cancer mutations
Genes ordered by their m-sep scores. Some low frequency mutations appear impactful. They are not detectable by tools that seek frequent mutations as potential “driver mutations” (e.g. Mutsig)
Recap • Paradigm: integrated analysis of GE and CN data,
employing knowledge on cancer pathways • Modeling by factor graphs – versatile, useful tool! • Produces IPA (integrated pathway activity) scores • Clustering the IPA scores matrix identifies groups
with significantly separable survival • Was used in several large cancer projects since • Paradigm-shift: use the above + mutations • Uses multiple Paradigm runs per focus genes to
compute m-sep scores, identify GOF and LOF events
• CircleMap: smart visualization of multiple data levels ABDBM © Ron Shamir 66


