32
PARAGUAY CLIMATE RISK COUNTRY PROFILE

iiCLIMATE RISK COUNTRY PROFILE: PARAGUAY
COPYRIGHT© 2021 by the World Bank Group1818 H Street NW, Washington, DC 20433Telephone: 202-473-1000; Internet: www.worldbank.org
This work is a product of the staff of the World Bank Group (WBG) and with external contributions. The opinions, findings, interpretations, and conclusions expressed in this work are those of the authors and do not necessarily reflect the views or the official policy or position of the WBG, its Board of Executive Directors, or the governments it represents.
The WBG does not guarantee the accuracy of the data included in this work and do not make any warranty, express or implied, nor assume any liability or responsibility for any consequence of their use. This publication follows the WBG’s practice in references to member designations, borders, and maps. The boundaries, colors, denominations, and other information shown on any map in this work, or the use of the term “country” do not imply any judgment on the part of the WBG, its Boards, or the governments it represents, concerning the legal status of any territory or geographic area or the endorsement or acceptance of such boundaries.
The mention of any specific companies or products of manufacturers does not imply that they are endorsed or recommended by the WBG in preference to others of a similar nature that are not mentioned.
RIGHTS AND PERMISSIONSThe material in this work is subject to copyright. Because the WBG encourages dissemination of its knowledge, this work may be reproduced, in whole or in part, for noncommercial purposes as long as full attribution to this work is given.
Please cite the work as follows: Climate Risk Profile: Paraguay (2021): The World Bank Group.
Any queries on rights and licenses, including subsidiary rights, should be addressed to World Bank Publications, The World Bank Group, 1818 H Street NW, Washington, DC 20433, USA; fax: 202-522-2625; e-mail: [email protected].
Cover Photos: © Oscar Mendoza/Food and Agricultural Organization, “Paraguay familias productoras” May 24, 2017” via Flickr, Creative Commons CC BY-NC-ND 2.0. © Oscar Mendoza/World Bank “Mesoamérica Sin Hambre” May 25, 2017 via Flickr, Creative Commons CC BY-NC-ND 2.0.
Graphic Design: Circle Graphics, Reisterstown, MD.

iiiCLIMATE RISK COUNTRY PROFILE: PARAGUAY
ACKNOWLEDGEMENTSThis profile is part of a series of Climate Risk Country Profiles developed by the World Bank Group (WBG). The country profile synthesizes most relevant data and information on climate change, disaster risk reduction, and adaptation actions and policies at the country level. The country profile series are designed as a quick reference source for development practitioners to better integrate climate resilience in development planning and policy making. This effort is managed and led by Veronique Morin (Senior Climate Change Specialist, WBG) and Ana E. Bucher (Senior Climate Change Specialist, WBG).
This profile was written by Fernanda Zermoglio (Senior Climate Change Consultant, WBG) and MacKenzie Dove (Senior Climate Change Consultant, WBG). Additional support was provided by Jason Johnston (Operations Analyst, WBG) and Yunziyi Lang (Climate Change Analyst, WBG).
Climate and climate-related information is largely drawn from the Climate Change Knowledge Portal (CCKP), a WBG online platform with available global climate data and analysis based on the latest Intergovernmental Panel on Climate Change (IPCC) reports and datasets. The team is grateful for all comments and suggestions received from the sector, regional, and country development specialists, as well as climate research scientists and institutions for their advice and guidance on use of climate related datasets.

ivCLIMATE RISK COUNTRY PROFILE: PARAGUAY
FOREWORD . . . . . . . . . . . . . . . . . . . . . . . . . . . . . . . . . . . . 1
COUNTRY OVERVIEW . . . . . . . . . . . . . . . . . . . . . . . . . . . . . . . 2
CLIMATOLOGY . . . . . . . . . . . . . . . . . . . . . . . . . . . . . . . . . . 4Climate Baseline 4
Overview 4Key Trends 7
Climate Future 8Overview 8Key Trends 10
CLIMATE RELATED NATURAL HAZARDS . . . . . . . . . . . . . . . . . . . . . .11Overview 11Key Trends 12Implications for DRM 14
CLIMATE CHANGE IMPACTS TO KEY SECTORS . . . . . . . . . . . . . . . . . . 14Gender 15Agriculture 15Water 18Energy 21Health 23
ADAPTATION . . . . . . . . . . . . . . . . . . . . . . . . . . . . . . . . . . 25Institutional Framework for Adaptation 25Policy Framework for Adaptation 25Recommendations 26
Research Gaps 26Data and Information Gaps 27Institutional Gaps 27
CONTENTS

1CLIMATE RISK COUNTRY PROFILE: PARAGUAY
Climate change is a major risk to good development outcomes, and the World Bank Group is committed to playing
an important role in helping countries integrate climate action into their core development agendas. The World
Bank Group is committed to supporting client countries to invest in and build a low-carbon, climate-resilient future,
helping them to be better prepared to adapt to current and future climate impacts.
The World Bank Group is investing in incorporating and systematically managing climate risks in development
operations through its individual corporate commitments.
A key aspect of the World Bank Group’s Action Plan on Adaptation and Resilience (2019) is to help countries shift
from addressing adaptation as an incremental cost and isolated investment to systematically incorporating climate
risks and opportunities at every phase of policy planning, investment design, implementation and evaluation of
development outcomes. For all International Development Association and International Bank for Reconstruction
and Development operations, climate and disaster risk screening is one of the mandatory corporate climate
commitments. This is supported by the Bank Group’s Climate and Disaster Risk Screening Tool which enables all
Bank staff to assess short- and long-term climate and disaster risks in operations and national or sectoral planning
processes. This screening tool draws up-to-date and relevant information from the World Bank’s Climate Change
Knowledge Portal, a comprehensive online ‘one-stop shop’ for global, regional, and country data related to climate
change and development.
Recognizing the value of consistent, easy-to-use technical resources for client countries as well as to support
respective internal climate risk assessment and adaptation planning processes, the World Bank Group’s Climate
Change Group has developed this content. Standardizing and pooling expertise facilitates the World Bank Group in
conducting initial assessments of climate risks and opportunities across sectors within a country, within institutional
portfolios across regions, and acts as a global resource for development practitioners.
For developing countries, the climate risk profiles are intended to serve as public goods to facilitate upstream
country diagnostics, policy dialogue, and strategic planning by providing comprehensive overviews of trends
and projected changes in key climate parameters, sector-specific implications, relevant policies and programs,
adaptation priorities and opportunities for further actions.
It is my hope that these efforts will spur deepening of long-term risk management in developing countries and our
engagement in supporting climate change adaptation planning at operational levels.
Bernice Van BronkhorstGlobal Director
Climate Change Group (CCG)
The World Bank Group (WBG)
FOREWORD

2CLIMATE RISK COUNTRY PROFILE: PARAGUAY
The Republic of Paraguay, a landlocked
country in South America, is bordered by
Argentina, Brazil, and Bolivia, and has a
Mediterranean climate with almost seven million
inhabitants.1 60% of the country lives in the urban
centers of Encarnación, Ciudad del Este, and the
capital city of Asunción. Political and economic
stability have given the country the largest economic
growth in Latin America in the last 30 years.
Considered an upper middle-income economy,
in recent years the country has positioned itself
as an attractive and orderly place for investments,
further fueling economic growth. Paraguay is a
country of countless natural resources, with a
growing and productive agricultural and livestock
sector. Clean and renewable energy is abundant
and exported regionally. As shown in Figure 1,
the country is largely flat with low-lying hill regions
62% of Paraguay’s approximately 7 million inhabitants
reside in urban areas, and the annual urban growth rates are 1.7%.3 Population projections for 2030 point to an
additional 1 million people living in the country, and a 65.7% residing in urban areas, while in 2050, the country’s
estimated population will top 9 million inhabitants, of which 74.3% will reside in urban areas. Paraguay has made
significant strides in poverty reduction and lowering inequality, reducing the number of people living in poverty in
2011 from 37% to 24.2% in 2018 (Table 1).4 GDP per capita in 2017 was estimated to be US$5.335 with an
annual growth rate of 4.8%.5,6 Nevertheless, significant challenges regarding access to land and the inequitable
COUNTRY OVERVIEW
1 World Bank (2020). Open Data, DataBank–Paraguay. [Data Retrieved: July 2020]. URL: https://data.worldbank.org/country/paraguay
2 World Bank Group (2019). Internal Climate Migration Profile – Paraguay.3 World Bank (2020). Open Data, - Paraguay. [Data Retrieved August 2020]. URL: https://databank.worldbank.org/source/
world-development-indicators4 World Bank (2020). Open Data, DataBank – Paraguay. [Data Retrieved July 2020]. URL: https://databank.worldbank.org/views/
reports/reportwidget.aspx?Report_Name=CountryProfile&Id=b450fd57&tbar=y&dd=y&inf=n&zm=n&country=PRY5 CIA Factbook (2020). Paraguay. URL: https://theodora.com/wfbcurrent/paraguay/paraguay_economy.html6 FOCUS Economics (2020). Paraguay. URL: https://www.focus-economics.com/countries/paraguay
FIGURE 1 . Topography of Paraguay2
TABLE 1 . Data snapshot: Key development indicators
Indicator 2018
Life expectancy at birth, total (years) 74.1
Population density (people per sq. km land area) 17.5
% of Population with access to electricity 100%
GDP per capita (current US$) $5,805.70

3CLIMATE RISK COUNTRY PROFILE: PARAGUAY
distribution of the country’s wealth remain. Major economic sectors are principally commodity based, and include
exports of energy, beef and soy. The country has taken significant steps in recent years to diversity the economy
and has a growing informal commerce and services sector. With the support of the World Bank, the Paraguayan
government aims to promote sustainable growth and institutional strengthening, while supporting investments in
human capital and advancing the fight against corruption.7 The ongoing drought in Paraguay (beginning in late
2018 and projected to continue through early 2012), has hit the country’s production and trade of key economic
staples particularly hard, causing Paraguay’s central bank to cut back its annual growth projections.8
The ND-GAIN Index9 ranks 181 countries using
a score which calculates a country’s vulnerability
to climate change and other global challenges
as well as their readiness to improve resilience.
This Index aims to help businesses and the public
sector better identify vulnerability and readiness
in order to better prioritize investment for more
efficient responses to global challenges. Due to
a combination of political, geographic, and social
factors, Paraguay is recognized as vulnerable
to climate change impacts, ranked 95 out of
181 countries in the 2019 ND-GAIN Index. The
more vulnerable a country is the lower their score,
while the more ready a country is to improve its
resilience the higher it will be. Norway has the
highest score and is ranked 1st. Figure 2 is a
time-series plot of the ND-GAIN Index showing
Paraguay’s progress
Paraguay’s economic reliance on agriculture, animal husbandry and hydroelectric energy production make it
particularly vulnerable to the impacts of increasing climate variability and climate change. The country’s high rate of
deforestation, especially for a growing agriculture and livestock sector, is significant. More frequent extreme events
such as intense rainfall and heat waves are increasingly common, negatively impacting all sectors. Additionally,
a significant increase in total annual rainfall has been reported for the summer months of November to December,
corresponding with ENSO (El Niño Southern Oscillation) events, which are also associated with floods. La Niña
events bring the increasing occurrence and intensity of droughts.10
Sco
re
1995 1997 1999 2001 2003 2005 2007 2009 2011 201340
42.5
45
47.5
50
52.5
Paraguay
FIGURE 2 . ND-GAIN Index for Paraguay
7 World Bank (2020). Paraguay Country Partnership Strategy. URL: https://www.worldbank.org/en/country/paraguay/overview#28 Desantis, D. (2019). Amid ‘many shocks,’ Paraguay cuts 2019 growth outlook again due to drought, trade. Reuters. URL: https://
www.reuters.com/article/paraguay-economy/amid-many-shocks-paraguay-cuts-2019-growth-outlook-again-due-to-drought-trade-idUSL2N2780ZP
9 University of Notre Dame (2020). Notre Dame Global Adaptation Initiative. URL: https://gain.nd.edu/our-work/country-index/10 Baéz Benitez, J. (2014). Analysis of Meteorological Drought Episodes in Paraguay. URL: https://link.springer.com/article/10.1007/
s10584-014-1260-7

4CLIMATE RISK COUNTRY PROFILE: PARAGUAY
Paraguay submitted its Nationally Determined Contributions to the UNFCCC in 2016 and its Third National
Communication (NC3) in 2017, in support of the country’s efforts to realize its development goals and increase
its resilience to climate change by enhancing mitigation and adaptation implementation efforts.11 Adaptation is a
priority in the National Development Plan (2014–2030) across the following sectors: water resources, forests,
agriculture and livestock production, territorial planning, energy, infrastructure, health, disaster risk management
and early warning systems.12
Green, Inclusive and Resilient RecoveryThe coronavirus disease (COVID-19) pandemic has led to unprecedented adverse social and economic impacts.
Further, the pandemic has demonstrated the compounding impacts of adding yet another shock on top of
the multiple challenges that vulnerable populations already face in day-to-day life, with the potential to create
devastating health, social, economic and environmental crises that can leave a deep, long-lasting mark. However,
as governments take urgent action and lay the foundations for their financial, economic, and social recovery, they
have a unique opportunity to create economies that are more sustainable, inclusive and resilient. Short and long-
term recovery efforts should prioritize investments that boost jobs and economic activity; have positive impacts
on human, social and natural capital; protect biodiversity and ecosystems services; boost resilience; and advance
the decarbonization of economies.
Climate Baseline
OverviewParaguay’s climate overall is characterized by high humidity and warm temperatures year-round, with hot and rainy
summers, and mild winters with significant temperature variability that can bring both frosts to practically the entire
national territory, as well as heat waves.13 Paraguay’s landscape is characterized by three distinct ecosystems,
bordering the southward flowing Paraguay River. The eastern landscape is one of a humid sub-tropical climate
CLIMATOLOGY
11 Paraguay (2016). Contribuciones Nacionales de la Republia del Paraguay. URL: https://www4.unfccc.int/sites/ndcstaging/PublishedDocuments/Paraguay%20First/Documento%20INDC%20Paraguay%2001-10-15.pdf
12 Paraguay (2016). Tercera comunicación Nacional de la Republica de Paraguay. URL: https://unfccc.int/sites/default/files/resource/NC3%20PARAGUAY.pdf
13 Paraguay (2018). Segundo Informe Bienal de Actualizacion del Paraguay. URL: https://unfccc.int/sites/default/files/resource/56910784_Paraguay-BUR2-1-Informe%20Bienal%20de%20Actualizacion_PY_Dic%202018_.pdf

5CLIMATE RISK COUNTRY PROFILE: PARAGUAY
composed of verdant hills, meadows and forests, and include the great Parana Plateau, reaching altitudes of
300–600 meters (m) above sea level. Lowland plains, subject to annual floods, characterize the easternmost
reaches of the country, which have a tropical savanna climate. To the west lie the dry, vast alluvial plains and dry
grasslands of the Gran Chaco characterized by a hot, semi-arid climate.14
Average temperatures increase from south to north, while rainfall decreases from east to west. Warm temperatures
are present throughout most of the year, as average annual temperatures exceed 20°C throughout the country. In
the Eastern Region, the annual average temperature is between 20°C and 24°C, while in the Chaco or Western
Region, average annual temperatures hover around 25°C. The two periods of maximum rainfall in most of the
country are from March to May and from October to November. Rainfall in the Paraná region (southern Paraguay)
is abundant, averaging 1,900 millimeters (mm) per year and is regularly distributed across the year.15 Rainfall in the
central region, where the capital city of Asuncion is located, is typically 1,400 mm per annum and distributed across
all but the coldest months of the year (June-July). Downpours are common from September to April, where a large
amount of rain falls in a few minutes and generally this occurs when tropical air masses are dominant, and humidity
is high. Light rains are common during the winter months, from May to August. In the Chaco, average annual
rainfall is between 500 to 1,000 mm, but concentrated in the summer months, bringing floods to this typically
dry region in winter.16
Analysis of data from the World Bank Group’s Climate Change Knowledge Portal (CCKP) (Table 2) shows
the latest historical climatology for the period between1991–2019. Mean annual temperature for 24.7°C. Mean
annual precipitation is 2,652.8 mm, with year-round rainfall; the lowest rainfall occurs during the winter months
June to August (Figure 3).17 Figure 4 presents the spatial variation of observed average annual precipitation
and temperature.
TABLE 2 . Data snapshot: Country-level summary statistics
Climate Variables 1991–2019
Mean Annual Temperature (°C) 24.7°C
Mean Annual Precipitation (mm) 2,652.8 mm
Mean Maximum Annual Temperature (°C) 29.3°C
Mean Minimum Annual Temperature (°C) 20.2°C
14 GERICS (2020). Climate-Fact Sheet: Paraguay. GERICS Climate Service Center. URL: https://www.climate-service-center.de/products_and_publications/fact_sheets/climate_fact_sheets/index.php.en
15 Paraguay (2012). Political Nacional de Cambio Climático de Paraguay. URL: https://www.undp.org/content/dam/paraguay/docs/Politica%20Nacional%20CC.pdf
16 FAO (2020). Analysis and Mapping of Impacts Under Climate Change for Adaptation and Food Security Project: Paraguay. URL: http://www.fao.org/in-action/amicaf/en/
17 WBG Climate Change Knowledge Portal (CCKP, 2020). Paraguay Historical Data. URL: https://climateknowledgeportal.worldbank.org/country/paraguay/climate-data-historical

6CLIMATE RISK COUNTRY PROFILE: PARAGUAY
FIGURE 4 . Map of average annual precipitation (left); annual temperature (right) for Paraguay, 1901–201919
FIGURE 3 . Average monthly temperature and rainfall of Paraguay for 1991–201918Te
mpe
ratu
re Rainfall
Jan Feb Mar Apr May Jun Jul Aug Sep Oct Nov Dec6°C
12°C
18°C
24°C
30°C
0 mm
40 mm
80 mm
120 mm
160 mm
TemperatureRainfall
18 WBG Climate Change Knowledge Portal (CCKP, 2020). Paraguay Historical Data. URL: https://climateknowledgeportal.worldbank.org/country/paraguay/climate-data-historical
19 WBG Climate Change Knowledge Portal (CCKP, 2020). Paraguay Historical Data. URL: https://climateknowledgeportal.worldbank.org/country/paraguay/climate-data-historical

7CLIMATE RISK COUNTRY PROFILE: PARAGUAY
Key TrendsTemperatureTemperatures in Paraguay, particularly maximum temperatures, were observed to increase from 1960 to 2010
in both winter and summer months, with greater increases seen in summer months.20 (Figure 5). Average
maximum temperatures, likewise, have also increased. The number of warm nights21 have increased, while the
number of cold nights22 have decreased.23
FIGURE 5 . Observed temperature for Paraguay, 1901–201924
Tem
pera
ture
Annual Mean 5 Year Smoothing
22°C
23°C
24°C
25°C
1901 1926 1941 1956 1971 20011986 2016
20 Paraguay (2016). Tercera comunicación Nacional de la Republica de Paraguay. URL: https://unfccc.int/sites/default/files/resource/NC3%20PARAGUAY.pdf
21 “Warm: night is defined by the temperature exceeded on 10% of days or nights in current climate of region or season.22 “Cold” night is defined by the temperature below which 10% of days or nights are recorded in current climate of that region or season.23 Paraguay (2016). Tercera comunicación Nacional de la Republica de Paraguay. URL: https://unfccc.int/sites/default/files/resource/
NC3%20PARAGUAY.pdf24 WB Climate Change Knowledge Portal (CCKP, 2020). Paraguay URL: https://climateknowledgeportal.worldbank.org/country/
paraguay/climate-data-historical25 Paraguay (2019). Tendencias de la pecipitación y temperature en Paraguay. URL: http://www.iea.usp.br/midiateca/apresentacao/
sic2_julianbaez.pdf/at_download/file
PrecipitationPrecipitation patterns exhibit a high degree of inter-annual variability in Paraguay. For example, annual rainfall in
Asuncion can vary between 2,000 mm and 500 mm. An increase in total annual rainfall has been reported for
the summer months of November to December, corresponding with ENSO (El Niño Southern Oscillation) events,
which are also associated with floods. La Niña events bring droughts. All locations also point to an increase in
the number of days receiving heavy rainfall.25

8CLIMATE RISK COUNTRY PROFILE: PARAGUAY
TABLE 3 . Data snapshot: CMIP5 ensemble projection
CMIP5 Ensemble Projection 2020–2039 2040–2059 2060–2079 2080–2099
Annual Temperature Anomaly (°C) +0.3 to +2.1(+1.2°C)
+0.7 to +3.2(+2.1°C)
+1.3 to +5.0(+3.2°C)
+1.7 to +6.6(+4.3°C)
Annual Precipitation Anomaly (mm) -17.3 to +20.5 (-0.2 mm)
-19.0 to +22.9(1.0 mm)
-20.2 to +28.0(1.4 mm)
-21.8 to +33.3(4.3 mm)
Note: The table shows CMIP5 ensemble projection under RCP8.5. Bold value is the range (10th–90th Percentile) and values in parentheses show the median (or 50th Percentile).
Climate Future
OverviewThe main data source for the World Bank Group’s Climate Change Knowledge Portal is the CMIP5 (Coupled Inter-
comparison Project Phase 5) data ensemble, which builds the database for the global climate change projections
presented in the Fifth Assessment Report (AR5) of the Intergovernmental Panel on Climate Change (IPCC). Four
Representative Concentration Pathways (i.e. RCP2.6, RCP4.5, RCP6.0, and RCP8.5) were selected and defined by
their total radiative forcing (cumulative measure of GHG emissions from all sources) pathway and level by 2100. The
RCP2.6 for example represents a very strong mitigation scenario, whereas the RCP8.5 assumes business-as-usual
scenario. For more information, please refer to the RCP Database. For simplification, these scenarios are referred
to as a low (RCP2.6); a medium (RCP4.5) and a high (RCP8.5) emission scenario in this profile. Table 3 provides
CMIP5 projections for essential climate variables under high emission scenario (RCP 8.5) over 4 different time
horizons. Figure 6 presents the multi-model (CMIP5) ensemble of 32 Global Circulation Models (GCMs) showing
the projected changes in annual precipitation and temperature for the periods 2040–2059 and 2080–2099.

9CLIMATE RISK COUNTRY PROFILE: PARAGUAY
FIGURE 6 . CMIP5 multi-model ensemble projected change (32 GCMs) in annual temperature (top) and precipitation (bottom) by 2040–2059 (left) and by 2080–2099 (right), relative to 1986–2005 baseline under RCP8 526
26 WBG Climate Change Knowledge Portal (CCKP, 2020). Paraguay Projected Future Climate. URL: https://climateknowledgeportal.worldbank.org/country/paraguay/climate-data-projections

10CLIMATE RISK COUNTRY PROFILE: PARAGUAY
Key TrendsTemperatureTemperatures across Paraguay are projected to continue rising, with mean monthly temperatures projected to rise
by +2°C by the 2050s and by 4°C by the end of the century under a high-emissions scenario (RCP8.5). Rising
temperatures are projected across all months. The highest temperature rise is projected for the northeast along the
Paraguay river watershed. Rising temperatures will have significant implications for water resources management
and hydroelectric power generation, as evaporation increases.27 Of critical importance is the increase in the number
of very hot days (where temperatures are above 35°C, which are projected to increase from approximately 24 to
113 days of the year by the end of the century.28
Across all emissions scenarios, temperatures are projected to continue to rise in Paraguay, through the end of the
century. As seen in Figure 7, under a high-emissions scenario (RCP8.5), average temperatures are projected to
rise rapidly after the 2040s. High temperatures, analyzed in terms of the number of days above 25 degrees, are
expected to rise significantly across the seasonal cycle, with the most pronounced changes occurring during May
to August (Figure 8). Rising temperatures and extreme heat conditions will result in significant implications for
human and animal health, agriculture, water resources, and ecosystems.
1980 2000 2020 2040 2060 2080 2100
degC
Historical RCP 2.6 RCP 4.5 RCP 6.0 RCP 8.5Year
30
29
28
27
26
25
24
23
22
FIGURE 7 . Historical and projected average temperature for Paraguay from 1986 to 209929
12
10
8
6
4
2
0
–2
days
Jan Feb Mar Apr May Jun Jul Aug Sep Oct Nov Dec
FIGURE 8 . Projected change in summer days (Tmax > 25°C)30
27 Pezzoli, A. et al. (2016). Vulnerability and Resilience to drought in the Chaco, Paraguay. URL: https://iris.polito.it/retrieve/handle/11583/2654744/129731/Chapter%204_published_20161031.pdf
28 Paraguay (2016). Tercera comunicación Nacional de la Republica de Paraguay. URL: https://unfccc.int/sites/default/files/resource/NC3%20PARAGUAY.pdf
29 WBG Climate Change Knowledge Portal (CCKP, 2020). Interactive Climate Indicator Dashboard - Transportation. URL http://crme.rap.ucar.edu/CRMePortal/web/agriculture
30 WBG Climate Change Knowledge Portal (CCKP, 2020). Interactive Climate Indicator Dashboard – Agriculture: Paraguay URL https://crme.rap.ucar.edu/CRMePortal/web/agriculture

11CLIMATE RISK COUNTRY PROFILE: PARAGUAY
PrecipitationRainfall in Paraguay is subject to significant interannual variability due to the El Nino Southern Oscillation, which brings
floods and cooler weather, whereas La Niña episodes are associated with droughts and warmer weather in Paraguay.
Average monthly precipitation in the austral winter months (June-August) are projected to increase significantly,
particularly in the North, East and Southeast, while
precipitation during the austral summer months
is projected to either remain constant or slightly
decrease in the northeastern regions.31
Additionally, the amount of rain (maximum 5-day
rainfall totals) will see a slight increase across
the 21st Century. As shown in Figure 9, there
is significant uncertainty on the future of rainfall
patterns for Paraguay32 with most scenarios pointing
to an average projected increase in annual
precipitation is by the of the century under a high
emissions scenario for Paraguay as a whole (RCP8.5).
However, projections point to significant regional
variability.
1980 2000 2020 2040 2060 2080 2100m
m
Historical RCP 2.6 RCP 4.5 RCP 6.0 RCP 8.5Year
1600
1400
1200
1000
800
600
400
FIGURE 9 . Annual average precipitation in Paraguay for 1986 to 209933
OverviewParaguay’s diverse landscape is subject to the impacts of extreme events. The alluvial plains and hills where most
of the country’s population is concentrated, are subject to landslides and significant flooding due to increased
surface run off from extreme rainfall on degraded forest and riparian ecosystems, which increase sediment loads.34
Droughts are also common in the western zone, particularly during La Niña events and during the months of
December through February, leading to water supply shortages for human, agriculture and livestock needs.35
In Paraguay, intense droughts can significantly reduce hydroelectric outputs. Abnormal climatic conditions associated
with the El Niño phenomenon can produce high temperatures and severe floods, particularly between the months
CLIMATE RELATED NATURAL HAZARDS
31 Paraguay (2017). Tercera comunicación Nacional de la Republica de Paraguay. URL: https://unfccc.int/sites/default/files/resource/NC3%20PARAGUAY.pdf
32 CEPAL (2014). The economics of climate change in Paraguay. URL: https://repositorio.cepal.org/bitstream/handle/11362/37101/1/S1420018_es.pdf
33 WBG Climate Change Knowledge Portal (CCKP, 2020). Climate Data-Projections. Paraguay. URL: https://climateknowledgeportal.worldbank.org/country/paraguay/climate-data-projections
34 Paraguay (2016). Plan Nacional de Gestion de Riésgo de Desastres: 2015–2025. URL: https://repositorio.gestiondelriesgo.gov.co/bitstream/handle/20.500.11762/756/PNGRD-2016.pdf?sequence=27&isAllowed=y
35 Ortigoza, J.G. (2019). Bases para la Estrategía Nacional de Sequía. URL: https://knowledge.unccd.int/sites/default/files/country_profile_documents/1%2520FINAL_NDP_Paraguay.pdf

12CLIMATE RISK COUNTRY PROFILE: PARAGUAY
of November and December, damaging agricultural output and threatening operations at the hydroelectric power
projects which generate domestic energy supplies. Climate related disasters comprise most of the emergencies
reported in the country and represent significant economic and human losses. The floods of the Paraguay River
that occurred in March of 2019, for example, damaged 347 schools, forced 19,500 families to evacuate, affected
another 69,534 families and killed 16 people.36
Paraguay’s Third National Communication (2017) prioritized five departments with respect to their vulnerability to
climate driven disasters when combined with local socio-economic conditions: Very High Vulnerability (Index >3.5),
Caazapá, and High Vulnerability, Concepción, Canindeyú, Caaguazú and Itapúa (Index 2.5–3.5).37
Data from the Emergency Event Database: EM-Dat,38 presented in Table 4, shows the country has endured various
natural hazards, including droughts, floods, extreme temperatures, storms and wildfires.
TABLE 4 . Natural Disasters in Paraguay, 1900–2020
Natural Hazard 1900–2020 Subtype
Events Count
Total Deaths Total Affected
Total Damage (’000 USD)
Drought Drought 9 16 1,791,290
Epidemic Viral Disease 9 97 244,326
Flood Riverine Flood 17 36 1,316,647 5,820
Extreme Temperature Cold Wave 3 20
Storm Convective Storm 7 7 147,980 27,000
Wildfire Forest Fire 2 8 125,000 30,000
Key TrendsAs the climate changes, weather related disasters are likely to continue, exacerbating existing vulnerabilities in
Paraguay. Rising temperatures and altered rainfall patterns, particularly more intense rainfall events will pose
a significant challenge for water resource management and likely affect all sectors of society, especially the
critical sectors of agriculture and livestock, as well as energy production. The most significant disasters for the
country include droughts, extreme heat and floods, primarily riverine along the Paraguay river, and the Bermejo and
Pilcomayo rivers in the Chaco. Urban flooding is also a problem and is a result of drainage systems overwhelmed
by intense rainfall events (Figure 10). In 2019, for example, heavy rainfall flooded the Distrito Capital in Asuncion
city, displacing at least 2,000 people.39 Studies suggest that climate change could increase the frequency of
occurrence and the intensity of these phenomena. As such, the country is working to understand, anticipate and
36 ECHO (2019). Floods- Emergency Response Coordination Centre (ERCC). ReliefWeb: Paraguay. URL: https://reliefweb.int/map/paraguay/paraguay-floods-emergency-response-coordination-centre-ercc-dg-echo-daily-map-17062019
37 Paraguay (2017). Tercera comunicación Nacional de la Republica de Paraguay. URL: https://unfccc.int/sites/default/files/resource/NC3%20PARAGUAY.pdf
38 EM-DAT: The Emergency Events Database - Universite catholique de Louvain (UCL) - CRED, D. Guha-Sapir, Brussels, Belgium. http://emdat.be/emdat_db/
39 ReliefWeb (2019). Paraguay Floods – March 2019. URL: https://reliefweb.int/disaster/fl-2019-000033-pry

13CLIMATE RISK COUNTRY PROFILE: PARAGUAY
take action to reduce their impacts. An increase in extreme rainfall events will likely continue to cause localized
flooding events. Coupled with the effects of the El Nino Southern Oscillation phenomenon, both the frequency of
floods and droughts will likely increase, increasing the risks for erosion and desertification.40
The areas most affected by the La Niña phenomenon (which generates shortages of rainfall and drought)
are those of the Central Chaco and the Pilcomayo River area, the districts of Irala Fernández and Mariscal
Estigarribia. In general, the western regions are the most affected by droughts. For example, during the
December 2010 to January and February 2011 quarter, the rainfall deficits in the northern Chaco brought about
significant droughts.41
Extreme heat, resulting in heat stress, will continue across Paraguay and combined with high humidity levels,
can affect the productivity of people and crop.42 As temperatures rise, these will likely (i) exacerbate existing
tensions for water between agricultural and livestock needs as well as human populations needs, especially
during the drier seasons; (ii) alter water quality from available surface sources; and (iii) increase pressures on
urban zones as urbanization rates grow. Soy farmers and livestock producers are particularly vulnerable to the
effects of climate change.
FIGURE 10 . Risk of Urban Flood (left),43 Risk of Extreme Heat (right)44
40 Ortigoza, J.G. (2019). Bases para la Estrategía Nacional de Sequía. URL: https://knowledge.unccd.int/sites/default/files/ country_profile_documents/1%2520FINAL_NDP_Paraguay.pdf
41 Ortigoza, J.G. (2019). Bases para la Estrategía Nacional de Sequía. URL: https://knowledge.unccd.int/sites/default/files/ country_profile_documents/1%2520FINAL_NDP_Paraguay.pdf
42 Paraguay (2016). Plan Nacional de Gestion de Riésgo de Desastres: 2015–2025. URL: https://repositorio.gestiondelriesgo.gov.co/bitstream/handle/20.500.11762/756/PNGRD-2016.pdf?sequence=27&isAllowed=y
43 ThinkHazard! (2020). Paraguay – Urban Flood. URL: https://thinkhazard.org/en/report/194-paraguay/UF44 ThinkHazard! (2020). Paraguay – Extreme Heat URL: https://thinkhazard.org/en/report/194-paraguay/EH

14CLIMATE RISK COUNTRY PROFILE: PARAGUAY
Implications for DRMAddressing these compounded risks will require a coordinated set of actions that begin with institutional strengthening
to improve emergency response capabilities in urban areas to floods.45 Additionally, local risk management with
sub-basin groups and communities needs to be promoted. Improved knowledge of the local risks and profiles
of vulnerability can help to identify critical hotspots for adaptation. Coordination, advocacy, and communication,
particularly for transboundary water management is required in order to build resilience and reduce risks. With
regards to the increased number and intensity of heat waves, measures should be taken to adapt building codes
and design and change working practices for outdoor workers to reflect the realities of the changing risk.46 The
stress of urban heat islands can be reduced with architectural practices that promote wind flows across the city
and green spaces. Identifying extreme heat and developing adequate forecasting systems can offer advance
warning for at risk populations, such as the elderly, pregnant women and children. These early warning systems
can be linked to trigger protocols (i.e. the deployment of heat health action plans and emergency response plans)
to mitigate the impacts of heat waves.
Paraguay is highly vulnerable to seasonal variability and long-term climate change. Increasing vulnerability
is expected to result in cumulative impacts across the country’s political, security, social, economic, and
environmental structures47. Heavy rainfall and floods, as well as droughts in particular will continue to have
significant consequences on the environment, society, food security, and the wider economy.48 Significant impacts are
expected for the country’s water resources, agriculture, health, and energy sectors. Extreme heat, flooding, increased
aridity, and soil erosion puts both urban and rural communities at risk, particularly for poor and vulnerable groups.
Environmental degradation, impacted water resources, and loss of biodiversity and ecosystem services constitute
serious obstacles to the country’s continued development and responsible management of its natural resources. In
addition, the increase in temperature will also have a negative impact on key parts of the economy, e.g. forestry,
agriculture and livestock.
Projected trends of climate variability and longer-term change are likely to exacerbate these concerns, as most
agricultural production is rainfed, and provides livelihoods for the majority of the population. Increased temperatures
and variable rainfall will also impact the country’s forests, also critical to livelihoods and ecosystem services, which
are already under threat from land use change and growing demand for land as the soy frontier extends. More
extreme weather events such as intense rainfall after prolonged dry spells can lead to erosion and flash flooding,
damage roads and infrastructure, wipe out crops and put additional lives at risk.49
CLIMATE CHANGE IMPACTS TO KEY SECTORS
45 Paraguay (2016). Plan Nacional de Gestion de Riésgo de Desastres: 2015–2025. URL: https://repositorio.gestiondelriesgo.gov.co/bitstream/handle/20.500.11762/756/PNGRD-2016.pdf?sequence=27&isAllowed=y
46 Paraguay (2016). Plan Nacional de Gestion de Riésgo de Desastres: 2015–2025. URL: https://repositorio.gestiondelriesgo.gov.co/bitstream/handle/20.500.11762/756/PNGRD-2016.pdf?sequence=27&isAllowed=y
47 Paraguay (2017). Tercera comunicación Nacional de la Republica de Paraguay. URL: https://unfccc.int/sites/default/files/resource/NC3%20PARAGUAY.pdf
48 FAO (2013). Paraguay Country Profile. URL: http://www.fao.org/3/a-bp554s.pdf49 FAO (2020). Analysis and Mapping of Impacts Under Climate Change for Adaptation and Food Security Project: Paraguay. URL:
http://www.fao.org/in-action/amicaf/en/
15CLIMATE RISK COUNTRY PROFILE: PARAGUAY
GenderAn increasing body of research has shown that climate-related disasters have impacted human populations in many
areas including agricultural production, food security, water management and public health. The level of impacts
and coping strategies of populations depends heavily on their socio-economic status, socio-cultural norms, access
to resources, poverty as well as gender. Research has also provided more evidence that the effects are not gender
neutral, as women and children are among the highest risk groups. Key factors that account for the differences
between women’s and men’s vulnerability to climate change risks include: gender-based differences in time use;
access to assets and credit, treatment by formal institutions, which can constrain women’s opportunities, limited
access to policy discussions and decision making, and a lack of sex-disaggregated data for policy change.50
Agriculture
OverviewAgriculture accounts for more than 10% of Paraguay’s GDP (2018),51 employs 27% of the country’s workforce
and constitutes 90% of registered exports.52,53 The majority (91%) of producers are small rural families
(1–50 hectares [ha]), focused on beans, manioc, sugarcane, maize, tobacco and sesame. Nevertheless, these
rural producers use only 6% of the total cultivated area in Paraguay. The other 94% of the cultivated areas in
Paraguay are dedicated to larger farming enterprises, which specialize in soy, primarily for the export market and
livestock production.54 Farming in Paraguay is mainly rainfed although in recent years this situation is changing.
Paraguay is among the world’s five largest soy producers, occupying over 80% of agricultural lands. In some cases,
corporate, owned soy farms have benefited from incentives, tax exemptions and greater access to credit, which
has contributed to exacerbating tensions between small rural food producing farms and large enterprises.55 The
soy producing sector continues to expand rapidly, doubling in the last decade. The expansion and success of soy
production in the country has benefited from the development of new soybean varieties as well as from the use of
herbcides and fertilizers.56,57
50 World Bank Group (2016). Gender Equality, Poverty Reduction, and Inclusive Growth. URL: http://documents1.worldbank.org/curated/en/820851467992505410/pdf/102114-REVISED-PUBLIC-WBG-Gender-Strategy.pdf
51 World Bank (2020). Open Data: DataBank- Paraguay: URL: https://databank.worldbank.org/views/reports/reportwidget.aspx?Report_Name=CountryProfile&Id=b450fd57&tbar=y&dd=y&inf=n&zm=n&country=PRY
52 FAO (2013). Paraguay Country Profile. URL: http://www.fao.org/3/a-bp554s.pdf53 FAO (2017). Socio-economic context and role of agriculture. URL: http://www.fao.org/3/a-i7752e.pdf54 FAO (2013). Paraguay – Marco de Programacion Conjunta. URL: http://www.fao.org/3/a-bp554s.pdf55 WWF (2016). Social, Economic and Environmental Analysis of Soybean and Meat Production in Paraguay. URL: http://
d2ouvy59p0dg6k.cloudfront.net/downloads/social__economic_and_environmental_analysis_of_soybean_and_meat_production_ in_paraguay_1.pdf
56 WWF (2016). Social, Economic and Environmental Analysis of Soybean and Meat Production in Paraguay. URL: http://d2ouvy59p0dg6k.cloudfront.net/downloads/social__economic_and_environmental_analysis_of_soybean_and_meat_production_ in_paraguay_1.pdf
57 WWF (2016). Social, Economic and Environmental Analysis of Soybean and Meat Production in Paraguay. URL: http://d2ouvy59p0dg6k.cloudfront.net/downloads/social__economic_and_environmental_analysis_of_soybean_and_meat_production_ in_paraguay_1.pdf

16CLIMATE RISK COUNTRY PROFILE: PARAGUAY
Livestock production in Paraguay is extensive and benefits from the natural pastures of the country’s landscape.
Recently, livestock production has expanded rapidly and significantly into the forested regions of the central and
northern Chaco. In the Chaco and southern regions of Missiones and Ñeembucú. While cattle raising is a historically
traditional activity with only 0.3 head per hectare, the sector has modernized substantially with significant increases
in stocking rates sue in part to implemented grasses, advances in animal husbandry and more intensive ranching
practices. The Paraguayan cattle herd totaled 13.8 million head in 2019, roughly 300,000 head more than the
previous year, albeit the first increase since 2014. The industry is heavily focused on beef production for export
to Chile, the Russian Federation, Taiwan and the European Union. Mennonite communities in the north western
regions provide nearly half of the country’s dairy products.58
Climate Change ImpactsThe agriculture and livestock sectors are among the most vulnerable in Paraguay due to their dependence on the
natural environment and because they constitute one of the main economic activities of the country. The impacts
on agricultural production arise from more extreme and more frequent rainfall events, and more frequent high
temperatures and heat waves. Soy yields, for example, are likely to decrease as temperatures rise.59 Furthermore,
it is likely that the negative impacts of climate change due to increased temperature, droughts and floods will offset
the potential gain in yield from increased CO2 in the atmosphere, resulting in an overall decrease in soy yields in
Paraguay. Extreme weather presents the largest risk factor for crop production, especially from droughts and
floods. Projections for precipitation show a significant increase in rainfall form June to August, particularly in the
northern, eastern and southern regions of the country. This is expected to impact agricultural regions, with heavy
rainfall and flooding expected to impacts to key crops such as soy, affecting domestic markets and potentially
forcing some farmers to need to source alternative food for livestock.60
A 2020 study conducted by the Food and Agriculture Organization of the United Nations revealed significant
heterogeneity in terms of the future impacts on crop yields at the department level due to climate change. In the
case of upland rice, significant reductions in yields are projected in the departments of Itapúa and Canindeyú.
Irrigated rice yields, on the other hand, are projected to increase in the departments of Cordillera and Misiones.
Sugar cane yield projections point to widespread decreases, especially in the departments of Amambay, Caazapá,
Caaguazú, Canindeyú and Concepcion Departments under a low emissions scenario (RCP4.5), while future yields
are projected to rise in the department of Paraguarí under high emissions scenario (the RCP8.5). Cassava yields are
projected to increase under both emissions scenarios in the Departments of Alto Paraguay, Amambay, Canindeyú,
Caazapá and Concepción, offering a view of a positive future for a crop central to small scale subsistence farming
communities. Other crops included in the study, namely corn and wheat, showed no significant differences between
historical and future modelled yields.61
58 USDA (2019). GAIN Report: Paraguay Beef. URL: https://apps.fas.usda.gov/newgainapi/api/report/downloadreportbyfilename?filename= Livestock%20and%20Products%20Annual_Buenos%20Aires_Paraguay_8-16-2019.pdf
59 Paraguay (2017). Tercera comunicación Nacional de la Republica de Paraguay. URL: https://unfccc.int/sites/default/files/resource/NC3%20PARAGUAY.pdf
60 FAO (2020). Analysis and Mapping of Impacts Under Climate Change for Adaptation and Food Security Project: Paraguay. URL: http://www.fao.org/in-action/amicaf/en/
61 WWF (2016). Social, Economic and Environmental Analysis of Soybean and Meat Production in Paraguay. URL: http://d2ouvy59p0dg6k.cloudfront.net/downloads/social__economic_and_environmental_analysis_of_soybean_and_meat_production_in_paraguay_1.pdf

17CLIMATE RISK COUNTRY PROFILE: PARAGUAY
The livestock industry, which occurs throughout the country but is concentrated in the western regions, is a
key employment source for the country’s population and accounts for approximately 6% of Paraguay’s GDP.
Droughts, frosts and high temperatures negatively affect productivity. For example, the National Service of
Health and Environmental Quality (SENACSA) determined that in the year 2013 high temperatures (even
as frosts continued to occur in other areas of the country) caused the loss of 5,216 cattle heads.62 Climate
variability can also negatively impact pasture management, which is dependent on summer rains. Additionally,
rising temperatures and more frequent heat waves can decrease carrying capacity (cattle per hectare) by
0.1361 units in the departments of Concepción, Caaguazú, Caazapá, Itapúa and Canindeyú. Rising temperatures,
particularly daily maximum temperatures, pose an increased risk of heat stress for livestock and could significantly
reduce critical crop yields for rural populations. Between 2005 and 2014, rising temperatures and heat
waves are attributed to have caused the loss of
0.1361 livestock per hectare in the departments
of Concepción, Caaguazú, Caazapá, Itapúa and
Canindeyú.63 Under present climate conditions,
heat stress already poses challenges for heat
dissipation in livestock populations, rendering them
vulnerable to heat stress during certain periods
of the year. Heat stress can reduce milk production
and reproduction, particularly for cattle. As heat
increases, so is the likelihood of altered growing
seasons. Figure 11 shows the projected change in
average daily maximum temperatures for Paraguay
across the seasonal cycle. What is clear is that higher
temperatures are expected throughout the year.
Adaptation OptionsAdaptation strategies in the agricultural systems of Paraguay, particularly the highly profitable soy, cotton and
sugarcane crops should be implemented to make productivity more resilient to both current and projected
changes in climate.65 The uncertainty associated with future climate is compounded by the fact that climate
change is occurring on top of significant existing interannual variability in climate. One approach is to pair a
package of locally relevant climate-smart agricultural practices with improved climate and weather information
for decision-making.66 This way, farmers can decide what will be the most effective adaptive strategy in a specific
year given their local context and constraints. The provision of climate and weather information to farmers and
other stakeholders within the value chain at decision-relevant timescales could safeguard agriculture and livestock
Jan Feb Mar Apr May Jun Jul Aug Sep Oct Nov Dec
10
9
8
7
6
5
4
3
2
1
0
degr
eesC
FIGURE 11 . Average daily max temperature for Paraguay64
62 Paraguay (2017). Tercera comunicación Nacional de la Republica de Paraguay. URL: https://unfccc.int/sites/default/files/resource/NC3%20PARAGUAY.pdf
63 Paraguay (2017). Tercera comunicación Nacional de la Republica de Paraguay. URL: https://unfccc.int/sites/default/files/resource/NC3%20PARAGUAY.pdf
64 WBG Climate Change Knowledge Portal (CCKP, 2020). Paraguay Agriculture. Dashboard URL: http://crme.rap.ucar.edu/CRMePortal/web/agriculture
65 Paraguay (2016). Contribuciones Nacionales de la Republia del Paraguay. URL: https://www4.unfccc.int/sites/ndcstaging/PublishedDocuments/Paraguay%20First/Documento%20INDC%20Paraguay%2001-10-15.pdf
66 FAO (2020). Analysis and Mapping of Impacts Under Climate Change for Adaptation and Food Security Project: Paraguay. URL: http://www.fao.org/in-action/amicaf/en/

18CLIMATE RISK COUNTRY PROFILE: PARAGUAY
productivity.67 To strengthen the country’s capacity to adapt to climate change, investments should be focused on
data collection, capacity development, national programming, and comprehensive research. Strategies include:
dedicating necessary resources among the different ministries and institutions to update the basic data collection
in the field and collect new data; building capacity and ensure the resources to strengthen the institutional and
technical competences in terms of water management; strengthening national programs and plans such as National
Plan for the Disaster Risk Management68 to support small-scale family agriculture and rural extension offices;
building synergies among universities, research centers and government organizations in order to implement lines
of research that could include all dimensions of food security and promote adaptation to local conditions and
climate change.69
Water
OverviewParaguay’s extensive hydrographic network dominated by the Paraguay and Parana rivers makes the country
technically water rich. Both surface waters and water extraction, especially from the Patiño aquifer are used,
particularly across the major cities of Asunción, Fernando de la Mora, San Lorenzo, Capiatá, Itauguá, Ypacaraí,
Limpio, Luque, Villa Elisa, Ñemby, San Antonio, Ypané and Guarambaré. Nevertheless, reliance on the Patiño
aquifer is challenging, as an estimated 50% of the recharge is contaminated. Wells are used extensively across the
country for water provision. Nevertheless, surface waters remain the predominant source for the country and their
critical source springs, wetlands and associated territories face continual pressures from inadequate resource
management including deforestation, increased sedimentation and contamination from agrochemicals.70,71 Water
availability and quality is important both for human consumption and for agricultural use. Currently, over 75% of
the Paraguayan population has access to piped water, while only 15% has access to sanitation. Despite abundant
water resources, access to potable water varies significantly. For example, in the departments of Concepción,
Caaguazú, Caazapá, Itapúa, and Canindeyú, 475,345 people have access to improved drinking water, representing
approximately 29% of the population of these departments. There are also differences on access to water
services between urban (87%) and rural areas (58%). In the hot and dry Chaco region, surface water sources
are limited during the dry periods and underground resources are often saline. Rainwater harvesting is common,
though rainfall amounts of approximately 400 mm per year, it is insufficient to meet demands. The competing
demands of water for human consumption, livestock rearing, and agriculture pose a significant challenge for water
resources management across Paraguay, but especially in the Chaco, in spite of the new aqueduct system that
was recently built.72
67 Paraguay (2017). Tercera comunicación Nacional de la Republica de Paraguay. URL: https://unfccc.int/sites/default/files/resource/NC3%20PARAGUAY.pdf
68 Paraguay (2018). Plan Nacional de Gestion y Reducción de Riesgos (2018). URL: https://www.sen.gov.py/application/files/8015/9188/4586/Politica_Nacional_de_Gestion_y_Reduccion_de_Riesgos__2018.pdf
69 FAO (2020). Analysis and Mapping of Impacts Under Climate Change for Adaptation and Food Security Project: Paraguay. URL: http://www.fao.org/in-action/amicaf/en/
70 Secretaría Técnica de Planificación - Dirección General de Estadística, Encuestas y Censos (DGEEC) (2012). URL: https://www.dgeec.gov.py/
71 Paraguay (2017). Tercera comunicación Nacional de la Republica de Paraguay. URL: https://unfccc.int/sites/default/files/resource/NC3%20PARAGUAY.pdf
72 Género y agua: la experiencia de l inclusión del enfoque de género en los proyectos de agua potable y saneamiento en Paraguay (2020). Documento para Discución Nro IDB-00756. URL: https://publications.iadb.org/publications/spanish/document/G%C3%A9nero_y_agua_La_experiencia_de_la_inclusi%C3%B3n_del_enfoque_de_g%C3%A9nero_en_los_proyectos_de_agua_potable_y_saneamiento_en_Paraguay.pdf

19CLIMATE RISK COUNTRY PROFILE: PARAGUAY
Climate Change ImpactsAltered rainfall patterns will inevitably impact water resource availability across Paraguay. Although projected
increases in rainfall will likely increase river flows. Nevertheless, the potential gains from these rising flows are likely
to be offset significantly by the loss of forests, increased siltation, and pollution, particularly from agrochemicals.
Flows of the Paraná and Paraguay rivers will be altered as temperatures rise as well as changes in run off from
critical source streams.73 A compounding challenge is that 90% of the Parana’s basin is in Brazilian territory,
subject to changes in land use practices outside of the country. Nevertheless, the future of water resources in the
country under a changing climate remains uncertain, except for in Paraguay’s northern and central Chaco regions,
where flows are projected to reduce significantly by a combined change in rainfall and rising temperatures. Floods,
particularly in areas with limited sanitation, can pollute water courses, carrying away human waste and exposing
the population to disease transmitting vectors and water borne illnesses such as diarrhea.74 Paraguay has worked
to improve sanitation services and access, however while 80% of populations in urban areas are served by network
water connections, only 15% of urban residents have access to network sewage connections as of 2019. In
contrast, just 44% of rural populations have access to network water connections and with extremely limited basic
sanitation services available for rural communities.75
In general, the Western Region, with ephemeral water resources, is the most affected by droughts brought about
by the La Niña phenomenon (which brings drought conditions). This includes the Central Chaco and the Pilcomayo
River area, the districts of Irala Fernández and Mariscal Estigarribia. During the December 2010 - January and
February 2011 quarter, the center and north of the Chaco were influenced by rainfall deficits from La Niña.76 The
country is currently undergoing a severe drought, which is projected to continue through at least February 2021.
Water deficits for the Paraguay River as especially dire, impacting river activities and water usage in Paraguay as
well as neighbors which also rely on the river’s resources. Deficits are most pronounced in central and eastern
Paraguay as well as into much of norther Argentina.77
Paraguay’s Third National Communication established a water scarcity index that incorporated population as well
as livestock and agriculture needs, as well as those of industry, and identifies the most vulnerable departments
across all emissions scenarios for the near future (2021–2030) to be: Alto Paraguay, and Boquerón, while the
Departments of Presidente Hayes, Ñeembucú, Concepción in addition to Alto Paraguay will face increasing water
scarcity through the 2050s.78 Likewise, a basin analysis pointed to the Rio Apa basin is likely to be most affected by
projected changes in rainfall and temperatures.79
73 Paraguay (2018). Plan Nacional de Gestion y Reducción de Riesgos (2018). URL: https://www.sen.gov.py/application/files/8015/ 9188/4586/Politica_Nacional_de_Gestion_y_Reduccion_de_Riesgos__2018.pdf
74 Paraguay (2017). Tercera comunicación Nacional de la Republica de Paraguay. URL: https://unfccc.int/sites/default/files/resource/NC3%20PARAGUAY.pdf
75 World Bank (2019). Addressing Challenges in Water, Road and Energy Infrastructure in Paraguay – Results Briefs. [October 16, 2019]. URL: https://www.worldbank.org/en/results/2019/10/16/addressing-challenges-in-water-road-and-energy-infrastructure-in-paraguay76 Pezzoli, P.E. (2016). Vulnerability and resilience to drought in the Chaco, Paraguay. URL: https://iris.polito.it/retrieve/
handle/11583/2654744/129731/Chapter%204_published_20161031.pdf77 iSciences (2020). South America: Intense water deficits on the Paraguay River. [June 19, 2020]. URL: https://www.isciences.com/
blog/2020/06/15/south-america-intense-water-deficits-on-the-paraguay-river78 Paraguay (2017). Tercera comunicación Nacional de la Republica de Paraguay. URL: https://unfccc.int/sites/default/files/resource/
NC3%20PARAGUAY.pdf79 Paraguay (2017). Tercera comunicación Nacional de la Republica de Paraguay. URL: https://unfccc.int/sites/default/files/resource/
NC3%20PARAGUAY.pdf

20CLIMATE RISK COUNTRY PROFILE: PARAGUAY
Figure 12 shows the projected annual Standardized
Precipitation Evapotranspiration Index (SPEI),
an index which represents the measure of the
given water deficit in a specific location, account-
ing for contributions of temperature-dependent
evapotranspiration and providing insight into
increasing or decreasing pressure on water resources.
Negative values for SPEI represent dry conditions,
with values below –2 indicating severe drought
conditions, likewise positive values indicate increased
wet conditions. This is an important understanding for
the water sector in regards to quantity and quality of
supply for human consumption and agriculture use as
well as for the energy sector as reductions in water
availability impacts river flow and the hydropower
generating capabilities.
Adaptation OptionsEven though the potential impacts of climate change on water resources for Paraguay will likely be limited, the
multiple pressures on the resource from increased deforestation, poor territorial planning as well as livestock and
agricultural expansion, already places significant pressures on the quality and quantity of the available resources.
Paraguay is committed to increase water resource assess and promote the safeguard access to water for human
consumption and production. To guarantee the access, quality and sustainable management of water resources.
Increased sediment loads, contamination and inadequate protection of critical streams and wetlands is rampant,
already compromising water quality and limits flows during the dry season. Additionally, the basin of the Pilcomayo
river suffers from significant variability, as the river meanders in a braided network between Argentine and
Paraguayan territories, bring either floods or droughts with its flows, all subject to more variable rainfall patterns.81
International cooperation and water allocation planning can safeguard the available resources for all populations.
Protection or reforestation of riparian habitats can reduce soil erosion and sediment loads. When combined with
integrated basin management planning, the population and land use pressures can be managed so as to improve
water quality and availability. Paraguay continues to be committed to improving sanitation infrastructure and clean
water access. The Water and Sanitation Sector Modernization Project has so far rehabilitated 57 km of water
distribution networks and 8.4 km of sanitation networks in Great Asuncion.82 National efforts are also focused on
the decentralization of the National Environmental Sanitation Services and have developed actions plans to support
Water and Sanitation Units in the municipalities in Chaco in support of long-term technical, institutional and financial
support to communities.83
80 WBG Climate Change Knowledge Portal (CCKP, 2020). Paraguay Agriculture Sector Dashboard. URL: https://climatedata.worldbank.org/CRMePortal/web/agriculture/crops-and-land-management?country=PAR&period=2080-2099
81 Paraguay (2016). Contribuciones Nacionales de la Republica del Paraguay. URL: https://www4.unfccc.int/sites/ndcstaging/PublishedDocuments/Paraguay%20First/Documento%20INDC%20Paraguay%2001-10-15.pdf
82 World Bank (2020). Drawing the Roadmap for Universal Sustainable Water and Sanitation in Paraguay – Results Brief. [March 9, 2020]. URL: https://www.worldbank.org/en/results/2020/05/05/drawing-the-roadmap-for-universal-sustainable-water-and-sanitation-in-paraguay
83 World Bank (2019). Addressing Challenges in Water, Road and Energy Infrastructure in Paraguay – Results Briefs. [October 16, 2019]. URL: https://www.worldbank.org/en/results/2019/10/16/addressing-challenges-in-water-road-and-energy-infrastructure-in-paraguay
Historical RCP 2.6 RCP 4.5 RCP 6.0 RCP 8.5
2.0
1.5
1.0
0.5
0
–0.5
–1.0
–1.5
–2.0
–2.5
–3.0
unitl
ess
FIGURE 12 . Annual SPEI Drought Index in Paraguay for the period, 1986 to 209980

21CLIMATE RISK COUNTRY PROFILE: PARAGUAY
Energy
OverviewParaguay’s energy sector is exclusively water-powered, which could exacerbate the vulnerability of the country to
reduced flows.84 The large Itaipú dam, which Paraguay shares with Brazil, accounts for over 90% of the country’s
electrical supply. Surplus electricity is sold to Brazil and Argentina and contribute significantly (∼7%) of GDP. According
to the Latin American Energy Organization (OLADE) Paraguay is the only country in Latin America whose energy
consumption is entirely based on renewable energies.85 Paraguay is a net exporter of hydropower and a net importer
of hydrocarbons for transport and industry. National demand is met through three hydroelectric plants: Central Acaray
(property of Paraguay), Yacyretá (shared with Argentina) and, mainly, Itaipú (shared with Brazil). Energy distribution
and transmission is managed by the National Electricity Agency (ANDE). Itaipu is a world leader in the production
of clean and renewable energy; producing more than 2.3 thousand million megawatts (MW) since the beginning of
its operation, in 1984. With 20 generating units and 14,000 MW of the installed power, provides about 15% of the
energy consumed in Brazil and 75% of that used in Paraguay. Nevertheless, with a limited distribution network, at local
scales, energy consumption is dominated by traditional biomass: carbon or wood (50%) hydrocarbons (36%) and
electricity (14%).86 In urban areas with electrical service, quality, as measured by service interruptions, is good, although
losses in transmission and leaks in the distribution system are a concern. Nevertheless, given the high reliance on
hydro power, the droughts brought by phenomena such as La Niña could affect the country’s energy sustainability.
Paraguay’s National Development Plan (2014–2030),87 aims to diversify the country’s energy resources and ensure
a reliable energy supply by diversifying the energy mix to biomass, wind, and solar photovoltaic energy generation. In
2018, Paraguay received a USD$125 million loan from the Inter-American Development Bank to modernize Acaray,
one of its largest hydropower plants, however investments in smaller scale, alternative renewable energies has been
limted. While the country has looked to diversifying its mix of renewable energy generation, investment regulations and
legislation has hindered widespread investment and uptake. The 2040 Energy Policy was developed to help guide the
further energy development in line with the country’s social and economic development efforts.88
Climate Change ImpactsAltered rainfall patterns will inevitably impact water resource availability across Paraguay. Gradual alterations in
precipitation patterns, especially lower average precipitation will also affect the resource base of hydropower by
leading to declining runoff and reduced river flows, which in turn affect the volume and timing of water availability. For
example, the 2014 droughts and the reduced flows on the Parana river, linked to a La Niña episode reduced output of
Itaipú dam by 8.7%.89 Additionally, higher temperatures, through evaporation, can significantly reduce water available
from reservoirs. Additionally, floods resulting from heavy rains can damage critical energy infrastructure. Runoff levels
84 Secretaría del Ambiente Dirección Nacional de Cambio Climático (2018). Guía para la Elaboración de Planes Sectoriales de Adaptación Ante el Cambio Climático, Paraguay. URL: http://dncc.mades.gov.py/wp-content/uploads/2018/08/Gu%C3%ADa-para-planes-sectoriales-de-adaptaci%C3%B3n-al-cambio-clim%C3%A1tico.pdf
85 OLADE (2018). Panorama Energético de America Latina y El Caribe (2019). URL: http://biblioteca.olade.org/opac-tmpl/Documentos/old0434b.pdf
86 IHA (2019). HYDROPOWER: Paraguay. URL: https://www.hydropower.org/country-profiles/paraguay87 Paraguay (2014). Plan Nacional de Desarollo 2030. URL: https://www.stp.gov.py/pnd/wp-content/uploads/2014/12/pnd2030.pdf88 IHA (2019). 2019 Hydropower Status Report – Paraguay. URL: https://www.hydropower.org/sites/default/files/publications-
docs/2020_hydropower_status_report.pdf89 Paraguay (2018). Plan Nacional de Gestion y Reducción de Riesgos (2018). URL: https://www.sen.gov.py/application/
files/8015/9188/4586/Politica_Nacional_de_Gestion_y_Reduccion_de_Riesgos__2018.pdf

22CLIMATE RISK COUNTRY PROFILE: PARAGUAY
are expected to rise in many parts of the country, negatively impacting energy infrastructure along riparian areas via
floods and landslides, and the increasing the occurrence of natural disasters such as droughts.90
Vulnerability analyses conducted in Paraguay’s Third National Communication combined three indicators to estimate
the level of vulnerability at the departmental level to climate induced risks: 1) percentage of road infrastructure 2)
efficiency of the population’s agriculture, livestock and tourism infrastructure living on the banks of rivers, 2) availability
of water. Nevertheless, only in the 2014 droughts did power generation suffer significantly from reduced flows.91
Cooling Degree Days show the relationship between daily heat and cooling demand, typically sourced through a form
of active cooling or an evaporative process. The change in cooling degree days provides insight into the potential for
extended seasons of power demand or periods in which cooling demand (power demands) will increase. As seen in
Figure 13, seasonal increases for cooling demands are expected to increase throughout the year. The Warm Spell
Duration Index represents the number of days in a sequence of at least six days in which the daily maximum temperature
is greater than the 90th percentile of daily maximum temperature. As shown in Figure 14, warm spells are expected to
sharply increase in the second half of the century.
90 IHA (2019). HYDROPOWER: Paraguay. URL: https://www.hydropower.org/country-profiles/paraguay91 Paraguay (2014). Plan Nacional de Desarollo 2030. URL: https://www.stp.gov.py/pnd/wp-content/uploads/2014/12/pnd2030.pdf92 WBG Climate Change Knowledge Portal (CCKP, 2020). Paraguay – Energy. URL: https://climateknowledgeportal.worldbank.org/
country/Paraguay/climate-sector-energy93 WBG Climate Change Knowledge Portal (CCKP, 2020). Paraguay Energy Sector Dashboard. URL: https://climatedata.worldbank.
org/CRMePortal/web/energy/oil-gas-and-coal-mining?country=PAR&period=2080-209994 Paraguay (2014). Plan Nacional de Desarollo 2030. URL: https://www.stp.gov.py/pnd/wp-content/uploads/2014/12/pnd2030.pdf
Month
Tem
pera
ture
–100°C
0°C
100°C
200°C
300°C
400°C
Jan Feb Mar Apr May Jun Jul Aug Sep Oct Nov Dec
Ensemble Median and Range
FIGURE 13 . Change in cooling degree days (65°F) in Paraguay for the period 2040–205992
1980 2000 2020 2040 2060 2080 2100
days
Historical RCP 2.6 RCP 4.5 RCP 6.0 RCP 8.5Year
140
120
100
80
60
40
20
0
–20
FIGURE 14 . Warm Spell Duration Index in Paraguay for the period 1986 to 209993
Adaptation OptionsAdaptation options for the energy sector should focus on improved water resource management under changing
conditions. Additional investments may need to be made in building more storage capacity, improving turbine
efficiencies or other engineering measures to reduce transmission losses.94 Integrated water use management
will be required as competing demands for water beginning to come into play through increased demand for water

23CLIMATE RISK COUNTRY PROFILE: PARAGUAY
for other uses such as irrigation and urban demands. Paraguay has committed to incorporate climate change
management into public and private decisions to advance in a climate-resilient and low-carbon development path
that reduces the risks of climate change and allows opportunities to be seized.95 Adaptation options emphasized
with respect to the energy sector include the promotion of integrated water resources management, including
educating the public on the impacts of climate change on energy supplies and implementing behavioral techniques
to increase energy use efficiency in tandem with water conservation. Small hydroelectric plants could provide
alternative power supply to sites away from load centers and increase electricity use in rural households, however,
studies need to be conducted to determine the hydraulic potential of Paraguay’s inland rivers.96
Health
OverviewThe human health sector is considered one of the most vulnerable to climate variability and change in Paraguay.97
While Paraguay is a middle-income country, it still faces one of the highest inequality rates in the world, making the
health of the country’s population vulnerable to climate change impacts. The climate change projections point to
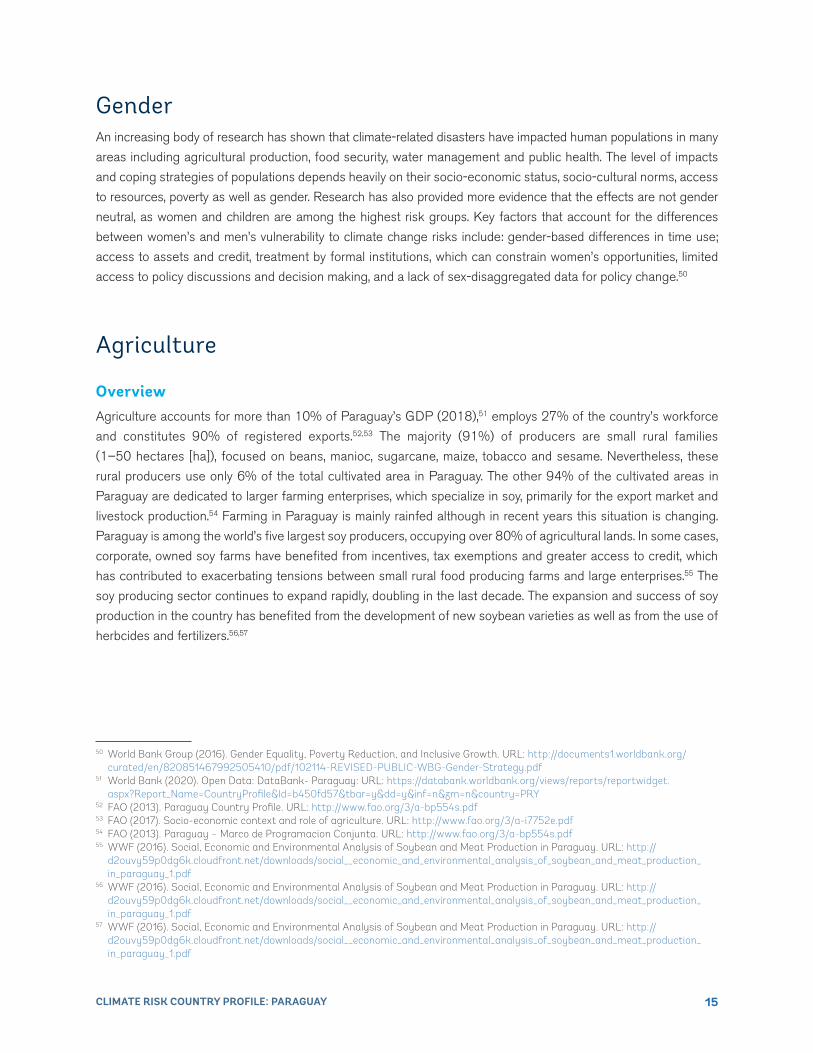
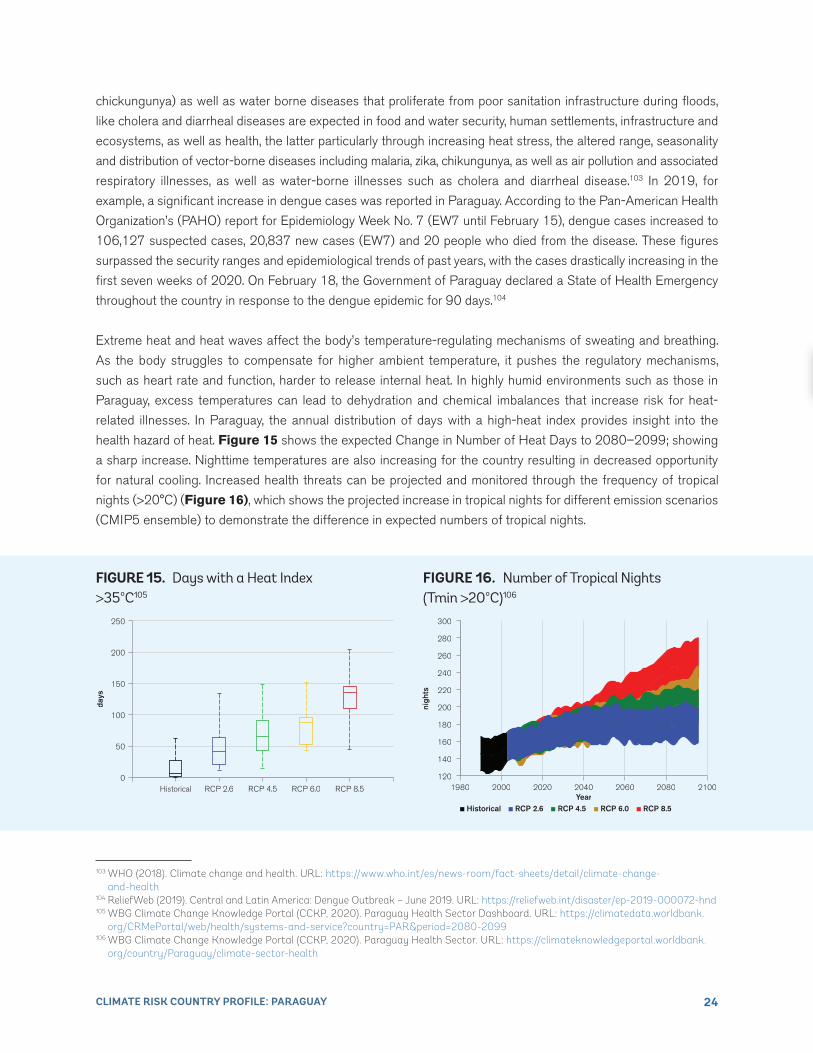
continued rising temperatures, more frequent intense rainfall events and other extreme weather events. Impacts
are expected for food and water security, water quality human settlements, infrastructure and ecosystems, as well
as health, the latter particularly through increasing heat stress, the altered range, seasonality and distribution of
vector-borne diseases including malaria, zika, chikungunya, as well as water-borne illnesses such as cholera and
diarrheal disease.98 Poor environmental practices such as inadequate waste management and cultural practices
the expansion of dengue fever across the country.99 The same is true for other vector borne illnesses transmitted by
the Aedis Aegypti mosquito such as zika and chikungunya.100 Further, acute heat stress is already a growing cause of
stress for vulnerable populations, especially the elderly and pregnant women and children. Ambient air pollution in the
country, caused by wildfires during dry seasons, burning due to land clearing, commercial industries, as well as indoor
air pollution from biomass burning for cooking in rural areas,101 significantly affects the health of infants and children.102
Climate Change ImpactsClimate change projections point to continued rising temperatures, more variable rainfall, rising seas and more
frequent extreme weather events. Impacts from climate variability and change affecting the health sector include
changes to food and water security, heat stress, the altered range and distribution of vector borne illnesses (i.e. zika,
95 Paraguay (2016). Contribuciones Nacionales de la Republia del Paraguay. URL: https://www4.unfccc.int/sites/ndcstaging/PublishedDocuments/Paraguay%20First/Documento%20INDC%20Paraguay%2001-10-15.pdf
96 Paraguay (2016). Paraguay Plan Nacional de Adaptación al Cambio Climático (PNACCC) URL: https://www4.unfccc.int/sites/NAPC/Documents/Parties/Plan%20Nacional%20de%20Adaptaci%C3%B3n%20al%20Cambio%20Clim%C3%A1tico_Paraguay_final.pdf
97 Paraguay (2017). Tercera comunicación Nacional de la Republica de Paraguay. URL: https://unfccc.int/sites/default/files/resource/NC3%20PARAGUAY.pdf
98 WHO (2018). Climate change and health. URL: https://www.who.int/es/news-room/fact-sheets/detail/climate-change-and-health99 ReliefWeb (2020). Paraguay Dengue outbreak, DREF operation. URL: https://reliefweb.int/report/paraguay/paraguay-dengue-
outbreak-dref-operation-n-mdrpy021-update-n-1100 IAMAT (2020). Paraguay Health Risks. URL: https://www.iamat.org/country/paraguay/risk/dengue101 PAHO (2016). Household Air Pollution – Paraguay Country Profile. URL: https://www.paho.org/en/documents/household-air-
pollution-paraguay-country-profile102 Climate & Clear Air Coalition (2020). CCAC Activities – Paraguay. URL: https://www.ccacoalition.org/en/partners/paraguay
24CLIMATE RISK COUNTRY PROFILE: PARAGUAY
chickungunya) as well as water borne diseases that proliferate from poor sanitation infrastructure during floods,
like cholera and diarrheal diseases are expected in food and water security, human settlements, infrastructure and
ecosystems, as well as health, the latter particularly through increasing heat stress, the altered range, seasonality
and distribution of vector-borne diseases including malaria, zika, chikungunya, as well as air pollution and associated
respiratory illnesses, as well as water-borne illnesses such as cholera and diarrheal disease.103 In 2019, for
example, a significant increase in dengue cases was reported in Paraguay. According to the Pan-American Health
Organization’s (PAHO) report for Epidemiology Week No. 7 (EW7 until February 15), dengue cases increased to
106,127 suspected cases, 20,837 new cases (EW7) and 20 people who died from the disease. These figures
surpassed the security ranges and epidemiological trends of past years, with the cases drastically increasing in the
first seven weeks of 2020. On February 18, the Government of Paraguay declared a State of Health Emergency
throughout the country in response to the dengue epidemic for 90 days.104
Extreme heat and heat waves affect the body’s temperature-regulating mechanisms of sweating and breathing.
As the body struggles to compensate for higher ambient temperature, it pushes the regulatory mechanisms,
such as heart rate and function, harder to release internal heat. In highly humid environments such as those in
Paraguay, excess temperatures can lead to dehydration and chemical imbalances that increase risk for heat-
related illnesses. In Paraguay, the annual distribution of days with a high-heat index provides insight into the
health hazard of heat. Figure 15 shows the expected Change in Number of Heat Days to 2080–2099; showing
a sharp increase. Nighttime temperatures are also increasing for the country resulting in decreased opportunity
for natural cooling. Increased health threats can be projected and monitored through the frequency of tropical
nights (>20°C) (Figure 16), which shows the projected increase in tropical nights for different emission scenarios
(CMIP5 ensemble) to demonstrate the difference in expected numbers of tropical nights.
103 WHO (2018). Climate change and health. URL: https://www.who.int/es/news-room/fact-sheets/detail/climate-change- and-health
104 ReliefWeb (2019). Central and Latin America: Dengue Outbreak – June 2019. URL: https://reliefweb.int/disaster/ep-2019-000072-hnd105 WBG Climate Change Knowledge Portal (CCKP, 2020). Paraguay Health Sector Dashboard. URL: https://climatedata.worldbank.
org/CRMePortal/web/health/systems-and-service?country=PAR&period=2080-2099106 WBG Climate Change Knowledge Portal (CCKP, 2020). Paraguay Health Sector. URL: https://climateknowledgeportal.worldbank.
org/country/Paraguay/climate-sector-health
Historical RCP 2.6 RCP 4.5 RCP 6.0 RCP 8.5
days
250
200
150
100
50
0
FIGURE 15 . Days with a Heat Index >35°C105
1980 2000 2020 2040 2060 2080 2100
nigh
ts
Historical RCP 2.6 RCP 4.5 RCP 6.0 RCP 8.5Year
300
280
260
240
220
200
180
160
140
120
FIGURE 16 . Number of Tropical Nights (Tmin >20°C)106

25CLIMATE RISK COUNTRY PROFILE: PARAGUAY
Adaptation OptionsAdaptation measures and actions in the health sector include: strengthening institutional capacities to address
climate sensitive health outcomes at national and local levels; promoting research on the relationship between key
diseases and climate variability and change; improving the health information system (epidemiological surveillance)
and response plans for the prevention, control and treatment of climate sensitive diseases; investing in improved
basic sanitation (drinking water, effluent treatment, waste collection); building additional infrastructure and capacity
in health systems access; and developing early warning systems for climate sensitive illnesses.107 The magnitude
of the challenges with heat-related mortality will increase in a warming climate. This elevates the importance of
investing in heat wave early warning and response systems and in other interventions (e.g., green space to reduce
UHIs) to protect human health, which Paraguay currently does not have established.108
Institutional Framework for AdaptationParaguay’s National Climate Change Policy (2018) outlines the framework for adaptation and mitigation activities
in the country.109 The country’s National System of the Environment (Sistema Nacional del Ambiente – SISAM) and
the Environmental Secretary (Secretaría del Ambiente – SEAM) coordinate the national climate change response.
SISAM includes several departmental and municipal entities that are tasked with addressing environmental issues
in Paraguay and has a special role in coordinating so as to avoid overlap and inter-institutional conflicts. The
National Climate Change Program (PNCC in Spanish), led by the Environment Secretary, coordinates actions on
the ground through: The National Commission on Climate Change (CNCC), an interinstitutional working group and
the National Office of Climate Change (Oficina Nacional de Cambio Climático – ONCC).110
Policy Framework for AdaptationParaguay’s National Development Plan (PND) was designed to respond to the economic and social challenges
of the country for the period 2014–2030.111 The National Development Plan is organized around three pillars
(i) poverty reduction and social development; (ii) inclusive economic growth; and (iii) promoting international
ADAPTATION
107 Paraguay (2016). Contribuciones Nacionales de la Republia del Paraguay. URL: https://www4.unfccc.int/sites/ndcstaging/PublishedDocuments/Paraguay%20First/Documento%20INDC%20Paraguay%2001-10-15.pdf
108 Secretaría del Ambiente Dirección Nacional de Cambio Climático (2018). Guía para la Elaboración de Planes Sectoriales de Adaptación Ante el Cambio Climático, Paraguay. URL: http://dncc.mades.gov.py/wp-content/uploads/2018/08/Gu%C3%ADa-para-planes-sectoriales-de-adaptaci%C3%B3n-al-cambio-clim%C3%A1tico.pdf
109 Paraguay (2018). Política Nacional de Cambio Climático de Paraguay. URL: https://www.undp.org/content/dam/paraguay/docs/Politica%20Nacional%20CC.pdf
110 Paraguay (2016). Paraguay Plan Nacional de Adaptación al Cambio Climático (PNACCC) URL: https://www4.unfccc.int/sites/NAPC/Documents/Parties/Plan%20Nacional%20de%20Adaptaci%C3%B3n%20al%20Cambio%20Clim%C3%A1tico_Paraguay_final.pdf
111 DNCC (2018). Políticas Públicas de Cambio Climático. URL: http://dncc.mades.gov.py/politicas-publicas-de-cambio-climatico

26CLIMATE RISK COUNTRY PROFILE: PARAGUAY
112 Paraguay (2017). Tercera comunicación Nacional de la Republica de Paraguay. URL: https://unfccc.int/sites/default/files/resource/NC3%20PARAGUAY.pdf
113 Paraguay (2016). Paraguay Plan Nacional de Adaptación al Cambio Climático (PNACCC) URL: https://www4.unfccc.int/sites/NAPC/Documents/Parties/Plan%20Nacional%20de%20Adaptaci%C3%B3n%20al%20Cambio%20Clim%C3%A1tico_Paraguay_final.pdf
114 Paraguay (2018). Política Nacional de Cambio Climático de Paraguay. URL: https://www.undp.org/content/dam/paraguay/docs/Politica%20Nacional%20CC.pdf
115 Green Climate Fund (2020). Paraguay - Projects and Programs. URL: https://www.greenclimate.fund/countries/paraguay116 Paraguay (2017). Tercera comunicación Nacional de la Republica de Paraguay. URL: https://unfccc.int/sites/default/files/resource/
NC3%20PARAGUAY.pdf
markets. It is also supported by a medium-term economic plan that provides for sustainable fiscal policies and
promotes more effective social protection policies. Paraguay’s national frameworks and plans regarding climate
change reflects a desire to reduce the adverse effects of climate variability and change.112
Paraguay submitted its Third National Communication to the UNFCCC in 2018 and its Nationally Determined
Contributions in 2016. Paraguay is committed to integrating climate change into its development plans and
strategies, strategies outlined in the country’s National Climate Change Adaptation Plan of 2018.113 To reach
its adaptation goals, Paraguay envisages a holistic approach, integrating adjustment of national policies and
strategies, improvement of the legislative and regulatory frameworks, and capacity development in certain priority
areas. Continued adaptation efforts are focused on its most vulnerable sectors, agricultural and livestock, energy,
water and health, and on increasing the country’s resilience capabilities, and strengthen the country’s social and
economic structures against vulnerability.114 Paraguay has also undertaken several projects, funded through the
Green Climate Fund, focused on climate change adaptation and mitigation efforts throughout the country.115
National Frameworks and Plans
• Third National Communication (2017) (Spanish)
• Nationally Determined Contributions (2016) (Spanish)
• National Adaptation Plan (2016) (Spanish)
• National Development Plan 2030 (2014) (Spanish)
• National Environmental Policy (2018) (Spanish)
• National Climate Change Policy (2012) (Spanish)
• National Plan for Disaster Management (2015–2025) (2016) (Spanish)
Recommendations
Research Gaps• Support research initiatives focused on the impacts of climate variability and change on water resources and
their interdependencies at the regional scales116
• Perform a sectoral energy and water demand analysis to use as the basis for determining actions to build
improvements in water and energy distribution systems
• Carry out economic-environmental feasibility studies to promote the use of clean energy in industries

27CLIMATE RISK COUNTRY PROFILE: PARAGUAY
Data and Information Gaps• Document and disseminate successful experiences in water management and rainwater harvesting in the
western regions
• Establish an open access, shared agro-hydrometeorological monitoring network coordinated, in critical river
basins
• Develop hotspot maps with information on critical vulnerabilities and ecological conditions in support of
territorial zoning
• Conduct research into adaptation options that could be implemented in priority sectors including their cost-
benefit ratios. Promote and facilitate research and analysis of technological measures and applicable solutions
to adapt to the effects of climate change, particularly those addressing food security issues
• Promote the effective inclusion of the issues of climate change across all educational levels
• Establish a centralized information system to provide historical, current and future climate information for
stakeholders to use as the basis for planning117
Institutional Gaps• Establish and enforce resources regulations, particularly regarding the protection of water courses and
groundwater resources
• Build the capacity of the national emergency management service to address changing risk profiles due to
climate variability and change
• Improve compliance with existing ordinances and/or create the necessary land management plans (zones
of floods, swamps and riverine areas of the country, including the Central Department, Ñeembucú, Itapúa,
Conception)
• Strengthen the institutional capacities of the parties that make up the National Commission of Climate Change,
with emphasis on planning, execution and implementation and monitoring capacities. This is especially
important at the National Office of Climate Change
• Promote partnerships and synergies between linked institutions and sectors in an effort to secure climate
finance for the implementation of the National Climate Policy
• Develop and implement a communication strategy internal and external of the Programme National Climate
Change Program to strengthen the interaction of the member institutions and enhance the program’s link with
civil society118
117 Paraguay (2018). Política Nacional de Cambio Climático de Paraguay. URL: https://www.undp.org/content/dam/paraguay/docs/Politica%20Nacional%20CC.pdf
118 Paraguay (2016). Contribuciones Nacionales de la Republia del Paraguay. URL: https://www4.unfccc.int/sites/ndcstaging/PublishedDocuments/Paraguay%20First/Documento%20INDC%20Paraguay%2001-10-15.pdf


