158
The Portland Group PGDBG ® Debugger Guide Parallel Debugging for Scientists and Engineers Release 2012
The Portland Group
PGDBG® Debugger Guide Parallel Debugging for Scientists and Engineers
Release 2012
While every precaution has been taken in the preparation of this document, The Portland Group® (PGI®), a wholly-owned subsidiary of STMicroelectronics, Inc., makes no
warranty for the use of its products and assumes no responsibility for any errors that may appear, or for damages resulting from the use of the information contained herein.
The Portland Group retains the right to make changes to this information at any time, without notice. The software described in this document is distributed under license from
STMicroelectronics and/or The Portland Group and may be used or copied only in accordance with the terms of the license agreement ("EULA").
PGI Workstation, PGI Server, PGI Accelerator, PGF95, PGF90, PGFORTRAN, and PGI Unified Binary are trademarks; and PGI, PGHPF, PGF77, PGCC, PGC++, PGI Visual Fortran,
PVF, PGI CDK, Cluster Development Kit, PGPROF, PGDBG, and The Portland Group are registered trademarks of The Portland Group Incorporated. Other brands and names are
property of their respective owners.
No part of this document may be reproduced or transmitted in any form or by any means, for any purpose other than the purchaser's or the end user's personal use without the
express written permission of STMicroelectronics and/or The Portland Group.
PGDBG® Debugger GuideCopyright © 2010-2012 STMicroelectronics, Inc.
All rights reserved.
Printed in the United States of America
ID: 122621335
First Printing: Release 11.0, December 2010
Second Printing: Release 11.1, January 2011
Third Printing: Release 11.2, February 2011
Fourth Printing: Release 11.4, April 2011
Fifth Printing: Release 12.1, January 2012
Sixth Printing: Release 12.6, June 2012
Seventh Printing: Release 12.9, September 2012
ID: 122621335
Technical support: http://www.pgroup.com/support/
Sales: [email protected]
Web: http://www.pgroup.com
iii
ContentsPreface .................................................................................................................................... xvii
Intended Audience ............................................................................................................... xvii
Documentation .................................................................................................................... xvii
Compatibility and Conformance to Standards ........................................................................... xvii
Organization ....................................................................................................................... xviii
Conventions ......................................................................................................................... xix
Terminology .......................................................................................................................... xx
Related Publications ............................................................................................................... xx
1. Getting Started .................................................................................................................... 1
Definition of Terms ................................................................................................................. 1
Building Applications for Debug ............................................................................................... 1
Debugging Optimized Code .............................................................................................. 2
Building for Debug on Windows ....................................................................................... 2
User Interfaces ....................................................................................................................... 2
Command Line Interface (CLI) ......................................................................................... 2
Graphical User Interface .................................................................................................. 2
Co-installation Requirements .................................................................................................... 3
Java Virtual Machine ....................................................................................................... 3
Licensing ....................................................................................................................... 3
Start Debugging ...................................................................................................................... 5
Program Load ........................................................................................................................ 5
Initialization Files .................................................................................................................... 5
Program Architecture .............................................................................................................. 5
2. The Graphical User Interface .......................................................................................... 7
Main Components ................................................................................................................... 7
Source Window ...................................................................................................................... 8
Source and Disassembly Displays ...................................................................................... 8
Source Window Context Menu .......................................................................................... 9
Main Toolbar ......................................................................................................................... 9
Buttons ........................................................................................................................ 10
Drop-Down Lists ........................................................................................................... 10
iv
Program I/O Window ............................................................................................................ 11
Debug Information Tabs ......................................................................................................... 11
Command Tab .............................................................................................................. 11
Events tab .................................................................................................................... 12
Groups Tab .................................................................................................................. 12
Connections Tab ........................................................................................................... 13
Call Stack Tab ............................................................................................................... 14
Locals Tab .................................................................................................................... 14
Memory Tab ................................................................................................................. 15
MPI Messages Tab ......................................................................................................... 15
Procs & Threads Tab ..................................................................................................... 16
Registers Tab ................................................................................................................ 17
Status Tab .................................................................................................................... 18
Menu Bar ............................................................................................................................ 18
File Menu .................................................................................................................... 19
Edit Menu .................................................................................................................... 19
View Menu ................................................................................................................... 20
Data Menu ................................................................................................................... 20
Connections Menu ......................................................................................................... 21
Debug Menu ................................................................................................................ 22
Help Menu ................................................................................................................... 23
3. Command Line Options .................................................................................................. 25
Command-Line Options Syntax ................................................................................................ 25
Command-Line Options ......................................................................................................... 25
Command-Line Options for MPI Debugging .............................................................................. 26
I/O Redirection ................................................................................................................... 26
4. Command Language ......................................................................................................... 27
Command Overview ............................................................................................................... 27
Command Syntax ........................................................................................................... 27
Command Modes .......................................................................................................... 27
Constants ............................................................................................................................. 27
Symbols ............................................................................................................................... 28
Scope Rules ......................................................................................................................... 28
Register Symbols ................................................................................................................... 28
Source Code Locations .......................................................................................................... 28
Lexical Blocks ...................................................................................................................... 29
Statements ............................................................................................................................ 30
Events ................................................................................................................................ 30
Event Commands ........................................................................................................... 31
Event Command Action .................................................................................................. 32
Expressions .......................................................................................................................... 33
Ctrl+C ................................................................................................................................. 34
Command-Line Debugging .............................................................................................. 34
GUI Debugging ............................................................................................................. 35
PGDBG® Debugger Guide
v
MPI Debugging ............................................................................................................. 35
5. Command Summary ......................................................................................................... 37
Notation Used in Command Sections ........................................................................................ 37
Command Summary .............................................................................................................. 38
6. Assembly-Level Debugging ............................................................................................. 51
Assembly-Level Debugging Overview ........................................................................................ 51
Assembly-Level Debugging on Microsoft Windows Systems .................................................. 51
Assembly-Level Debugging with Fortran ............................................................................ 52
Assembly-Level Debugging with C++ ................................................................................. 52
Assembly-Level Debugging Using the PGDBG GUI ............................................................... 52
Assembly-Level Debugging Using the PGDBG CLI ................................................................ 52
SSE Register Symbols ............................................................................................................. 53
7. Source-Level Debugging ................................................................................................. 55
Debugging Fortran ................................................................................................................ 55
Fortran Types ............................................................................................................... 55
Arrays .......................................................................................................................... 55
Operators ..................................................................................................................... 55
Name of the Main Routine ............................................................................................. 56
Common Blocks ........................................................................................................... 56
Internal Procedures ....................................................................................................... 56
Modules ....................................................................................................................... 57
Module Procedures ....................................................................................................... 57
Debugging C++ ..................................................................................................................... 58
Calling C++ Instance Methods ......................................................................................... 58
8. Platform-Specific Features ............................................................................................. 59
Pathname Conventions ........................................................................................................... 59
Debugging with Core Files ...................................................................................................... 59
Signals ................................................................................................................................. 61
Signals Used Internally by PGDBG ................................................................................... 61
Signals Used by Linux Libraries ....................................................................................... 61
9. Parallel Debugging Overview ........................................................................................ 63
Overview of Parallel Debugging Capability ................................................................................. 63
Graphical Presentation of Threads and Processes .............................................................. 63
Basic Process and Thread Naming ........................................................................................... 63
Thread and Process Grouping and Naming ............................................................................... 64
PGDBG Debug Modes .................................................................................................... 64
Threads-only Debugging ................................................................................................. 65
Process-only Debugging ................................................................................................. 65
Multilevel Debugging ..................................................................................................... 65
Process/Thread Sets .............................................................................................................. 66
Named p/t-sets .............................................................................................................. 66
p/t-set Notation ............................................................................................................. 66
Dynamic vs. Static p/t-sets .............................................................................................. 67
vi
Current vs. Prefix p/t-set ................................................................................................ 67
p/t-set Commands ......................................................................................................... 68
Using Process/Thread Sets in the GUI .............................................................................. 69
p/t set Usage ................................................................................................................ 71
Command Set ....................................................................................................................... 71
Process Level Commands ............................................................................................... 71
Thread Level Commands ................................................................................................ 71
Global Commands ......................................................................................................... 73
Process and Thread Control ................................................................................................... 73
Configurable Stop Mode ......................................................................................................... 74
Configurable Wait Mode ......................................................................................................... 74
Status Messages .................................................................................................................... 76
The PGDBG Command Prompt ................................................................................................ 77
Parallel Events ...................................................................................................................... 78
Parallel Statements ................................................................................................................ 79
Parallel Compound/Block Statements ............................................................................... 79
Parallel If, Else Statements ............................................................................................. 79
Parallel While Statements ............................................................................................... 79
Return Statements ......................................................................................................... 80
10. Parallel Debugging with OpenMP .............................................................................. 81
OpenMP and Multi-thread Support .......................................................................................... 81
Multi-thread and OpenMP Debugging ...................................................................................... 81
Debugging OpenMP Private Data ............................................................................................. 82
11. Parallel Debugging with MPI ...................................................................................... 85
MPI and Multi-Process Support ............................................................................................... 85
Launch Debugging From Within the GUI ................................................................................... 85
Launch Debugging From the Command Line ............................................................................. 85
MPICH-1 ...................................................................................................................... 85
MPICH-2 ...................................................................................................................... 86
MVAPICH ...................................................................................................................... 86
MSMPI (Local) ............................................................................................................. 86
MSMPI (Cluster) ........................................................................................................... 86
Using MPI on Linux ............................................................................................................... 87
Installing MPI ............................................................................................................... 87
Randomized Load Addresses ........................................................................................... 87
Using MPI on Windows .......................................................................................................... 88
Installing MSMPI ........................................................................................................... 88
Building with MSMPI ..................................................................................................... 88
Process Control .................................................................................................................... 88
Process Synchronization ......................................................................................................... 89
MPI Message Queues ............................................................................................................. 89
MPI Groups .......................................................................................................................... 90
Use halt instead of Ctrl+C ...................................................................................................... 90
SSH and RSH ........................................................................................................................ 90
PGDBG® Debugger Guide
vii
Using the CLI ........................................................................................................................ 91
Setting DISPLAY ............................................................................................................. 91
Using Continue ............................................................................................................. 91
Debugging Support for MPICH-1 ............................................................................................. 91
12. Parallel Debugging of Hybrid Applications .............................................................. 93
PGDBG Multilevel Debug Mode ............................................................................................... 93
Multilevel Debugging ............................................................................................................. 93
13. Command Reference ..................................................................................................... 95
Notation Used in Command Sections ........................................................................................ 95
Process Control .................................................................................................................... 96
attach ......................................................................................................................... 96
cont ............................................................................................................................ 96
debug ......................................................................................................................... 96
detach ........................................................................................................................ 96
halt ............................................................................................................................ 97
load ........................................................................................................................... 97
next ............................................................................................................................ 97
nexti ........................................................................................................................... 97
proc ........................................................................................................................... 97
procs .......................................................................................................................... 97
quit ............................................................................................................................ 97
rerun ......................................................................................................................... 97
run ............................................................................................................................. 98
setargs ....................................................................................................................... 98
step ............................................................................................................................ 98
stepi ........................................................................................................................... 98
stepout ....................................................................................................................... 98
sync ............................................................................................................................ 98
synci ........................................................................................................................... 99
thread ........................................................................................................................ 99
threads ....................................................................................................................... 99
wait ............................................................................................................................ 99
Process-Thread Sets .............................................................................................................. 99
defset ......................................................................................................................... 99
focus .......................................................................................................................... 99
undefset ..................................................................................................................... 99
viewset ..................................................................................................................... 100
whichsets .................................................................................................................. 100
Events ................................................................................................................................ 100
break ....................................................................................................................... 100
breaki ...................................................................................................................... 101
breaks ...................................................................................................................... 101
catch ......................................................................................................................... 102
clear ......................................................................................................................... 102
viii
delete ....................................................................................................................... 102
disable ..................................................................................................................... 102
do ............................................................................................................................. 102
doi ........................................................................................................................... 103
enable ...................................................................................................................... 103
hwatch ...................................................................................................................... 103
hwatchboth ............................................................................................................... 103
hwatchread ............................................................................................................... 103
ignore ...................................................................................................................... 104
status ....................................................................................................................... 104
stop .......................................................................................................................... 104
stopi ......................................................................................................................... 104
trace ....................................................................................................................... 104
tracei ...................................................................................................................... 105
track ......................................................................................................................... 105
tracki ....................................................................................................................... 105
unbreak ................................................................................................................... 105
unbreaki .................................................................................................................. 105
watch ........................................................................................................................ 105
watchi ....................................................................................................................... 106
when ........................................................................................................................ 106
wheni ....................................................................................................................... 106
Program Locations .............................................................................................................. 107
arrive ....................................................................................................................... 107
cd ............................................................................................................................. 107
disasm ...................................................................................................................... 107
edit ........................................................................................................................... 107
file ........................................................................................................................... 107
lines ......................................................................................................................... 108
list ............................................................................................................................ 108
pwd .......................................................................................................................... 108
stackdump ................................................................................................................ 108
stacktrace ................................................................................................................. 108
where ....................................................................................................................... 109
/ .............................................................................................................................. 109
? ............................................................................................................................. 109
Printing Variables and Expressions ........................................................................................ 109
print ......................................................................................................................... 109
printf ........................................................................................................................ 110
ascii ......................................................................................................................... 111
bin ........................................................................................................................... 111
dec ........................................................................................................................... 111
display ..................................................................................................................... 111
hex ........................................................................................................................... 111
oct ............................................................................................................................ 111
PGDBG® Debugger Guide
ix
string ....................................................................................................................... 111
undisplay .................................................................................................................. 112
Symbols and Expressions ..................................................................................................... 112
assign ....................................................................................................................... 112
call ........................................................................................................................... 112
declaration ............................................................................................................... 113
entry ......................................................................................................................... 113
lval ........................................................................................................................... 113
rval ........................................................................................................................... 113
set ............................................................................................................................ 114
sizeof ....................................................................................................................... 114
type .......................................................................................................................... 114
Scope ................................................................................................................................ 114
class ......................................................................................................................... 114
classes ...................................................................................................................... 115
decls ......................................................................................................................... 115
down ........................................................................................................................ 115
enter ........................................................................................................................ 115
files .......................................................................................................................... 115
global ....................................................................................................................... 115
names ....................................................................................................................... 115
scope ........................................................................................................................ 115
up ............................................................................................................................. 115
whereis .................................................................................................................... 116
which ....................................................................................................................... 116
Register Access ................................................................................................................... 116
fp ............................................................................................................................. 116
pc ............................................................................................................................. 116
regs .......................................................................................................................... 116
retaddr ..................................................................................................................... 116
sp ............................................................................................................................. 116
Memory Access ................................................................................................................... 117
cread ........................................................................................................................ 117
dread ....................................................................................................................... 117
dump ........................................................................................................................ 117
fread ........................................................................................................................ 118
iread ........................................................................................................................ 118
lread ........................................................................................................................ 118
mqdump ................................................................................................................... 118
sread ........................................................................................................................ 118
Conversions ........................................................................................................................ 118
addr ......................................................................................................................... 118
function .................................................................................................................... 119
line ........................................................................................................................... 119
Target ................................................................................................................................ 119
x
connect ..................................................................................................................... 119
disconnect ................................................................................................................ 119
native ....................................................................................................................... 119
Miscellaneous ..................................................................................................................... 120
alias ......................................................................................................................... 120
directory .................................................................................................................. 120
help .......................................................................................................................... 120
history ...................................................................................................................... 121
language ................................................................................................................... 121
log ............................................................................................................................ 121
noprint ..................................................................................................................... 121
pgienv ...................................................................................................................... 121
repeat ....................................................................................................................... 124
script ........................................................................................................................ 124
setenv ....................................................................................................................... 124
shell ......................................................................................................................... 124
sleep ........................................................................................................................ 125
source ...................................................................................................................... 125
unalias ..................................................................................................................... 125
use ........................................................................................................................... 125
Index ...................................................................................................................................... 127
xi
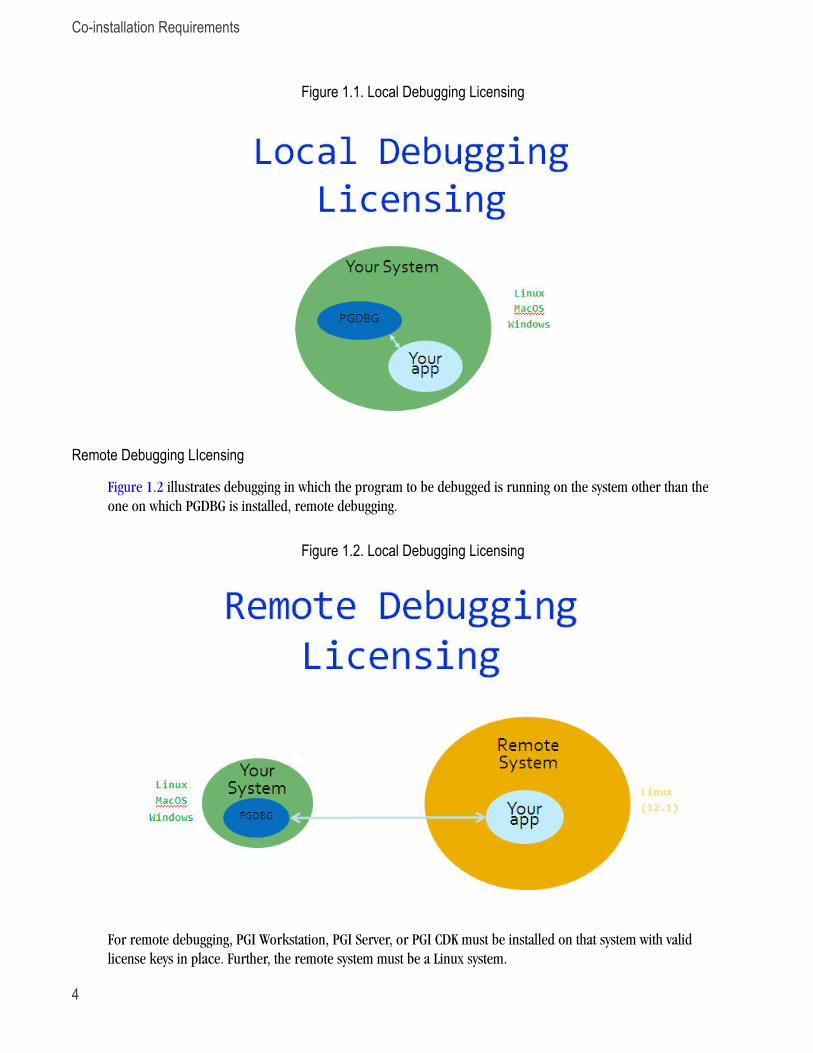
Figures1.1. Local Debugging Licensing ........................................................................................................ 4
1.2. Local Debugging Licensing ........................................................................................................ 4
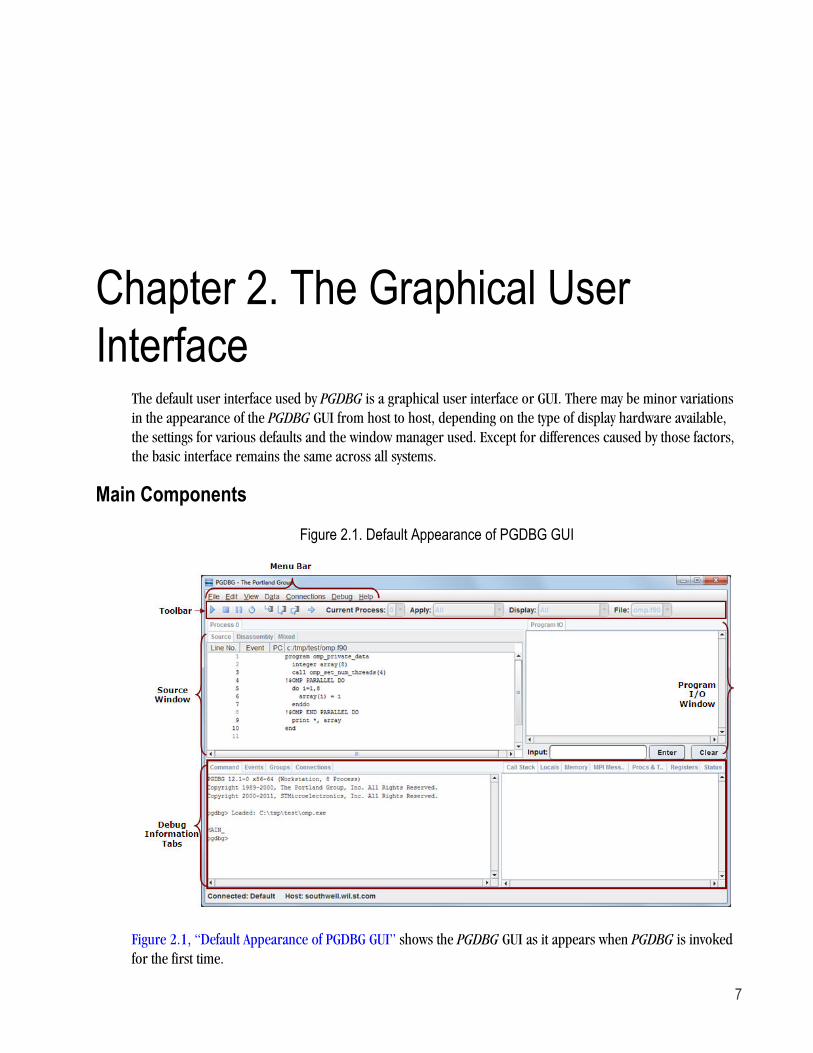
2.1. Default Appearance of PGDBG GUI ............................................................................................. 7
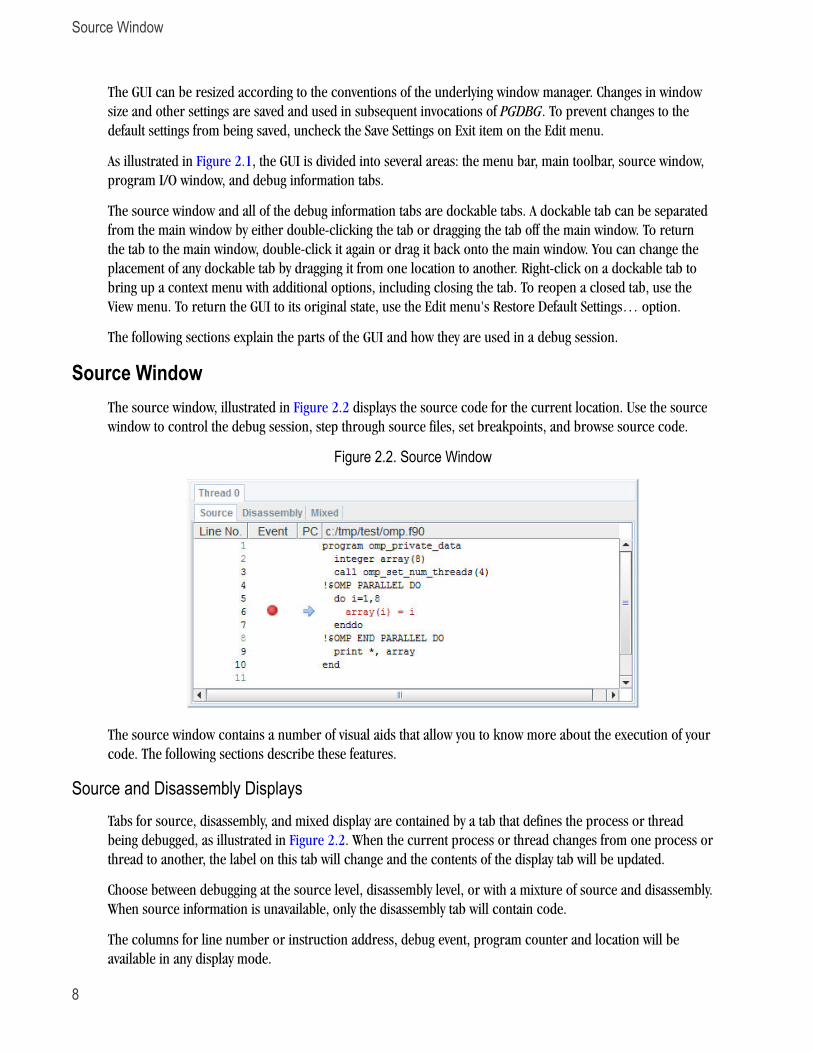
2.2. Source Window ........................................................................................................................ 8
2.3. Context Menu .......................................................................................................................... 9
2.4. Buttons on Toolbar ................................................................................................................. 10
2.5. Drop-Down Lists on Toolbar .................................................................................................... 10
2.6. Program I/O Window .............................................................................................................. 11
2.7. Command Tab ........................................................................................................................ 12
2.8. Events Tab ............................................................................................................................. 12
2.9. Groups Tab ............................................................................................................................ 13
2.10. Connections Tab ................................................................................................................... 13
2.11. Call Stack Tab ...................................................................................................................... 14
2.12. Call Stack Outside Current Frame ............................................................................................ 14
2.13. Locals Tab ........................................................................................................................... 14
2.14. Memory Tab ......................................................................................................................... 15
2.15. Memory Tab in Decimal Format .............................................................................................. 15
2.16. MPI Messages Tab ................................................................................................................ 16
2.17. Process (Thread) Grid Tab .................................................................................................... 16
2.18. General Purpose Registers ..................................................................................................... 17
2.19. Status Tab ............................................................................................................................ 18
9.1. Groups Tab ............................................................................................................................ 69
9.2. Process/Thread Group Dialog Box ............................................................................................ 70
10.1. OpenMP Private Data in PGDBG GUI ........................................................................................ 83

xii
xiii
Tables2.1. Colors Describing Thread State ................................................................................................. 17
4.1. PGDBG Operators ................................................................................................................... 34
5.1. PGDBG Commands ................................................................................................................. 38
9.1. PGDBG Debug Modes .............................................................................................................. 64
9.2. p/t-set Commands ................................................................................................................... 68
9.3. PGDBG Parallel Commands ...................................................................................................... 71
9.4. PGDBG Stop Modes ................................................................................................................ 74
9.5. PGDBG Wait Modes ................................................................................................................ 75
9.6. PGDBG Wait Behavior ............................................................................................................. 76
9.7. PGDBG Status Messages ........................................................................................................... 77
10.1. Thread State Is Described Using Color ..................................................................................... 82
11.1. MPICH Support .................................................................................................................... 92
13.1. pgienv Commands ............................................................................................................... 122

xiv
xv
Examples9.1. Thread IDs in Threads-only Debug Mode ................................................................................... 65
9.2. Process IDs in Process-only Debug Mode .................................................................................. 65
9.3. Thread IDs in Multilevel Debug Mode ....................................................................................... 65
9.4. p/t-sets in Threads-only Debug Mode ........................................................................................ 66
9.5. p/t-sets in Process-only Debug Mode ......................................................................................... 67
9.6. p/t-sets in Multilevel Debug Mode ............................................................................................. 67
9.7. Defining a Dynamic p/t-set ....................................................................................................... 67
9.8. Defining a Static p/t-set ........................................................................................................... 67
12.1. Thread IDs in multilevel debug mode ...................................................................................... 93
13.1. Syntax examples ................................................................................................................... 95

xvi
xvii
PrefaceThis guide describes how to use the PGDBG debugger to debug serial and parallel applications built with The
Portland Group (PGI) Fortran, C, and C++ compilers for X86, AMD64 and Intel 64 processor-based systems. It
contains information about how to use PGDBG, as well as detailed reference information on commands and its
graphical interface.
Intended AudienceThis guide is intended for application programmers, scientists and engineers proficient in programming with
the Fortran, C, and/or C++ languages. The PGI tools are available on a variety of operating systems for the X86,
AMD64, and Intel 64 hardware platforms. This guide assumes familiarity with basic operating system usage.
DocumentationPGI Documentation is installed with every release. The latest version of PGDBG documentation is also available
at www.pgroup.com/docs.htm. See www.pgroup.com/faq/index.htm for frequently asked PGDBG questions and
answers.
Compatibility and Conformance to StandardsThe PGI compilers and tools run on a variety of systems. They produce and/or process code that conforms
to the ANSI standards for FORTRAN 77, Fortran 95, Fortran 2003, C, and C++ and includes extensions from
MIL-STD-1753, VAX/VMS Fortran, IBM/VS Fortran, SGI Fortran, Cray Fortran, and K&R C. PGF77, PGFORTRAN,
PGCC ANSI C, and PGCPP support parallelization extensions based on the OpenMP 3.0 standard. PGHPF
supports data parallel extensions based on the High Performance Fortran (HPF) defacto standard. The PGI
Fortran Reference Manual describes Fortran statements and extensions as implemented in the PGI Fortran
compilers.
PGDBG supports debugging of serial, multi-threaded, parallel OpenMP, parallel MPI and multi-process multi-
threaded hybrid MPI programs compiled with PGI compilers.
For further information, refer to the following:
• American National Standard Programming Language FORTRAN, ANSI X3. -1978 (1978).
• American National Standard Programming Language C, ANSI X3.159-1989.
Organization
xviii
• ISO/IEC 9899:1999, Information technology – Programming Languages – C, Geneva, 1999 (C99).
• ISO/IEC 1539:1991, Information technology – Programming Languages – Fortran, Geneva, 1991 (Fortran
90).
• ISO/IEC 1539:1997, Information technology – Programming Languages – Fortran, Geneva, 1997 (Fortran
95).
• High Performance Fortran Language Specification, Revision 1.0, Rice University, Houston, Texas (1993),
http://www.crpc.rice.edu/HPFF.
• High Performance Fortran Language Specification, Revision 2.0, Rice University, Houston, Texas (1997),
http://www.crpc.rice.edu/HPFF.
• OpenMP Application Program Interface, Version 2.5, May 2005, http://www.openmp.org.
• Programming in VAX Fortran, Version 4.0, Digital Equipment Corporation (September, 1984).
• IBM VS Fortran, IBM Corporation, Rev. GC26-4119.
• Military Standard, Fortran, DOD Supplement to American National Standard Programming Language
Fortran, ANSI x.3-1978, MIL-STD-1753 (November 9, 1978).
• HPDF Standard (High Performance Debugging Forum) http://www.ptools.org/hpdf/draft/intro.html
OrganizationThe PGDBG Debugger Manual contains these thirteen chapters that describe PGDBG, a symbolic debugger for
Fortran, C, C++ and assembly language programs.
Chapter 1, “Getting Started”
contains information on how to start using the debugger, including a description of how to build a
program for debug and how to invoke PGDBG.
Chapter 2, “The Graphical User Interface”
describes how to use the PGDBG graphical user interface (GUI).
Chapter 3, “Command Line Options”
describes the PGDBG command-line options.
Chapter 4, “Command Language”
provides detailed information about the PGDBG command language, which can be used from the
command-line user interface or from the Command tab of the graphical user interface.
Chapter 5, “Command Summary”
provides a brief summary table of the PGDBG debugger commands with a brief description of the
command as well as information about the category of command use.
Chapter 6, “Assembly-Level Debugging”
contains information on assembly-level debugging; basic debugger operations, commands, and features
that are useful for debugging assembly code; and how to access registers.
Chapter 7, “Source-Level Debugging”
contains information on language-specific issues related to source debugging.
Preface
xix
Chapter 8, “Platform-Specific Features”
contains platform-specific information as it relates to debugging.
Chapter 9, “Parallel Debugging Overview”
contains an overview of the parallel debugging capabilities of PGDBG.
Chapter 10, “Parallel Debugging with OpenMP”
describes the parallel debugging capabilities of PGDBG and how to use them with OpenMP.
Chapter 11, “Parallel Debugging with MPI”
describes the parallel debugging capabilities of PGDBG and how to use them with MPI.
Chapter 12, “Parallel Debugging of Hybrid Applications”
describes the parallel debugging capabilities of PGDBG and how to use them with hybrid applications.
Chapter 13, “Command Reference”
provides reference information about each of the PGDBG commands, organized by area of use.
ConventionsThis guide uses the following conventions:
italic
is used for emphasis.
Constant Width
is used for filenames, directories, arguments, options, examples, and for language statements in the text,
including assembly language statements.
Bold
is used for commands.
[ item1 ]
in general, square brackets indicate optional items. In this case item1 is optional. In the context of p/t-
sets, square brackets are required to specify a p/t-set.
{ item2 | item 3}
braces indicate that a selection is required. In this case, you must select either item2 or item3.
filename ...
ellipsis indicate a repetition. Zero or more of the preceding item may occur. In this example, multiple
filenames are allowed.
FORTRAN
Fortran language statements are shown in the text of this guide using a reduced fixed point size.
C/ C++
C/ C++ language statements are shown in the text of this guide using a reduced fixed point size.
The PGI compilers and tools are supported on both 32-bit and 64-bit variants of the Linux, Windows, and
Mac OS operating systems on a variety of x86-compatible processors. There are a wide variety of releases and
distributions of each of these types of operating systems.
Terminology
xx
TerminologyIf there are terms in this guide with which you are unfamiliar, PGI provides a glossary of terms which you can
access at www.pgroup.com/support/definitions.htm
Related PublicationsThe following documents contain additional information related to the X86 architecture and the compilers and
tools available from The Portland Group.
• PGI Fortran Reference Manual describes the FORTRAN 77, Fortran 90/95, Fortran 2003, and HPF
statements, data types, input/output format specifiers, and additional reference material related to the use of
PGI Fortran compilers.
• System V Application Binary Interface Processor Supplement by AT&T UNIX System Laboratories, Inc.
(Prentice Hall, Inc.).
• FORTRAN 95 HANDBOOK, Complete ANSI/ISO Reference (The MIT Press, 1997).
• Programming in VAX Fortran, Version 4.0, Digital Equipment Corporation (September, 1984).
• IBM VS Fortran, IBM Corporation, Rev. GC26-4119.
• The C Programming Language by Kernighan and Ritchie (Prentice Hall).
• C: A Reference Manual by Samuel P. Harbison and Guy L. Steele Jr. (Prentice Hall, 1987).
• The Annotated C++ Reference Manual by Margaret Ellis and Bjarne Stroustrup, AT&T Bell Laboratories, Inc.
(Addison-Wesley Publishing Co., 1990)
• PGI Compiler User’s Guide, PGI Reference Manual, PGI Release Notes, FAQ, Tutorials, http://
www.pgroup.com/
• MPI-CH http://www.unix.mcs.anl.gov/MPI/mpich /
• OpenMP http://www.openmp.org/
1
Chapter 1. Getting StartedPGDBG is a symbolic debugger for Fortran, C, C++ and assembly language programs. It provides debugger
features, such as execution control using breakpoints, single-stepping, and examination and modification of
application variables, memory locations, and registers.
PGDBG supports debugging of certain types of parallel applications:
• Multi-threaded and OpenMP applications.
• MPI applications.
• Hybrid applications, which use multiple threads or OpenMP as well as multiple MPI processes.
Multi-threaded and OpenMP applications may be run using more threads than the available number of CPUs,
and MPI applications may allocate more than one process to a cluster node. PGDBG supports debugging the
listed types of applications regardless of how well the number of threads match the number of CPUs or how
well the number of processes match the number of cluster nodes.
Definition of TermsThroughout this manual we use several debugging-specific terms. The program is the executable being
debugged. The platform is the combination of the operating system and processors(s) on which the program
runs. The program architecture is the platform for which the program was built, which may be different from
the platform on which the program runs, such as a 32-bit program running on a 64-bit platform
The PGI 2012 release of remote debugging support introduced a few more terms. Remote debugging is the
process of running the debugger on one system (the client) and using it to debug a program running on
a different system (the server). Local debugging, by contrast, occurs when the debugger and program are
running on the same system. A connection is the set of information the debugger needs to begin debugging a
program. This information always includes the program name and whether debugging will be local or remote.
Additional terms are defined as needed. Terminology specific to parallel debugging is introduced in Chapter 9,
“Parallel Debugging Overview”.
Building Applications for DebugTo build a program for debug, compile with the –g option. With this option, the compiler generates
information about the symbols and source files in the program and includes it in the executable file. The
User Interfaces
2
option –g also sets the compiler optimization to level zero (no optimization) unless you specify optimization
options such as –O, –fast, or –fastsse on the command line. Optimization options take effect whether
they are listed before or after –g on the command line.
Debugging Optimized Code
Programs built with –g and optimization levels higher than –O0 can be debugged, but due to transformations
made to the program during optimization, source-level debugging may not be reliable. Assembly-level
debugging (e.g., accessing registers, viewing assembly code, etc.) is reliable, even with optimized code.
Programs built without –g can be debugged; however, information about types, local variables, arguments
and source file line numbers are not available. For more information on assembly-level debugging, refer to
Chapter 6, “Assembly-Level Debugging”.
In programs built with both –g and optimization levels higher than –O0, some optimizations may be disabled
or otherwise affected by the –g option, possibly changing the program behavior. An alternative option, –gopt,
can be used to build programs with full debugging information, but without modifying program optimizations.
Unlike –g, the –gopt option does not set the optimization to level zero.
Building for Debug on Windows
To build an application for debug on Windows platforms, applications must be linked with the –g option as
well as compiled with –g. This process results in the generation of debug information stored in a ‘.dwf’
file and a ‘.pdb’ file. The PGI compiler driver should always be used to link applications; except for special
circumstances, the linker should not be invoked directly.
User InterfacesPGDBG includes both a command-line interface (CLI) and a graphical user interface (GUI).
Command Line Interface (CLI)
Text commands are entered one line at a time through the command-line interface. A number of command-
line options can be used when launching PGDBG.
For information on these options and how they are interpreted, refer to Chapter 3, “Command Line Options”,
Chapter 4, “Command Language”, and “Command Reference”.
Graphical User Interface
The GUI, the default user interface, supports command entry through a point-and-click interface, a view
of source and assembly code, a full command-line interface panel, and several other graphical elements
and features. There may be minor variations in the appearance of the PGDBG GUI from system to system,
depending on the type of display hardware available, the settings for various defaults and the window manager
used. Except for differences caused by those factors, the basic interface remains the same across all systems.
For more information on the PGDBG GUI, refer to “The Graphical User Interface”.
Chapter 1. Getting Started
3
Co-installation RequirementsThere are no co-installation requirements for PGDBG when the program being debugged is running on the
same system on which the debugger is running. This section describes the requirements when the program to
be debugged is running on a different system (i.e., a remote system:
• Java Virtual Machine for the PGDBG GUI
• Licensing
Java Virtual MachineThe PGDBG GUI depends on the Java Virtual Machine (JVM) which is part of the Java Runtime Environment
(JRE). PGDBG requires that the JRE be a specific minimum version or above.
Linux
When PGI software is installed on Linux, the version of Java required by the debugger is also installed. PGDBG
uses this version of Java by default. You can override this behavior in two ways: set your PATH to include a
different version of Java; or, set the PGI_JAVA environment variable to the full path of the Java executable. The
following example uses a bash command to set PGI_JAVA:
$ export PGI_JAVA=/home/myuser/myjava/bin/java
OSX
The PGI debugger on OSX uses the version of Java installed by Apple's OSX software updater. If your system is
configured such that Java is not installed in the default location, you need to set your PATH to include the Java
bin directory or use the PGI_JAVA environment variable to specify the full path to the java executable.
Windows
If an appropriately-versioned JRE is not already on your system, the PGI software installation process installs
it for you. The PGI command shell and Start menu links are automatically configured to use the JRE. If you
choose to skip the JRE-installation step or want to use a different version of Java to run the debugger, then set
your PATH to include the Java bin directory or use the PGI_JAVA environment variable to specify the full path to
the java executable.
The command-line mode debugger does not require the JRE.
LicensingThe licensing depends on whether the program to be debugged is running lon the same system as PGDBG is
installed or on a different, remote system.
Local Debugging LIcensing
Figure 1.1 illustrates debugging in which the program to be debugged is running on the same system as
PGDBG is installed, local debugging. For local debugging, the PGI License Keys associated with the debugger
are all you need.
Co-installation Requirements
4
Figure 1.1. Local Debugging Licensing
Remote Debugging LIcensing
Figure 1.2 illustrates debugging in which the program to be debugged is running on the system other than the
one on which PGDBG is installed, remote debugging.
Figure 1.2. Local Debugging Licensing
For remote debugging, PGI Workstation, PGI Server, or PGI CDK must be installed on that system with valid
license keys in place. Further, the remote system must be a Linux system.
Chapter 1. Getting Started
5
Start DebuggingYou can start debugging a program right away by launching PGDBG and giving it the program name. For
example, to load your_program into the debugger, launch PGDBG in this way.
% pgdbg your_program
Now you are ready to set breakpoints and start debugging.
You can also launch PGDBG without a program. Once the debugger is up, use the Connections tab to specify
the program to debug. To load the specified program into the debugger, use the Connections tab's Open
button.
Program LoadWhen PGDBG loads a program, it reads symbol information from the executable file, then loads the
application into memory. For large applications this process can take a few moments.
Initialization FilesAn initialization file can be useful for defining common aliases, setting breakpoints, and for other startup
commands. If an initialization file named .pgdbgrc exists in the current directory or in your home directory,
as defined by the environment variable HOME, PGDBG opens this file when it starts up and executes the
commands in it.
If an initialization file is found in the current directory, then the initialization file in the home directory, if there
is one, is ignored. However, a script command placed in the initialization file can be used to execute the
initialization file in the home directory or any other file.
Program ArchitecturePGDBG supports debugging both 32-bit and 64-bit programs. PGDBG automatically determines the
architecture of the program and configures itself accordingly.

6
7
Chapter 2. The Graphical UserInterface
The default user interface used by PGDBG is a graphical user interface or GUI. There may be minor variations
in the appearance of the PGDBG GUI from host to host, depending on the type of display hardware available,
the settings for various defaults and the window manager used. Except for differences caused by those factors,
the basic interface remains the same across all systems.
Main Components
Figure 2.1. Default Appearance of PGDBG GUI
Figure 2.1, “Default Appearance of PGDBG GUI” shows the PGDBG GUI as it appears when PGDBG is invoked
for the first time.
Source Window
8
The GUI can be resized according to the conventions of the underlying window manager. Changes in window
size and other settings are saved and used in subsequent invocations of PGDBG. To prevent changes to the
default settings from being saved, uncheck the Save Settings on Exit item on the Edit menu.
As illustrated in Figure 2.1, the GUI is divided into several areas: the menu bar, main toolbar, source window,
program I/O window, and debug information tabs.
The source window and all of the debug information tabs are dockable tabs. A dockable tab can be separated
from the main window by either double-clicking the tab or dragging the tab off the main window. To return
the tab to the main window, double-click it again or drag it back onto the main window. You can change the
placement of any dockable tab by dragging it from one location to another. Right-click on a dockable tab to
bring up a context menu with additional options, including closing the tab. To reopen a closed tab, use the
View menu. To return the GUI to its original state, use the Edit menu's Restore Default Settings… option.
The following sections explain the parts of the GUI and how they are used in a debug session.
Source WindowThe source window, illustrated in Figure 2.2 displays the source code for the current location. Use the source
window to control the debug session, step through source files, set breakpoints, and browse source code.
Figure 2.2. Source Window
The source window contains a number of visual aids that allow you to know more about the execution of your
code. The following sections describe these features.
Source and Disassembly DisplaysTabs for source, disassembly, and mixed display are contained by a tab that defines the process or thread
being debugged, as illustrated in Figure 2.2. When the current process or thread changes from one process or
thread to another, the label on this tab will change and the contents of the display tab will be updated.
Choose between debugging at the source level, disassembly level, or with a mixture of source and disassembly.
When source information is unavailable, only the disassembly tab will contain code.
The columns for line number or instruction address, debug event, program counter and location will be
available in any display mode.
Chapter 2. The Graphical User Interface
9
The line number column contains line numbers when displaying source code, instruction addresses when
displaying disassembly, and a mixture of both in mixed mode. A grayed-out line number indicates a non-
executable source line. Some examples of non-executable source lines are comments, non-applicable
preprocessed code, some routine prologues, and some variable declarations. Breakpoints and other events
cannot be set on non-executable lines.
The Event column indicates where debug events such as breakpoints or watchpoints exist. An event is indicated
by a red sphere icon. Breakpoints may be set at any executable source line by left-clicking in the Event column
at the desired source line. An existing breakpoint may be deleted by left-clicking on its breakpoint icon.
The PC column is the home of a blue arrow icon which marks the current location of the program counter. In
other words, this arrow marks where program execution is during a debug session.
The title of the fourth column in the display windows is dependent on display mode. In the Source tab, this
column will contain the name and path of the displayed source file. In the Disassembly and Mixed tabs, this
column will contain the name of the disassembled function.
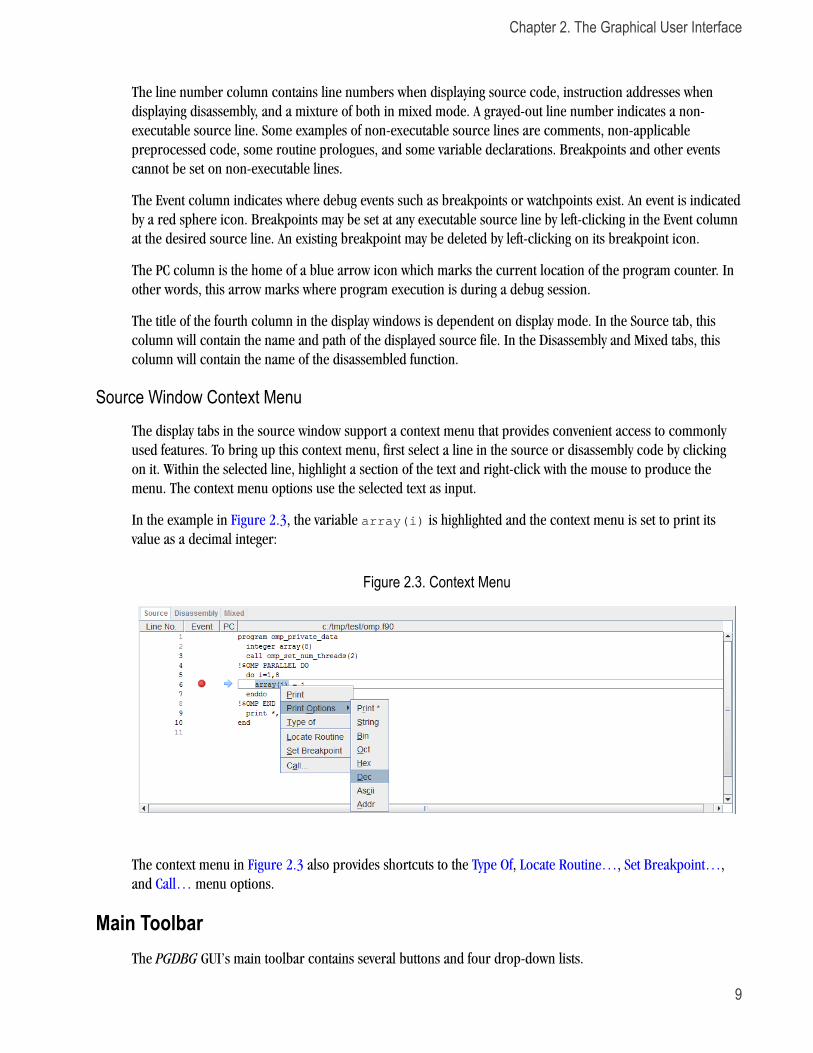
Source Window Context MenuThe display tabs in the source window support a context menu that provides convenient access to commonly
used features. To bring up this context menu, first select a line in the source or disassembly code by clicking
on it. Within the selected line, highlight a section of the text and right-click with the mouse to produce the
menu. The context menu options use the selected text as input.
In the example in Figure 2.3, the variable array(i) is highlighted and the context menu is set to print its
value as a decimal integer:
Figure 2.3. Context Menu
The context menu in Figure 2.3 also provides shortcuts to the Type Of, Locate Routine…, Set Breakpoint…,
and Call… menu options.
Main ToolbarThe PGDBG GUI’s main toolbar contains several buttons and four drop-down lists.
Main Toolbar
10
Buttons
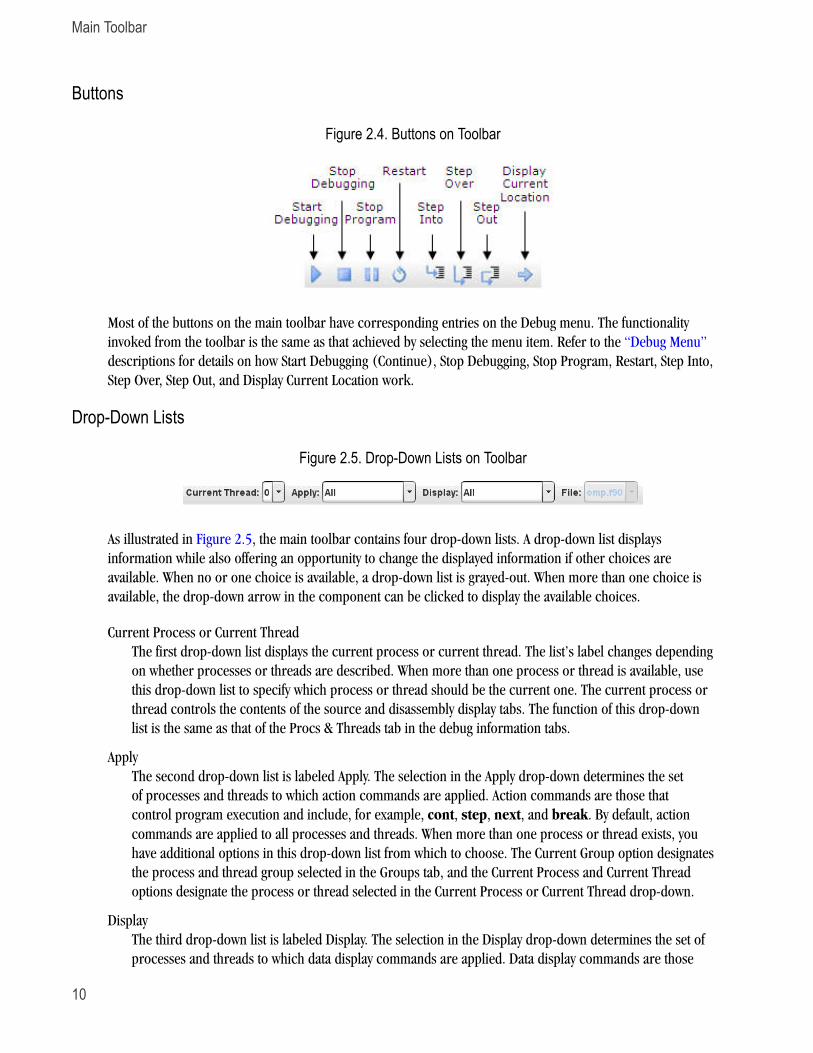
Figure 2.4. Buttons on Toolbar
Most of the buttons on the main toolbar have corresponding entries on the Debug menu. The functionality
invoked from the toolbar is the same as that achieved by selecting the menu item. Refer to the “Debug Menu”
descriptions for details on how Start Debugging (Continue), Stop Debugging, Stop Program, Restart, Step Into,
Step Over, Step Out, and Display Current Location work.
Drop-Down Lists
Figure 2.5. Drop-Down Lists on Toolbar
As illustrated in Figure 2.5, the main toolbar contains four drop-down lists. A drop-down list displays
information while also offering an opportunity to change the displayed information if other choices are
available. When no or one choice is available, a drop-down list is grayed-out. When more than one choice is
available, the drop-down arrow in the component can be clicked to display the available choices.
Current Process or Current Thread
The first drop-down list displays the current process or current thread. The list’s label changes depending
on whether processes or threads are described. When more than one process or thread is available, use
this drop-down list to specify which process or thread should be the current one. The current process or
thread controls the contents of the source and disassembly display tabs. The function of this drop-down
list is the same as that of the Procs & Threads tab in the debug information tabs.
Apply
The second drop-down list is labeled Apply. The selection in the Apply drop-down determines the set
of processes and threads to which action commands are applied. Action commands are those that
control program execution and include, for example, cont, step, next, and break. By default, action
commands are applied to all processes and threads. When more than one process or thread exists, you
have additional options in this drop-down list from which to choose. The Current Group option designates
the process and thread group selected in the Groups tab, and the Current Process and Current Thread
options designate the process or thread selected in the Current Process or Current Thread drop-down.
Display
The third drop-down list is labeled Display. The selection in the Display drop-down determines the set of
processes and threads to which data display commands are applied. Data display commands are those
Chapter 2. The Graphical User Interface
11
that print the values of expressions and program state and include, for example, print, names, regs and
stack. The options in the Display drop-down are the same as those in the Apply drop-down but can be
changed independently.
File
The fourth drop-down list is labeled File. It displays the source file that contains the current target
location. It can be used to select another file for viewing in the source window.
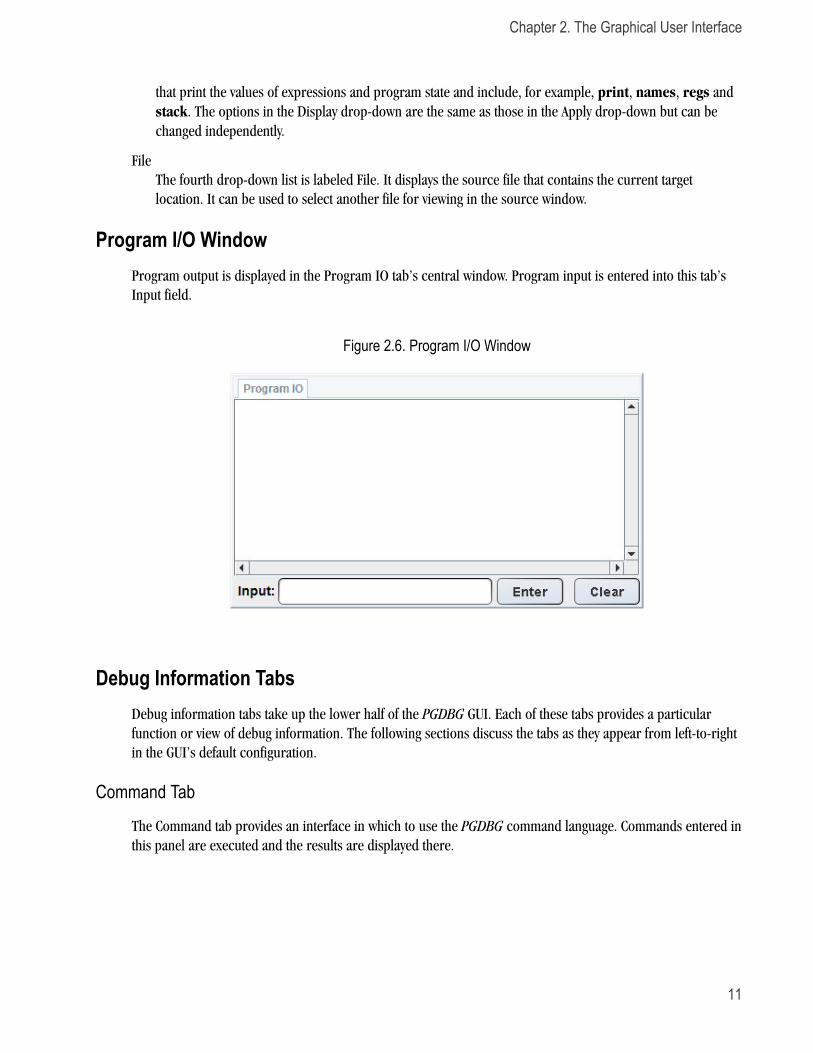
Program I/O WindowProgram output is displayed in the Program IO tab’s central window. Program input is entered into this tab’s
Input field.
Figure 2.6. Program I/O Window
Debug Information TabsDebug information tabs take up the lower half of the PGDBG GUI. Each of these tabs provides a particular
function or view of debug information. The following sections discuss the tabs as they appear from left-to-right
in the GUI’s default configuration.
Command Tab
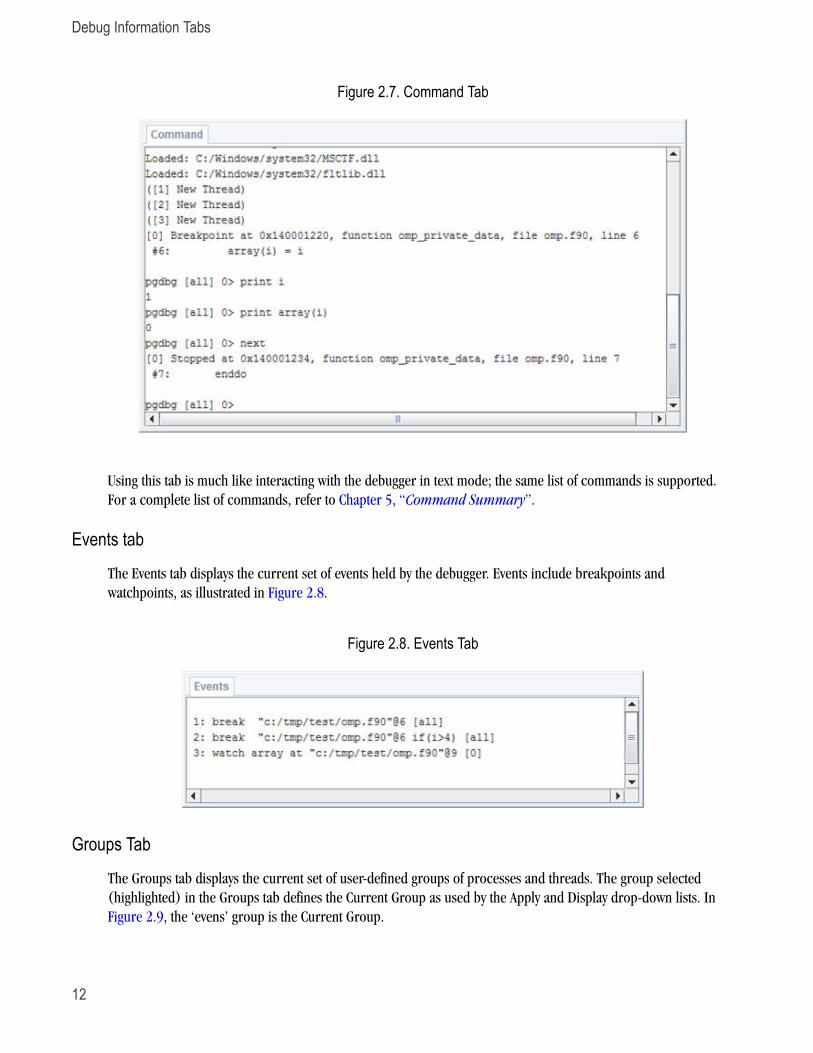
The Command tab provides an interface in which to use the PGDBG command language. Commands entered in
this panel are executed and the results are displayed there.
Debug Information Tabs
12
Figure 2.7. Command Tab
Using this tab is much like interacting with the debugger in text mode; the same list of commands is supported.
For a complete list of commands, refer to Chapter 5, “Command Summary”.
Events tab
The Events tab displays the current set of events held by the debugger. Events include breakpoints and
watchpoints, as illustrated in Figure 2.8.
Figure 2.8. Events Tab
Groups Tab
The Groups tab displays the current set of user-defined groups of processes and threads. The group selected
(highlighted) in the Groups tab defines the Current Group as used by the Apply and Display drop-down lists. In
Figure 2.9, the ‘evens’ group is the Current Group.
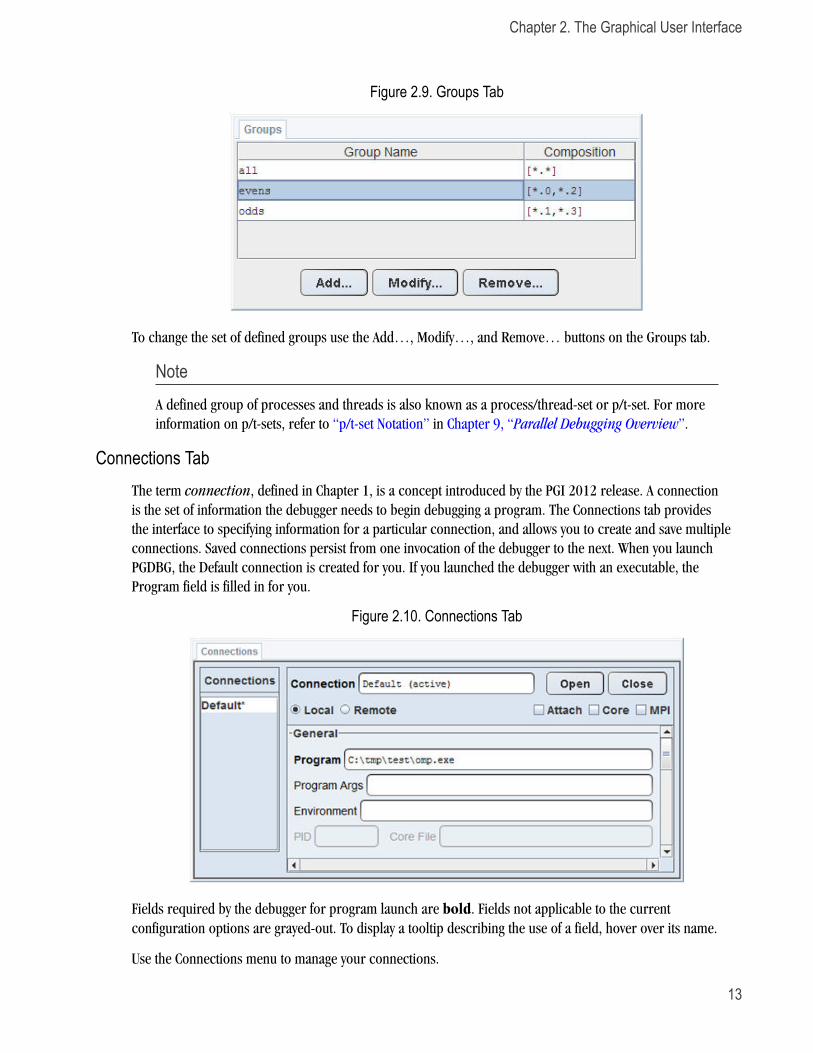
Chapter 2. The Graphical User Interface
13
Figure 2.9. Groups Tab
To change the set of defined groups use the Add…, Modify…, and Remove… buttons on the Groups tab.
NoteA defined group of processes and threads is also known as a process/thread-set or p/t-set. For more
information on p/t-sets, refer to “p/t-set Notation” in Chapter 9, “Parallel Debugging Overview”.
Connections TabThe term connection, defined in Chapter 1, is a concept introduced by the PGI 2012 release. A connection
is the set of information the debugger needs to begin debugging a program. The Connections tab provides
the interface to specifying information for a particular connection, and allows you to create and save multiple
connections. Saved connections persist from one invocation of the debugger to the next. When you launch
PGDBG, the Default connection is created for you. If you launched the debugger with an executable, the
Program field is filled in for you.
Figure 2.10. Connections Tab
Fields required by the debugger for program launch are bold. Fields not applicable to the current
configuration options are grayed-out. To display a tooltip describing the use of a field, hover over its name.
Use the Connections menu to manage your connections.
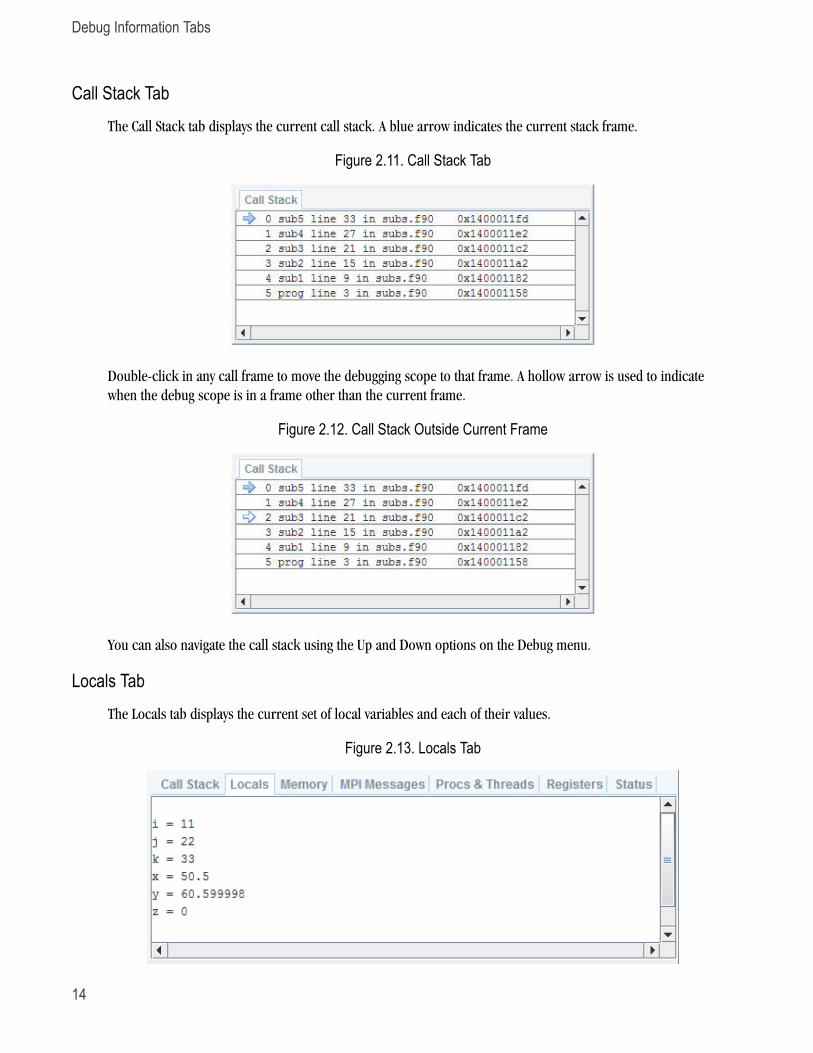
Debug Information Tabs
14
Call Stack TabThe Call Stack tab displays the current call stack. A blue arrow indicates the current stack frame.
Figure 2.11. Call Stack Tab
Double-click in any call frame to move the debugging scope to that frame. A hollow arrow is used to indicate
when the debug scope is in a frame other than the current frame.
Figure 2.12. Call Stack Outside Current Frame
You can also navigate the call stack using the Up and Down options on the Debug menu.
Locals TabThe Locals tab displays the current set of local variables and each of their values.
Figure 2.13. Locals Tab
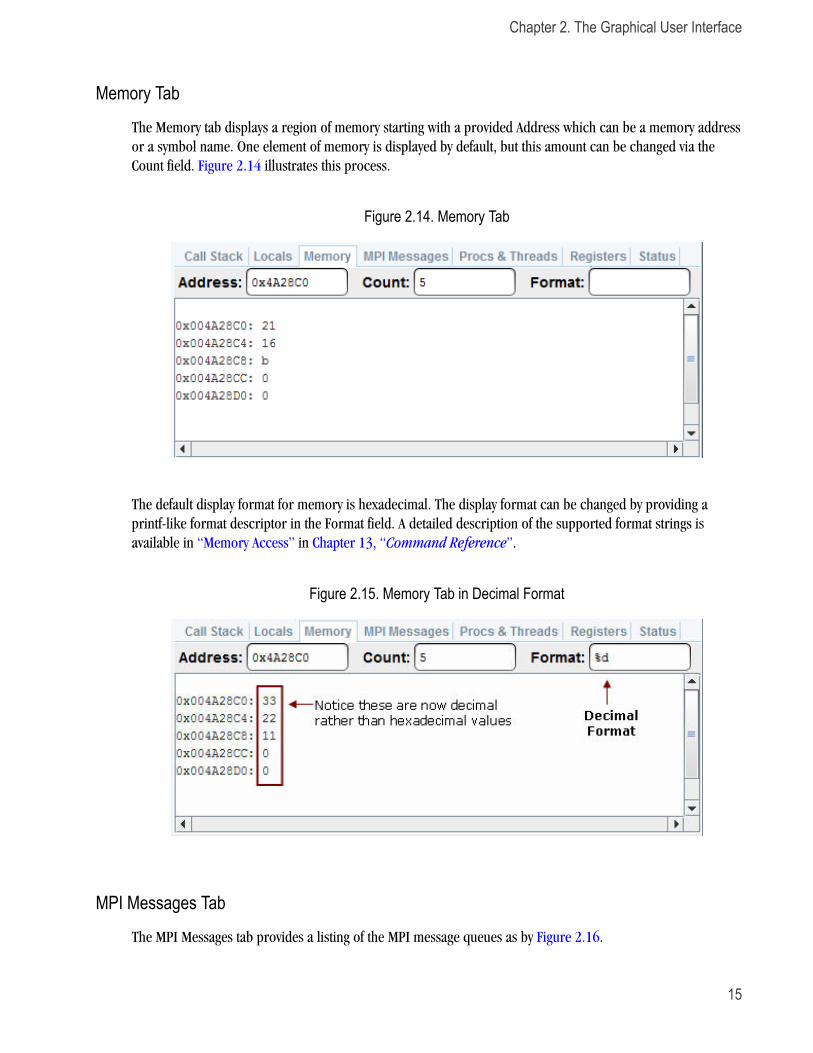
Chapter 2. The Graphical User Interface
15
Memory Tab
The Memory tab displays a region of memory starting with a provided Address which can be a memory address
or a symbol name. One element of memory is displayed by default, but this amount can be changed via the
Count field. Figure 2.14 illustrates this process.
Figure 2.14. Memory Tab
The default display format for memory is hexadecimal. The display format can be changed by providing a
printf-like format descriptor in the Format field. A detailed description of the supported format strings is
available in “Memory Access” in Chapter 13, “Command Reference”.
Figure 2.15. Memory Tab in Decimal Format
MPI Messages Tab
The MPI Messages tab provides a listing of the MPI message queues as by Figure 2.16.
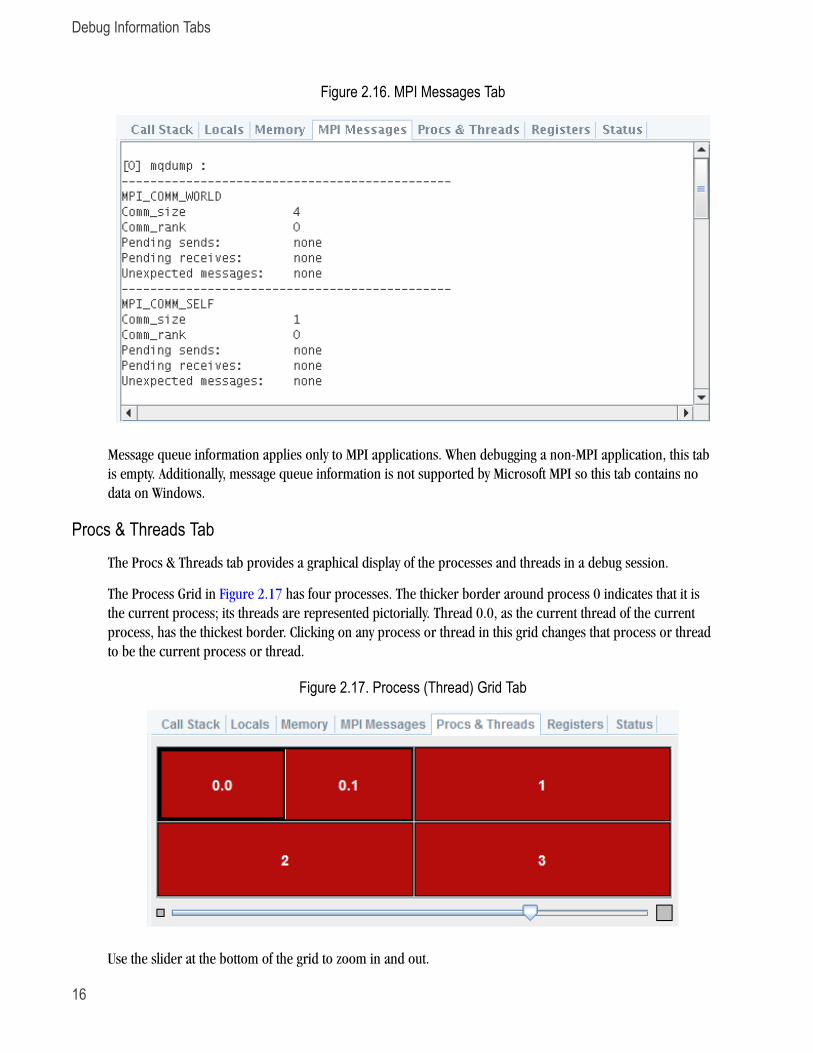
Debug Information Tabs
16
Figure 2.16. MPI Messages Tab
Message queue information applies only to MPI applications. When debugging a non-MPI application, this tab
is empty. Additionally, message queue information is not supported by Microsoft MPI so this tab contains no
data on Windows.
Procs & Threads TabThe Procs & Threads tab provides a graphical display of the processes and threads in a debug session.
The Process Grid in Figure 2.17 has four processes. The thicker border around process 0 indicates that it is
the current process; its threads are represented pictorially. Thread 0.0, as the current thread of the current
process, has the thickest border. Clicking on any process or thread in this grid changes that process or thread
to be the current process or thread.
Figure 2.17. Process (Thread) Grid Tab
Use the slider at the bottom of the grid to zoom in and out.
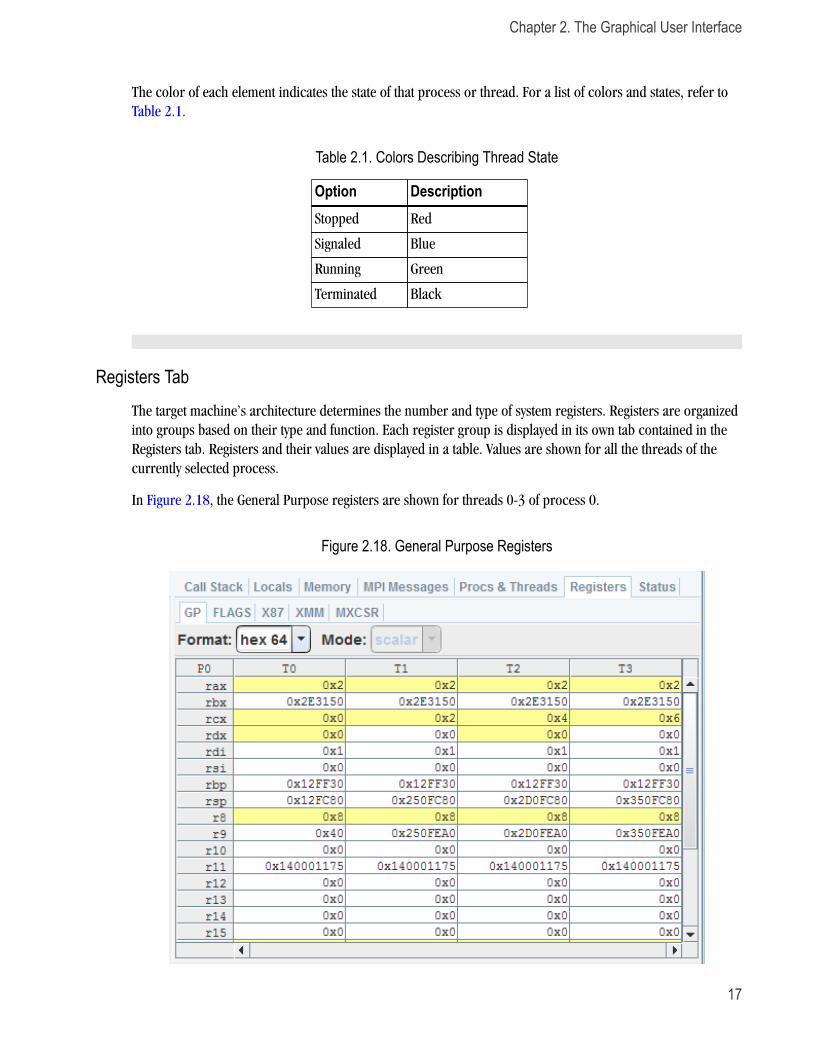
Chapter 2. The Graphical User Interface
17
The color of each element indicates the state of that process or thread. For a list of colors and states, refer to
Table 2.1.
Table 2.1. Colors Describing Thread State
Option DescriptionStopped Red
Signaled Blue
Running Green
Terminated Black
Registers Tab
The target machine’s architecture determines the number and type of system registers. Registers are organized
into groups based on their type and function. Each register group is displayed in its own tab contained in the
Registers tab. Registers and their values are displayed in a table. Values are shown for all the threads of the
currently selected process.
In Figure 2.18, the General Purpose registers are shown for threads 0-3 of process 0.
Figure 2.18. General Purpose Registers
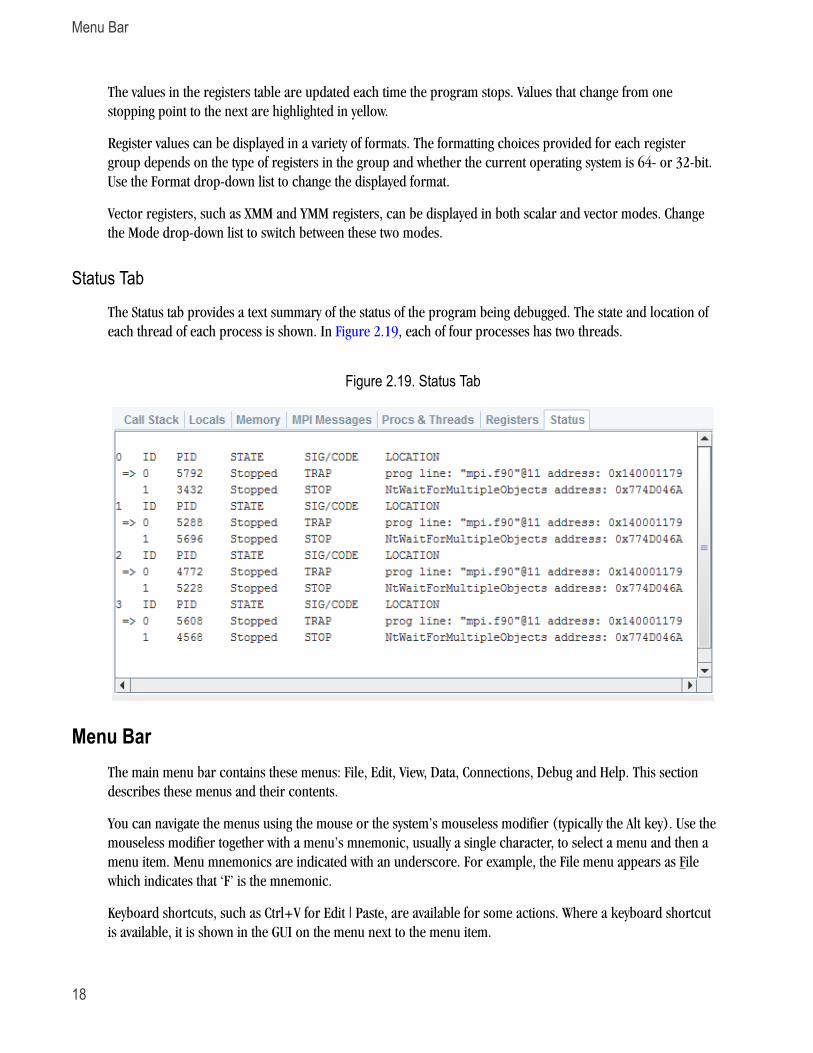
Menu Bar
18
The values in the registers table are updated each time the program stops. Values that change from one
stopping point to the next are highlighted in yellow.
Register values can be displayed in a variety of formats. The formatting choices provided for each register
group depends on the type of registers in the group and whether the current operating system is 64- or 32-bit.
Use the Format drop-down list to change the displayed format.
Vector registers, such as XMM and YMM registers, can be displayed in both scalar and vector modes. Change
the Mode drop-down list to switch between these two modes.
Status Tab
The Status tab provides a text summary of the status of the program being debugged. The state and location of
each thread of each process is shown. In Figure 2.19, each of four processes has two threads.
Figure 2.19. Status Tab
Menu BarThe main menu bar contains these menus: File, Edit, View, Data, Connections, Debug and Help. This section
describes these menus and their contents.
You can navigate the menus using the mouse or the system’s mouseless modifier (typically the Alt key). Use the
mouseless modifier together with a menu’s mnemonic, usually a single character, to select a menu and then a
menu item. Menu mnemonics are indicated with an underscore. For example, the File menu appears as File
which indicates that ‘F’ is the mnemonic.
Keyboard shortcuts, such as Ctrl+V for Edit | Paste, are available for some actions. Where a keyboard shortcut
is available, it is shown in the GUI on the menu next to the menu item.
Chapter 2. The Graphical User Interface
19
Menu items that contain an ellipsis (…) launch a dialog box to assist in performing the menu’s action.
File Menu
Open
The Open menu option has been deprecated. Use the Program field on the Connections tab to specify the
executable you want to debug; then click the Open button.
Attach
The Attach menu option has been deprecated. To attach to a locally running process, select the Attach
check box on the Connections tab. Then use the Program and PID fields to specify the process to which to
attach.
Detach
The Detach menu option has been deprecated. To stop debugging during an attached session, select the
Detach option on the Debug menu or click the Detach (Stop) button on the main tool bar.
Exit
End the current debug session and close all windows.
Edit Menu
Copy
Copy selected text to the system’s clipboard.
Paste
Paste selected text to the system’s clipboard.
Search Forward…
Perform a forward string search in the currently displayed source file.
Search Backward…
Perform a backward string search in the currently displayed source file.
Search Again
Repeat the last search that was performed in the source panel.
Locate Routine…
Find a routine. If symbol and source information is available for the specified routine, the routine is
displayed in the source panel.
Restore Default Settings
Restore the GUI‘s various settings to their initial default state illustrated in Figure 2.1, “Default Appearance
of PGDBG GUI,” on page 7.
Revert to Saved Settings
Restore the GUI to the state that it was in at the start of the debug session.
Save Settings on Exit
By default, PGDBG saves the state (size and settings) of the GUI on exit on a per-system basis. To prevent
settings from being saved from one invocation of PGDBG to another, uncheck this option. This option must
be unchecked prior to every exit since PGDBG always defaults to saving the GUI state.
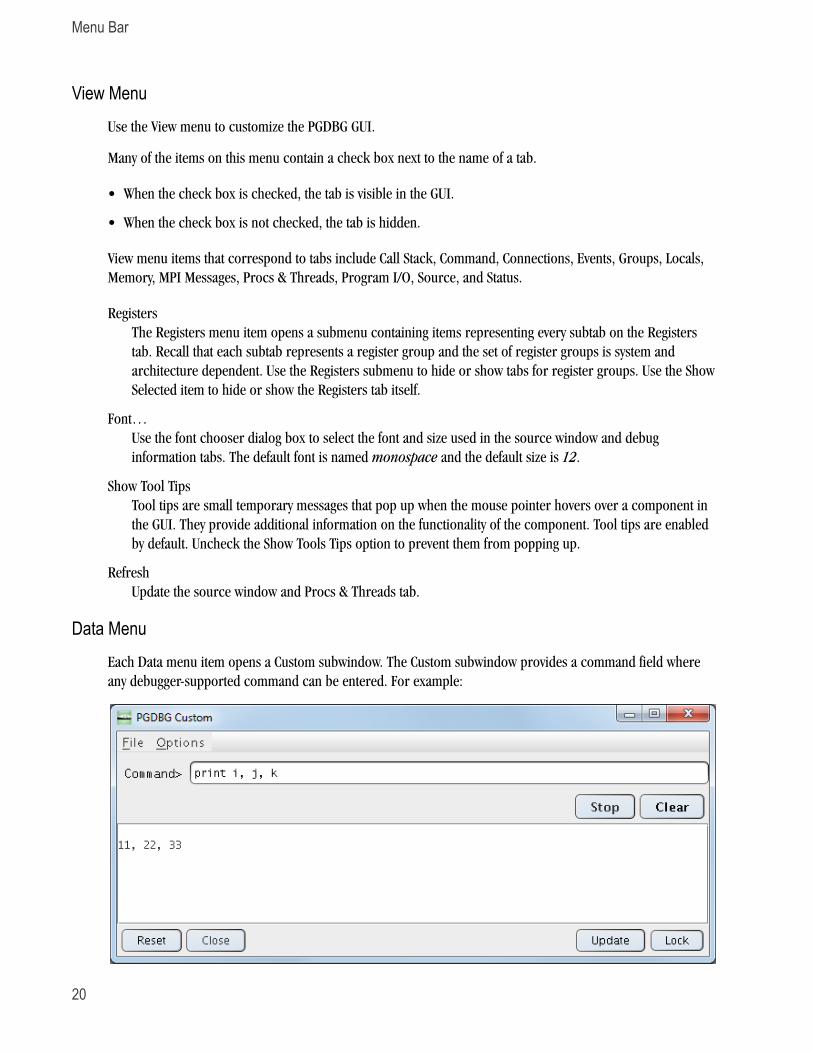
Menu Bar
20
View MenuUse the View menu to customize the PGDBG GUI.
Many of the items on this menu contain a check box next to the name of a tab.
• When the check box is checked, the tab is visible in the GUI.
• When the check box is not checked, the tab is hidden.
View menu items that correspond to tabs include Call Stack, Command, Connections, Events, Groups, Locals,
Memory, MPI Messages, Procs & Threads, Program I/O, Source, and Status.
Registers
The Registers menu item opens a submenu containing items representing every subtab on the Registers
tab. Recall that each subtab represents a register group and the set of register groups is system and
architecture dependent. Use the Registers submenu to hide or show tabs for register groups. Use the Show
Selected item to hide or show the Registers tab itself.
Font…
Use the font chooser dialog box to select the font and size used in the source window and debug
information tabs. The default font is named monospace and the default size is 12.
Show Tool Tips
Tool tips are small temporary messages that pop up when the mouse pointer hovers over a component in
the GUI. They provide additional information on the functionality of the component. Tool tips are enabled
by default. Uncheck the Show Tools Tips option to prevent them from popping up.
Refresh
Update the source window and Procs & Threads tab.
Data MenuEach Data menu item opens a Custom subwindow. The Custom subwindow provides a command field where
any debugger-supported command can be entered. For example:
Chapter 2. The Graphical User Interface
21
The Custom menu item is always enabled. It opens a Custom subwindow with a blank Command field. All the
other Data menu items are enabled only when text (usually data) is selected in the display tabs. To select text,
first click on a line in the Source, Disassembly or Mixed tab. Within the selected line, highlight a section of the
text. With the text highlighted, open the Data menu and select the desired option.
Print the value of the selected item.
Print *
Dereference and print the value of the selected item.
String
Treat the selected value as a string and print its value.
Bin
Print the value of the selected item as a base-2 integer.
Oct
Print the value of the selected item as an octal integer.
Hex
Print the value of the selected item as a hexadecimal integer.
Dec
Print the value of the selected item as a decimal integer.
Ascii
Print the ASCII value of the selected item.
Addr
Print the address of the selected item.
Type Of
Print data type information for the selected item.
Custom
Open an empty Custom subwindow. Execute any supported debugging command in its Command field.
Connections MenuUse the items under this menu to manage the connections displayed in the Connections list on the Connections
tab.
Connect Default
Open the currently displayed connection. When the debugger starts, this connection is named ‘Default.’
When a different connection is selected, the name of this menu option changes to reflect the name of the
selected connection. This menu option works the same way that the Open button on the Connections tab
works.
New
Create a new connection.
Save
Save changes to all the connections.
Menu Bar
22
Save As
Save the selected connection as a new connection.
Rename
Change the name of the selected connection.
Delete
Delete the selected connection.
Debug Menu
The items under this menu control the execution of the program.
Start Debugging (Continue)
Run (continue running) the program. The text of this menu option changes depending on whether the
program is currently running.
Stop Debugging
Stop debugging the program.
Stop Program
Stop the running program.This action halts the running processes or threads. For more information, refer
to the halt command.
Restart Program
Start the program from the beginning.
Set Program Arguments
This menu option has been deprecated. Use the Program Args field on the Connections tab to specify the
arguments to the program being debugged.
Step
Continue and stop after executing one source line or one assembly-level instruction depending on whether
the Source, Disassembly or Mixed tab is displayed. Step steps into called routines. For more information,
refer to the step and stepi commands.
Next
Continue and stop after executing one source line or one assembly-level instruction depending on whether
the Source, Disassembly or Mixed tab is displayed. Next steps over called routines. For more information,
refer to the next and nexti commands.
Step Out
Continue and stop after returning to the caller of the current routine. For more information, refer to the
stepout command.
Set Breakpoint…
Set a breakpoint at the first executable source line in the specified routine.
Call…
Specify a routine to call. For more information, refer to the call command.
Chapter 2. The Graphical User Interface
23
Display Current Location
Display the current program location in the Source panel. For more information, refer to the arrive
command.
Up
Enter the scope of the routine up one level in the call stack. For more information, refer to the up
command.
Down
Enter the scope of the routine down one level in the call stack. For more information, refer to the down
command.
Help Menu
Debugger Guide
Launch your system’s PDF reader to view the PGDBG Debugger Guide (this document).
About PGDBG…
This option displays a dialog box with version and copyright information on PGDBG. It also contains sales
and support points of contact.

24
25
Chapter 3. Command Line OptionsPGDBG accepts a variety of options when the debugger is invoked from the command line. This chapter
describes these options and how they can be used.
Command-Line Options Syntax% pgdbg arguments program arg1arg2 ... argn
The optional arguments may be any of the command-line arguments described in this chapter. The program
parameter is the name of the executable file being debugged. The optional arguments arg1 arg2 … argn are
the command-line arguments to the program.
Command-Line Options-attach <pid>
Attach to a running process with the process ID <pid>.
-c <pgdbg_cmd>
Execute the debugger command pgdbg_cmd before executing the commands in the startup file.
-cd <workdir>
Sets the working directory to the specified directory.
-core <corefile>
Analyze the core dump named corefile. [Linux only]
-emacs
Invoke the debugger using the Emacs GUD interface.
–help
Display a list of command-line arguments (this list).
–I <directory>
Add <directory> to the list of directories that PGDBG uses to search for source files. You can use this
option multiple times to add multiple directories to the search path.
-jarg, <javaarg>
Pass specified argument(s) (separated by commas) to java, e.g. -jarg,-Xmx256m.
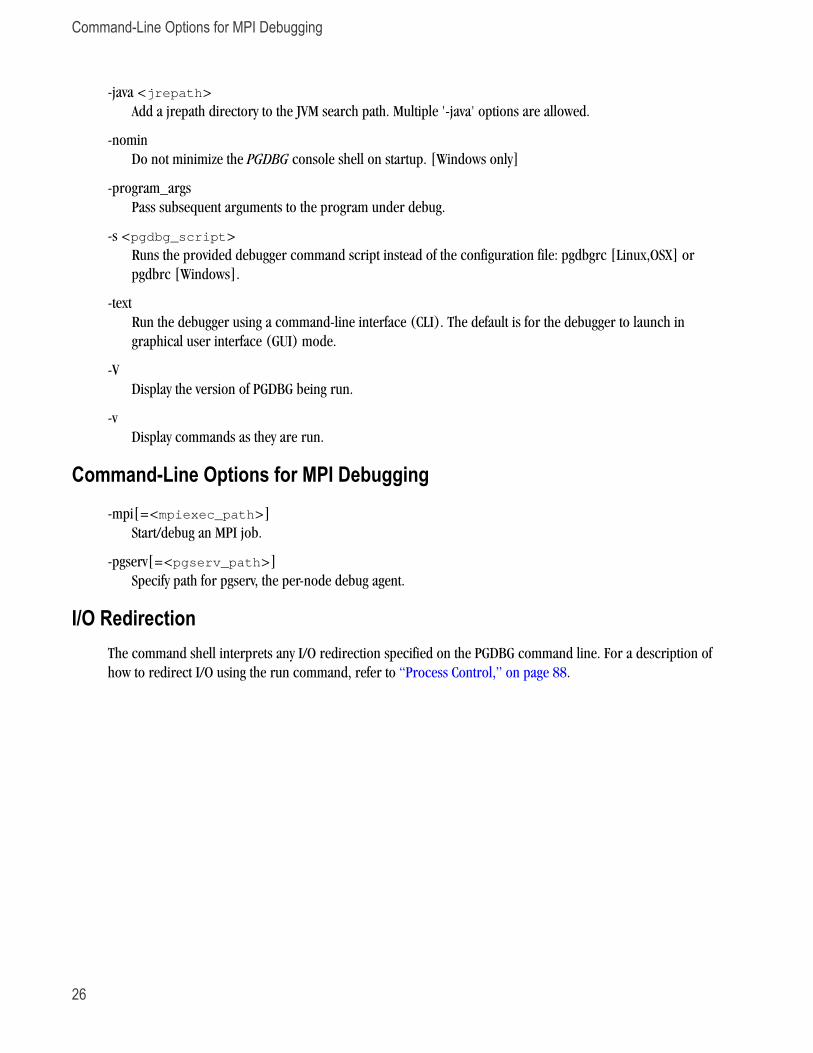
Command-Line Options for MPI Debugging
26
-java <jrepath>
Add a jrepath directory to the JVM search path. Multiple '-java' options are allowed.
-nomin
Do not minimize the PGDBG console shell on startup. [Windows only]
-program_args
Pass subsequent arguments to the program under debug.
-s <pgdbg_script>
Runs the provided debugger command script instead of the configuration file: pgdbgrc [Linux,OSX] or
pgdbrc [Windows].
-text
Run the debugger using a command-line interface (CLI). The default is for the debugger to launch in
graphical user interface (GUI) mode.
-V
Display the version of PGDBG being run.
-v
Display commands as they are run.
Command-Line Options for MPI Debugging-mpi[=<mpiexec_path>]
Start/debug an MPI job.
-pgserv[=<pgserv_path>]
Specify path for pgserv, the per-node debug agent.
I/O RedirectionThe command shell interprets any I/O redirection specified on the PGDBG command line. For a description of
how to redirect I/O using the run command, refer to “Process Control,” on page 88.
27
Chapter 4. Command LanguagePGDBG supports a command language that is capable of evaluating complex expressions. The command
language is composed of commands, constants, symbols, locations, expressions, and statements.
You can use the command language by invoking the PGDBG command-line interface with the –text
option, or in the Command tab of the PGDBG graphical user interface, as described in “The Graphical User
Interface”.
Command OverviewCommands are named operations, which take zero or more arguments and perform some action. Commands
may also return values that may be used in expressions or as arguments to other commands.
Command SyntaxCommands are entered one line at a time.
• Lines are delimited by a carriage return.
• Each line must consist of a command and its arguments, if any.
• You can place multiple commands on a single line by using the semi-colon (;) as a delimiter.
Command ModesThere are two command modes: pgi and dbx.
• The pgi command mode maintains the original PGDBG command interface.
• In dbx mode, the debugger uses commands compatible with the Unix-based dbx debugger.
PGI and dbx commands are available in both command modes, but some command behavior may be slightly
different depending on the mode. The mode can be set while the debugger is running by using the pgienv
command.
ConstantsPGDBG supports C language style integer (hex, octal and decimal), floating point, character, and string
constants.
Symbols
28
SymbolsPGDBG uses the symbolic information contained in the executable object file to create a symbol table for the
target program. The symbol table contains symbols to represent source files, subroutines, types (including
structure, union, pointer, array, and enumeration types), variables, and arguments. The PGDBG command-line
interface is case-sensitive with respect to symbol names; a symbol name on the command line must match the
name as it appears in the object file.
Scope RulesSince several symbols in a single application may have the same name, scope rules are used to bind program
identifiers to symbols in the symbol table. PGDBG uses the concept of a search scope for looking up
identifiers. The search scope represents a subroutine, a source file, or global scope. When the user enters
a name, PGDBG first tries to find the symbol in the search scope. If the symbol is not found, the containing
scope (source file or global) is searched, and so forth, until either the symbol is located or the global scope is
searched and the symbol is not found.
Normally, the search scope is the same as the current scope, which is the subroutine where execution is
currently stopped. The current scope and the search scope are both set to the current subroutine each time
execution of the program stops. However, you can use the enter command to change the search scope.
A scope qualifier operator @ allows selection of out-of-scope identifiers. For example, if f is a routine with a
local variable i, then:
f@i
represents the variable i local to f. Identifiers at file scope can be specified using the quoted file name with this
operator. The following example represents the variable i defined in file xyz.c.
"xyz.c"@i
Register SymbolsTo provide access to the system registers, PGDBG maintains symbols for them. Register names generally begin
with $ to avoid conflicts with program identifiers. Each register symbol has a default type associated with it,
and registers are treated like global variables of that type, except that their address may not be taken. For more
information on register symbols, refer to “SSE Register Symbols,” on page 53.
Source Code LocationsSome commands must refer to source code locations. Source file names must be enclosed in double quotes.
Source lines are indicated by number, and may be qualified by a quoted filename using the scope qualifier
operator. Further, a range of lines is indicated using the range operator ":".
Here are some examples:
break 37 sets a breakpoint at line 37 of the current source file.
break "xyz.c"@37 sets a breakpoint at line 37 of the source file xyz.c.
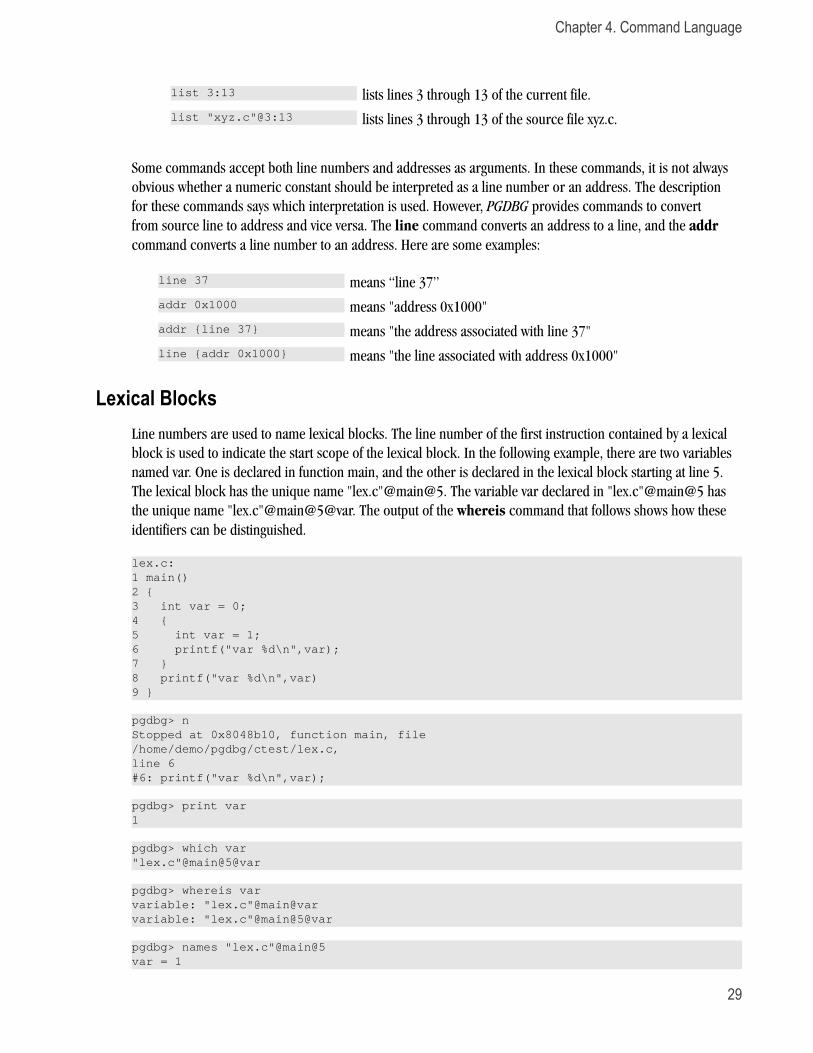
Chapter 4. Command Language
29
list 3:13 lists lines 3 through 13 of the current file.
list "xyz.c"@3:13 lists lines 3 through 13 of the source file xyz.c.
Some commands accept both line numbers and addresses as arguments. In these commands, it is not always
obvious whether a numeric constant should be interpreted as a line number or an address. The description
for these commands says which interpretation is used. However, PGDBG provides commands to convert
from source line to address and vice versa. The line command converts an address to a line, and the addr
command converts a line number to an address. Here are some examples:
line 37 means “line 37”
addr 0x1000 means "address 0x1000"
addr {line 37} means "the address associated with line 37"
line {addr 0x1000} means "the line associated with address 0x1000"
Lexical BlocksLine numbers are used to name lexical blocks. The line number of the first instruction contained by a lexical
block is used to indicate the start scope of the lexical block. In the following example, there are two variables
named var. One is declared in function main, and the other is declared in the lexical block starting at line 5.
The lexical block has the unique name "lex.c"@main@5. The variable var declared in "lex.c"@main@5 has
the unique name "lex.c"@main@5@var. The output of the whereis command that follows shows how these
identifiers can be distinguished.
lex.c:1 main()2 {3 int var = 0;4 {5 int var = 1;6 printf("var %d\n",var);7 }8 printf("var %d\n",var)9 }
pgdbg> nStopped at 0x8048b10, function main, file/home/demo/pgdbg/ctest/lex.c,line 6#6: printf("var %d\n",var);
pgdbg> print var1
pgdbg> which var"lex.c"@main@5@var
pgdbg> whereis varvariable: "lex.c"@main@varvariable: "lex.c"@main@5@var
pgdbg> names "lex.c"@main@5var = 1
Statements
30
StatementsAlthough PGDBG command-line input is processed one line at a time, statement constructs allow multiple
commands per line, as well as conditional and iterative execution. The statement constructs roughly
correspond to the analogous C language constructs. Statements may be of the following forms.
• Simple Statement: A command and its arguments. For example:
print i
• Block Statement: One or more statements separated by semicolons and enclosed in curly braces. Note:
these may only be used as arguments to commands or as part of if or while statements. For example:
if(i>1) {print i; step }
• If Statement: The keyword if, followed by a parenthesized expression, followed by a block statement,
followed by zero or more else if clauses, and at most one else clause. For example:
if(i>j) {print i} else if(i<j) {print j} else {print "i==j"}
• While Statement: The keyword while, followed by a parenthesized expression, followed by a block
statement. For example:
while(i==0) {next}
Multiple statements may appear on a line separated by a semicolon. The following example sets breakpoints in
routines main and xyz, continues, and prints the new current location.
break main; break xyz; cont; where
However, since the where command does not wait until the program has halted, this statement displays the
call stack at some arbitrary execution point in the program. To control when the call stack is printed, insert a
wait command, as shown in this example:
break main; break xyz; cont; wait; where
NoteAny value returned by the last statement on a line is printed.
Statements can be parallelized across multiple threads of execution. For more information, refer to “Parallel
Statements,” on page 79.
EventsBreakpoints, watchpoints, and other mechanisms used to define the response to certain conditions are
collectively called events.
• An event is defined by the conditions under which the event occurs and by the action taken when the event
occurs.
• A breakpoint occurs when execution reaches a particular address.
The default action for a breakpoint is simply to halt execution and prompt the user for commands.
Chapter 4. Command Language
31
• A watchpoint occurs when the value of an expression changes.
• A hardware watchpoint occurs when the specified memory location is accessed or modified.
Event CommandsPGDBG supports six basic commands for defining events. Each command takes a required argument and may
also take one or more optional arguments. The basic commands are break, watch, hwatch, trace, track,
and do.
Event Command Descriptions
• The break command takes an argument specifying a breakpoint location. Execution stops when that
location is reached.
• The watch command takes an expression argument. Execution stops and the new value is printed when the
value of the expression changes.
• The hwatch command takes a data address argument, which can be either an identifier or a variable name.
Execution stops when memory at that address is written.
• The trace command activates source line tracing, as specified by the arguments you supply.
• The track command is like watch except that execution continues after the new value is printed.
• The do command takes a list of commands as an argument. The commands are executed whenever the
event occurs.
Event Command Arguments
The six event commands share a common set of optional arguments. The optional arguments provide the
ability to make the event definition more specific. They are:
at line
Event occurs at indicated line.
at addr
Event occurs at indicated address.
in routine
Event occurs throughout indicated routine.
if (condition)
Event occurs only when condition is true.
do {commands}
When event occurs, execute commands.
The optional arguments may appear in any order after the required argument and should not be delimited by
commas.
Event Command Examples
Here are some event definition examples:
Events
32
watch i at 37 if(y>1) This event definition says to stop and print the value
of i whenever line 37 is executed and the value of y is
greater than 1.
do {print xyz} in f This event definition says that at each line in the routine
f print the value of xyz.
break func1 if (i==37) do {print a[37]; stack}
This event definition says to print the value of a[37]
and do a stack trace when i is equal to 37 in routine
func1.
Event Command ActionIt is useful to know when events take place.
• Event commands that do not explicitly define a location occur at each source line in the program. Here are
some examples:
do {where} prints the current location at the start of each source line.
trace a.b prints the value of a.b each time the value has changed.
track a.b prints the value of a.b at the start of each source line if the
value has changed.
Note
Events that occur at every line can be useful, but they can make program execution very slow.
Restricting an event to a particular address minimizes the impact on program execution speed, and
restricting an event that occurs at every line to a single routine causes execution to be slowed only
when that routine is executed.
• PGDBG supports instruction-level versions of several commands, such as breaki, watchi, tracei, tracki,
and doi. The basic difference in the instruction-level version is that these commands interpret integers as
addresses rather than line numbers, and events occur at each instruction rather than at each line.
• When multiple events occur at the same location, all event actions are taken before the prompt for input.
Defining event actions that resume execution is allowed but discouraged, since continuing execution may
prevent or defer other event actions.
For example, the following syntax creates an ambiguous situation:
break 37 do {continue}
break 37 do {print i}
With this sequence, it is not clear whether i will ever be printed.
• Events only occur after the continue and run commands. They are ignored by step, next, call, and other
commands.
• Identifiers and line numbers in events are bound to the current scope when the event is defined.
Chapter 4. Command Language
33
For example, the following command sets a breakpoint at line 37 in the current file.
break 37
The following command tracks the value of whatever variable i is currently in scope.
track i
If i is a local variable, then it is wise to add a location modifier (at or in) to restrict the event to a scope
where i is defined. Scope qualifiers can also specify lines or variables that are not currently in scope. Events
can be parallelized across multiple threads of execution. See “Parallel Events,” on page 78 for details.
ExpressionsThe debugger supports evaluation of expressions composed of constants, identifiers, commands that return
values, and operators.
The following rules apply:
• To use a value returned by a command in an expression, the command and arguments must be enclosed in
curly braces.
For example, the following command invokes the pc command to compute the current address, adds 8 to
it, and sets a breakpoint at that address.
breaki {pc}+8
Similarly, the following command compares the start address of the current routine with the start address of
routine xyz. It prints the value 1 if they are equal and 0 if they are not.
print {addr {func}}=={addr xyz}
• The @ operator, introduced previously, may be used as a scope qualifier. Its precedence is the same as the
C language field selection operators "." and "->" .
• PGDBG recognizes a range operator ":" which indicates array sub-ranges or source line ranges. The
precedence of ':' is between '||' and '='.
Here are a few examples that use the range operator:
print a[1:10] prints elements 1 through 10 of the array a.
list 5:10 lists source lines 5 through 10.
list "xyz.c"@5:10 lists lines 5 through 10 in file xyz.c.
The general format for the range operator is [ lo : hi : step] where:
lo is the array or range lower bound for this expression.
hi is the array or range upper bound for this expression.
step is the step size between elements.
• An expression can be evaluated across many threads of execution by using a prefix p/t-set. For more details,
refer to “Current vs. Prefix p/t-set,” on page 67.
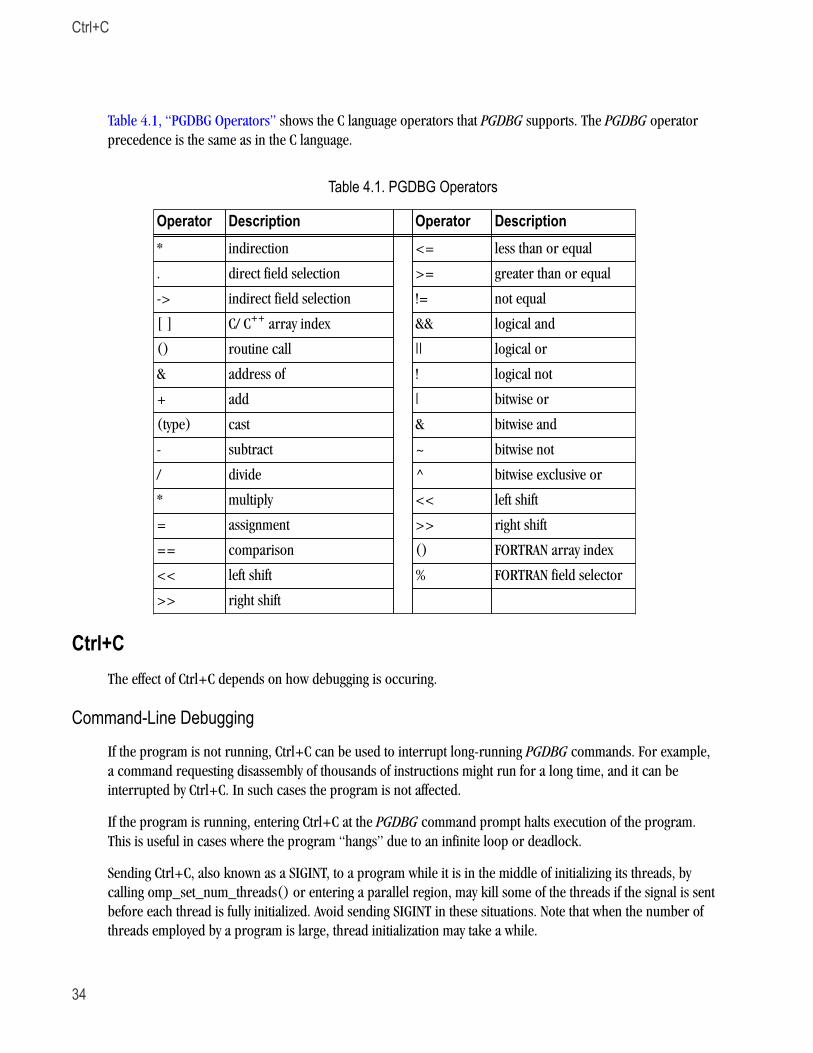
Ctrl+C
34
Table 4.1, “PGDBG Operators” shows the C language operators that PGDBG supports. The PGDBG operator
precedence is the same as in the C language.
Table 4.1. PGDBG Operators
Operator Description Operator Description* indirection <= less than or equal
. direct field selection >= greater than or equal
-> indirect field selection != not equal
[ ] C/ C++ array index && logical and
() routine call || logical or
& address of ! logical not
+ add | bitwise or
(type) cast & bitwise and
- subtract ~ bitwise not
/ divide ^ bitwise exclusive or
* multiply << left shift
= assignment >> right shift
== comparison () FORTRAN array index
<< left shift % FORTRAN field selector
>> right shift
Ctrl+CThe effect of Ctrl+C depends on how debugging is occuring.
Command-Line Debugging
If the program is not running, Ctrl+C can be used to interrupt long-running PGDBG commands. For example,
a command requesting disassembly of thousands of instructions might run for a long time, and it can be
interrupted by Ctrl+C. In such cases the program is not affected.
If the program is running, entering Ctrl+C at the PGDBG command prompt halts execution of the program.
This is useful in cases where the program “hangs” due to an infinite loop or deadlock.
Sending Ctrl+C, also known as a SIGINT, to a program while it is in the middle of initializing its threads, by
calling omp_set_num_threads() or entering a parallel region, may kill some of the threads if the signal is sent
before each thread is fully initialized. Avoid sending SIGINT in these situations. Note that when the number of
threads employed by a program is large, thread initialization may take a while.
Chapter 4. Command Language
35
GUI DebuggingIf the program is running, entering Ctrl+C in the Input field of the Program IO tab sends SIGINT to the
program.
MPI DebuggingSending Ctrl+C to a running MPICH-1 program is not recommended. For details, refer to “Use halt instead
of Ctrl+C,” on page 90. Use the PGDBG halt command as an alternative to sending Ctrl+C to a running
program. The PGDBG command prompt must be available in order to issue a halt command. The PGDBG
command prompt is available while threads are running if pgienv threadwait none is set.
As described in “Using Continue,” on page 91, when debugging an MPI job via the following command,
PGDBG spawns the job in a manner that prevents console-generated interrupts from directly reaching the MPI
job launcher or any of the MPI processes.
pgdbg -mpi ...
In this case, typing Ctrl+C only interrupts PGDBG, leaving the MPI processes running. When PGDBG’s thread
wait mode is not set to none, you can halt the MPI job after using Ctrl+C by entering PGDBG’s halt command,
even if no PGDBG prompt is generated.

36
37
Chapter 5. Command SummaryThis chapter contains a brief summary of the PGDBG debugger commands. For a detailed description of each
command, grouped by category of use, refer to Chapter 13, “Command Reference”.
If you are viewing an online version of this manual, you can select the hyperlink under the selection category to
jump to that section in the manual.
Notation Used in Command SectionsThe command sections that follow use these conventions for the command names and arguments, when the
command accepts one.
• Command names may be abbreviated by omitting the portion of the command name enclosed in brackets
([]).
• Argument names are chosen to indicate what kind of argument is expected.
• Arguments enclosed in brackets([]) are optional.
• Two or more arguments separated by a vertical line (|) indicate that any one of the arguments is acceptable.
• An ellipsis (...) indicates an arbitrarily long list of arguments.
• Other punctuation (commas, quotes, etc.) should be entered as shown.
For example, the following syntax indicates that the command list may be abbreviated to lis, and that it can
be invoked without any arguments or with one of the following arguments: an integer count, a line range, a
routine name, or a line and a count.
lis[t] [count | lo:hi | routine | line,count]
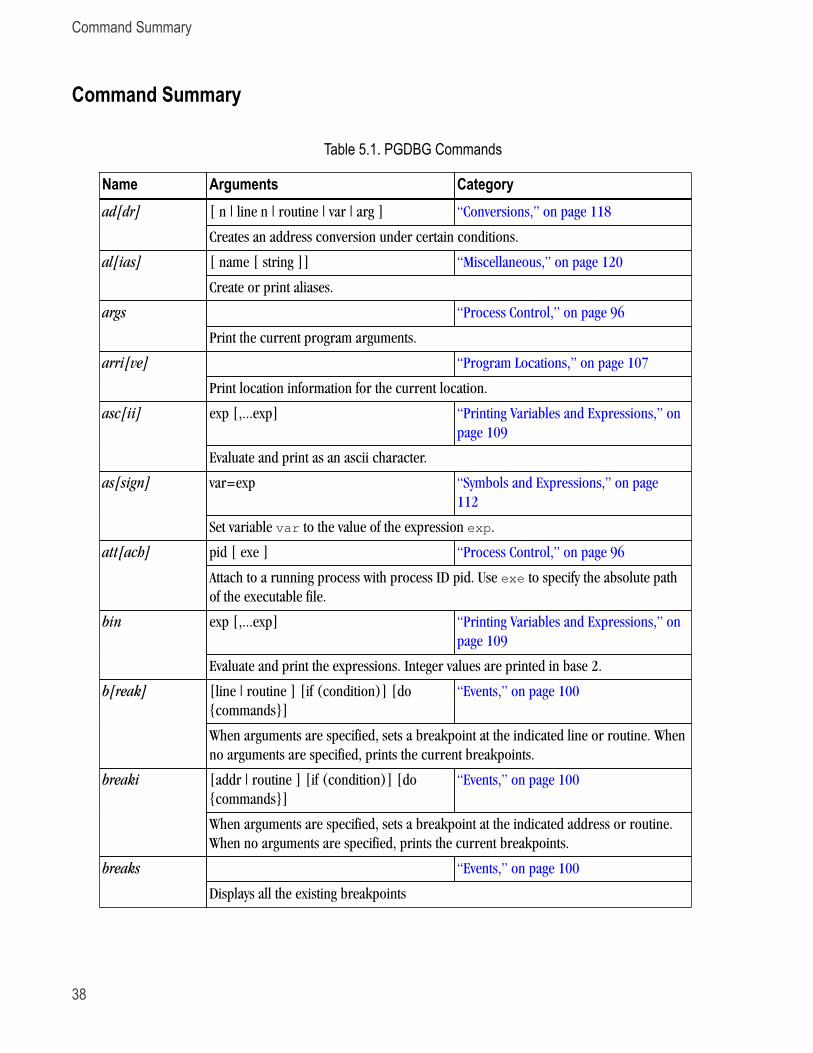
Command Summary
38
Command Summary
Table 5.1. PGDBG Commands
Name Arguments Category[ n | line n | routine | var | arg ] “Conversions,” on page 118ad[dr]
Creates an address conversion under certain conditions.
[ name [ string ]] “Miscellaneous,” on page 120al[ias]
Create or print aliases.
“Process Control,” on page 96args
Print the current program arguments.
“Program Locations,” on page 107arri[ve]
Print location information for the current location.
exp [,...exp] “Printing Variables and Expressions,” on
page 109
asc[ii]
Evaluate and print as an ascii character.
var=exp “Symbols and Expressions,” on page
112
as[sign]
Set variable var to the value of the expression exp.
pid [ exe ] “Process Control,” on page 96att[ach]
Attach to a running process with process ID pid. Use exe to specify the absolute path
of the executable file.
exp [,...exp] “Printing Variables and Expressions,” on
page 109
bin
Evaluate and print the expressions. Integer values are printed in base 2.
[line | routine ] [if (condition)] [do
{commands}]
“Events,” on page 100b[reak]
When arguments are specified, sets a breakpoint at the indicated line or routine. When
no arguments are specified, prints the current breakpoints.
[addr | routine ] [if (condition)] [do
{commands}]
“Events,” on page 100breaki
When arguments are specified, sets a breakpoint at the indicated address or routine.
When no arguments are specified, prints the current breakpoints.
“Events,” on page 100breaks
Displays all the existing breakpoints
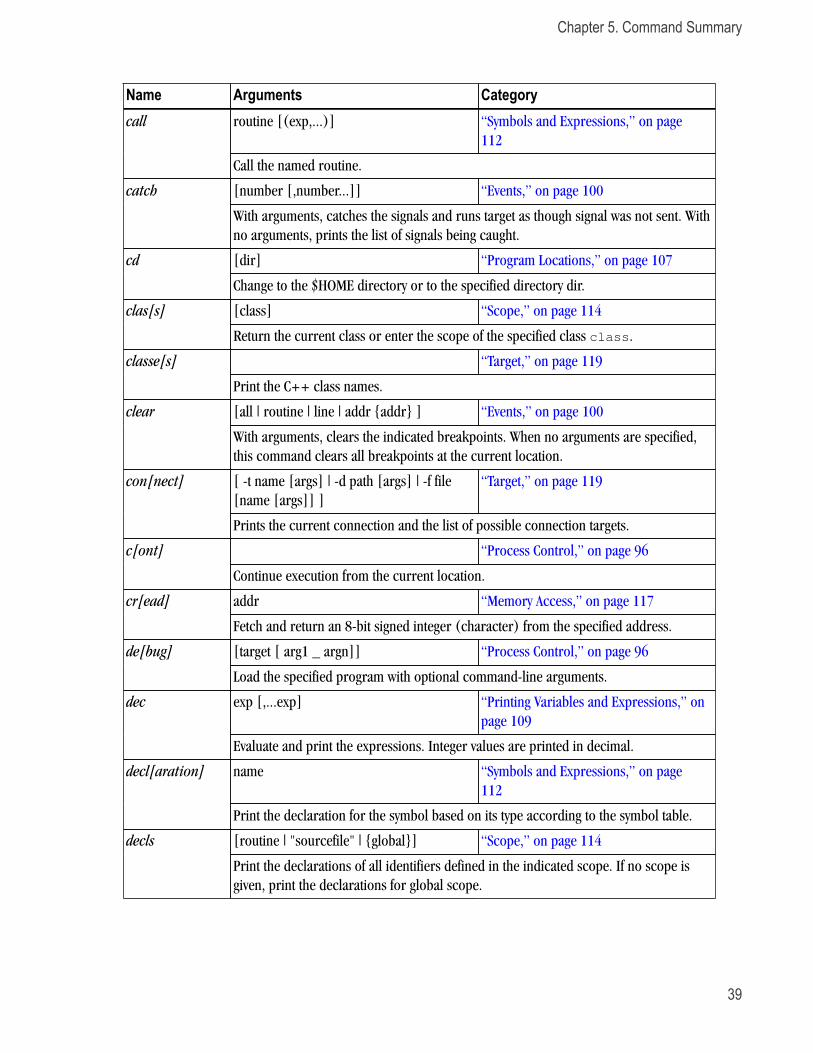
Chapter 5. Command Summary
39
Name Arguments Categoryroutine [(exp,...)] “Symbols and Expressions,” on page
112
call
Call the named routine.
[number [,number...]] “Events,” on page 100catch
With arguments, catches the signals and runs target as though signal was not sent. With
no arguments, prints the list of signals being caught.
[dir] “Program Locations,” on page 107cd
Change to the $HOME directory or to the specified directory dir.
[class] “Scope,” on page 114clas[s]
Return the current class or enter the scope of the specified class class.
“Target,” on page 119classe[s]
Print the C++ class names.
[all | routine | line | addr {addr} ] “Events,” on page 100clear
With arguments, clears the indicated breakpoints. When no arguments are specified,
this command clears all breakpoints at the current location.
[ -t name [args] | -d path [args] | -f file
[name [args]] ]
“Target,” on page 119con[nect]
Prints the current connection and the list of possible connection targets.
“Process Control,” on page 96c[ont]
Continue execution from the current location.
addr “Memory Access,” on page 117cr[ead]
Fetch and return an 8-bit signed integer (character) from the specified address.
[target [ arg1 _ argn]] “Process Control,” on page 96de[bug]
Load the specified program with optional command-line arguments.
dec exp [,...exp] “Printing Variables and Expressions,” on
page 109
Evaluate and print the expressions. Integer values are printed in decimal.
name “Symbols and Expressions,” on page
112
decl[aration]
Print the declaration for the symbol based on its type according to the symbol table.
[routine | "sourcefile" | {global}] “Scope,” on page 114decls
Print the declarations of all identifiers defined in the indicated scope. If no scope is
given, print the declarations for global scope.
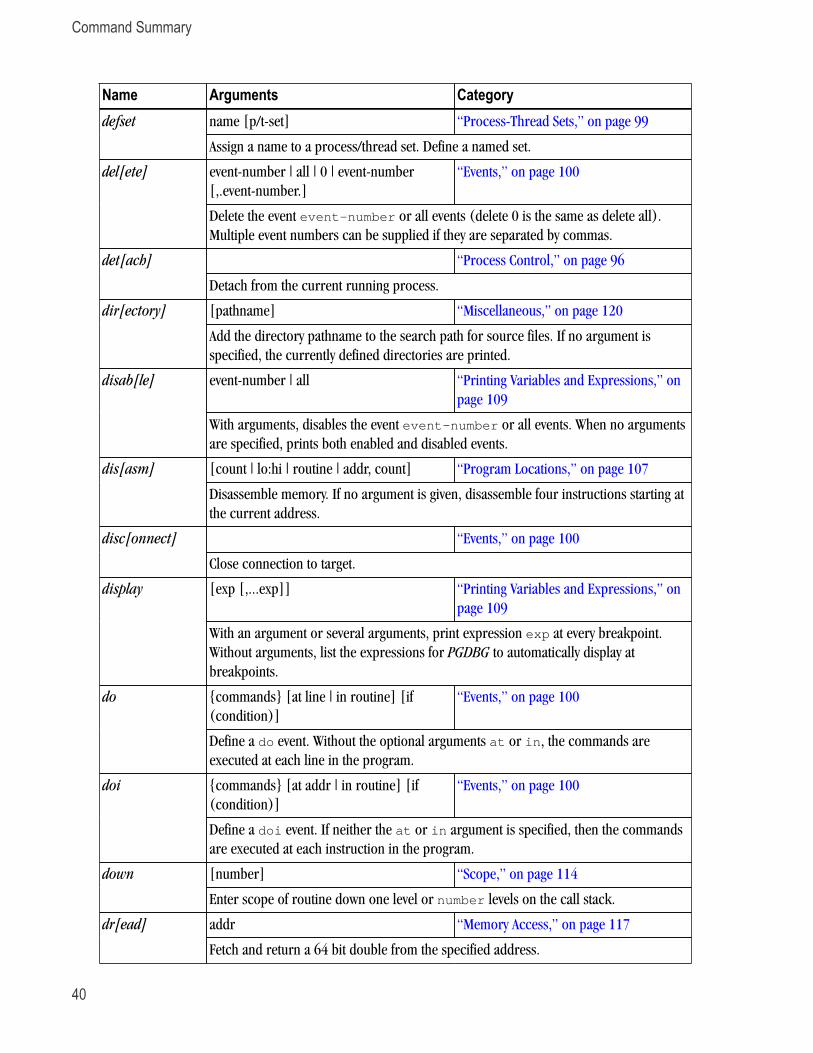
Command Summary
40
Name Arguments Categoryname [p/t-set] “Process-Thread Sets,” on page 99defset
Assign a name to a process/thread set. Define a named set.
event-number | all | 0 | event-number
[,.event-number.]
“Events,” on page 100del[ete]
Delete the event event-number or all events (delete 0 is the same as delete all).
Multiple event numbers can be supplied if they are separated by commas.
“Process Control,” on page 96det[ach]
Detach from the current running process.
[pathname] “Miscellaneous,” on page 120dir[ectory]
Add the directory pathname to the search path for source files. If no argument is
specified, the currently defined directories are printed.
event-number | all “Printing Variables and Expressions,” on
page 109
disab[le]
With arguments, disables the event event-number or all events. When no arguments
are specified, prints both enabled and disabled events.
[count | lo:hi | routine | addr, count] “Program Locations,” on page 107dis[asm]
Disassemble memory. If no argument is given, disassemble four instructions starting at
the current address.
“Events,” on page 100disc[onnect]
Close connection to target.
display [exp [,...exp]] “Printing Variables and Expressions,” on
page 109
With an argument or several arguments, print expression exp at every breakpoint.
Without arguments, list the expressions for PGDBG to automatically display at
breakpoints.
{commands} [at line | in routine] [if
(condition)]
“Events,” on page 100do
Define a do event. Without the optional arguments at or in, the commands are
executed at each line in the program.
{commands} [at addr | in routine] [if
(condition)]
“Events,” on page 100doi
Define a doi event. If neither the at or in argument is specified, then the commands
are executed at each instruction in the program.
[number] “Scope,” on page 114down
Enter scope of routine down one level or number levels on the call stack.
addr “Memory Access,” on page 117dr[ead]
Fetch and return a 64 bit double from the specified address.
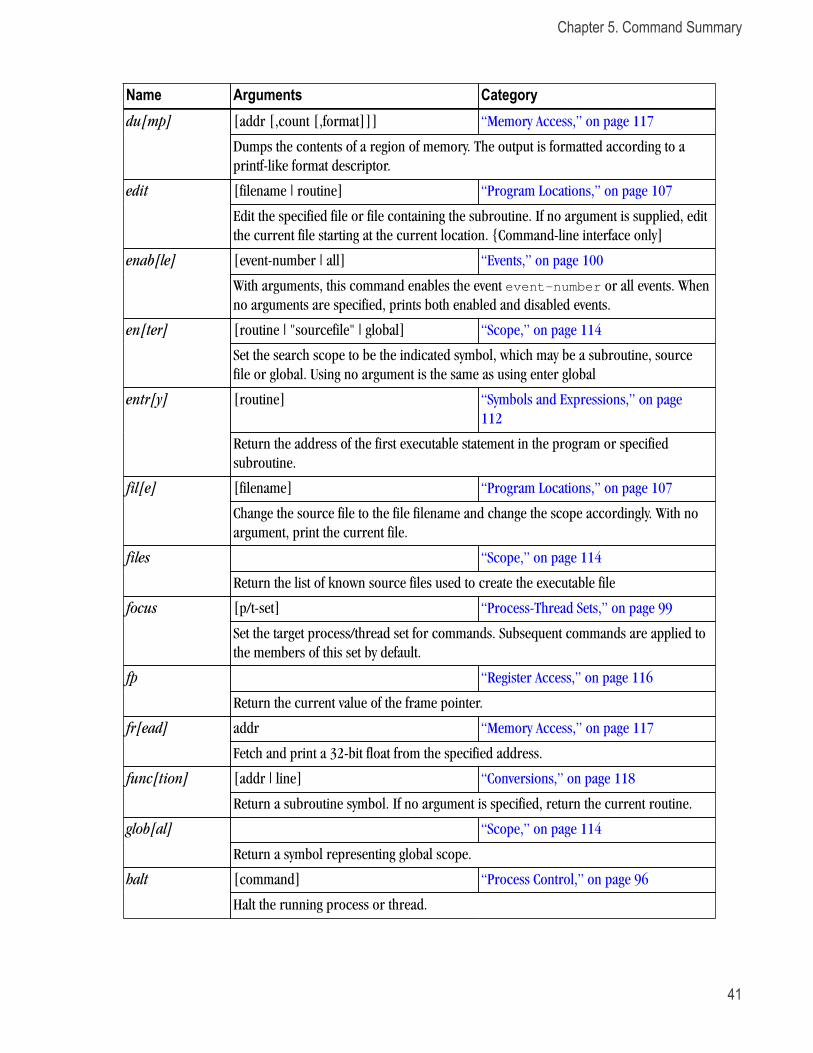
Chapter 5. Command Summary
41
Name Arguments Category[addr [,count [,format]]] “Memory Access,” on page 117du[mp]
Dumps the contents of a region of memory. The output is formatted according to a
printf-like format descriptor.
[filename | routine] “Program Locations,” on page 107edit
Edit the specified file or file containing the subroutine. If no argument is supplied, edit
the current file starting at the current location. {Command-line interface only]
[event-number | all] “Events,” on page 100enab[le]
With arguments, this command enables the event event-number or all events. When
no arguments are specified, prints both enabled and disabled events.
en[ter] [routine | "sourcefile" | global] “Scope,” on page 114
Set the search scope to be the indicated symbol, which may be a subroutine, source
file or global. Using no argument is the same as using enter global
[routine] “Symbols and Expressions,” on page
112
entr[y]
Return the address of the first executable statement in the program or specified
subroutine.
[filename] “Program Locations,” on page 107fil[e]
Change the source file to the file filename and change the scope accordingly. With no
argument, print the current file.
“Scope,” on page 114files
Return the list of known source files used to create the executable file
[p/t-set] “Process-Thread Sets,” on page 99focus
Set the target process/thread set for commands. Subsequent commands are applied to
the members of this set by default.
“Register Access,” on page 116fp
Return the current value of the frame pointer.
addr “Memory Access,” on page 117fr[ead]
Fetch and print a 32-bit float from the specified address.
[addr | line] “Conversions,” on page 118func[tion]
Return a subroutine symbol. If no argument is specified, return the current routine.
“Scope,” on page 114glob[al]
Return a symbol representing global scope.
[command] “Process Control,” on page 96halt
Halt the running process or thread.
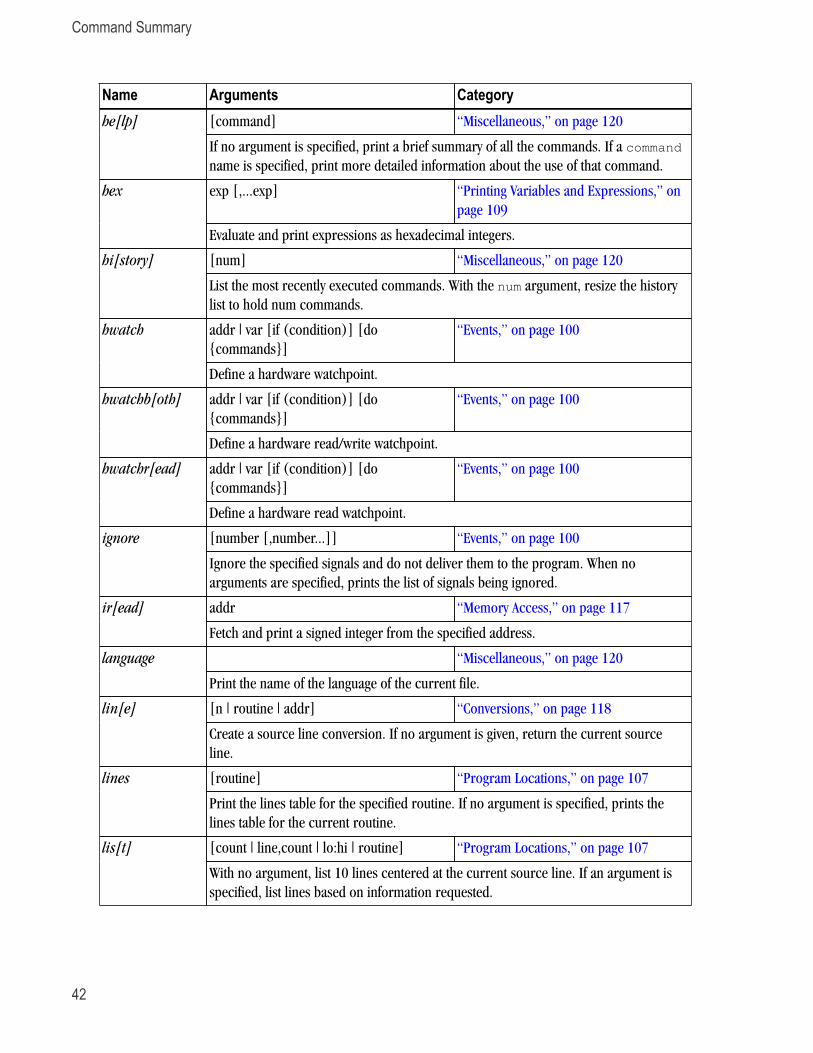
Command Summary
42
Name Arguments Category[command] “Miscellaneous,” on page 120he[lp]
If no argument is specified, print a brief summary of all the commands. If a command
name is specified, print more detailed information about the use of that command.
hex exp [,...exp] “Printing Variables and Expressions,” on
page 109
Evaluate and print expressions as hexadecimal integers.
[num] “Miscellaneous,” on page 120hi[story]
List the most recently executed commands. With the num argument, resize the history
list to hold num commands.
addr | var [if (condition)] [do
{commands}]
“Events,” on page 100hwatch
Define a hardware watchpoint.
addr | var [if (condition)] [do
{commands}]
“Events,” on page 100hwatchb[oth]
Define a hardware read/write watchpoint.
addr | var [if (condition)] [do
{commands}]
“Events,” on page 100hwatchr[ead]
Define a hardware read watchpoint.
[number [,number...]] “Events,” on page 100ignore
Ignore the specified signals and do not deliver them to the program. When no
arguments are specified, prints the list of signals being ignored.
addr “Memory Access,” on page 117ir[ead]
Fetch and print a signed integer from the specified address.
“Miscellaneous,” on page 120language
Print the name of the language of the current file.
[n | routine | addr] “Conversions,” on page 118lin[e]
Create a source line conversion. If no argument is given, return the current source
line.
[routine] “Program Locations,” on page 107lines
Print the lines table for the specified routine. If no argument is specified, prints the
lines table for the current routine.
[count | line,count | lo:hi | routine] “Program Locations,” on page 107lis[t]
With no argument, list 10 lines centered at the current source line. If an argument is
specified, list lines based on information requested.
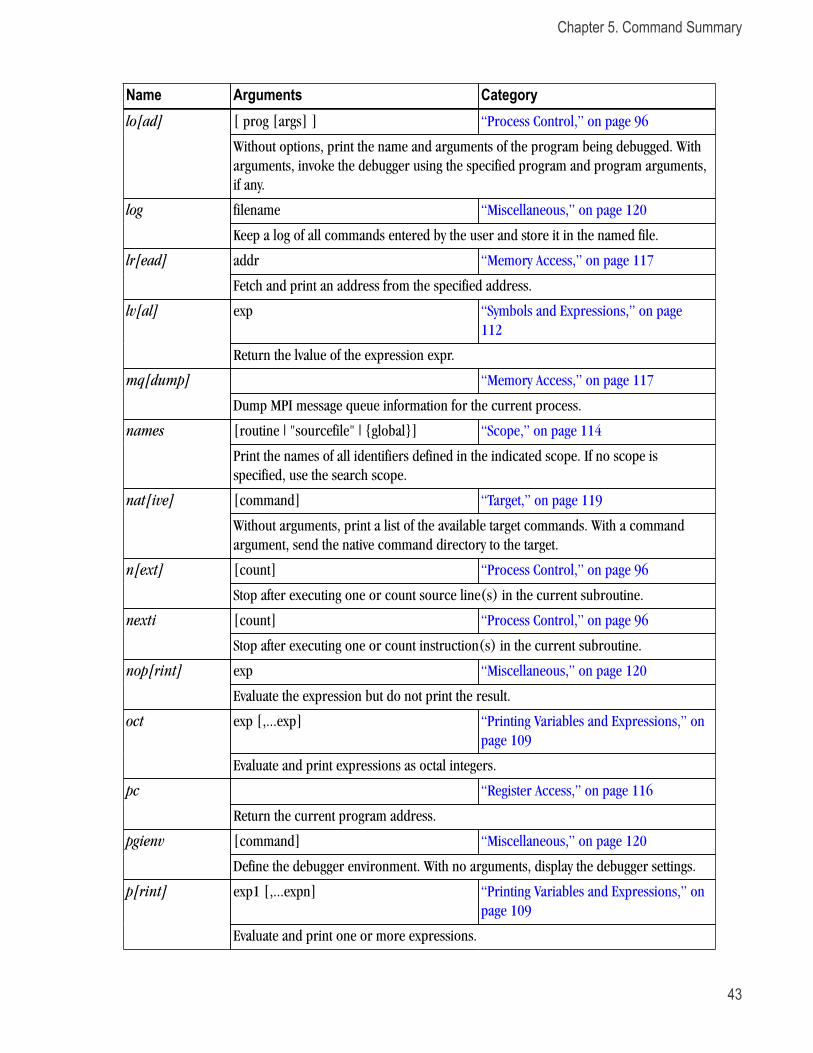
Chapter 5. Command Summary
43
Name Arguments Category[ prog [args] ] “Process Control,” on page 96lo[ad]
Without options, print the name and arguments of the program being debugged. With
arguments, invoke the debugger using the specified program and program arguments,
if any.
filename “Miscellaneous,” on page 120log
Keep a log of all commands entered by the user and store it in the named file.
addr “Memory Access,” on page 117lr[ead]
Fetch and print an address from the specified address.
exp “Symbols and Expressions,” on page
112
lv[al]
Return the lvalue of the expression expr.
“Memory Access,” on page 117mq[dump]
Dump MPI message queue information for the current process.
[routine | "sourcefile" | {global}] “Scope,” on page 114names
Print the names of all identifiers defined in the indicated scope. If no scope is
specified, use the search scope.
[command] “Target,” on page 119nat[ive]
Without arguments, print a list of the available target commands. With a command
argument, send the native command directory to the target.
[count] “Process Control,” on page 96n[ext]
Stop after executing one or count source line(s) in the current subroutine.
[count] “Process Control,” on page 96nexti
Stop after executing one or count instruction(s) in the current subroutine.
exp “Miscellaneous,” on page 120nop[rint]
Evaluate the expression but do not print the result.
exp [,...exp] “Printing Variables and Expressions,” on
page 109
oct
Evaluate and print expressions as octal integers.
“Register Access,” on page 116pc
Return the current program address.
[command] “Miscellaneous,” on page 120pgienv
Define the debugger environment. With no arguments, display the debugger settings.
exp1 [,...expn] “Printing Variables and Expressions,” on
page 109
p[rint]
Evaluate and print one or more expressions.
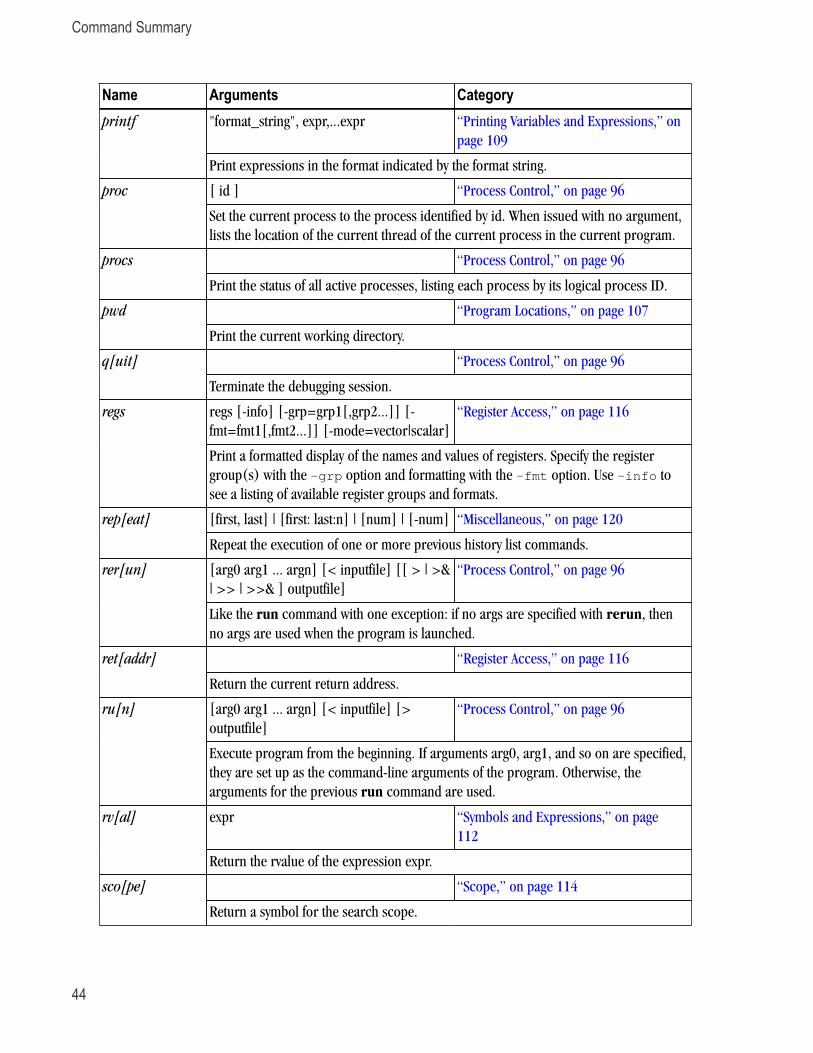
Command Summary
44
Name Arguments Category"format_string", expr,...expr “Printing Variables and Expressions,” on
page 109
printf
Print expressions in the format indicated by the format string.
[ id ] “Process Control,” on page 96proc
Set the current process to the process identified by id. When issued with no argument,
lists the location of the current thread of the current process in the current program.
“Process Control,” on page 96procs
Print the status of all active processes, listing each process by its logical process ID.
“Program Locations,” on page 107pwd
Print the current working directory.
“Process Control,” on page 96q[uit]
Terminate the debugging session.
regs [-info] [-grp=grp1[,grp2...]] [-
fmt=fmt1[,fmt2...]] [-mode=vector|scalar]
“Register Access,” on page 116regs
Print a formatted display of the names and values of registers. Specify the register
group(s) with the -grp option and formatting with the -fmt option. Use -info to
see a listing of available register groups and formats.
[first, last] | [first: last:n] | [num] | [-num] “Miscellaneous,” on page 120rep[eat]
Repeat the execution of one or more previous history list commands.
[arg0 arg1 ... argn] [< inputfile] [[ > | >&
| >> | >>& ] outputfile]
“Process Control,” on page 96rer[un]
Like the run command with one exception: if no args are specified with rerun, then
no args are used when the program is launched.
“Register Access,” on page 116ret[addr]
Return the current return address.
[arg0 arg1 ... argn] [< inputfile] [>
outputfile]
“Process Control,” on page 96ru[n]
Execute program from the beginning. If arguments arg0, arg1, and so on are specified,
they are set up as the command-line arguments of the program. Otherwise, the
arguments for the previous run command are used.
expr “Symbols and Expressions,” on page
112
rv[al]
Return the rvalue of the expression expr.
“Scope,” on page 114sco[pe]
Return a symbol for the search scope.
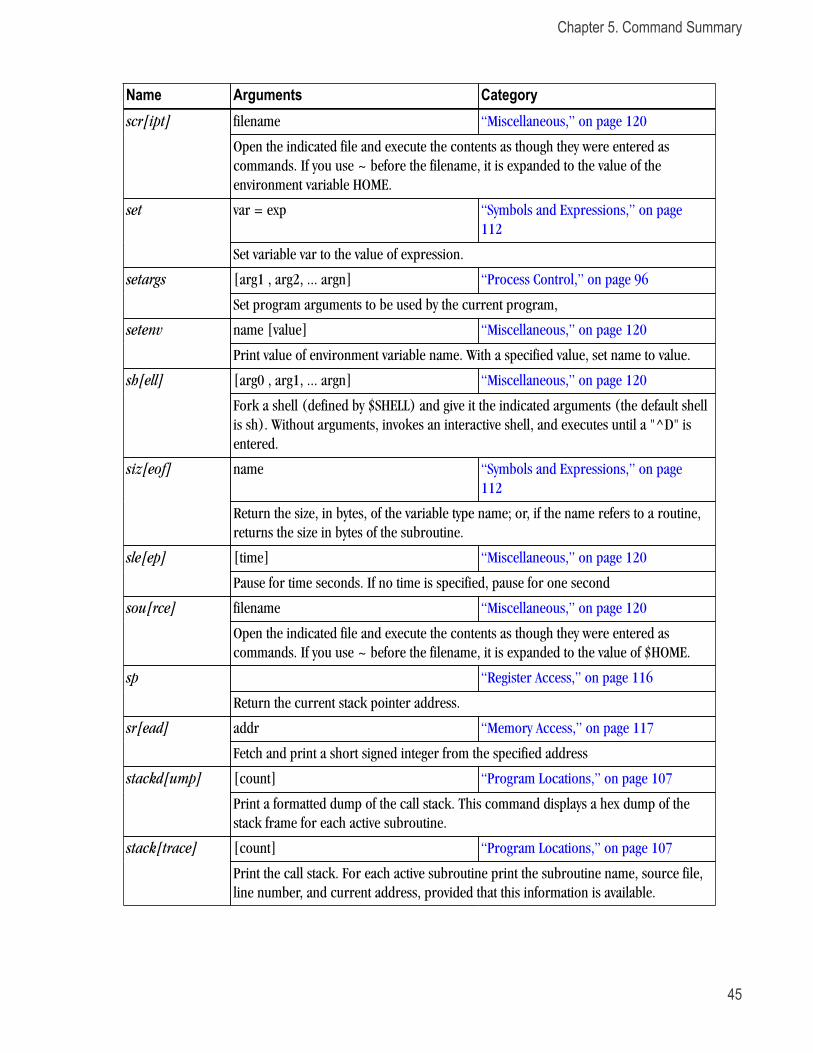
Chapter 5. Command Summary
45
Name Arguments Categoryfilename “Miscellaneous,” on page 120scr[ipt]
Open the indicated file and execute the contents as though they were entered as
commands. If you use ~ before the filename, it is expanded to the value of the
environment variable HOME.
var = exp “Symbols and Expressions,” on page
112
set
Set variable var to the value of expression.
[arg1 , arg2, ... argn] “Process Control,” on page 96setargs
Set program arguments to be used by the current program,
name [value] “Miscellaneous,” on page 120setenv
Print value of environment variable name. With a specified value, set name to value.
[arg0 , arg1, ... argn] “Miscellaneous,” on page 120sh[ell]
Fork a shell (defined by $SHELL) and give it the indicated arguments (the default shell
is sh). Without arguments, invokes an interactive shell, and executes until a "^D" is
entered.
name “Symbols and Expressions,” on page
112
siz[eof]
Return the size, in bytes, of the variable type name; or, if the name refers to a routine,
returns the size in bytes of the subroutine.
[time] “Miscellaneous,” on page 120sle[ep]
Pause for time seconds. If no time is specified, pause for one second
filename “Miscellaneous,” on page 120sou[rce]
Open the indicated file and execute the contents as though they were entered as
commands. If you use ~ before the filename, it is expanded to the value of $HOME.
“Register Access,” on page 116sp
Return the current stack pointer address.
addr “Memory Access,” on page 117sr[ead]
Fetch and print a short signed integer from the specified address
[count] “Program Locations,” on page 107stackd[ump]
Print a formatted dump of the call stack. This command displays a hex dump of the
stack frame for each active subroutine.
[count] “Program Locations,” on page 107stack[trace]
Print the call stack. For each active subroutine print the subroutine name, source file,
line number, and current address, provided that this information is available.
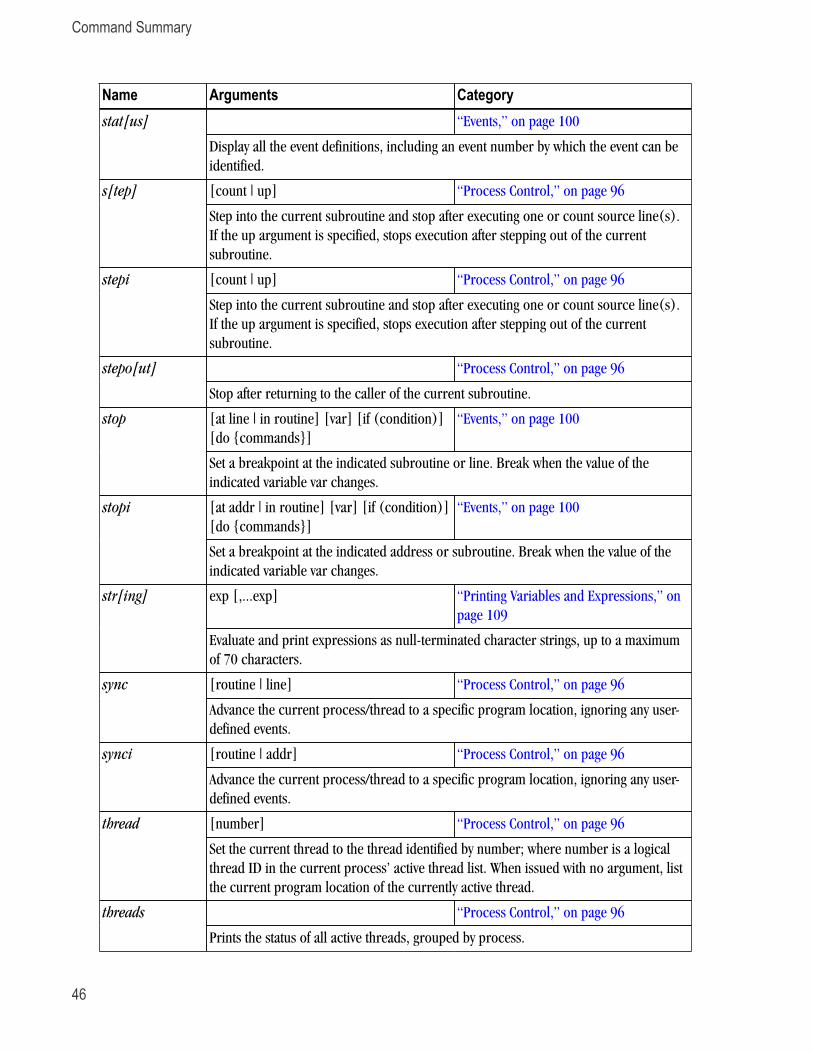
Command Summary
46
Name Arguments Category“Events,” on page 100stat[us]
Display all the event definitions, including an event number by which the event can be
identified.
[count | up] “Process Control,” on page 96s[tep]
Step into the current subroutine and stop after executing one or count source line(s).
If the up argument is specified, stops execution after stepping out of the current
subroutine.
[count | up] “Process Control,” on page 96stepi
Step into the current subroutine and stop after executing one or count source line(s).
If the up argument is specified, stops execution after stepping out of the current
subroutine.
“Process Control,” on page 96stepo[ut]
Stop after returning to the caller of the current subroutine.
[at line | in routine] [var] [if (condition)]
[do {commands}]
“Events,” on page 100stop
Set a breakpoint at the indicated subroutine or line. Break when the value of the
indicated variable var changes.
[at addr | in routine] [var] [if (condition)]
[do {commands}]
“Events,” on page 100stopi
Set a breakpoint at the indicated address or subroutine. Break when the value of the
indicated variable var changes.
exp [,...exp] “Printing Variables and Expressions,” on
page 109
str[ing]
Evaluate and print expressions as null-terminated character strings, up to a maximum
of 70 characters.
[routine | line] “Process Control,” on page 96sync
Advance the current process/thread to a specific program location, ignoring any user-
defined events.
[routine | addr] “Process Control,” on page 96synci
Advance the current process/thread to a specific program location, ignoring any user-
defined events.
[number] “Process Control,” on page 96thread
Set the current thread to the thread identified by number; where number is a logical
thread ID in the current process’ active thread list. When issued with no argument, list
the current program location of the currently active thread.
“Process Control,” on page 96threads
Prints the status of all active threads, grouped by process.
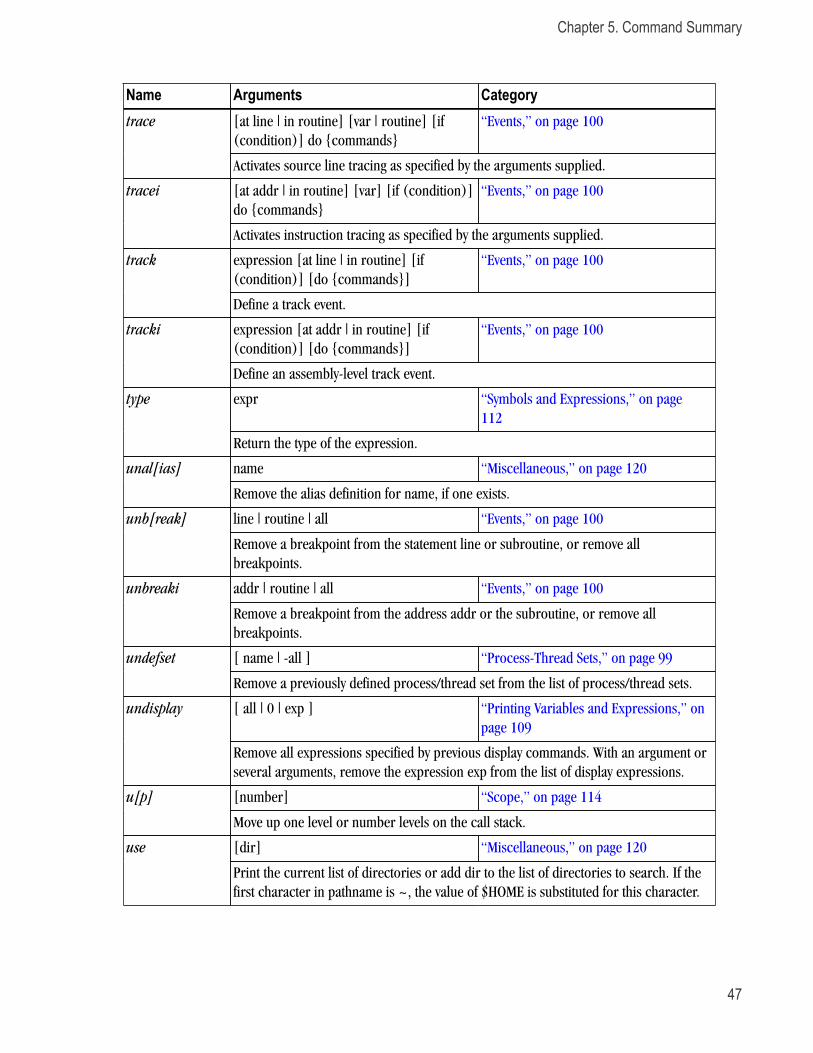
Chapter 5. Command Summary
47
Name Arguments Category[at line | in routine] [var | routine] [if
(condition)] do {commands}
“Events,” on page 100trace
Activates source line tracing as specified by the arguments supplied.
[at addr | in routine] [var] [if (condition)]
do {commands}
“Events,” on page 100tracei
Activates instruction tracing as specified by the arguments supplied.
expression [at line | in routine] [if
(condition)] [do {commands}]
“Events,” on page 100track
Define a track event.
expression [at addr | in routine] [if
(condition)] [do {commands}]
“Events,” on page 100tracki
Define an assembly-level track event.
expr “Symbols and Expressions,” on page
112
type
Return the type of the expression.
name “Miscellaneous,” on page 120unal[ias]
Remove the alias definition for name, if one exists.
line | routine | all “Events,” on page 100unb[reak]
Remove a breakpoint from the statement line or subroutine, or remove all
breakpoints.
addr | routine | all “Events,” on page 100unbreaki
Remove a breakpoint from the address addr or the subroutine, or remove all
breakpoints.
[ name | -all ] “Process-Thread Sets,” on page 99undefset
Remove a previously defined process/thread set from the list of process/thread sets.
[ all | 0 | exp ] “Printing Variables and Expressions,” on
page 109
undisplay
Remove all expressions specified by previous display commands. With an argument or
several arguments, remove the expression exp from the list of display expressions.
[number] “Scope,” on page 114u[p]
Move up one level or number levels on the call stack.
[dir] “Miscellaneous,” on page 120use
Print the current list of directories or add dir to the list of directories to search. If the
first character in pathname is ~, the value of $HOME is substituted for this character.
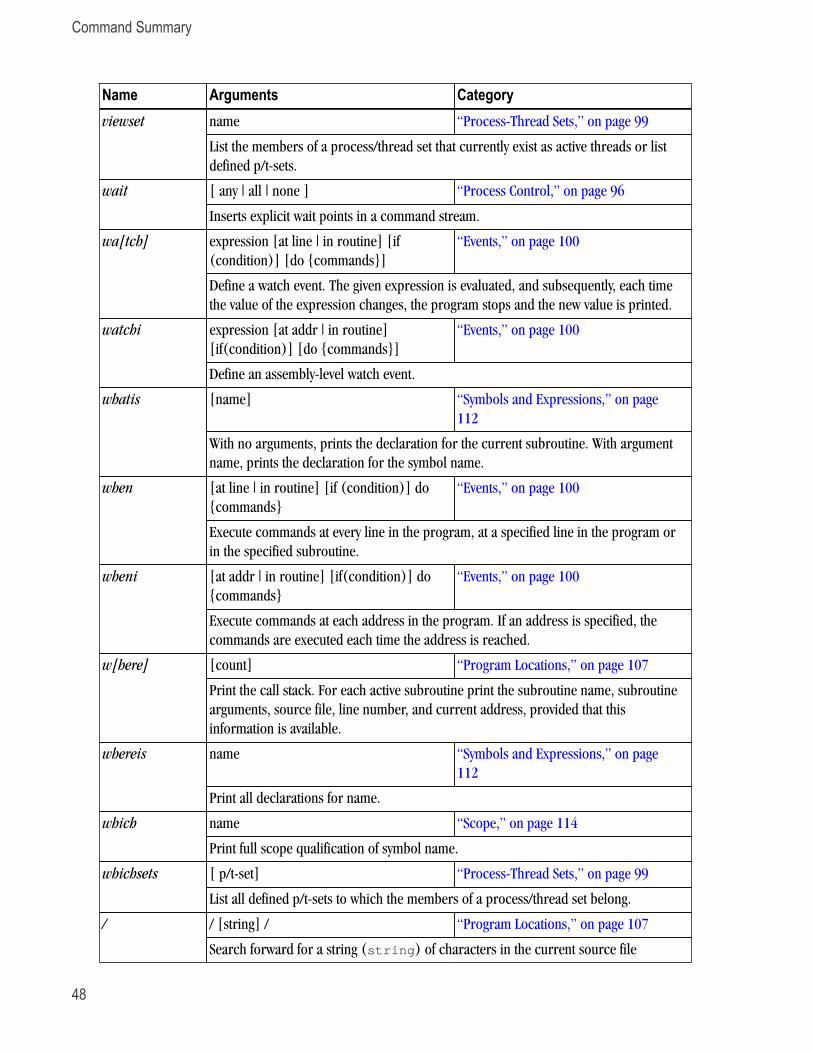
Command Summary
48
Name Arguments Categoryname “Process-Thread Sets,” on page 99viewset
List the members of a process/thread set that currently exist as active threads or list
defined p/t-sets.
[ any | all | none ] “Process Control,” on page 96wait
Inserts explicit wait points in a command stream.
expression [at line | in routine] [if
(condition)] [do {commands}]
“Events,” on page 100wa[tch]
Define a watch event. The given expression is evaluated, and subsequently, each time
the value of the expression changes, the program stops and the new value is printed.
expression [at addr | in routine]
[if(condition)] [do {commands}]
“Events,” on page 100watchi
Define an assembly-level watch event.
[name] “Symbols and Expressions,” on page
112
whatis
With no arguments, prints the declaration for the current subroutine. With argument
name, prints the declaration for the symbol name.
[at line | in routine] [if (condition)] do
{commands}
“Events,” on page 100when
Execute commands at every line in the program, at a specified line in the program or
in the specified subroutine.
[at addr | in routine] [if(condition)] do
{commands}
“Events,” on page 100wheni
Execute commands at each address in the program. If an address is specified, the
commands are executed each time the address is reached.
[count] “Program Locations,” on page 107w[here]
Print the call stack. For each active subroutine print the subroutine name, subroutine
arguments, source file, line number, and current address, provided that this
information is available.
name “Symbols and Expressions,” on page
112
whereis
Print all declarations for name.
name “Scope,” on page 114which
Print full scope qualification of symbol name.
[ p/t-set] “Process-Thread Sets,” on page 99whichsets
List all defined p/t-sets to which the members of a process/thread set belong.
/ [string] / “Program Locations,” on page 107/
Search forward for a string (string) of characters in the current source file
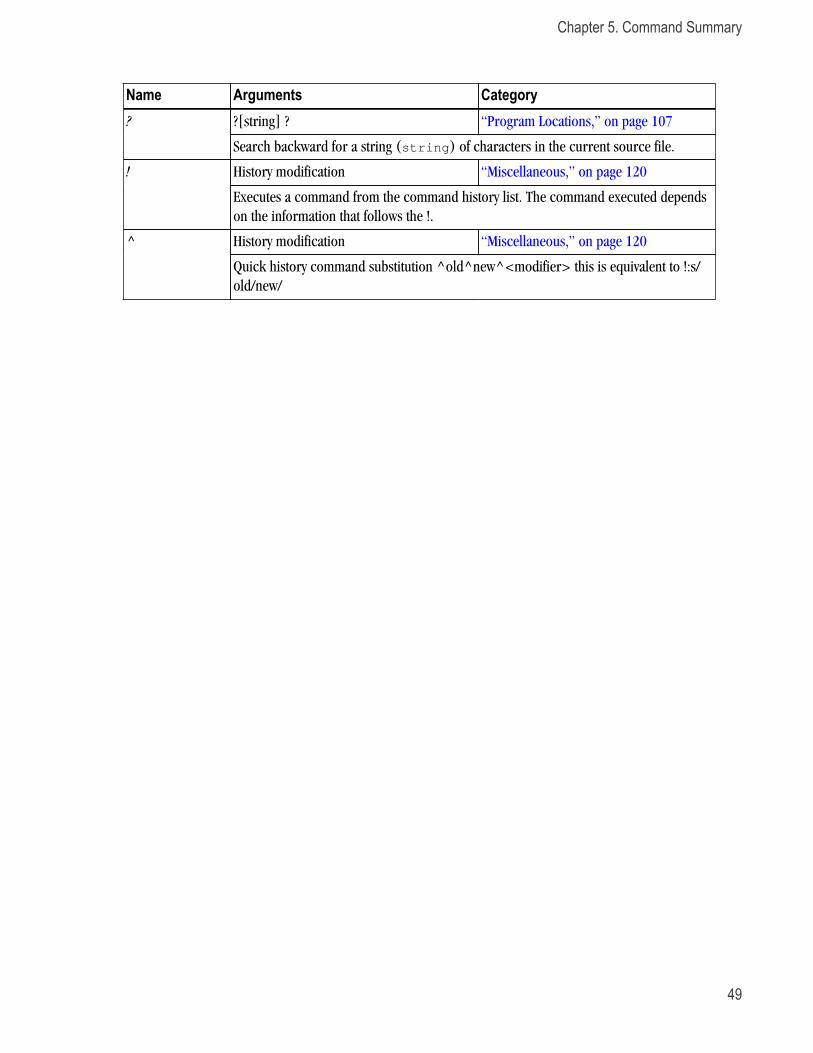
Chapter 5. Command Summary
49
Name Arguments Category?[string] ? “Program Locations,” on page 107?
Search backward for a string (string) of characters in the current source file.
History modification “Miscellaneous,” on page 120!
Executes a command from the command history list. The command executed depends
on the information that follows the !.
History modification “Miscellaneous,” on page 120^
Quick history command substitution ^old^new^<modifier> this is equivalent to !:s/
old/new/

50
51
Chapter 6. Assembly-LevelDebugging
This section provides information about PGDBG assembly-level debugging, including an overview about what
to expect if you are using assembly-level debugging or if you did not compile your program for debugging.
Assembly-Level Debugging OverviewPGDBG supports debugging regardless of how a program was compiled. In other words, PGDBG does not
require that the program under debug be compiled with debugging information, such as using -g. It can
debug code that is lacking debug information, but because it is missing information about symbols and
line numbers, it can only access the program at the assembly level. PGDBG also supports debugging at the
assembly level if debug symbols are available.
As described in “Building Applications for Debug,” on page 1, the richest debugging experience is available
when the program is compiled using -g or -gopt with no optimization. When a program is compiled at
higher levels of optimization, less information about source-level symbols and line numbers is available, even
if the program was compiled with -g or -gopt. In such cases, if you want to find the source of a problem
without rebuilding the program, you may need to debug at the assembly level.
If a program has been "stripped" of all symbols, either by the linker or a separate utility, then debugging will
be at the assembly level. PGDBG is only able to examine or control the program in terms of memory addresses
and registers.
Assembly-Level Debugging on Microsoft Windows Systems
When applications are built without -g on Windows systems, the resulting binary, the .exe file, does not
contain any symbol information. Microsoft stores symbol information in a program database, a .pdb file.
To generate a .pdb file using the PGI compiler drivers, you must use -g during the link step. You can do
this even if you did not use -g during the compile step. Having this .pdb file available provides PGDBG with
enough symbol information to map addresses to routine names.
Assembly-Level Debugging Overview
52
Assembly-Level Debugging with FortranTo refer to Fortran symbol names when debugging at the assembly level, you must translate the names to use
the naming convention that matches the calling convention in use by the compiler. For code compiled by the
PGI compilers, in most cases this means translating to lower case and appending an underscore. For example,
a routine that appears in the source code as "VADD" would be referred to in the debugger as "vadd_".
On 32-bit Windows systems there are alternative calling conventions. The one described above matches the
convention used when the compiler is invoked with -Miface=unix (previously -Munix). For details of
other 32-bit Windows calling conventions, refer to the PGI Compiler User's Guide.
NoteName translation is only necessary for assembly-level debugging. When debugging at the source level,
you may refer to symbol names as they appear in the source.
A special symbol, MAIN_, is created by PGFORTRAN to refer to the main program. PGFORTRAN generates this
special symbol whether or not there is a PROGRAM statement. One way to run to the beginning of a Fortran
program is to set a breakpoint on MAIN_, then run.
Assembly-Level Debugging with C++
C++ symbol names are "mangled" names. For the names of C++ methods, the names are modified to include
not only the name as it appears in the source code, but information about the enclosing class hierarchy,
argument and return types, and other information. The names are long and arcane. At the source level these
names are translated by PGDBG to the names as they appear in the source. At the assembly level, these names
are in the mangled form. Translation is not easy and not recommended. If you have no other alternative, you
can find information about name mangling in the PGI Compiler User's Guide.
Assembly-Level Debugging Using the PGDBG GUIThis section describes some basic operations for assembly-level debugging using the PGDBG GUI. If you
encounter the message “Can’t find main function compiled -g” on startup, assembly -level
debugging is required.
To get into a program in this situation, you can select the Debug | Set Breakpoint... menu option. To stop at
program entry, for example, in Fortran you could enter MAIN_ in response to the dialog query; in C or C++
you could enter main.
PGDBG debug information tabs that are useful in assembly-level debugging include the Call Stack, Memory,
and Register tabs. Use the Disassembly tab in the source pane to view the disassembled code.
If disassembly is not automatically displayed in the source pane, use the dis command in either the Command
tab or Data | Custom window to generate disassembly for an address or function.
Assembly-Level Debugging Using the PGDBG CLIThis section describes some basic operations for assembly-level debugging using the PGDBG command-line
interface. When you invoke the PGDBG CLI and are presented with a message telling you that PGDBG "Can't
find main function compiled -g", assembly-level debugging is required.
Chapter 6. Assembly-Level Debugging
53
To get into the program, you can set a breakpoint at a named routine. To stop at program entry, for example, in
Fortran you could use
pgdbg> break MAIN_
and in C/ C++ you could use
pgdbg> break main
Some useful commands for assembly-level debugging using the PGDBG command-line interface include:
run
run the program from the beginning
cont
continue program execution from the current point
nexti
single-step one instruction, stepping over calls
stepi
single-step one instruction, stepping into calls
breaki
set a breakpoint at a given address
regs
display the registers
print $<regname>
display the value of the specified register
For more information on register names, refer to “SSE Register Symbols,” on page 53.
dump
dump memory locations
stacktrace
display the current call stack.
stackdump
display the current call stack.
SSE Register SymbolsX64 processors and x86 processors starting with Pentium III provide SSE (Streaming SIMD Enhancements)
registers and a SIMD floating-point control/status register.
Each SSE register may contain four 32-bit single-precision or two 64-bit floating-point values. The PGDBG
regs command reports these values individually in both hexadecimal and floating-point format. PGDBG
provides command notation to refer to these values individually or all together.
The component values of each SSE register can be accessed using the same syntax that is used for array
subscripting. Pictorially, the SSE registers can be thought of as follows:
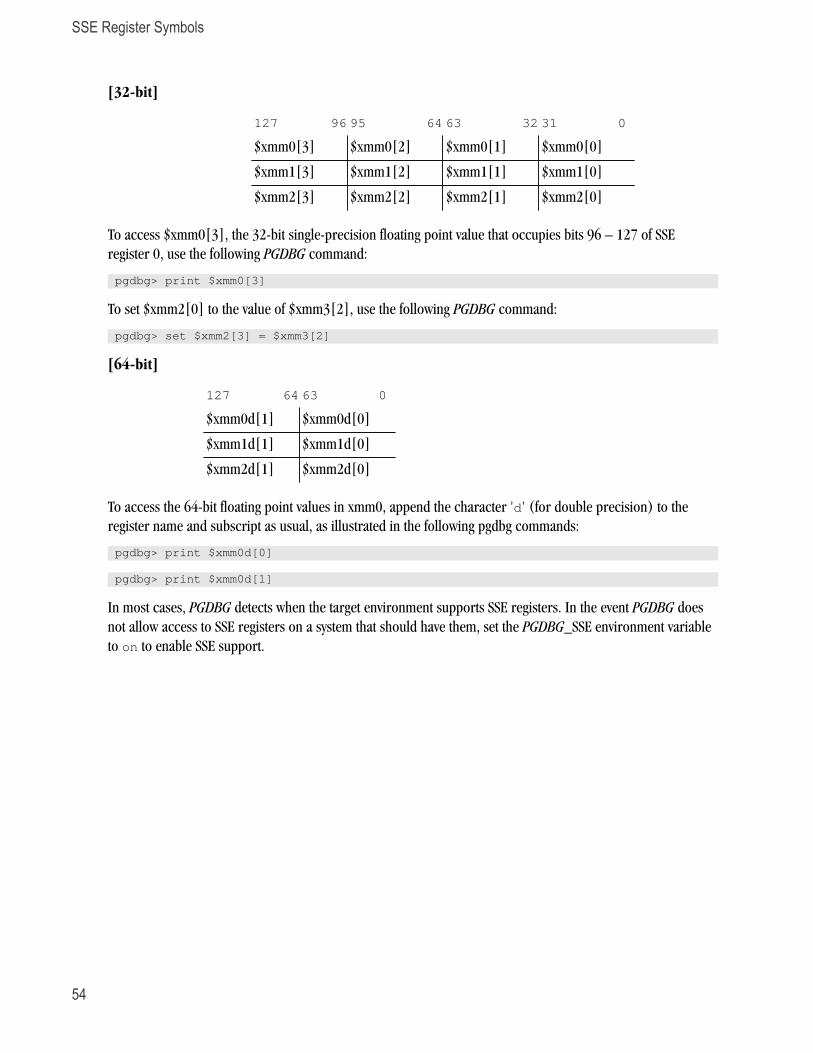
SSE Register Symbols
54
[32-bit]
127 96 95 64 63 32 31 0
$xmm0[3] $xmm0[2] $xmm0[1] $xmm0[0]
$xmm1[3] $xmm1[2] $xmm1[1] $xmm1[0]
$xmm2[3] $xmm2[2] $xmm2[1] $xmm2[0]
To access $xmm0[3], the 32-bit single-precision floating point value that occupies bits 96 – 127 of SSE
register 0, use the following PGDBG command:
pgdbg> print $xmm0[3]
To set $xmm2[0] to the value of $xmm3[2], use the following PGDBG command:
pgdbg> set $xmm2[3] = $xmm3[2]
[64-bit]
127 64 63 0
$xmm0d[1] $xmm0d[0]
$xmm1d[1] $xmm1d[0]
$xmm2d[1] $xmm2d[0]
To access the 64-bit floating point values in xmm0, append the character 'd' (for double precision) to the
register name and subscript as usual, as illustrated in the following pgdbg commands:
pgdbg> print $xmm0d[0]
pgdbg> print $xmm0d[1]
In most cases, PGDBG detects when the target environment supports SSE registers. In the event PGDBG does
not allow access to SSE registers on a system that should have them, set the PGDBG_SSE environment variable
to on to enable SSE support.
55
Chapter 7. Source-Level DebuggingThis chapter describes source-level debugging, including debugging Fortran and C++.
Debugging Fortran
Fortran TypesPGDBG displays Fortran type declarations using Fortran type names. The only exception is Fortran character
types, which are treated as arrays of the C type char.
ArraysFortran array subscripts and ranges are accessed using the Fortran language syntax convention, denoting
subscripts with parentheses and ranges with colons.
PGI compilers for the linux86-64 platform (AMD64 or Intel 64) support large arrays (arrays with an
aggregate size greater than 2GB). You can enable large array support by compiling using these options: –
mcmodel=medium –Mlarge_arrays. PGDBG provides full support for large arrays and large subscripts.
PGDBG supports arrays with non-default lower bounds. Access to such arrays uses the same subscripts that
are used in the program.
PGDBG also supports adjustable arrays. Access to adjustable arrays may use the same subscripting that is used
in the program.
OperatorsIn general, PGDBG uses C language style operators in expressions and supports the Fortran array index
selector “()” and the Fortran field selector “%” for derived types. However, .eq., .ne., and so forth are not
supported. You must use the analogous C operators ==, !=, and so on, instead.
Note
The precedence of operators matches the C language, which may in some cases be different than that
used in Fortran.
See Table 5.1, “PGDBG Commands” for a complete list of operators and their definition.
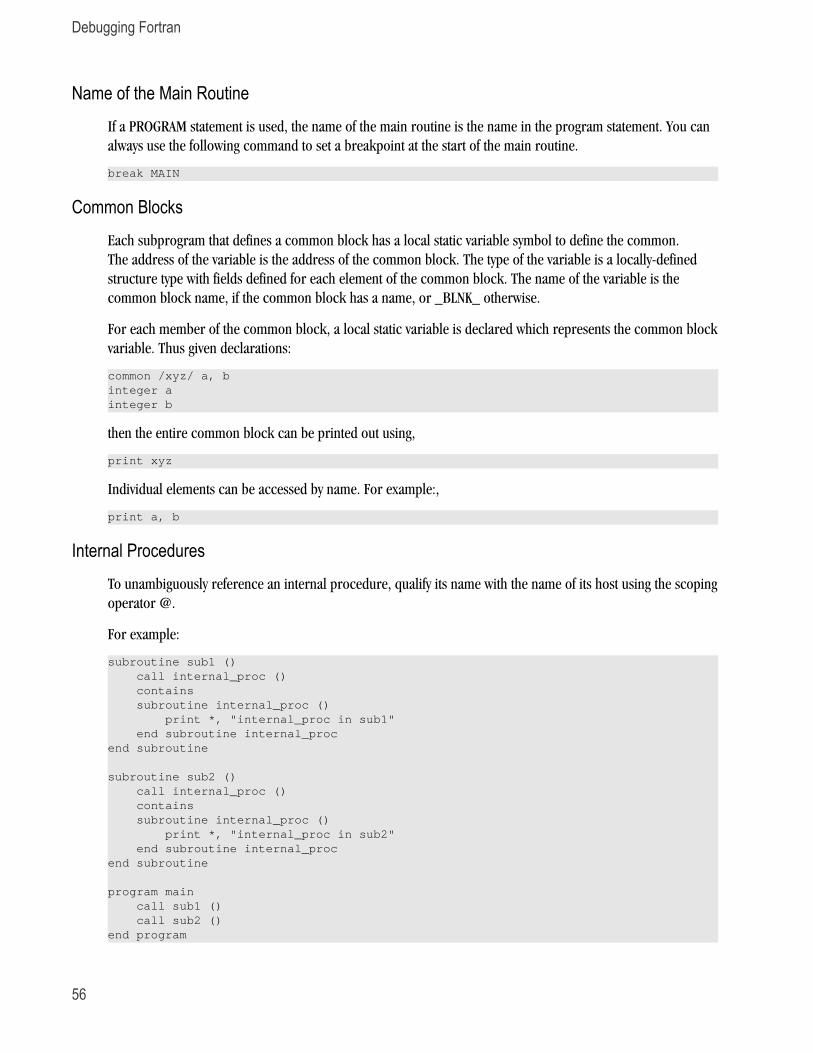
Debugging Fortran
56
Name of the Main RoutineIf a PROGRAM statement is used, the name of the main routine is the name in the program statement. You can
always use the following command to set a breakpoint at the start of the main routine.
break MAIN
Common BlocksEach subprogram that defines a common block has a local static variable symbol to define the common.
The address of the variable is the address of the common block. The type of the variable is a locally-defined
structure type with fields defined for each element of the common block. The name of the variable is the
common block name, if the common block has a name, or _BLNK_ otherwise.
For each member of the common block, a local static variable is declared which represents the common block
variable. Thus given declarations:
common /xyz/ a, binteger ainteger b
then the entire common block can be printed out using,
print xyz
Individual elements can be accessed by name. For example:,
print a, b
Internal ProceduresTo unambiguously reference an internal procedure, qualify its name with the name of its host using the scoping
operator @.
For example:
subroutine sub1 () call internal_proc () contains subroutine internal_proc () print *, "internal_proc in sub1" end subroutine internal_procend subroutine
subroutine sub2 () call internal_proc () contains subroutine internal_proc () print *, "internal_proc in sub2" end subroutine internal_procend subroutine
program main call sub1 () call sub2 ()end program
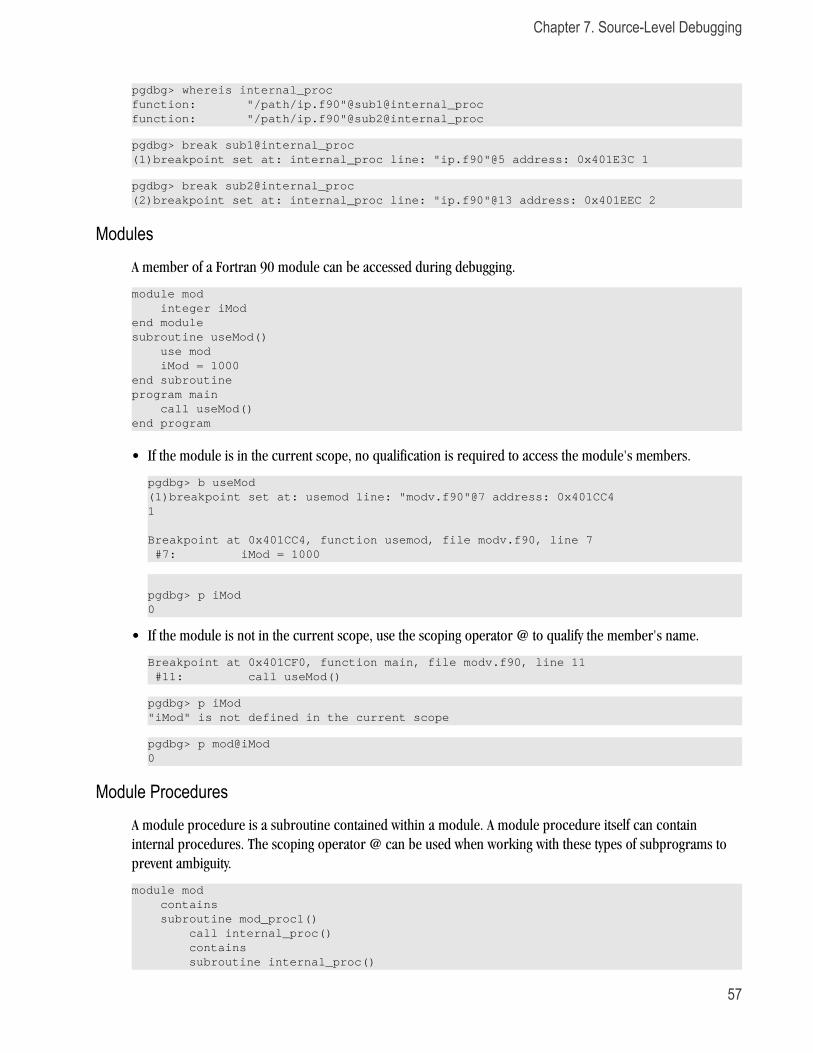
Chapter 7. Source-Level Debugging
57
pgdbg> whereis internal_procfunction: "/path/ip.f90"@sub1@internal_procfunction: "/path/ip.f90"@sub2@internal_proc
pgdbg> break sub1@internal_proc(1)breakpoint set at: internal_proc line: "ip.f90"@5 address: 0x401E3C 1
pgdbg> break sub2@internal_proc(2)breakpoint set at: internal_proc line: "ip.f90"@13 address: 0x401EEC 2
ModulesA member of a Fortran 90 module can be accessed during debugging.
module mod integer iModend modulesubroutine useMod() use mod iMod = 1000end subroutineprogram main call useMod()end program
• If the module is in the current scope, no qualification is required to access the module's members.
pgdbg> b useMod(1)breakpoint set at: usemod line: "modv.f90"@7 address: 0x401CC4 1
Breakpoint at 0x401CC4, function usemod, file modv.f90, line 7 #7: iMod = 1000
pgdbg> p iMod0
• If the module is not in the current scope, use the scoping operator @ to qualify the member's name.
Breakpoint at 0x401CF0, function main, file modv.f90, line 11 #11: call useMod()
pgdbg> p iMod"iMod" is not defined in the current scope
pgdbg> p mod@iMod0
Module ProceduresA module procedure is a subroutine contained within a module. A module procedure itself can contain
internal procedures. The scoping operator @ can be used when working with these types of subprograms to
prevent ambiguity.
module mod contains subroutine mod_proc1() call internal_proc() contains subroutine internal_proc()
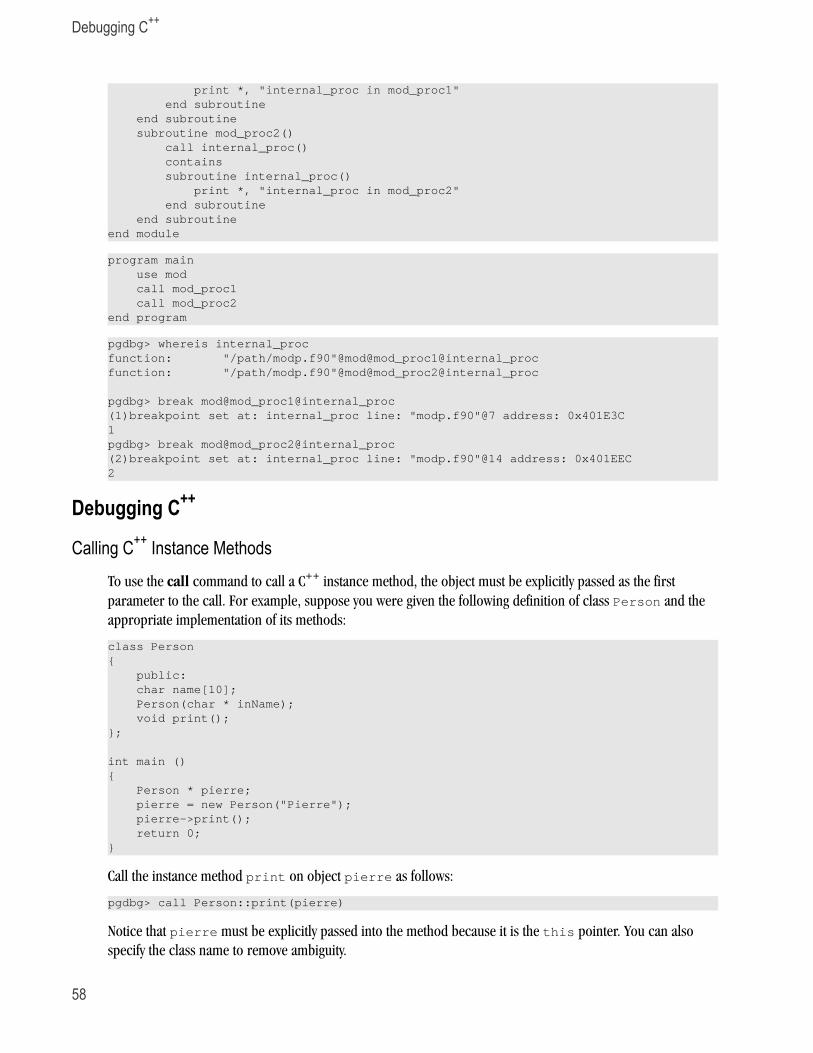
Debugging C++
58
print *, "internal_proc in mod_proc1" end subroutine end subroutine subroutine mod_proc2() call internal_proc() contains subroutine internal_proc() print *, "internal_proc in mod_proc2" end subroutine end subroutineend module
program main use mod call mod_proc1 call mod_proc2end program
pgdbg> whereis internal_procfunction: "/path/modp.f90"@mod@mod_proc1@internal_procfunction: "/path/modp.f90"@mod@mod_proc2@internal_proc
pgdbg> break mod@mod_proc1@internal_proc(1)breakpoint set at: internal_proc line: "modp.f90"@7 address: 0x401E3C 1pgdbg> break mod@mod_proc2@internal_proc(2)breakpoint set at: internal_proc line: "modp.f90"@14 address: 0x401EEC 2
Debugging C++
Calling C++ Instance MethodsTo use the call command to call a C++ instance method, the object must be explicitly passed as the first
parameter to the call. For example, suppose you were given the following definition of class Person and the
appropriate implementation of its methods:
class Person{ public: char name[10]; Person(char * inName); void print();};
int main (){ Person * pierre; pierre = new Person("Pierre"); pierre->print(); return 0;}
Call the instance method print on object pierre as follows:
pgdbg> call Person::print(pierre)
Notice that pierre must be explicitly passed into the method because it is the this pointer. You can also
specify the class name to remove ambiguity.
59
Chapter 8. Platform-SpecificFeatures
This chapter describes the PGDBG features that are specific to particular platforms, such as pathname
conventions, debugging with core files, and signals.
Pathname ConventionsPGDBG uses the forward slash character (/) internally as the path component separator on all platforms. The
backslash (\) is used as the escape character in the PGDBG command language.
On Windows systems, use backslash as the path component separator in the fields of the Connections tab. Use
the forward slash as the path component separator when using a debugger command in the Command tab or
in the CLI. The forward slash separator convention is still in effect when using a drive letter to specify a full
path. For example, to add the Windows pathname C:\Temp\src to the list of searched source directories, use
the command:
pgdbg> dir C:/Temp/src
To set a breakpoint at line 10 of the source file specified by the relative path sub1\main.c, use this
command:
pgdbg> break "sub1/main.c":10
Debugging with Core FilesPGDBG supports debugging of core files on Linux platforms. In the GUI, select the Core option on the
Connections tab to enable core file debugging. Fill in the Program and Core File fields and open the connection
to load the core file.
You can also launch PGDBG for core file debugging from the command line. To do this, use the following
options:
$ pgdbg –core coreFileName programName
Core files (or core dumps) are generated when a program encounters an exception or fault. For example,
one common exception is the segmentation violation, which can be caused by referencing an invalid memory
Debugging with Core Files
60
address. The memory and register states of the program are written into a core file so that they can be
examined by a debugger.
The shell environment in which the application runs must be set up to allow core file creation. On many
systems, the default user setting ulimit does not allow core file creation.
Check the ulimit as follows:
For sh/bash users:
$ ulimit -c
For csh/tcsh users:
% limit coredumpsize
If the core file size limit is zero or something too small for the application, it can be set to unlimited as follows:
For sh/bash users:
$ ulimit -c unlimited
For csh/tcsh users:
% limit coredumpsize unlimited
See the Linux shell documentation for more details. Some versions of Linux provide system-wide limits on core
file creation.
The core file is normally written into the current directory of the faulting application. It is usually named core
or core.pid where pid is the process ID of the faulting thread. If the shell environment is set correctly and a
core file is not generated in the expected location, the system core dump policy may require configuration by a
system administrator.
Different versions of Linux handle core dumping slightly differently. The state of all process threads are
written to the core file in most modern implementations of Linux. In some new versions of Linux, if more than
one thread faults, then each thread’s state is written to separate core files using the core.pid file naming
convention previously described. In older versions of Linux, only one faulting thread is written to the core file.
If a program uses dynamically shared objects (i.e., shared libraries named lib*.so), as most programs on
Linux do, then accurate core file debugging requires that the program be debugged on the system where the
core file was created. Otherwise, slight differences in the version of a shared library or the dynamic linker
can cause erroneous information to be presented by the debugger. Sometimes a core file can be debugged
successfully on a different system, particularly on more modern Linux systems, but you should take care when
attempting this.
When debugging core files, PGDBG:
• Supports all non-control commands.
• Performs any command that does not cause the program to run.
• Generates an error message in PGDBG for any command that causes the program to run.
• May provide the status of multiple threads, depending on the type of core file created.
Chapter 8. Platform-Specific Features
61
PGDBG does not support multi-process core file debugging.
SignalsPGDBG intercepts all signals sent to any of the threads in a multi-threaded program and passes them on
according to that signal's disposition as maintained by PGDBG (see the catch and ignore commands), except
for signals that cannot be intercepted or signals used internally by PGDBG.
Signals Used Internally by PGDBGSIGTRAP and SIGSTOP are used by Linux for communication of application events to PGDBG. Management of
these signals is internal to PGDBG. Changing the disposition of these signals in PGDBG (via catch and ignore)
results in undefined behavior.
Signals Used by Linux LibrariesSome Linux thread libraries use SIGRT1 and SIGRT3 to communicate among threads internally. Other Linux
thread libraries, on systems that do not have support for real-time signals in the kernel, use SIGUSR1 and
SIGUSR2. Changing the disposition of these signals in PGDBG (via catch and ignore) results in undefined
behavior.
Target applications compiled with the options –pg or –Mprof=time generate numerous SIGPROF signals.
Although SIGPROF can be handled by PGDBG via the ignore command, debugging of applications built for
sample-based profiling is not recommended.

62
63
Chapter 9. Parallel DebuggingOverview
This chapter provides an overview of how to use PGDBG to debug parallel applications. It includes important
definitions and background information on how PGDBG represents processes and threads.
Overview of Parallel Debugging CapabilityPGDBG is a parallel application debugger capable of debugging multi-process MPI applications, multi-thread
and OpenMP applications, and hybrid multi-thread/multi-process applications that use MPI to communicate
between multi-threaded or OpenMP processes.
For specific information on multi-thread and OpenMP debugging, refer to Chapter 10, “Parallel Debugging
with OpenMP”.
For specific information on multi-process MPI debugging, refer to Chapter 11, “Parallel Debugging with
MPI”.
Graphical Presentation of Threads and Processes
PGDBG graphical user interface components that provide support for parallelism are described in detail in
“The Graphical User Interface”.
Basic Process and Thread NamingBecause PGDBG can debug multi-threaded applications, multi-process applications, and hybrid multi-
threaded/multi-process applications, it provides a convention for uniquely identifying each thread in each
process. This section gives a brief overview of this naming convention and how it is used to provide adequate
background for the subsequent sections. A more detailed discussion of this convention, including advanced
techniques for applying it, is provided in “Thread and Process Grouping and Naming,” on page 64.
PGDBG identifies threads in an OpenMP application using the OpenMP thread IDs. Otherwise, PGDBG assigns
arbitrary IDs to threads, starting at zero and incrementing in order of thread creation.
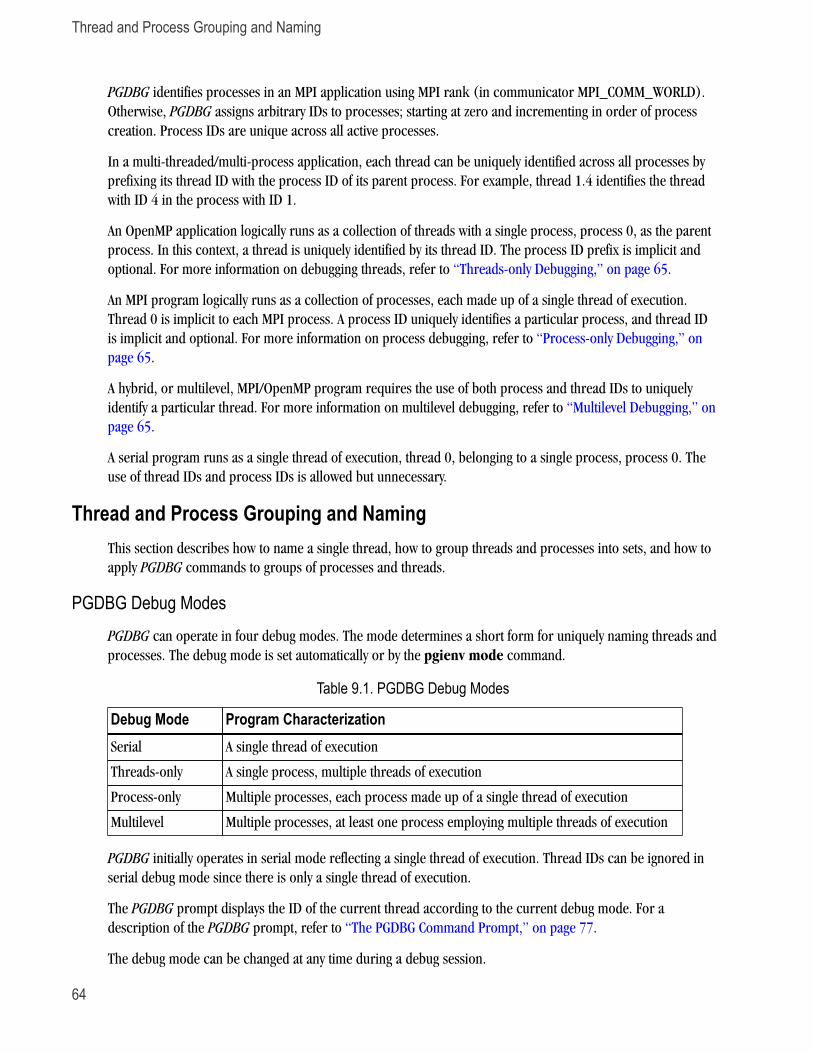
Thread and Process Grouping and Naming
64
PGDBG identifies processes in an MPI application using MPI rank (in communicator MPI_COMM_WORLD).
Otherwise, PGDBG assigns arbitrary IDs to processes; starting at zero and incrementing in order of process
creation. Process IDs are unique across all active processes.
In a multi-threaded/multi-process application, each thread can be uniquely identified across all processes by
prefixing its thread ID with the process ID of its parent process. For example, thread 1.4 identifies the thread
with ID 4 in the process with ID 1.
An OpenMP application logically runs as a collection of threads with a single process, process 0, as the parent
process. In this context, a thread is uniquely identified by its thread ID. The process ID prefix is implicit and
optional. For more information on debugging threads, refer to “Threads-only Debugging,” on page 65.
An MPI program logically runs as a collection of processes, each made up of a single thread of execution.
Thread 0 is implicit to each MPI process. A process ID uniquely identifies a particular process, and thread ID
is implicit and optional. For more information on process debugging, refer to “Process-only Debugging,” on
page 65.
A hybrid, or multilevel, MPI/OpenMP program requires the use of both process and thread IDs to uniquely
identify a particular thread. For more information on multilevel debugging, refer to “Multilevel Debugging,” on
page 65.
A serial program runs as a single thread of execution, thread 0, belonging to a single process, process 0. The
use of thread IDs and process IDs is allowed but unnecessary.
Thread and Process Grouping and NamingThis section describes how to name a single thread, how to group threads and processes into sets, and how to
apply PGDBG commands to groups of processes and threads.
PGDBG Debug ModesPGDBG can operate in four debug modes. The mode determines a short form for uniquely naming threads and
processes. The debug mode is set automatically or by the pgienv mode command.
Table 9.1. PGDBG Debug Modes
Debug Mode Program CharacterizationSerial A single thread of execution
Threads-only A single process, multiple threads of execution
Process-only Multiple processes, each process made up of a single thread of execution
Multilevel Multiple processes, at least one process employing multiple threads of execution
PGDBG initially operates in serial mode reflecting a single thread of execution. Thread IDs can be ignored in
serial debug mode since there is only a single thread of execution.
The PGDBG prompt displays the ID of the current thread according to the current debug mode. For a
description of the PGDBG prompt, refer to “The PGDBG Command Prompt,” on page 77.
The debug mode can be changed at any time during a debug session.
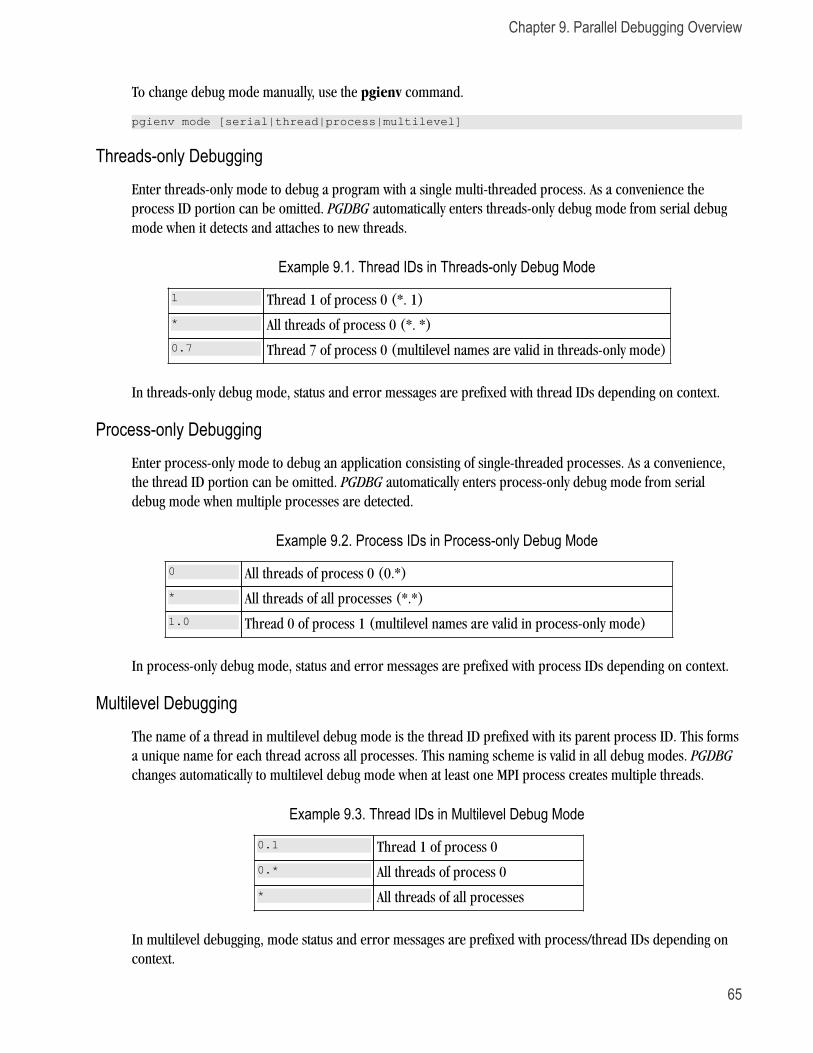
Chapter 9. Parallel Debugging Overview
65
To change debug mode manually, use the pgienv command.
pgienv mode [serial|thread|process|multilevel]
Threads-only DebuggingEnter threads-only mode to debug a program with a single multi-threaded process. As a convenience the
process ID portion can be omitted. PGDBG automatically enters threads-only debug mode from serial debug
mode when it detects and attaches to new threads.
Example 9.1. Thread IDs in Threads-only Debug Mode
1 Thread 1 of process 0 (*. 1)
* All threads of process 0 (*. *)
0.7 Thread 7 of process 0 (multilevel names are valid in threads-only mode)
In threads-only debug mode, status and error messages are prefixed with thread IDs depending on context.
Process-only DebuggingEnter process-only mode to debug an application consisting of single-threaded processes. As a convenience,
the thread ID portion can be omitted. PGDBG automatically enters process-only debug mode from serial
debug mode when multiple processes are detected.
Example 9.2. Process IDs in Process-only Debug Mode
0 All threads of process 0 (0.*)
* All threads of all processes (*.*)
1.0 Thread 0 of process 1 (multilevel names are valid in process-only mode)
In process-only debug mode, status and error messages are prefixed with process IDs depending on context.
Multilevel DebuggingThe name of a thread in multilevel debug mode is the thread ID prefixed with its parent process ID. This forms
a unique name for each thread across all processes. This naming scheme is valid in all debug modes. PGDBG
changes automatically to multilevel debug mode when at least one MPI process creates multiple threads.
Example 9.3. Thread IDs in Multilevel Debug Mode
0.1 Thread 1 of process 0
0.* All threads of process 0
* All threads of all processes
In multilevel debugging, mode status and error messages are prefixed with process/thread IDs depending on
context.
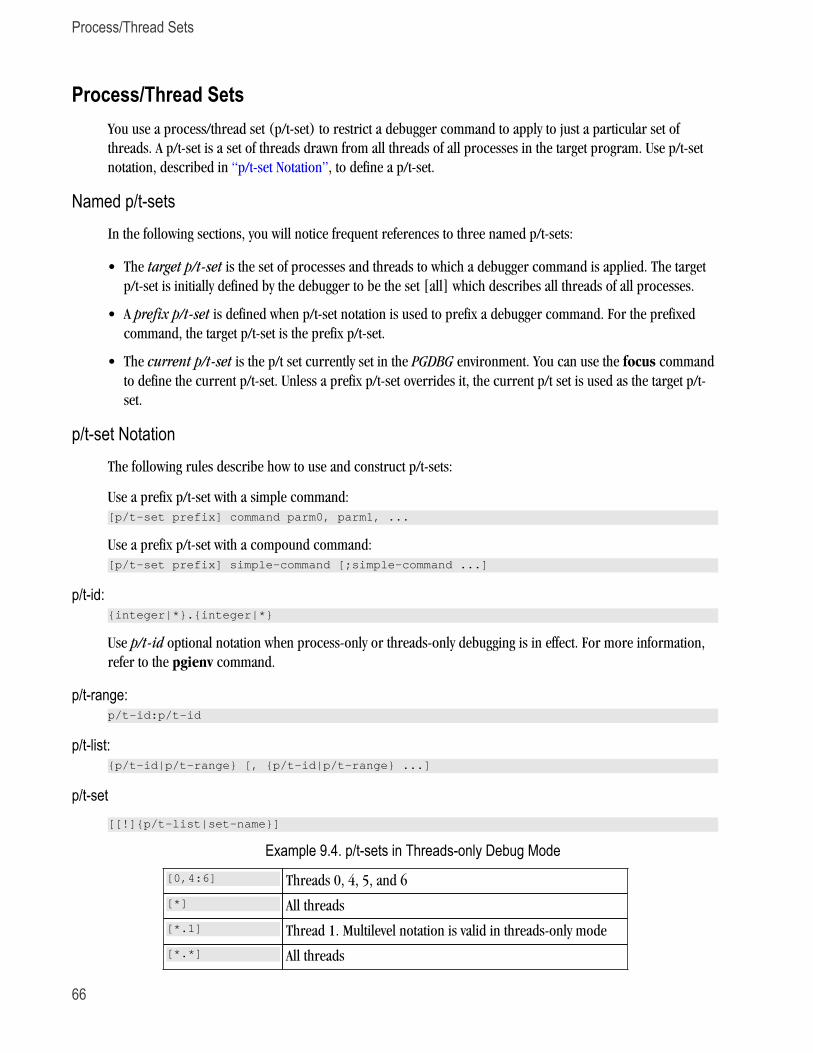
Process/Thread Sets
66
Process/Thread SetsYou use a process/thread set (p/t-set) to restrict a debugger command to apply to just a particular set of
threads. A p/t-set is a set of threads drawn from all threads of all processes in the target program. Use p/t-set
notation, described in “p/t-set Notation”, to define a p/t-set.
Named p/t-setsIn the following sections, you will notice frequent references to three named p/t-sets:
• The target p/t-set is the set of processes and threads to which a debugger command is applied. The target
p/t-set is initially defined by the debugger to be the set [all] which describes all threads of all processes.
• A prefix p/t-set is defined when p/t-set notation is used to prefix a debugger command. For the prefixed
command, the target p/t-set is the prefix p/t-set.
• The current p/t-set is the p/t set currently set in the PGDBG environment. You can use the focus command
to define the current p/t-set. Unless a prefix p/t-set overrides it, the current p/t set is used as the target p/t-
set.
p/t-set NotationThe following rules describe how to use and construct p/t-sets:
Use a prefix p/t-set with a simple command:[p/t-set prefix] command parm0, parm1, ...
Use a prefix p/t-set with a compound command:[p/t-set prefix] simple-command [;simple-command ...]
p/t-id:{integer|*}.{integer|*}
Use p/t-id optional notation when process-only or threads-only debugging is in effect. For more information,
refer to the pgienv command.
p/t-range:p/t-id:p/t-id
p/t-list:{p/t-id|p/t-range} [, {p/t-id|p/t-range} ...]
p/t-set[[!]{p/t-list|set-name}]
Example 9.4. p/t-sets in Threads-only Debug Mode[0,4:6] Threads 0, 4, 5, and 6
[*] All threads
[*.1] Thread 1. Multilevel notation is valid in threads-only mode
[*.*] All threads
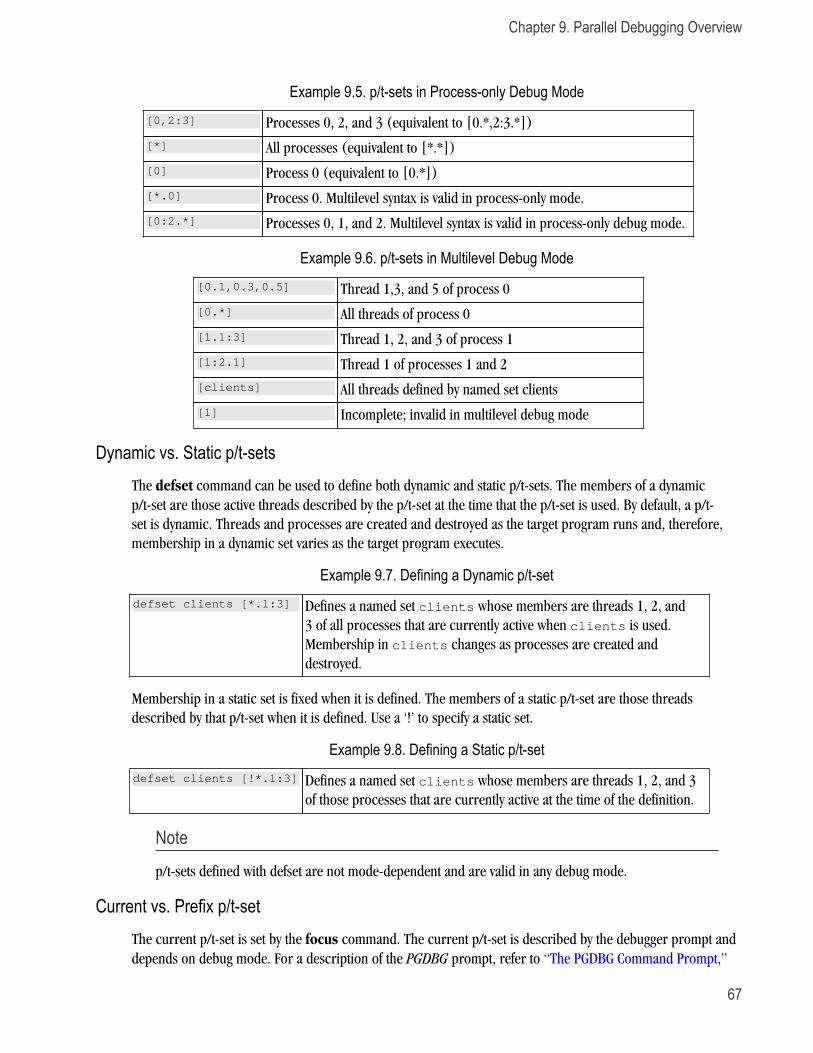
Chapter 9. Parallel Debugging Overview
67
Example 9.5. p/t-sets in Process-only Debug Mode[0,2:3] Processes 0, 2, and 3 (equivalent to [0.*,2:3.*])
[*] All processes (equivalent to [*.*])
[0] Process 0 (equivalent to [0.*])
[*.0] Process 0. Multilevel syntax is valid in process-only mode.
[0:2.*] Processes 0, 1, and 2. Multilevel syntax is valid in process-only debug mode.
Example 9.6. p/t-sets in Multilevel Debug Mode[0.1,0.3,0.5] Thread 1,3, and 5 of process 0
[0.*] All threads of process 0
[1.1:3] Thread 1, 2, and 3 of process 1
[1:2.1] Thread 1 of processes 1 and 2
[clients] All threads defined by named set clients
[1] Incomplete; invalid in multilevel debug mode
Dynamic vs. Static p/t-setsThe defset command can be used to define both dynamic and static p/t-sets. The members of a dynamic
p/t-set are those active threads described by the p/t-set at the time that the p/t-set is used. By default, a p/t-
set is dynamic. Threads and processes are created and destroyed as the target program runs and, therefore,
membership in a dynamic set varies as the target program executes.
Example 9.7. Defining a Dynamic p/t-setdefset clients [*.1:3] Defines a named set clients whose members are threads 1, 2, and
3 of all processes that are currently active when clients is used.
Membership in clients changes as processes are created and
destroyed.
Membership in a static set is fixed when it is defined. The members of a static p/t-set are those threads
described by that p/t-set when it is defined. Use a ‘!’ to specify a static set.
Example 9.8. Defining a Static p/t-setdefset clients [!*.1:3] Defines a named set clients whose members are threads 1, 2, and 3
of those processes that are currently active at the time of the definition.
Notep/t-sets defined with defset are not mode-dependent and are valid in any debug mode.
Current vs. Prefix p/t-setThe current p/t-set is set by the focus command. The current p/t-set is described by the debugger prompt and
depends on debug mode. For a description of the PGDBG prompt, refer to “The PGDBG Command Prompt,”
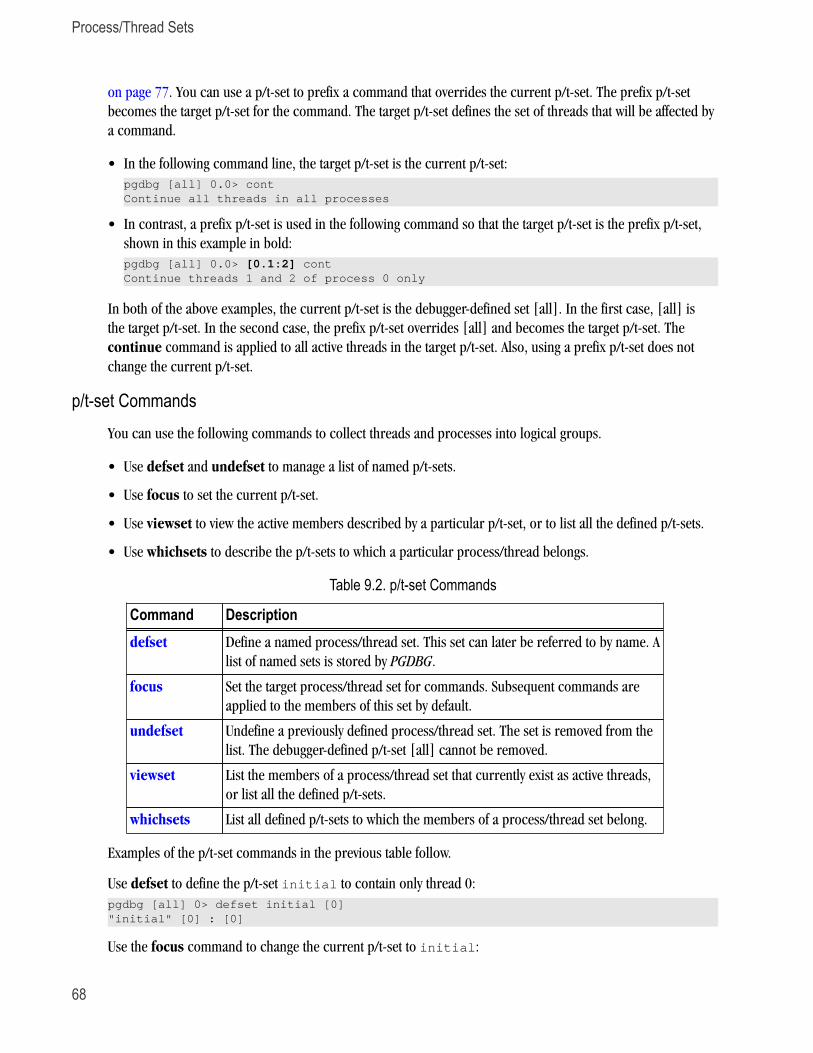
Process/Thread Sets
68
on page 77. You can use a p/t-set to prefix a command that overrides the current p/t-set. The prefix p/t-set
becomes the target p/t-set for the command. The target p/t-set defines the set of threads that will be affected by
a command.
• In the following command line, the target p/t-set is the current p/t-set:
pgdbg [all] 0.0> contContinue all threads in all processes
• In contrast, a prefix p/t-set is used in the following command so that the target p/t-set is the prefix p/t-set,
shown in this example in bold:
pgdbg [all] 0.0> [0.1:2] contContinue threads 1 and 2 of process 0 only
In both of the above examples, the current p/t-set is the debugger-defined set [all]. In the first case, [all] is
the target p/t-set. In the second case, the prefix p/t-set overrides [all] and becomes the target p/t-set. The
continue command is applied to all active threads in the target p/t-set. Also, using a prefix p/t-set does not
change the current p/t-set.
p/t-set CommandsYou can use the following commands to collect threads and processes into logical groups.
• Use defset and undefset to manage a list of named p/t-sets.
• Use focus to set the current p/t-set.
• Use viewset to view the active members described by a particular p/t-set, or to list all the defined p/t-sets.
• Use whichsets to describe the p/t-sets to which a particular process/thread belongs.
Table 9.2. p/t-set Commands
Command Descriptiondefset Define a named process/thread set. This set can later be referred to by name. A
list of named sets is stored by PGDBG.
focus Set the target process/thread set for commands. Subsequent commands are
applied to the members of this set by default.
undefset Undefine a previously defined process/thread set. The set is removed from the
list. The debugger-defined p/t-set [all] cannot be removed.
viewset List the members of a process/thread set that currently exist as active threads,
or list all the defined p/t-sets.
whichsets List all defined p/t-sets to which the members of a process/thread set belong.
Examples of the p/t-set commands in the previous table follow.
Use defset to define the p/t-set initial to contain only thread 0:
pgdbg [all] 0> defset initial [0]"initial" [0] : [0]
Use the focus command to change the current p/t-set to initial:
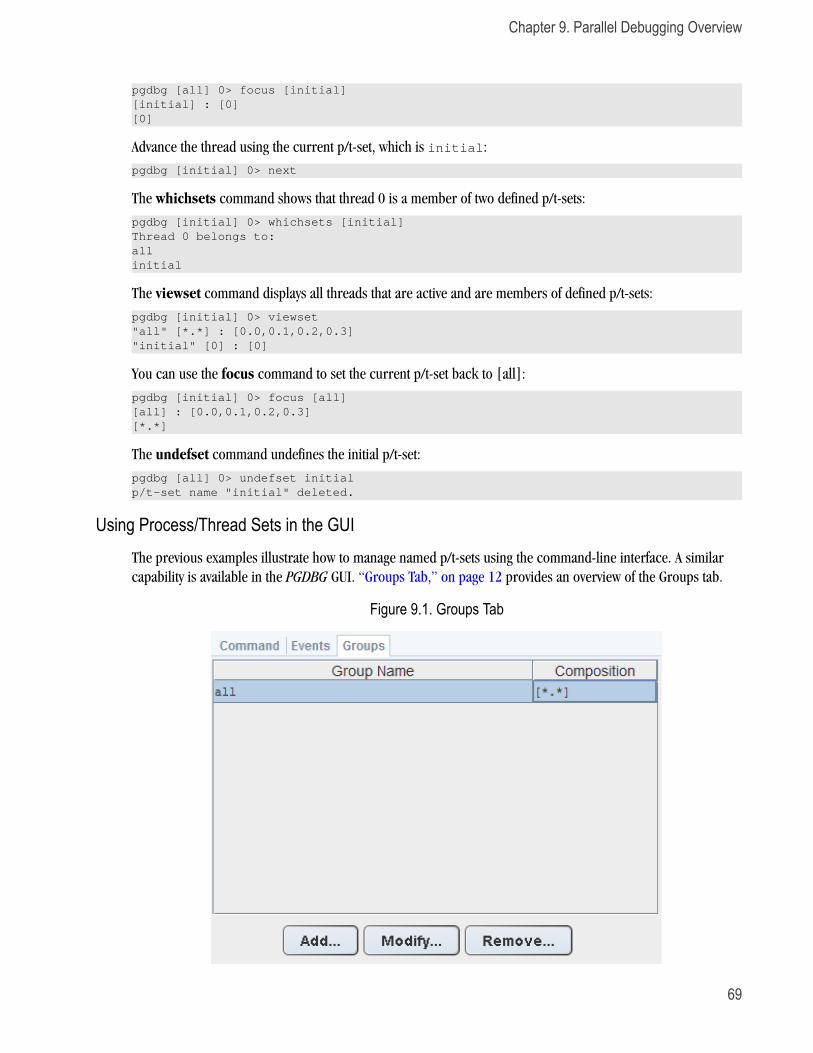
Chapter 9. Parallel Debugging Overview
69
pgdbg [all] 0> focus [initial][initial] : [0][0]
Advance the thread using the current p/t-set, which is initial:
pgdbg [initial] 0> next
The whichsets command shows that thread 0 is a member of two defined p/t-sets:
pgdbg [initial] 0> whichsets [initial]Thread 0 belongs to:allinitial
The viewset command displays all threads that are active and are members of defined p/t-sets:
pgdbg [initial] 0> viewset"all" [*.*] : [0.0,0.1,0.2,0.3]"initial" [0] : [0]
You can use the focus command to set the current p/t-set back to [all]:
pgdbg [initial] 0> focus [all][all] : [0.0,0.1,0.2,0.3][*.*]
The undefset command undefines the initial p/t-set:
pgdbg [all] 0> undefset initialp/t-set name "initial" deleted.
Using Process/Thread Sets in the GUIThe previous examples illustrate how to manage named p/t-sets using the command-line interface. A similar
capability is available in the PGDBG GUI. “Groups Tab,” on page 12 provides an overview of the Groups tab.
Figure 9.1. Groups Tab
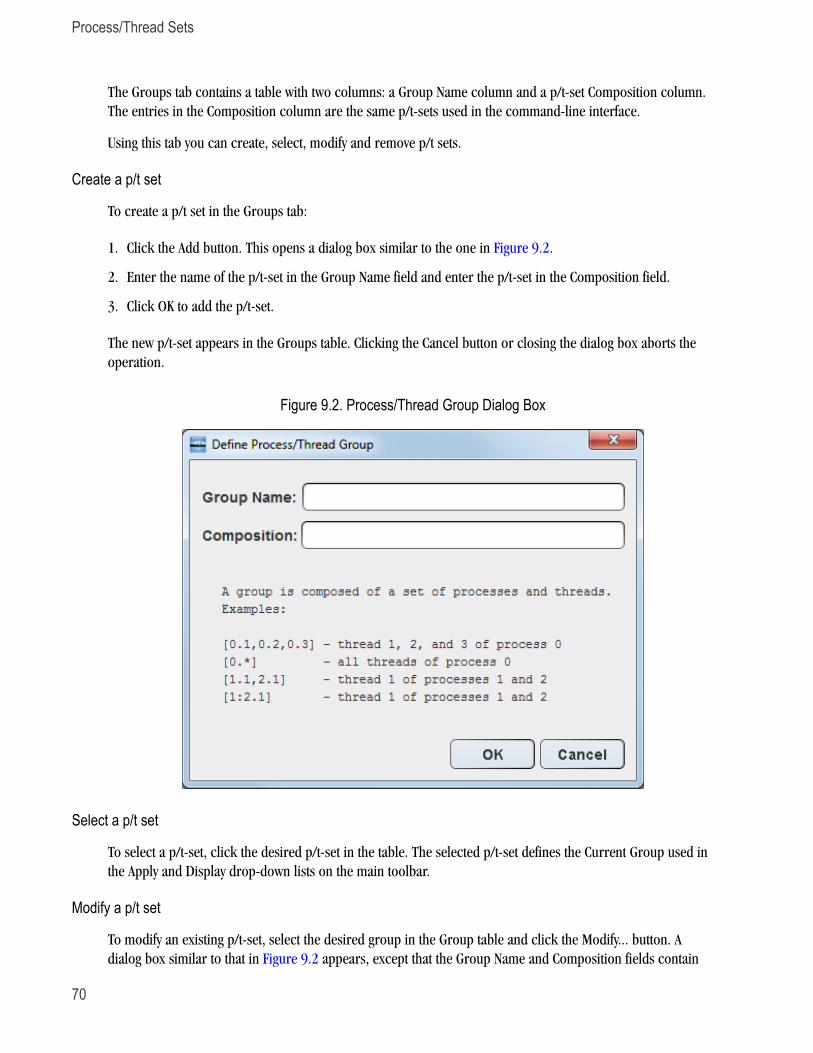
Process/Thread Sets
70
The Groups tab contains a table with two columns: a Group Name column and a p/t-set Composition column.
The entries in the Composition column are the same p/t-sets used in the command-line interface.
Using this tab you can create, select, modify and remove p/t sets.
Create a p/t set
To create a p/t set in the Groups tab:
1. Click the Add button. This opens a dialog box similar to the one in Figure 9.2.
2. Enter the name of the p/t-set in the Group Name field and enter the p/t-set in the Composition field.
3. Click OK to add the p/t-set.
The new p/t-set appears in the Groups table. Clicking the Cancel button or closing the dialog box aborts the
operation.
Figure 9.2. Process/Thread Group Dialog Box
Select a p/t set
To select a p/t-set, click the desired p/t-set in the table. The selected p/t-set defines the Current Group used in
the Apply and Display drop-down lists on the main toolbar.
Modify a p/t set
To modify an existing p/t-set, select the desired group in the Group table and click the Modify... button. A
dialog box similar to that in Figure 9.2 appears, except that the Group Name and Composition fields contain
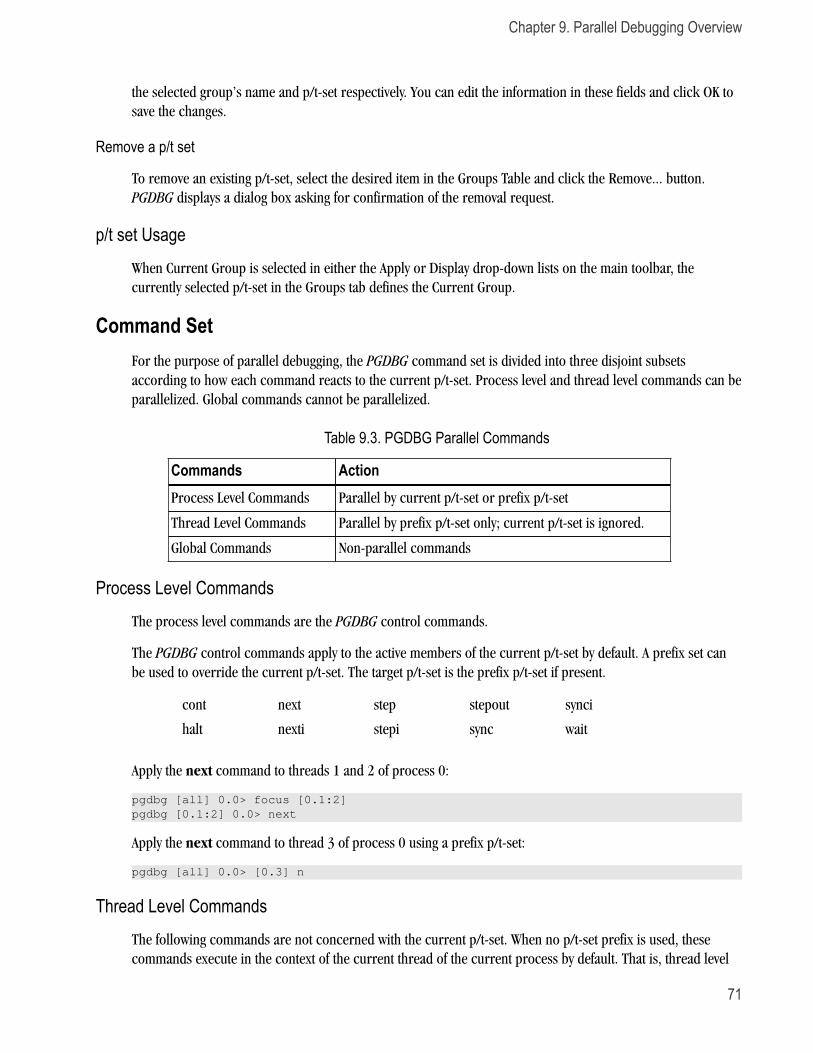
Chapter 9. Parallel Debugging Overview
71
the selected group’s name and p/t-set respectively. You can edit the information in these fields and click OK to
save the changes.
Remove a p/t set
To remove an existing p/t-set, select the desired item in the Groups Table and click the Remove... button.
PGDBG displays a dialog box asking for confirmation of the removal request.
p/t set UsageWhen Current Group is selected in either the Apply or Display drop-down lists on the main toolbar, the
currently selected p/t-set in the Groups tab defines the Current Group.
Command SetFor the purpose of parallel debugging, the PGDBG command set is divided into three disjoint subsets
according to how each command reacts to the current p/t-set. Process level and thread level commands can be
parallelized. Global commands cannot be parallelized.
Table 9.3. PGDBG Parallel Commands
Commands ActionProcess Level Commands Parallel by current p/t-set or prefix p/t-set
Thread Level Commands Parallel by prefix p/t-set only; current p/t-set is ignored.
Global Commands Non-parallel commands
Process Level CommandsThe process level commands are the PGDBG control commands.
The PGDBG control commands apply to the active members of the current p/t-set by default. A prefix set can
be used to override the current p/t-set. The target p/t-set is the prefix p/t-set if present.
cont next step stepout synci
halt nexti stepi sync wait
Apply the next command to threads 1 and 2 of process 0:
pgdbg [all] 0.0> focus [0.1:2]pgdbg [0.1:2] 0.0> next
Apply the next command to thread 3 of process 0 using a prefix p/t-set:
pgdbg [all] 0.0> [0.3] n
Thread Level CommandsThe following commands are not concerned with the current p/t-set. When no p/t-set prefix is used, these
commands execute in the context of the current thread of the current process by default. That is, thread level
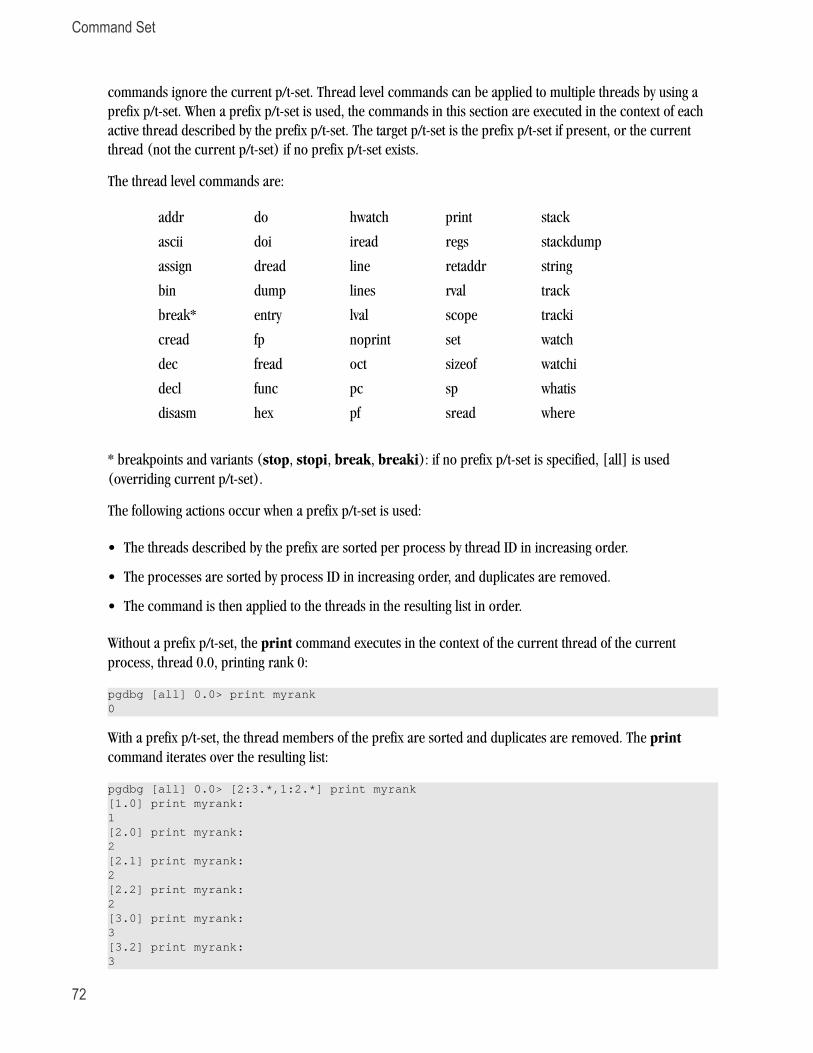
Command Set
72
commands ignore the current p/t-set. Thread level commands can be applied to multiple threads by using a
prefix p/t-set. When a prefix p/t-set is used, the commands in this section are executed in the context of each
active thread described by the prefix p/t-set. The target p/t-set is the prefix p/t-set if present, or the current
thread (not the current p/t-set) if no prefix p/t-set exists.
The thread level commands are:
addr do hwatch print stack
ascii doi iread regs stackdump
assign dread line retaddr string
bin dump lines rval track
break* entry lval scope tracki
cread fp noprint set watch
dec fread oct sizeof watchi
decl func pc sp whatis
disasm hex pf sread where
* breakpoints and variants (stop, stopi, break, breaki): if no prefix p/t-set is specified, [all] is used
(overriding current p/t-set).
The following actions occur when a prefix p/t-set is used:
• The threads described by the prefix are sorted per process by thread ID in increasing order.
• The processes are sorted by process ID in increasing order, and duplicates are removed.
• The command is then applied to the threads in the resulting list in order.
Without a prefix p/t-set, the print command executes in the context of the current thread of the current
process, thread 0.0, printing rank 0:
pgdbg [all] 0.0> print myrank0
With a prefix p/t-set, the thread members of the prefix are sorted and duplicates are removed. The print
command iterates over the resulting list:
pgdbg [all] 0.0> [2:3.*,1:2.*] print myrank[1.0] print myrank: 1 [2.0] print myrank: 2 [2.1] print myrank: 2 [2.2] print myrank: 2 [3.0] print myrank: 3 [3.2] print myrank: 3
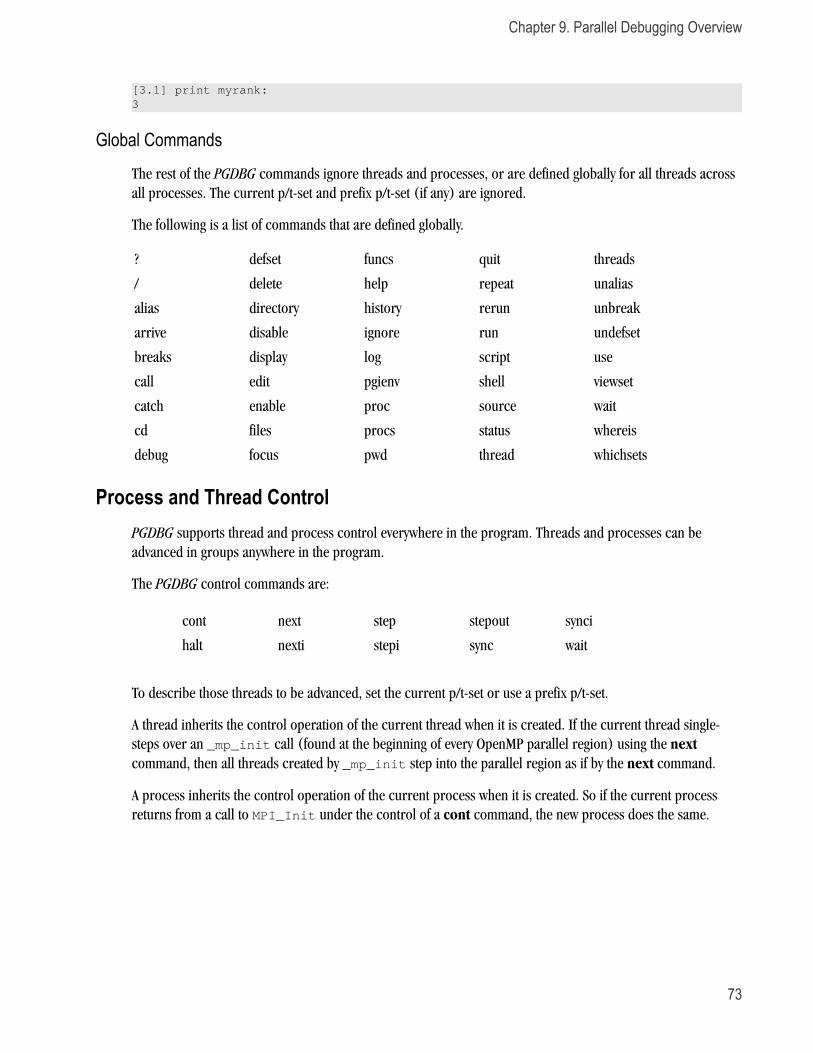
Chapter 9. Parallel Debugging Overview
73
[3.1] print myrank: 3
Global Commands
The rest of the PGDBG commands ignore threads and processes, or are defined globally for all threads across
all processes. The current p/t-set and prefix p/t-set (if any) are ignored.
The following is a list of commands that are defined globally.
? defset funcs quit threads
/ delete help repeat unalias
alias directory history rerun unbreak
arrive disable ignore run undefset
breaks display log script use
call edit pgienv shell viewset
catch enable proc source wait
cd files procs status whereis
debug focus pwd thread whichsets
Process and Thread ControlPGDBG supports thread and process control everywhere in the program. Threads and processes can be
advanced in groups anywhere in the program.
The PGDBG control commands are:
cont next step stepout synci
halt nexti stepi sync wait
To describe those threads to be advanced, set the current p/t-set or use a prefix p/t-set.
A thread inherits the control operation of the current thread when it is created. If the current thread single-
steps over an _mp_init call (found at the beginning of every OpenMP parallel region) using the next
command, then all threads created by _mp_init step into the parallel region as if by the next command.
A process inherits the control operation of the current process when it is created. So if the current process
returns from a call to MPI_Init under the control of a cont command, the new process does the same.
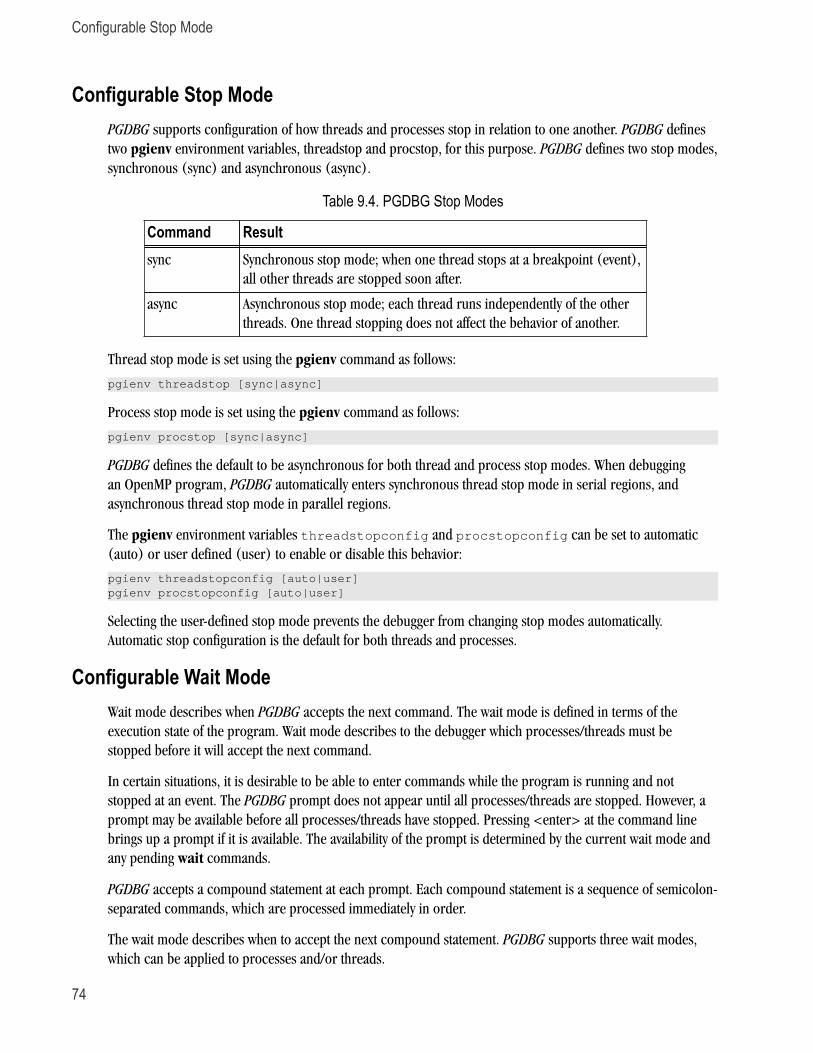
Configurable Stop Mode
74
Configurable Stop ModePGDBG supports configuration of how threads and processes stop in relation to one another. PGDBG defines
two pgienv environment variables, threadstop and procstop, for this purpose. PGDBG defines two stop modes,
synchronous (sync) and asynchronous (async).
Table 9.4. PGDBG Stop Modes
Command Resultsync Synchronous stop mode; when one thread stops at a breakpoint (event),
all other threads are stopped soon after.
async Asynchronous stop mode; each thread runs independently of the other
threads. One thread stopping does not affect the behavior of another.
Thread stop mode is set using the pgienv command as follows:
pgienv threadstop [sync|async]
Process stop mode is set using the pgienv command as follows:
pgienv procstop [sync|async]
PGDBG defines the default to be asynchronous for both thread and process stop modes. When debugging
an OpenMP program, PGDBG automatically enters synchronous thread stop mode in serial regions, and
asynchronous thread stop mode in parallel regions.
The pgienv environment variables threadstopconfig and procstopconfig can be set to automatic
(auto) or user defined (user) to enable or disable this behavior:
pgienv threadstopconfig [auto|user]pgienv procstopconfig [auto|user]
Selecting the user-defined stop mode prevents the debugger from changing stop modes automatically.
Automatic stop configuration is the default for both threads and processes.
Configurable Wait ModeWait mode describes when PGDBG accepts the next command. The wait mode is defined in terms of the
execution state of the program. Wait mode describes to the debugger which processes/threads must be
stopped before it will accept the next command.
In certain situations, it is desirable to be able to enter commands while the program is running and not
stopped at an event. The PGDBG prompt does not appear until all processes/threads are stopped. However, a
prompt may be available before all processes/threads have stopped. Pressing <enter> at the command line
brings up a prompt if it is available. The availability of the prompt is determined by the current wait mode and
any pending wait commands.
PGDBG accepts a compound statement at each prompt. Each compound statement is a sequence of semicolon-
separated commands, which are processed immediately in order.
The wait mode describes when to accept the next compound statement. PGDBG supports three wait modes,
which can be applied to processes and/or threads.
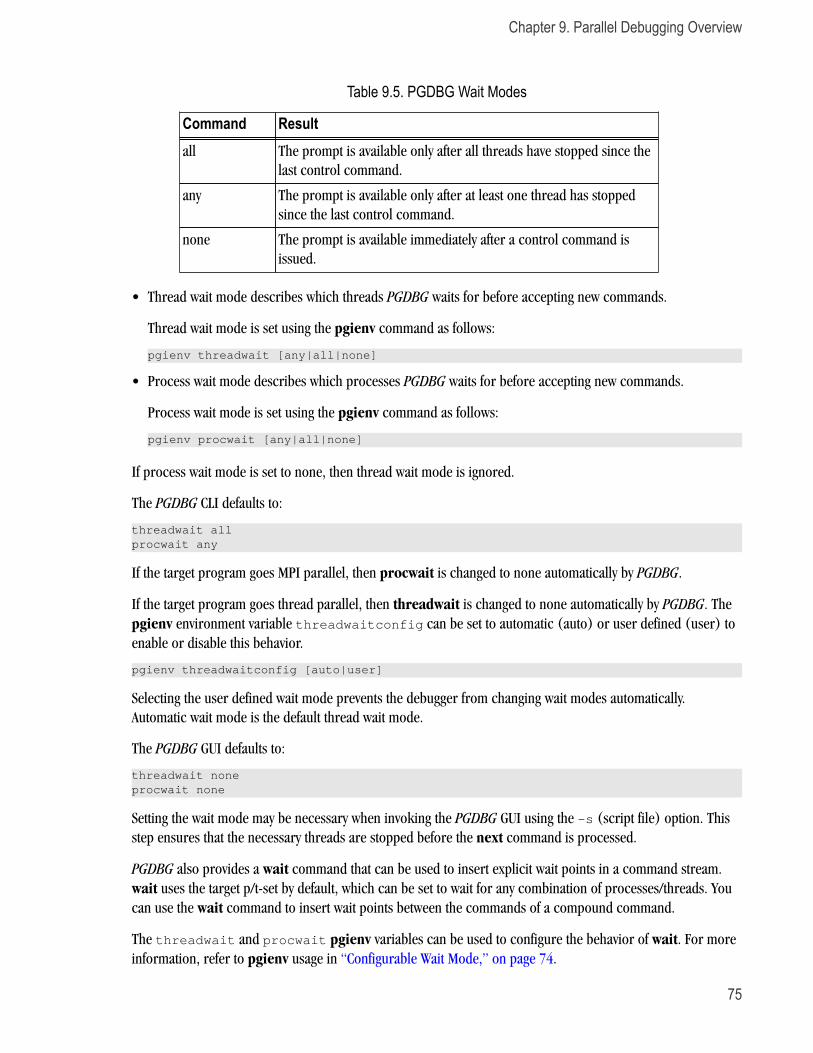
Chapter 9. Parallel Debugging Overview
75
Table 9.5. PGDBG Wait Modes
Command Resultall The prompt is available only after all threads have stopped since the
last control command.
any The prompt is available only after at least one thread has stopped
since the last control command.
none The prompt is available immediately after a control command is
issued.
• Thread wait mode describes which threads PGDBG waits for before accepting new commands.
Thread wait mode is set using the pgienv command as follows:
pgienv threadwait [any|all|none]
• Process wait mode describes which processes PGDBG waits for before accepting new commands.
Process wait mode is set using the pgienv command as follows:
pgienv procwait [any|all|none]
If process wait mode is set to none, then thread wait mode is ignored.
The PGDBG CLI defaults to:
threadwait allprocwait any
If the target program goes MPI parallel, then procwait is changed to none automatically by PGDBG.
If the target program goes thread parallel, then threadwait is changed to none automatically by PGDBG. The
pgienv environment variable threadwaitconfig can be set to automatic (auto) or user defined (user) to
enable or disable this behavior.
pgienv threadwaitconfig [auto|user]
Selecting the user defined wait mode prevents the debugger from changing wait modes automatically.
Automatic wait mode is the default thread wait mode.
The PGDBG GUI defaults to:
threadwait noneprocwait none
Setting the wait mode may be necessary when invoking the PGDBG GUI using the -s (script file) option. This
step ensures that the necessary threads are stopped before the next command is processed.
PGDBG also provides a wait command that can be used to insert explicit wait points in a command stream.
wait uses the target p/t-set by default, which can be set to wait for any combination of processes/threads. You
can use the wait command to insert wait points between the commands of a compound command.
The threadwait and procwait pgienv variables can be used to configure the behavior of wait. For more
information, refer to pgienv usage in “Configurable Wait Mode,” on page 74.
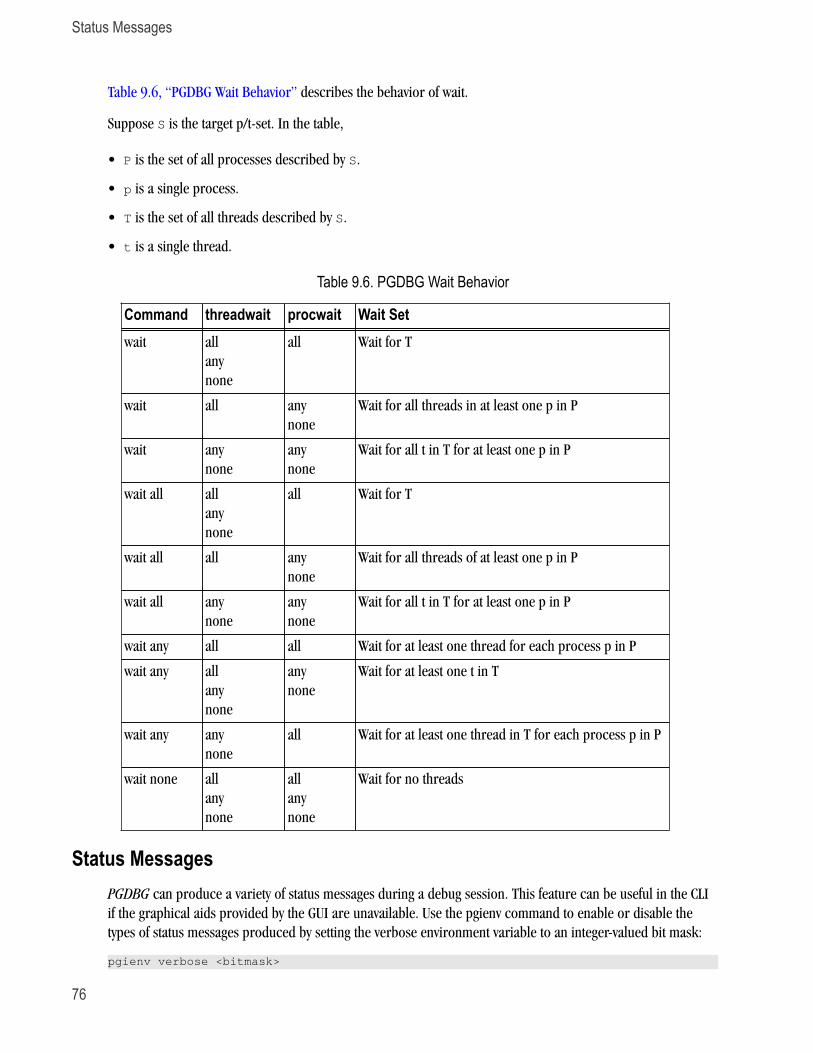
Status Messages
76
Table 9.6, “PGDBG Wait Behavior” describes the behavior of wait.
Suppose S is the target p/t-set. In the table,
• P is the set of all processes described by S.
• p is a single process.
• T is the set of all threads described by S.
• t is a single thread.
Table 9.6. PGDBG Wait Behavior
Command threadwait procwait Wait Setwait all
any
none
all Wait for T
wait all any
none
Wait for all threads in at least one p in P
wait any
none
any
none
Wait for all t in T for at least one p in P
wait all all
any
none
all Wait for T
wait all all any
none
Wait for all threads of at least one p in P
wait all any
none
any
none
Wait for all t in T for at least one p in P
wait any all all Wait for at least one thread for each process p in P
wait any all
any
none
any
none
Wait for at least one t in T
wait any any
none
all Wait for at least one thread in T for each process p in P
wait none all
any
none
all
any
none
Wait for no threads
Status MessagesPGDBG can produce a variety of status messages during a debug session. This feature can be useful in the CLI
if the graphical aids provided by the GUI are unavailable. Use the pgienv command to enable or disable the
types of status messages produced by setting the verbose environment variable to an integer-valued bit mask:
pgienv verbose <bitmask>
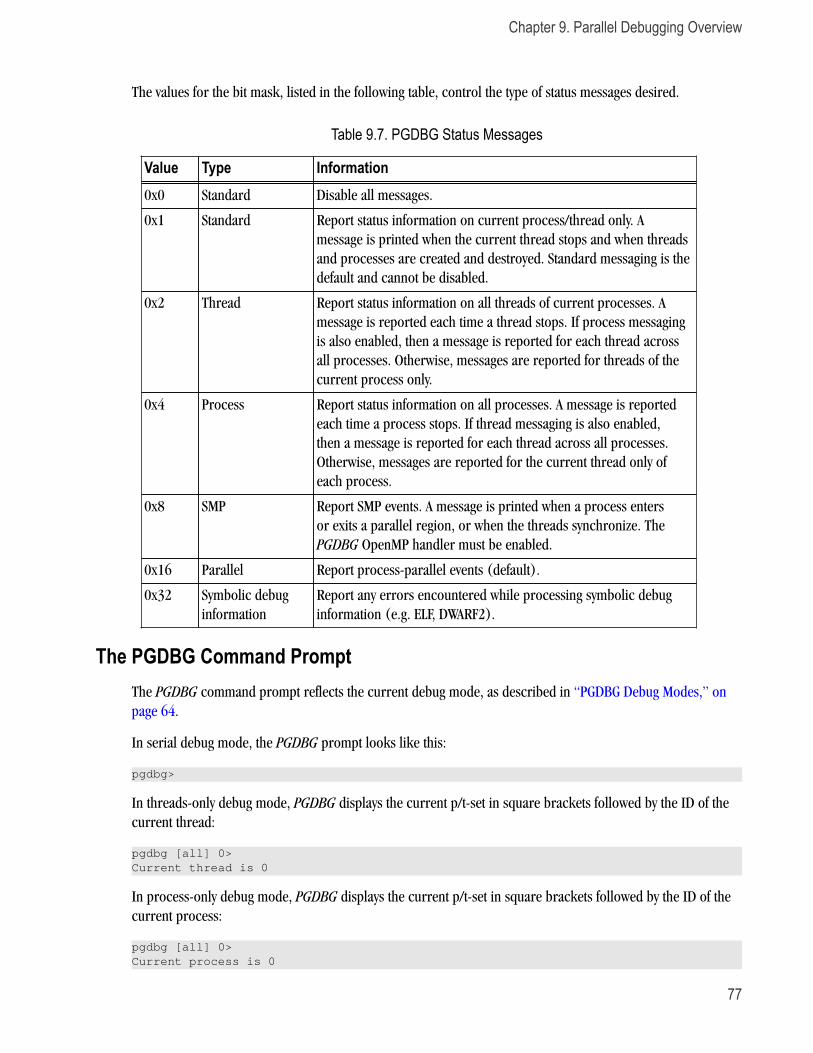
Chapter 9. Parallel Debugging Overview
77
The values for the bit mask, listed in the following table, control the type of status messages desired.
Table 9.7. PGDBG Status Messages
Value Type Information0x0 Standard Disable all messages.
0x1 Standard Report status information on current process/thread only. A
message is printed when the current thread stops and when threads
and processes are created and destroyed. Standard messaging is the
default and cannot be disabled.
0x2 Thread Report status information on all threads of current processes. A
message is reported each time a thread stops. If process messaging
is also enabled, then a message is reported for each thread across
all processes. Otherwise, messages are reported for threads of the
current process only.
0x4 Process Report status information on all processes. A message is reported
each time a process stops. If thread messaging is also enabled,
then a message is reported for each thread across all processes.
Otherwise, messages are reported for the current thread only of
each process.
0x8 SMP Report SMP events. A message is printed when a process enters
or exits a parallel region, or when the threads synchronize. The
PGDBG OpenMP handler must be enabled.
0x16 Parallel Report process-parallel events (default).
0x32 Symbolic debug
information
Report any errors encountered while processing symbolic debug
information (e.g. ELF, DWARF2).
The PGDBG Command PromptThe PGDBG command prompt reflects the current debug mode, as described in “PGDBG Debug Modes,” on
page 64.
In serial debug mode, the PGDBG prompt looks like this:
pgdbg>
In threads-only debug mode, PGDBG displays the current p/t-set in square brackets followed by the ID of the
current thread:
pgdbg [all] 0>Current thread is 0
In process-only debug mode, PGDBG displays the current p/t-set in square brackets followed by the ID of the
current process:
pgdbg [all] 0>Current process is 0
Parallel Events
78
In multilevel debug mode, PGDBG displays the current p/t-set in square brackets followed by the ID of the
current thread prefixed by the id of its parent process:
pgdbg [all] 1.0>Current thread 1.0
The pgienv promptlen variable can be set to control the number of characters devoted to printing the
current p/t-set at the prompt.
Parallel EventsThis section describes how to use a p/t-set to define an event across multiple threads and processes. Events,
such as breakpoints and watchpoints, are user-defined events. User-defined events are thread-level commands,
described in “Thread Level Commands,” on page 71.
Breakpoints, by default, are set across all threads of all processes. A prefix p/t-set can be used to set
breakpoints on specific processes and threads. For example:
i) pgdbg [all] 0> b 15ii) pgdbg [all] 0> [all] b 15iii) pgdbg [all] 0> [0.1:3] b 15
(i) and (ii) are equivalent. (iii) sets a breakpoint only in threads 1,2,3 of process 0.
By default, all other user events are set for the current thread only. A prefix p/t-set can be used to set user
events on specific processes and threads. For example:
i) pgdbg [all] 0> watch globii) pgdbg [all] 0> [*] watch glob
(i) sets a watchpoint for glob on thread 0 only. (ii) sets a watchpoint for glob on all threads that are currently
active.
When a process or thread is created, it inherits all of the breakpoints defined for the parent process or thread.
All other events must be defined explicitly after the process or thread is created. All processes must be stopped
to add, enable, or disable a user event.
Events may contain if and do clauses. For example:
pgdbg [all] 0> [*] break func if (glob!=0) do {set f = 0}
The breakpoint fires only if glob is non-zero. The do clause is executed if the breakpoint fires. The if and do
clauses execute in the context of a single thread. The conditional in the if clause and the body of the do execute
in the context of a single thread, the thread that triggered the event. The conditional definition as above can be
restated as follows:
[0] if (glob!=0) {[0] set f = 0}[1] if (glob!=0) {[1] set f = 0}...
When thread 1 hits func, glob is evaluated in the context of thread 1. If glob evaluates to non-zero, f is bound
in the context of thread 1 and its value is set to 0.
Control commands can be used in do clauses, however they only apply to the current thread and are only well
defined as the last command in the do clause. For example:

Chapter 9. Parallel Debugging Overview
79
pgdbg [all] 0> [*] break func if (glob!=0) do {set f = 0; c}
If the wait command appears in a do clause, the current thread is added to the wait set of the current process.
For example:
pgdbg [all] 0> [*] break func if (glob!=0) do {set f = 0; c; wait}
If conditionals and do bodies cannot be parallelized with prefix p/t-sets. For example, the following command
is illegal:
pgdbg [all] 0> break func if (glob!=0) do {[*] set f = 0} ILLEGAL
The body of a do statement cannot be parallelized.
Parallel StatementsThis section describes how to use a p/t-set to define a statement that executes for multiple threads and
processes.
Parallel Compound/Block StatementsEach command in a compound statement is executed in order. The target p/t-set is applied to all statements in
a compound statement. The following two examples (i) and (ii) are equivalent:
i) pgdbg [all] 0>[*] break main; cont; wait; print f@11@iii) pgdbg [all] 0>[*] break main; [*]cont; [*]wait; [*]print f@11@i
Use the wait command if subsequent commands require threads to be stopped, as the print command in the
example does.
The threadwait and procwait environment variables do not affect how commands within a compound
statement are processed. These pgienv environment variables describe to PGDBG under what conditions
(state of program) it should accept the next (compound) statement.
Parallel If, Else StatementsA prefix p/t-set can be used to parallelize an if statement. An if statement executes in the context of the current
thread by default. The following example:
pgdbg [all] 0> [*] if (i==1) {break func; c; wait} else {sync func2}
is equivalent to the following pseudo-code:
for the subset of [*] where (i==1) break func; c; wait; for the subset of [*] where (i!=1) sync func2
Parallel While StatementsA prefix p/t-set can be used to parallelize a while statement. A while statement executes in the context of the
current thread by default. The following example:
pgdbg [all] 0> [*] while (i<10) {n; wait; print i}
is equivalent to the following pseudo-code:
Parallel Statements
80
loop: if the subset of [*] is the empty set goto done endif for the subset [s] of [*] where (i<10) [s]n; [s]wait; [s]print i; endfor goto loop
The while statement terminates when either the subset of the target p/t-set matching the while condition is the
empty set, or a return statement is executed in the body of the while.
Return StatementsThe return statement is defined only in serial context since it cannot return multiple values. When return is
used in a parallel statement, it returns the last value evaluated.
81
Chapter 10. Parallel Debugging withOpenMP
This chapter provides information on how to debug OpenMP applications. Before reading this chapter, review
the information in Chapter 9, “Parallel Debugging Overview”.
OpenMP and Multi-thread SupportPGDBG provides full control of threads in parallel regions. Commands can be applied to all threads, a single
thread, or a group of threads. Thread identification in PGDBG uses the native thread numbering scheme for
OpenMP applications; for other types of multi-threaded applications thread numbering is arbitrary. OpenMP
private data can be accessed accurately for each thread. PGDBG provides understandable status displays
regarding per-thread state and location.
Advanced features provide for configurable thread stop modes and wait modes, allowing debugger operation
that is concurrent with application execution.
Multi-thread and OpenMP DebuggingPGDBG automatically attaches to new threads as they are created during program execution. PGDBG reports
when a new thread is created and the thread ID of the new thread is printed.
([1] New Thread)
The system ID of the freshly created thread is available through the threads command. You can use the procs
command to display information about the parent process.
PGDBG maintains a conceptual current thread. When using the PGDBG CLI, the current thread is chosen by
using the thread command.
pgdbg [all] 2> thread 3pgdbg [all] 3>
When using the PGDBG GUI, the current thread can be selected using the Current Thread drop-down list or by
clicking in the Thread Grid. A subset of PGDBG commands known as thread-level commands apply only to the
current thread. See “Thread Level Commands,” on page 71, for more information.
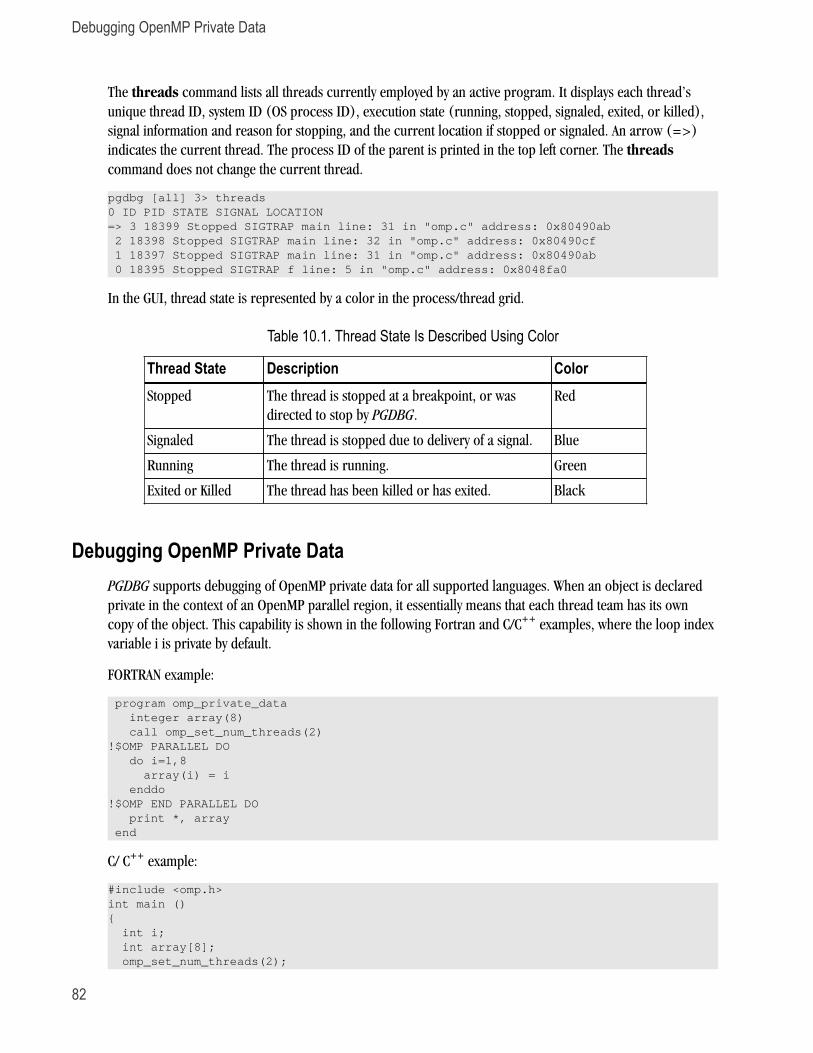
Debugging OpenMP Private Data
82
The threads command lists all threads currently employed by an active program. It displays each thread’s
unique thread ID, system ID (OS process ID), execution state (running, stopped, signaled, exited, or killed),
signal information and reason for stopping, and the current location if stopped or signaled. An arrow (=>)
indicates the current thread. The process ID of the parent is printed in the top left corner. The threads
command does not change the current thread.
pgdbg [all] 3> threads0 ID PID STATE SIGNAL LOCATION=> 3 18399 Stopped SIGTRAP main line: 31 in "omp.c" address: 0x80490ab 2 18398 Stopped SIGTRAP main line: 32 in "omp.c" address: 0x80490cf 1 18397 Stopped SIGTRAP main line: 31 in "omp.c" address: 0x80490ab 0 18395 Stopped SIGTRAP f line: 5 in "omp.c" address: 0x8048fa0
In the GUI, thread state is represented by a color in the process/thread grid.
Table 10.1. Thread State Is Described Using Color
Thread State Description ColorStopped The thread is stopped at a breakpoint, or was
directed to stop by PGDBG.
Red
Signaled The thread is stopped due to delivery of a signal. Blue
Running The thread is running. Green
Exited or Killed The thread has been killed or has exited. Black
Debugging OpenMP Private DataPGDBG supports debugging of OpenMP private data for all supported languages. When an object is declared
private in the context of an OpenMP parallel region, it essentially means that each thread team has its own
copy of the object. This capability is shown in the following Fortran and C/C++ examples, where the loop index
variable i is private by default.
FORTRAN example:
program omp_private_data integer array(8) call omp_set_num_threads(2)!$OMP PARALLEL DO do i=1,8 array(i) = i enddo!$OMP END PARALLEL DO print *, array end
C/ C++ example:
#include <omp.h>int main (){ int i; int array[8]; omp_set_num_threads(2);
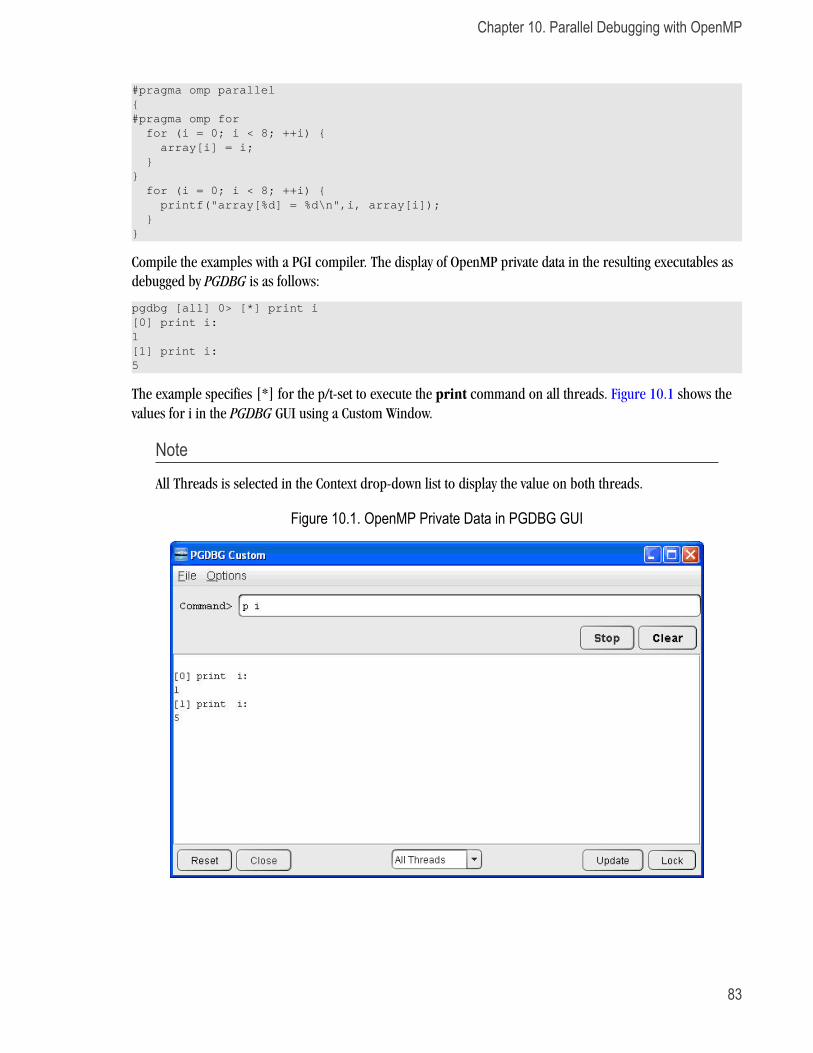
Chapter 10. Parallel Debugging with OpenMP
83
#pragma omp parallel{#pragma omp for for (i = 0; i < 8; ++i) { array[i] = i; }} for (i = 0; i < 8; ++i) { printf("array[%d] = %d\n",i, array[i]); }}
Compile the examples with a PGI compiler. The display of OpenMP private data in the resulting executables as
debugged by PGDBG is as follows:
pgdbg [all] 0> [*] print i[0] print i: 1[1] print i: 5
The example specifies [*] for the p/t-set to execute the print command on all threads. Figure 10.1 shows the
values for i in the PGDBG GUI using a Custom Window.
Note
All Threads is selected in the Context drop-down list to display the value on both threads.
Figure 10.1. OpenMP Private Data in PGDBG GUI

84
85
Chapter 11. Parallel Debugging withMPI
PGDBG is a parallel application debugger capable of debugging multi-process MPI applications and
hybrid multi-thread/multi-process applications that use MPI to communicate between multi-threaded or
OpenMP processes. This section begins with a general overview of how to use PGDBG to debug parallel
MPI applications before detailing how to launch MPI applications under debug using the various supported
platforms and versions of MPI.
For information on compiling a program using MPI, refer to “Using MPI” in the PGI Compiler User’s Guide.
MPI and Multi-Process SupportPGDBG can debug MPI applications running on the local system or distributed across a cluster. MPI
applications must be started under debugger control. Process identification uses the MPI rank within
MPI_COMM_WORLD.
MPI debugging is supported on Linux, Windows, and Mac OSX. Applications are limited to 256 processes and
64 threads per process, depending on your PGI license keys. A PGI CDK license is required to enable PGDBG's
distributed debugging capabilities.
Launch Debugging From Within the GUIDebugging of almost every type of MPI program can be started from within the Connections tab. MPICH-1 is
the single exception; launching an MPICH-1 program for debug must be done from the command line.
Select the MPI option on the Connections tab to enable the MPI-specific fields. The Command field must be
used to specify the path, including the executable, to the MPI launch program (i.e., mpiexec, mpirun, job
submit). The Arguments field is optional. Use it to pass arguments to the MPI launch program (i.e., -n 8).
Launch Debugging From the Command Line
MPICH-1Debugging of an MPICH-1 program using the GUI must be started by invoking mpirun at the command line:
Launch Debugging From the Command Line
86
% mpirun -np nprocs -dbg=pgdbg executable [ arg1,...argn ]
A default connection will be created for this MPICH-1 session. You cannot save this connection. MPICH-1
debugging cannot be restarted from within the GUI; you must rerun the mpirun command.
MPICH-2To launch debugging of an MPICH-2 program from the command line, use this command:
% pgdbg [-text] -mpi[:<launcher>] <mpiexec_args> [ -program_args arg1,...argn ]
You can use –mpi without an argument if, as is the case for MPICH-2, the launcher is named mpiexec.
If the path for <launcher> is not part of the PATH environment variable, then you must specify the full path
to the <launcher> command.
Another way to invoke the PGDBG GUI for debugging an MPICH-2 job applies only to the PGI CDK version of
MPICH-2:
% mpiexec -np nprocs -pgi executable [ arg1,...argn ]
MVAPICHTo launch debugging of an MVAPICH program from the command line, use this command:
% pgdbg [-text] -mpi[:<launcher>] <mpiexec_args> [ -program_args arg1,...argn ]
For MVAPICH, <launcher> is mpirun_rsh, so use -mpi:mpirun_rsh.If the path for <launcher> is
not part of the PATH environment variable, then you must specify the full path to the <launcher> command.
MSMPI (Local)MSMPI applications can be run and debugged locally. In other words, an HPC Server cluster is not required to
take advantage of MSMPI.
To invoke the PGDBG debugger to debug an MSMPI application locally, use the pgdbg -mpi option:
PGI$ pgdbg -mpi[:<path>] <mpiexec_args> [-program_args arg1,...argn]
The location of mpiexec should be part of your PATH environment variable. Otherwise, you should specify the
pathname for mpiexec as <path> in -mpi[:<path>].
In this example, to debug an MSMPI application named prog using four processes running on the host
system, use a command like this one:
PGI$ pgdbg -mpi -n 4 prog.exe
MSMPI (Cluster)PGDBG provides support for debugging MSMPI applications on Windows HPC Server 2008 clusters. To use
PGDBG for Windows cluster debugging, you must first install components of the Microsoft runtime libraries on
each compute node of the cluster.
Your PGI installation provided the install packages for these components. Assuming that your installation was
made to the C: drive, find these packages here:
Chapter 11. Parallel Debugging with MPI
87
C:\Program Files\PGI\Microsoft Open Tools 10\redist\amd64\vcredist_x64.exe
C:\Program Files\PGI\Microsoft Open Tools 10\redist\x86\vcredist_x86.exe
On 64-bit compute nodes, install both packages. On 32-bit compute nodes, you only need to install
vcredist_x86.exe.
Microsoft's cluster management software uses a job management application to launch and manage
executables on the head and cluster nodes. To begin distributed debugging on a cluster, invoke pgdbg with
both the -pgserv and -mpi options:
pgdbg -pgserv:<path_to_pgserv.exe> -mpi[:<job submit command>]
The -pgserv option causes the PGDBG remote debug agent, called pgserv, to be copied into the current
working directory when debugging is launched. This action ensures that pgserv can be found on all the nodes.
The job submit command references Microsoft's HPC Job Manager.
The current working directory must be designated as a shared directory across all nodes of the cluster. All
nodes must have access to this directory in order for distributed execution and debugging to succeed.
In this example, to debug an MSMPI application named prog using four processes running on a Windows
cluster, use a command like this:
PGI$ pgdbg -pgserv -mpi:job.exe submit /numprocessors:4 /workdir:\\head-node\shareddir mpiexec prog.exe
Using MPI on Linux
Installing MPIWhen installed as part of the PGI Cluster Development Kit (CDK) on Linux platforms, PGDBG supports multi-
process MPI debugging. The PGI CDK contains versions of MPICH-1, MPICH-2, and MVAPICH pre-configured
to support debugging cluster applications with PGDBG. Versions of MPI not included in the PGI CDK must be
configured to support PGDBG. For more information, refer to the PGI Installation Guide or www.pgroup.com/
support/faq.htm.
Randomized Load AddressesNewer versions of the Linux kernel support a security feature that allows shared objects to be loaded at
randomized addresses.
PGDBG supports debugging of MPI jobs running on Linux kernels when this address randomization mode
is enabled. However, when this mode is enabled, the current implementation of PGDBG does not share
symbol table information associated with shared objects that are loaded by each process of an MPI job, which
increases memory usage by PGDBG. Therefore, PGI recommends that this kernel mode be disabled on Linux
clusters where PGDBG is used to debug MPI applications.
You can disable randomization mode by executing the following command as root on each node of the cluster:
sysctl -w kernel.randomize_va_space=0
PGDBG emits a warning whenever it detects that it is being invoked on a multi-process MPI job when this
kernel mode is enabled.
Using MPI on Windows
88
Using MPI on WindowsPGDBG supports Microsoft's version of MPI called MSMPI. PGDBG can debug MSMPI programs running
locally or on a distributed system. This section provides general information about building with and
debugging MSMPI applications
Installing MSMPITo use the RTM, SP1 or SP2 versions of MSMPI, install Microsoft HPC Pack 2008 SDK. To use the SP3 or SP4
version instead, install the HPC Pack 2008 R2 MS-MPI Redistributable Package. These install packages are
available for download directly from Microsoft. You must install the MS-MPI components before you can build,
run, or debug MSMPI applications.
Building with MSMPITo build an application using the MSMPI libraries, use the option -Mmpi=msmpi. This compiler flag inserts
options into the compile and link lines to pick up the MSMPI headers and libraries.
Process ControlHere are some general things to consider when debugging an MPI program:
• Use the Groups tab (p/t-sets in the CLI) to focus on a set of processes. Be mindful of process dependencies.
• For a running process to receive a message, the sending process must be allowed to run.
• Process synchronization points, such as MPI_Barrier, do not return until all processes have hit the sync
point.
• MPI_Finalize acts as an implicit barrier except when using MPICH-1 where Process 0 returns while
Processes 1 through n-1 exit.
You can apply a control command, such as cont or step, to a stopped process while other processes are
running. A control command applied to a running process is applied to the stopped threads of that process
and is ignored by its running threads.
PGDBG automatically switches to process wait mode none as soon as it attaches to its first MPI process. See
the pgienv command and “Configurable Wait Mode,” on page 74 for details.
PGDBG automatically attaches to new MPI processes as they are created by the running MPI application.
PGDBG displays an informational message as it attaches to the freshly created processes.
([1] New Process)
The MPI global rank is printed with the message.
You can use the procs command to list the host and the PID of each process by rank. The current process is
indicated by an arrow (=>). You can use the proc command to change the current process by process ID.
Chapter 11. Parallel Debugging with MPI
89
Process 1: Thread 0 Stopped at 0x804a0e2, function main, file MPI.c, line 30 #30: aft=time(&aft); ID IPID STATE THREADS HOST 0 24765 Stopped 1 local => 1 17890 Stopped 1 red2.wil.st.com
The execution state of a process is described in terms of the execution state of its component threads. For a
description of how thread state is represented in the GUI, refer to Table 10.1, “Thread State Is Described Using
Color,” on page 82.
The PGDBG command prompt displays the current process and the current thread. In the above example, the
current process was changed to process 1 by the proc 1 command and the current thread of process 1 is 0;
this is written as 1.0:
pgdbg [all] 1.0>
For a complete description of the prompt format, refer to “Process and Thread Control,” on page 73.
The following rules apply during a PGDBG debug session:
• PGDBG maintains a conceptual current process and current thread.
• Each active process has a thread set of size >=1.
• The current thread is a member of the thread set of the current process.
Certain commands, when executed, apply only to the current process or the current thread. For more
information, refer to “Process Level Commands,” on page 71 and “Thread Level Commands,” on page 71.
The PGI license keys restrict the total number of MPI processes that can be debugged. In addition, there are
internal limits on the number of threads per process that can be debugged.
Process SynchronizationUse the PGDBG sync command to synchronize a set of processes to a particular point in the program. The
following command runs all processes to MPI_Finalize:
pgdbg [all] 0.0> sync MPI_Finalize
The following command runs all threads of process 0 and process 1 to MPI_Finalize:
pgdbg [all] 0.0> [0:1.*] sync MPI_Finalize
A sync command only successfully syncs the target processes if the sync address is well defined for each
member of the target process set, and all process dependencies are satisfied. If these conditions are not met,
a member could wait forever for a message. The debugger cannot predict if a text address is in the path of an
executing process.
MPI Message QueuesPGDBG can dump MPI message queues. When using the CLI, use the mqdump command, described in
“Memory Access,” on page 117. When using the GUI, the message queues are displayed in the MPI Messages
debug information tab.
pgdbg [all] 0.0> proc 1; procs
MPI Groups
90
The following error message may appear in the MPI Messages tab or when invoking mqdump:
ERROR: MPI Message Queue library not found.Try setting ‘PGDBG_MQS_LIB_OVERRIDE’environment variableor set via the PGDBG command: pgienv mqslib <path>.
If this message is displayed, then the PGDBG_MQS_LIB_OVERRIDE environment variable should be set to the
absolute path of libtvmpich.so or another shared object that is compatible with the version of MPI being
used. The default path can also be overridden via the mqslib variant of the pgienv command.
Microsoft MPI does not currently provide support for dumping message queues.
MPI GroupsPGDBG identifies each process by its MPI_COMM_WORLD rank. In general, PGDBG currently ignores MPI
groups.
Use halt instead of Ctrl+CEntering Ctrl+C from the PGDBG command line can be used to halt all running processes. However, this is not
the preferred method to use while debugging an MPICH-1 program. PGDBG automatically switches to process
wait mode none (pgienv procwait none) as soon as it attaches to its first MPI process.
Setting pgienv procwait none allows commands to be entered while there are running processes, which
allows the use of the halt command to stop running processes without the use of Ctrl+C.
Notehalt cannot interrupt a wait command. Ctrl+C must be used for this.
In MPI debugging, wait should be used with care.
SSH and RSHBy default, PGDBG uses rsh for communication between remote PGDBG components. PGDBG can also use
ssh for secure environments. The environment variable PGRSH should be set to ssh or rsh, to indicate the
desired communication method.
If you opt to use ssh as the mechanism for launching the remote components of PGDBG, you may want to
do some additional configuration. The default configuration of ssh can result in a password prompt for each
remote cluster node on which the debugger runs. Check with your network administrator to make sure that
you comply with your local security policies when configuring ssh.
The following steps provide one way to configure SSH to eliminate this prompt. These instructions assume
$HOME is the same on all nodes of the cluster.
$ ssh-keygen -t dsa$ eval `ssh-agent -s`$ ssh-add <make sure that $HOME is not group-writable>$ cd $HOME/.ssh$ cat id_dsa.pub >> authorized_keys
Chapter 11. Parallel Debugging with MPI
91
Then for each cluster node you use in debugging, use:
$ ssh <host>
A few things that are important related to this example are these:
• The ssh-keygen command prompts for a passphrase that is used to authenticate to the ssh-agent during
future sessions. The passphrase can be anything you choose.
• Once you answer the prompts to make the initial connection, subsequent connections should not require
further prompting.
• The ssh-agent -s command is correct for sh or bash shells. For csh shells, use ssh-agent -c.
After logging out and logging back in, the ssh-agent must be restarted and reauthorized. For example, in a bash
shell, this is accomplished as follows:
$ eval `ssh-agent -s`$ ssh-add
You must enter the passphrase that was initially given to ssh-add to authenticate to the ssh-agent.
For further information, consult your ssh documentation.
Using the CLI
Setting DISPLAYTo use MPI debugging in text mode, be certain that the DISPLAY variable is undefined in the shell that is
invoking mpirun. If this variable is set, you can undefine it by using one of the following commands:
For sh/bash users, use this command:
$ unset DISPLAY
For csh/tcsh users, use this command:
% unsetenv DISPLAY
Using ContinueWhen debugging an MPI job after invoking the PGDBG CLI with the -mpi option, each process is stopped
before the first assembly instruction in the program. Continuing execution using step or next is not
appropriate; instead, use the cont command.
Debugging Support for MPICH-1With the CDK version of MPICH-1, PGDBG supports redirecting stdin, stdout, and stderr with the following
MPICH switches:
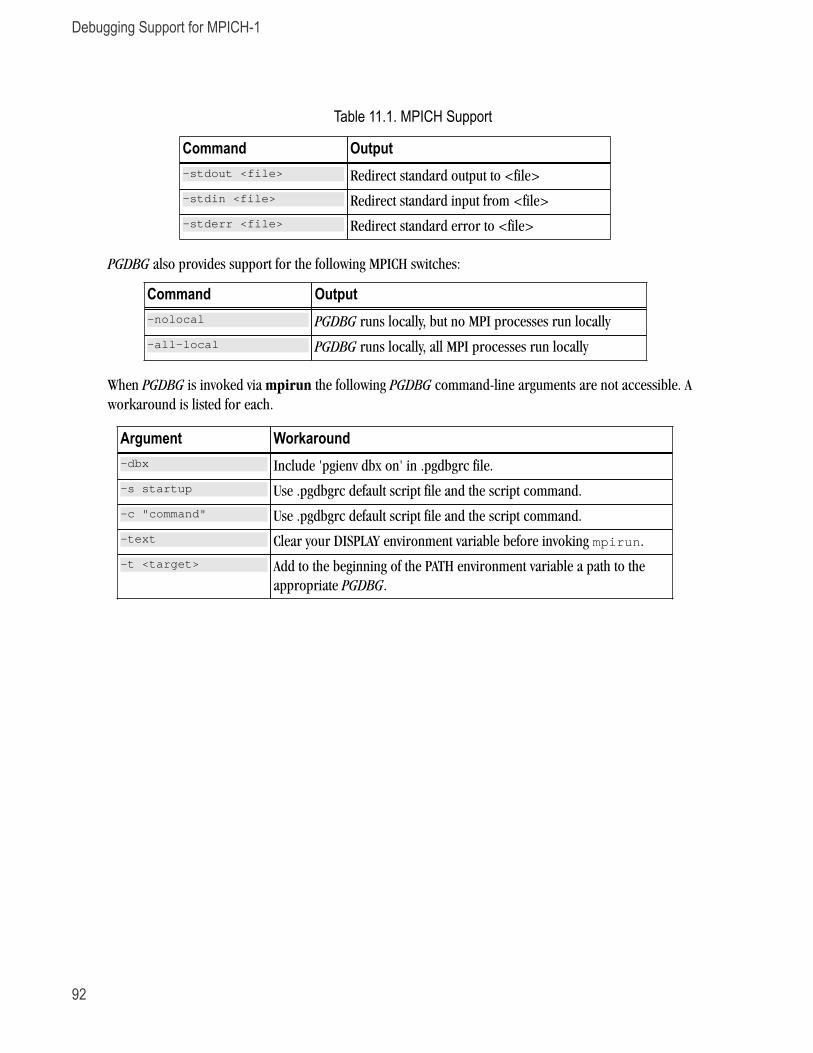
Debugging Support for MPICH-1
92
Table 11.1. MPICH Support
Command Output-stdout <file> Redirect standard output to <file>
-stdin <file> Redirect standard input from <file>
-stderr <file> Redirect standard error to <file>
PGDBG also provides support for the following MPICH switches:
Command Output-nolocal PGDBG runs locally, but no MPI processes run locally
-all-local PGDBG runs locally, all MPI processes run locally
When PGDBG is invoked via mpirun the following PGDBG command-line arguments are not accessible. A
workaround is listed for each.
Argument Workaround-dbx Include 'pgienv dbx on' in .pgdbgrc file.
-s startup Use .pgdbgrc default script file and the script command.
-c "command" Use .pgdbgrc default script file and the script command.
-text Clear your DISPLAY environment variable before invoking mpirun.
-t <target> Add to the beginning of the PATH environment variable a path to the
appropriate PGDBG.

93
Chapter 12. Parallel Debugging ofHybrid Applications
PGDBG supports debugging hybrid multi-thread/multi-process applications that use MPI to communicate
between multi-threaded or OpenMP processes. Multi-threaded and OpenMP applications may be run using
more threads than the available number of CPUs, and MPI applications may allocate more than one process
to a cluster node. PGDBG supports debugging the supported types of applications regardless of how well the
requested number of threads matches the number of CPUs or how well the requested number of processes
matches the number of cluster nodes.
PGDBG Multilevel Debug ModeAs described in “PGDBG Debug Modes,” on page 64, PGDBG can operate in four debug modes. The mode
determines a short form for uniquely naming threads and processes.
The debug mode is set automatically or can be set manually using the pgienv command.
When PGDBG detects multilevel debugging, it sets the debug mode to multilevel. To manually set the debug
mode to multilevel, use the pgienv command:
pgdbg> pgienv mode multilevel
Multilevel DebuggingThe name of a thread in multilevel debug mode is the thread ID prefixed with its parent process ID. This forms
a unique name for each thread across all processes. This naming scheme is valid in all debug modes. PGDBG
changes automatically to multilevel debug mode from process-only debug mode or threads-only debug mode
when at least one MPI process creates multiple threads.
Example 12.1. Thread IDs in multilevel debug mode
0.1 Thread 1 of process 0
0.* All threads of process 0
* All threads of all processes
Multilevel Debugging
94
In multilevel debug, mode status and error messages are prefixed with process/thread IDs depending on
context. Further, in multilevel debug mode, PGDBG displays the current p/t-set in square brackets followed by
the ID of the current thread prefixed by the ID of its parent process:
pgdbg [all] 1.0>Current thread 1.0
For more information on p/t sets, refer to “Process/Thread Sets,” on page 66.
95
Chapter 13. Command ReferenceThis chapter describes the PGDBG command set in detail, grouping the commands by these categories:
Conversions Miscellaneous Process-Thread Sets Scope
Events Printing Variables and
Expressions
Program Locations Symbols and Expressions
Memory Access Process Control Register Access Target
For an alphabetical listing of all the commands, with a brief description of each, refer to “Command
Summary,” on page 38 in “Command Summary”.
Notation Used in Command SectionsThe command sections that follow use these conventions for the command names and arguments, when the
command accepts one.
• Command names may be abbreviated by omitting the portion of the command name enclosed in brackets
([]).
• Argument names are italicized.
• Argument names are chosen to indicate what kind of argument is expected.
• Arguments enclosed in brackets ([]) are optional.
• Two or more arguments separated by a vertical line (|) indicate that any one of the arguments is acceptable.
• An ellipsis (...) indicates an arbitrarily long list of arguments.
• Other punctuation, such as commas and quotes, must be entered as shown.
Example 13.1. Syntax examples
Example 1:
lis[t] [count | lo:hi | routine | line,count]
Process Control
96
This syntax indicates that the command list may be abbreviated to lis, and that it can be invoked without any
arguments or with one of the following: an integer count, a line range, a routine name, or a line and a count.
Example 2:
att[ach] pid [exe]
This syntax indicates that the command attach may be abbreviated to att, and, when invoked, must have a
process ID argument, pid. Optionally you can specify an executable file, exe.
Process ControlThe following commands control the execution of the target program. PGDBG lets you easily group and
control multiple threads and processes. For more details, refer to “Basic Process and Thread Naming,” on
page 63.
attachatt[ach] pid [exe]
Attach to a running process with process ID pid. Use exe to specify the absolute path of the executable file.
For example, attach 1234 attempts to attach to a running process whose process ID is 1234. You may
enter something like attach 1234 /home/demo/a.out to attach to a process ID 1234 called /home/
demo/a.out.
PGDBG attempts to infer the arguments of the attached program. If PGDBG fails to infer the argument list, then
the program behavior is undefined if the run or rerun command is executed on the attached process.
The stdio channel of the attached process remains at the terminal from which the program was originally
invoked.
The attach command is not supported for MPI programs.
contc[ont]
Continue execution from the current location.
debugde[bug] [target [ arg1...argn]]
Load the specified target program with optional command-line arguments.
detachdet[ach]
Detach from the current running process.
Chapter 13. Command Reference
97
halthalt [command]
Halt the running process or thread.
loadlo[ad] [program [args]]
Without arguments, load prints the name and arguments of the program being debugged. With arguments,
load loads the specified program for debugging. Provide program arguments as needed.
nextn[ext] [count]
Stop after executing one source line in the current routine. This command steps over called routines. The
count argument stops execution only after executing count source lines.
nextinexti [count]
Stop after executing one instruction in the current routine. This command steps over called routines. The
count argument stops execution only after executing count instructions.
procproc [id]
Set the current process to the process identified by id. When issued with no argument, proc lists the location
of the current thread of the current process in the current program. For information on how processes are
numbered, refer to “Using the CLI,” on page 91.
procsprocs
Print the status of all active processes, listing each process by its logical process ID.
quitq[uit]
Terminate the debugging session.
rerunrer[un] [arg0arg1 ... argn] [< inputfile ] [ [ > | >& | >> | >>& ] outputfile ]
The rerun command is the same as run with one exception: if no args are specified with rerun, then no args
are used when the program is launched.
Process Control
98
runru[n] [arg0 arg1... argn] [< inputfile ] [ [ > | >& | >> | >>& ] outputfile ]
Execute the program from the beginning. If arguments arg0, arg1, and so on are specified, they are set up as
the command-line arguments of the program. Otherwise, the arguments for the previous run command are
used. Standard input and standard output for the target program can be redirected using < or > and an input
or output filename.
setargssetargs [arg1, arg2, ... argn]
Set program arguments for use by the run command. The rerun command does not use the arguments
specified by setargs.
steps[tep] [count | count]
Stop after executing one source line. This command steps into called routines. The count argument stops
execution after executing count source lines. The up argument stops execution after stepping out of the
current routine (see stepout).
stepistepi [count | up]
Stop after executing one instruction. This command steps into called routines. The count argument stops
execution after executing count instructions. The up argument stops the execution after stepping out of the
current routine (see stepout).
stepoutstepo[ut]
Stop after returning to the caller of the current subroutine. This command sets a breakpoint at the current
return address and continues execution to that point. For this command to work correctly, it must be possible
to compute the value of the return address. Some subroutines, particularly terminal (i.e. leaf) subroutines at
higher optimization levels, may not set up a stack frame. Executing stepout from such a routine causes the
breakpoint to be set in the caller of the most recent routine that set up a stack frame. This command halts
execution immediately upon return to the calling subroutine.
syncsy[nc] line | func
Advance to the specified source location, either the specified line or the first line in the specified function
func, ignoring any user-defined events.
Chapter 13. Command Reference
99
syncisynci addr | func
Advance to the specified address addr, or to the first address in the specified function func, ignoring any
user-defined events.
threadthread [number]
Set the current thread to the thread identified by number; where number is a logical thread ID in the current
process’ active thread list. When issued with no argument, thread lists the current program location of the
currently active thread.
threadsthreads
Print the status of all active threads. Threads are grouped by process. Each process is listed by its logical
process ID. Each thread is listed by its logical thread ID.
waitwait [any | all | none]
Return the PGDBG prompt only after specific processes or threads stop.
Process-Thread SetsThe following commands deal with defining and managing process thread sets. See “Process/Thread Sets,” on
page 66, for a detailed discussion of process-thread sets.
defsetdefset name [p/t-set]
Assign a name to a process/thread set. In other words, define a named set of processes/threads. This set can
then be referred to by its name. A list of named sets is stored by PGDBG.
focusfocus [p/t-set]
Set the target process/thread set for PGDBG commands. Subsequent commands are applied to the members of
this set by default.
undefsetundefset [name | -all]
Remove a previously defined process/thread set from the list of process/thread sets. The debugger-defined p/t-
set [all] cannot be removed.
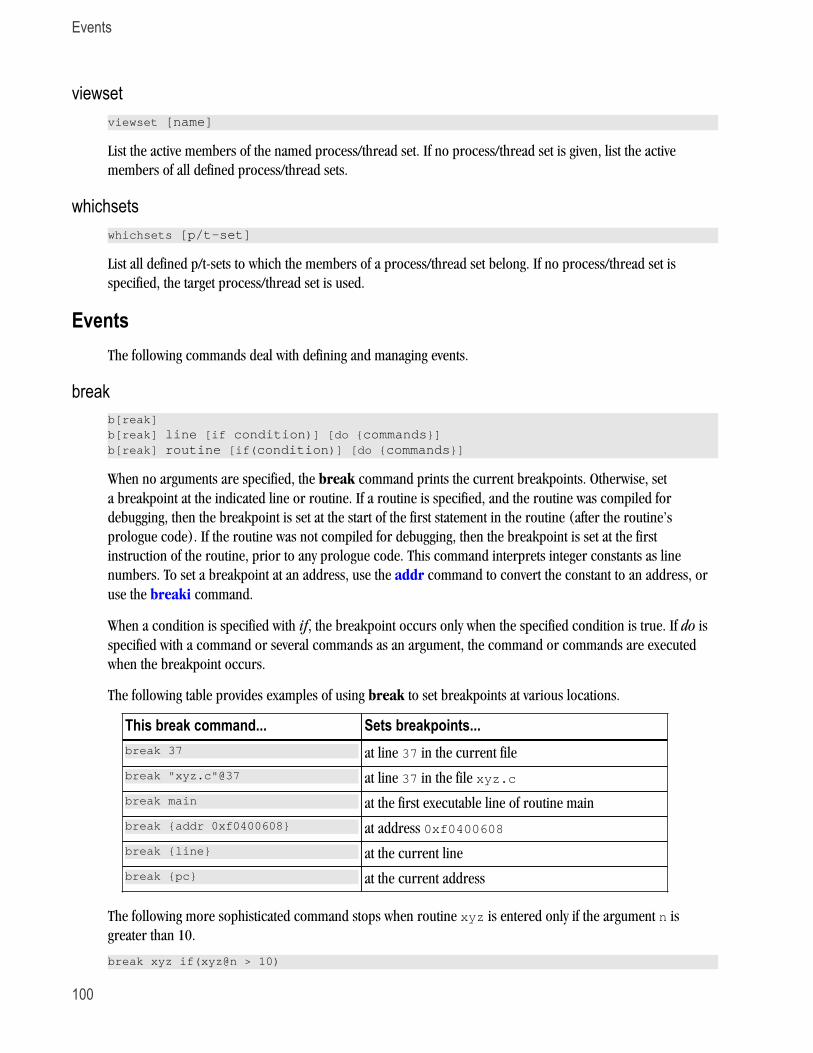
Events
100
viewsetviewset [name]
List the active members of the named process/thread set. If no process/thread set is given, list the active
members of all defined process/thread sets.
whichsetswhichsets [p/t-set]
List all defined p/t-sets to which the members of a process/thread set belong. If no process/thread set is
specified, the target process/thread set is used.
EventsThe following commands deal with defining and managing events.
breakb[reak] b[reak] line [if condition)] [do {commands}] b[reak] routine [if(condition)] [do {commands}]
When no arguments are specified, the break command prints the current breakpoints. Otherwise, set
a breakpoint at the indicated line or routine. If a routine is specified, and the routine was compiled for
debugging, then the breakpoint is set at the start of the first statement in the routine (after the routine’s
prologue code). If the routine was not compiled for debugging, then the breakpoint is set at the first
instruction of the routine, prior to any prologue code. This command interprets integer constants as line
numbers. To set a breakpoint at an address, use the addr command to convert the constant to an address, or
use the breaki command.
When a condition is specified with if, the breakpoint occurs only when the specified condition is true. If do is
specified with a command or several commands as an argument, the command or commands are executed
when the breakpoint occurs.
The following table provides examples of using break to set breakpoints at various locations.
This break command... Sets breakpoints...break 37 at line 37 in the current file
break "xyz.c"@37 at line 37 in the file xyz.c
break main at the first executable line of routine main
break {addr 0xf0400608} at address 0xf0400608
break {line} at the current line
break {pc} at the current address
The following more sophisticated command stops when routine xyz is entered only if the argument n is
greater than 10.
break xyz if(xyz@n > 10)
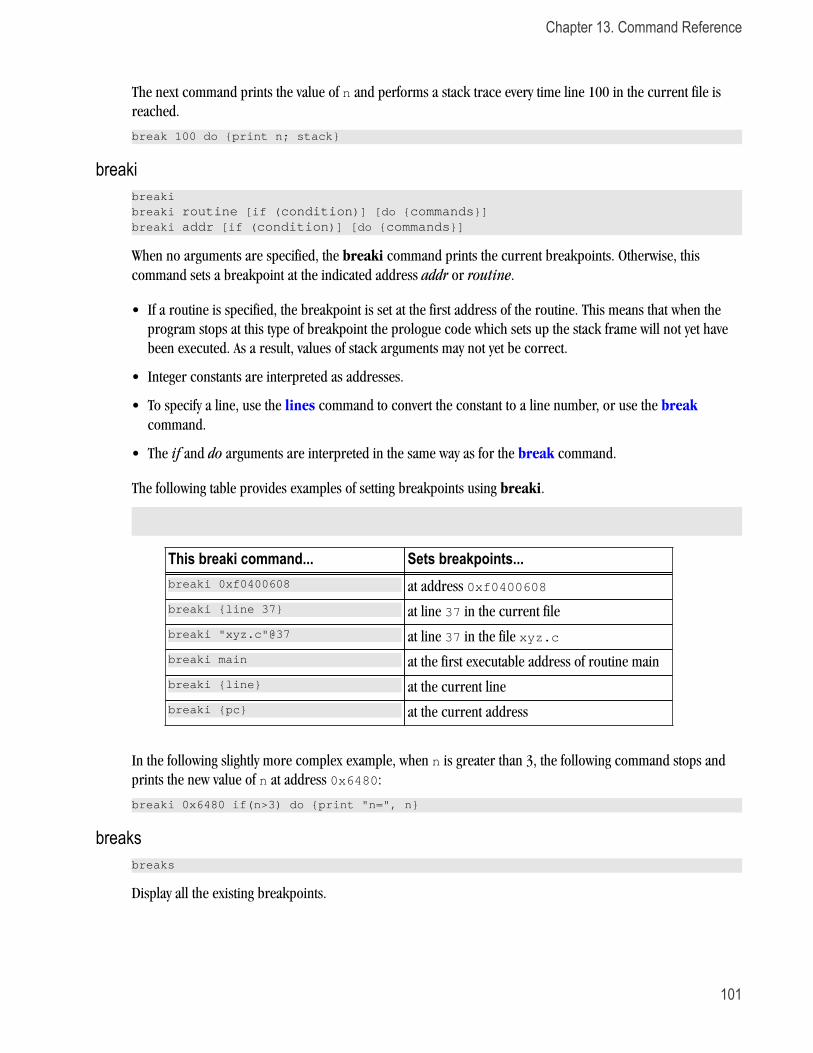
Chapter 13. Command Reference
101
The next command prints the value of n and performs a stack trace every time line 100 in the current file is
reached.
break 100 do {print n; stack}
breakibreakibreaki routine [if (condition)] [do {commands}] breaki addr [if (condition)] [do {commands}]
When no arguments are specified, the breaki command prints the current breakpoints. Otherwise, this
command sets a breakpoint at the indicated address addr or routine.
• If a routine is specified, the breakpoint is set at the first address of the routine. This means that when the
program stops at this type of breakpoint the prologue code which sets up the stack frame will not yet have
been executed. As a result, values of stack arguments may not yet be correct.
• Integer constants are interpreted as addresses.
• To specify a line, use the lines command to convert the constant to a line number, or use the break
command.
• The if and do arguments are interpreted in the same way as for the break command.
The following table provides examples of setting breakpoints using breaki.
This breaki command... Sets breakpoints...breaki 0xf0400608 at address 0xf0400608
breaki {line 37} at line 37 in the current file
breaki "xyz.c"@37 at line 37 in the file xyz.c
breaki main at the first executable address of routine main
breaki {line} at the current line
breaki {pc} at the current address
In the following slightly more complex example, when n is greater than 3, the following command stops and
prints the new value of n at address 0x6480:
breaki 0x6480 if(n>3) do {print "n=", n}
breaksbreaks
Display all the existing breakpoints.
Events
102
catchcatch [sig:sig] [sig [, sig...]]
When no arguments are specified, the catch command prints the list of signals being caught. With the sig:sig
argument, this command catches the specified range of signals. With a list of signals, catch the signals with
the specified number(s). When signals are caught, PGDBG intercepts the signal and does not deliver it to the
program. The program runs as though the signal was never sent.
clearclear [ all | routine| line | {addr addr}]
Clear one or more breakpoints. Use the all argument to clear all breakpoints. Use the routine argument
to clear all breakpoints from the first statement in the specified routine. Use the line number argument to
clear all breakpoints from the specified line number in the current source file. Use the addr argument, clear
breakpoints from the specified address addr.
When no arguments are specified, the clear command clears all breakpoints at the current location.
deletedel[ete] [event-number | 0 | all | event-number [, event-number...] ]
Use the delete command without arguments to list all defined events by their event-number.
Use the delete command with arguments to delete events. Delete all events with all or delete just the event with
the specified event-number. Providing the argument 0, that is, using delete 0, is the same as using delete
all.
disabledisab[le] [event-number | all ]
When no arguments are specified, the disable command prints both enabled and disabled events.
With arguments, this command disables the event specified by event-number or all events. Disabling an event
definition suppresses actions associated with the event, but leaves the event defined so that it can be used later.
(See the enable command.)
dodo {commands} [if (condition)]do {commands} at line [if (condition)]do {commands} in routine [if (condition)]
Define a do event. This command is similar to watch except that instead of defining an expression, it defines a
list of commands to be executed. Without the optional arguments at or in, the commands are executed at each
line in the program.
Use at with a line number to specify the commands to be executed each time that line is reached. Use in with
a routine to specify the commands to be executed at each line in the routine. The optional if argument has the
same meaning that it has in the watch. If a condition is specified, the do commands are executed only when
the condition is true.
Chapter 13. Command Reference
103
doidoi {commands} [if (condition)]doi {commands} at addr [if (condition)]doi {commands} in routine [if (condition)]
Define a doi event. This command is similar to watchi except that instead of defining an expression, doi
defines a list of commands to be executed. If an address addr is specified, then the commands are executed
each time that the specified address is reached. If a routine is specified, then the commands are executed
at each instruction in the routine. If neither an address nor a routine is specified, then the commands are
executed at each instruction in the program. The optional if argument has the same meaning that it has in the
do and watch commands. If a condition is specified, the doi commands are executed only when the condition
is true.
enableenab[le] [event-number | all ]
Without arguments, the enable command prints both enabled and disabled events.
With arguments, this command enables the event event-number or all events.
hwatchhwatch addr | var [if (condition)] [do {commands}]
Define a hardware watchpoint. This command uses hardware support to create a watchpoint for a particular
address or variable. The event is triggered by hardware when the byte at the given address is written. This
command is only supported on systems that provide the necessary hardware and software support.
Note
Only one hardware watchpoint can be defined at a time.
When the optional if argument is specified, the event action is only triggered if the expression is true. When the
optional do argument is specified, then the commands are executed when the event occurs.
hwatchbothhwatchb[oth] addr | var [if (condition)] [do {commands}]
Define a hardware read/write watchpoint. This event is triggered by hardware when the byte at the given
address or variable is either read or written. As with hwatch, system hardware and software support must
exist for this command to be supported. The optional if and do arguments have the same meaning as for the
hwatch command.
hwatchreadhwatchb[oth] addr | var [if (condition)] [do {commands}]
Define a hardware read watchpoint. This event is triggered by hardware when the byte at the given address or
variable is read. As with hwatch, system hardware and software support must exist for this command to be
supported. The optional if and do arguments have the same meaning as for the hwatch command.
Events
104
ignoreignore [sig:sig] [sig [, sig...]]
Without arguments, the ignore command prints the list of signals being ignored. With the sig:sig argument
this command ignores the specified range of signals. With a list of signals the command ignores signals with
the specified number.
When a particular signal number is ignored, signals with that number sent to the program are not intercepted
by PGDBG; rather, the signals are delivered to the program.
For information on intercepting signals, refer to catch.
statusstat[us]
Display all the event definitions, including an event number by which each event can be identified.
stopstop varstop at line [if (condition)][do {commands}]stop in routine [if(condition)][do {commands}]stop if (condition)
Break when the value of the indicated variable var changes. Use the at argument and a line to set a breakpoint
at a line number. Use the in argument and a routine name to set a breakpoint at the first statement of the
specified routine. When the if argument is used, the debugger stops when the condition is true.
stopistopi var stopi at address [if (condition)][do {commands}]stopi in routine [if (condition)][do {commands}]stopi if (condition)
Break when the value of the indicated variable var changes. Set a breakpoint at the indicated address or
routine. Use the at argument and an address to specify an address at which to stop. Use the in argument and
a routine name to specify the first address of the specified routine at which to stop. When the if argument is
used, the debugger stops when the condition is true.
tracetrace var [if (condition)][do {commands}]trace routine [if (condition)][do {commands}]trace at line [if (condition)][do {commands}]trace in routine [if (condition)][do {commands}]trace inclass class [if (condition)][do {commands}]
Use var to activate tracing when the value of var changes. Use routine to activate tracing when the subprogram
routine is called. Use at to display the specified line each time it is executed. Use in to display the current
line while in the specified routine. Use inclass to display the current line while in each member function of
the specified class. If a condition is specified, tracing is only enabled if the condition evaluates to true. The do
argument defines a list of commands to execute at each trace point.
Chapter 13. Command Reference
105
Use the command pgienv speed to set the time in seconds between trace points. Use the clear command to
remove tracing for a line or routine.
traceitracei var [if (condition)][do {commands}]tracei at addr [if (condition)][do {commands}]tracei in routine [if (condition)][do {commands}]tracei inclass class [if (condition)][do {commands}]
Activate tracing at the instruction level. Use var to activate tracing when the value of var changes. Use at
to display the instruction at addr each time it is executed. Use in to display memory instructions while in
the subprogram routine. Use inclass to display memory instructions while in each member function of the
specified class. If a condition is specified, tracing is only enabled if the condition evaluates to true. The do
argument defines a list of commands to execute at each trace point.
Use the command pgienv speed to set the time in seconds between trace points. Use the clear command to
remove tracing for a line or routine.
tracktrack expression [at line | in func] [if (condition)][do {commands}]
Define a track event. This command is equivalent to watch except that execution resumes after the new value
of the expression is printed.
trackitracki expression [at addr | in func] [if (condition)][do {commands}]
Define an assembly-level track event. This command is equivalent to watchi except that execution resumes
after the new value of the expression is printed.
unbreakunb[reak] line | routine| all
Remove a breakpoint from the specified line or routine, or remove all breakpoints.
unbreakiunbreaki addr | routine | all
Remove a breakpoint from the specified address addr or routine, or remove all breakpoints.
watchwa[tch] expression wa[tch] expression [if (condition)][do {commands}]wa[tch] expression at line [if (condition)][do {commands}]wa[tch] expression in routine [if (condition)][do {commands}]
Define a watch event. The given expression is evaluated, and subsequently, each time the value of the
expression changes, the program stops and the new value of the expression is printed. If a line is specified,
the expression is only evaluated at that line. If a routine is specified, the expression is evaluated at each line in
Events
106
the routine. If no location is specified, the expression is evaluated at each line in the program. If a condition
is specified, the expression is evaluated only when the condition is true. If commands are specified using do,
they are executed whenever the expression is evaluated and its value changes.
The watched expression may contain local variables, although this is not recommended unless a routine or
address is specified to ensure that the variable is only evaluated when it is in the current scope.
NOTEUsing watchpoints indiscriminately can dramatically slow program execution.
Using the at and in arguments speeds up execution by reducing the amount of single-stepping and expression
evaluation that must be performed to watch the expression. For example:
watch i at 40
may not slow program execution noticeably, while
watch i
does slow execution considerably.
watchiwatchi expression watchi expression [if (condition)][do {commands}]watchi expression at addr [if (condition)][do {commands}]watchi expression in routine [if (condition)][do {commands}]
Define an assembly-level watch event. This command functions similarly to the watch command with two
exceptions: 1) the argument interprets integers as addresses rather than line numbers and 2) the expression
is evaluated at every instruction rather than at every line.
This command is useful when line number information is limited, which may occur when debug information
is not available or assembly must be debugged. Using watchi causes programs to execute more slowly than
watch.
whenwhen do {commands} [if (condition)]when at line do {commands} [if (condition)]when in routine do {commands} [if (condition)]
Execute commands at every line in the program, at a specified line in the program, or in the specified
routine. If an optional condition is specified, commands are executed only when the condition evaluates to
true.
wheniwheni do {commands} [if (condition)]wheni at addr do {commands} [if (condition)]wheni in routine do {commands} [if (condition)]
Chapter 13. Command Reference
107
Execute commands at each address in the program. If an address addr is specified, the commands are
executed each time the address is reached. If a routine is specified, the commands are executed at each
line in the routine. If an optional condition is specified, commands are executed whenever the condition
evaluates to true.
Program LocationsThis section describes PGDBG program location commands.
arrivearri[ve]
Print location information for the current location.
cdcd [dir]
Change directories to the $HOME directory or to the specified directory dir.
disasmdis[asm] [ count | lo:hi | routine | addr, count ]
Disassemble memory.
If no argument is given, disassemble four instructions starting at the current address. If an integer count is
given, disassemble count instructions starting at the current address. If an address range (lo:hi) is given,
disassemble the memory in the range. If a routine is given, disassemble the entire routine. If the routine was
compiled for debugging and source code is available, the source code is interleaved with the disassembly. If an
address addr and a count are both given, disassemble count instructions starting at the provided address.
editedit [filename | routine]
Use the editor specified by the environment variable $EDITOR to edit a file.
If no argument is supplied, edit the current file starting at the current location. To edit a specific file, provide
the filename argument. To edit the file containing the subprogram routine, specify the routine name.
This command is only supported in the CLI.
filefile [filename]
Change the source file to the file filename and change the scope accordingly. With no argument, print the
current file.
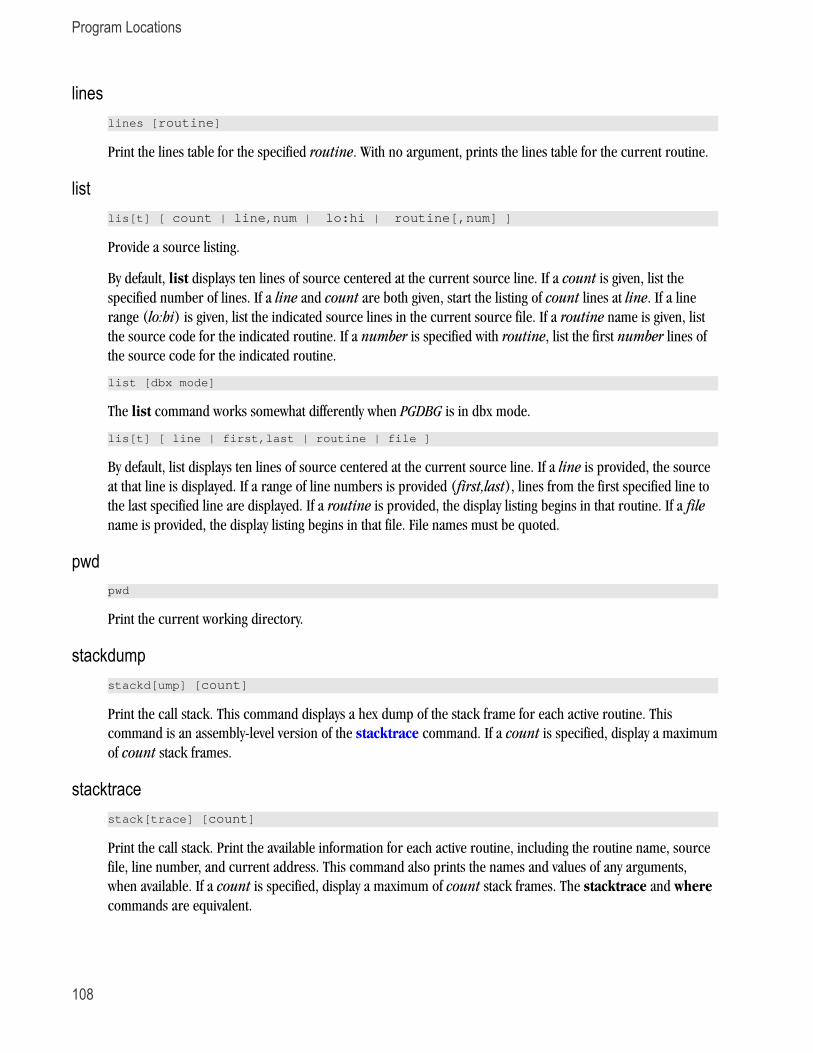
Program Locations
108
lineslines [routine]
Print the lines table for the specified routine. With no argument, prints the lines table for the current routine.
listlis[t] [ count | line,num | lo:hi | routine[,num] ]
Provide a source listing.
By default, list displays ten lines of source centered at the current source line. If a count is given, list the
specified number of lines. If a line and count are both given, start the listing of count lines at line. If a line
range (lo:hi) is given, list the indicated source lines in the current source file. If a routine name is given, list
the source code for the indicated routine. If a number is specified with routine, list the first number lines of
the source code for the indicated routine.
list [dbx mode]
The list command works somewhat differently when PGDBG is in dbx mode.
lis[t] [ line | first,last | routine | file ]
By default, list displays ten lines of source centered at the current source line. If a line is provided, the source
at that line is displayed. If a range of line numbers is provided (first,last), lines from the first specified line to
the last specified line are displayed. If a routine is provided, the display listing begins in that routine. If a file
name is provided, the display listing begins in that file. File names must be quoted.
pwdpwd
Print the current working directory.
stackdumpstackd[ump] [count]
Print the call stack. This command displays a hex dump of the stack frame for each active routine. This
command is an assembly-level version of the stacktrace command. If a count is specified, display a maximum
of count stack frames.
stacktracestack[trace] [count]
Print the call stack. Print the available information for each active routine, including the routine name, source
file, line number, and current address. This command also prints the names and values of any arguments,
when available. If a count is specified, display a maximum of count stack frames. The stacktrace and where
commands are equivalent.
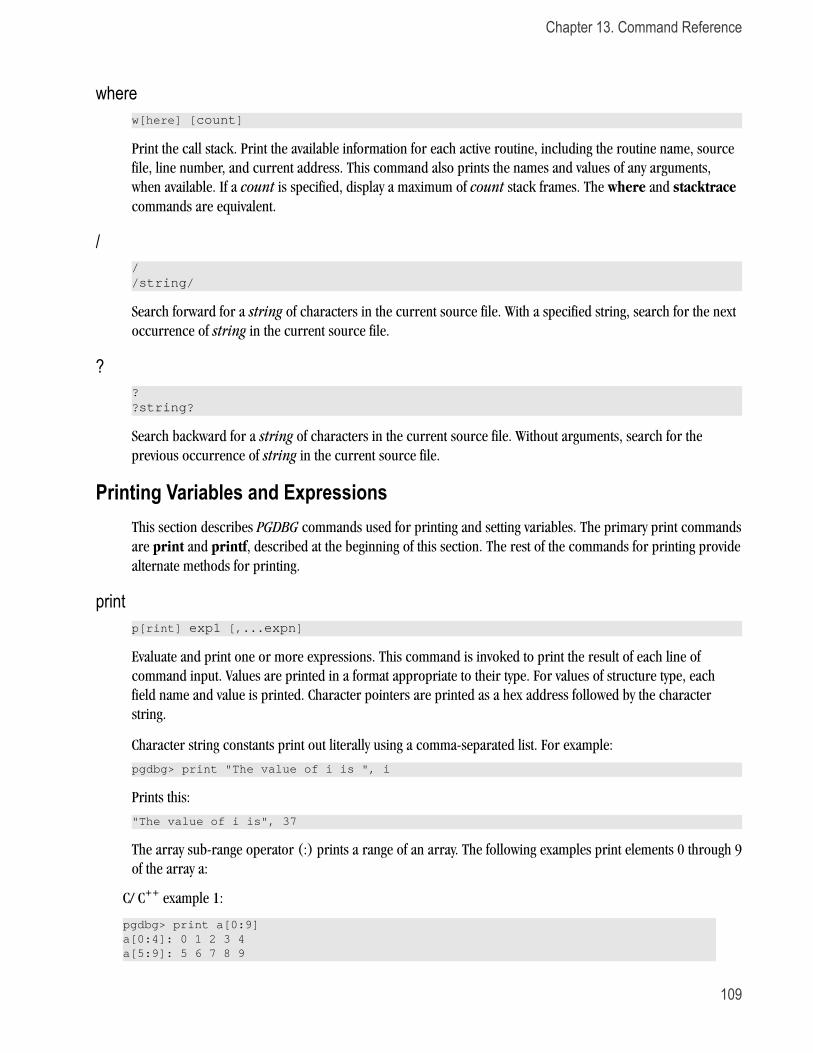
Chapter 13. Command Reference
109
wherew[here] [count]
Print the call stack. Print the available information for each active routine, including the routine name, source
file, line number, and current address. This command also prints the names and values of any arguments,
when available. If a count is specified, display a maximum of count stack frames. The where and stacktrace
commands are equivalent.
///string/
Search forward for a string of characters in the current source file. With a specified string, search for the next
occurrence of string in the current source file.
???string?
Search backward for a string of characters in the current source file. Without arguments, search for the
previous occurrence of string in the current source file.
Printing Variables and ExpressionsThis section describes PGDBG commands used for printing and setting variables. The primary print commands
are print and printf, described at the beginning of this section. The rest of the commands for printing provide
alternate methods for printing.
printp[rint] exp1 [,...expn]
Evaluate and print one or more expressions. This command is invoked to print the result of each line of
command input. Values are printed in a format appropriate to their type. For values of structure type, each
field name and value is printed. Character pointers are printed as a hex address followed by the character
string.
Character string constants print out literally using a comma-separated list. For example:
pgdbg> print "The value of i is ", i
Prints this:
"The value of i is", 37
The array sub-range operator (:) prints a range of an array. The following examples print elements 0 through 9
of the array a:
C/ C++ example 1:
pgdbg> print a[0:9]a[0:4]: 0 1 2 3 4a[5:9]: 5 6 7 8 9
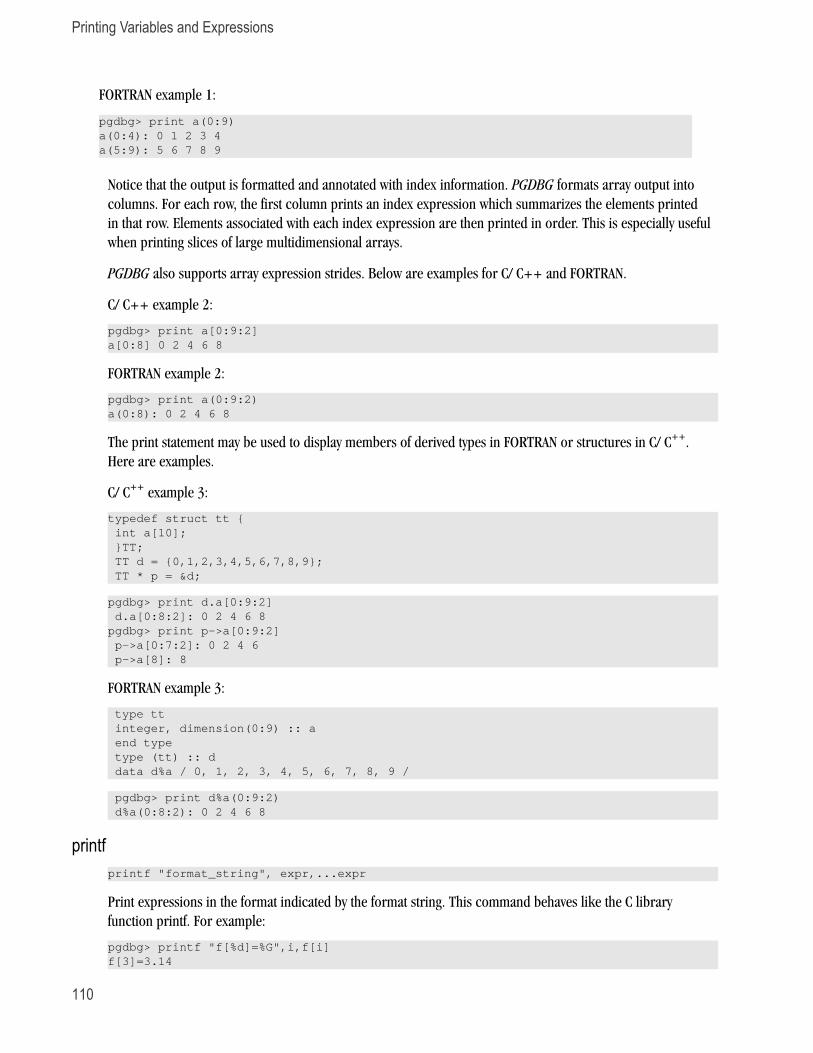
Printing Variables and Expressions
110
FORTRAN example 1:
pgdbg> print a(0:9)a(0:4): 0 1 2 3 4a(5:9): 5 6 7 8 9
Notice that the output is formatted and annotated with index information. PGDBG formats array output into
columns. For each row, the first column prints an index expression which summarizes the elements printed
in that row. Elements associated with each index expression are then printed in order. This is especially useful
when printing slices of large multidimensional arrays.
PGDBG also supports array expression strides. Below are examples for C/ C++ and FORTRAN.
C/ C++ example 2:
pgdbg> print a[0:9:2]a[0:8] 0 2 4 6 8
FORTRAN example 2:
pgdbg> print a(0:9:2)a(0:8): 0 2 4 6 8
The print statement may be used to display members of derived types in FORTRAN or structures in C/ C++.
Here are examples.
C/ C++ example 3:
typedef struct tt { int a[10]; }TT; TT d = {0,1,2,3,4,5,6,7,8,9}; TT * p = &d;
pgdbg> print d.a[0:9:2] d.a[0:8:2]: 0 2 4 6 8pgdbg> print p->a[0:9:2] p->a[0:7:2]: 0 2 4 6 p->a[8]: 8
FORTRAN example 3:
type tt integer, dimension(0:9) :: a end type type (tt) :: d data d%a / 0, 1, 2, 3, 4, 5, 6, 7, 8, 9 /
pgdbg> print d%a(0:9:2) d%a(0:8:2): 0 2 4 6 8
printfprintf "format_string", expr,...expr
Print expressions in the format indicated by the format string. This command behaves like the C library
function printf. For example:
pgdbg> printf "f[%d]=%G",i,f[i]f[3]=3.14
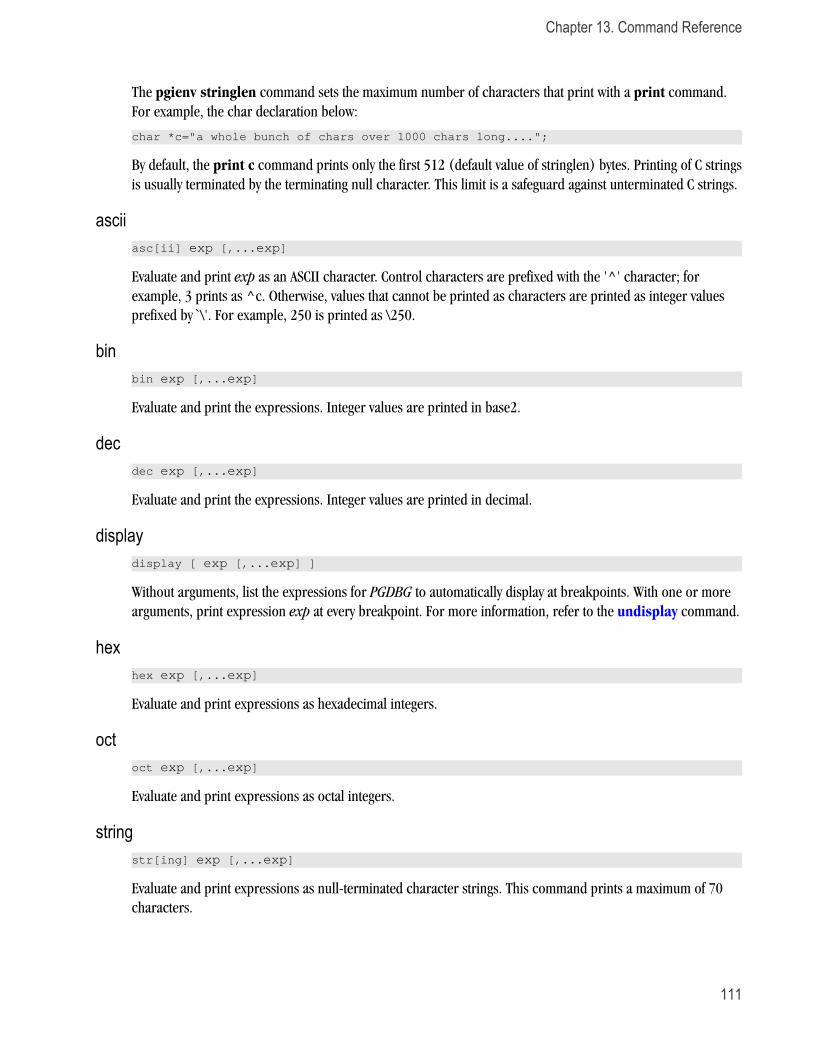
Chapter 13. Command Reference
111
The pgienv stringlen command sets the maximum number of characters that print with a print command.
For example, the char declaration below:
char *c="a whole bunch of chars over 1000 chars long....";
By default, the print c command prints only the first 512 (default value of stringlen) bytes. Printing of C strings
is usually terminated by the terminating null character. This limit is a safeguard against unterminated C strings.
asciiasc[ii] exp [,...exp]
Evaluate and print exp as an ASCII character. Control characters are prefixed with the '^' character; for
example, 3 prints as ^c. Otherwise, values that cannot be printed as characters are printed as integer values
prefixed by `\'. For example, 250 is printed as \250.
binbin exp [,...exp]
Evaluate and print the expressions. Integer values are printed in base2.
decdec exp [,...exp]
Evaluate and print the expressions. Integer values are printed in decimal.
displaydisplay [ exp [,...exp] ]
Without arguments, list the expressions for PGDBG to automatically display at breakpoints. With one or more
arguments, print expression exp at every breakpoint. For more information, refer to the undisplay command.
hexhex exp [,...exp]
Evaluate and print expressions as hexadecimal integers.
octoct exp [,...exp]
Evaluate and print expressions as octal integers.
stringstr[ing] exp [,...exp]
Evaluate and print expressions as null-terminated character strings. This command prints a maximum of 70
characters.
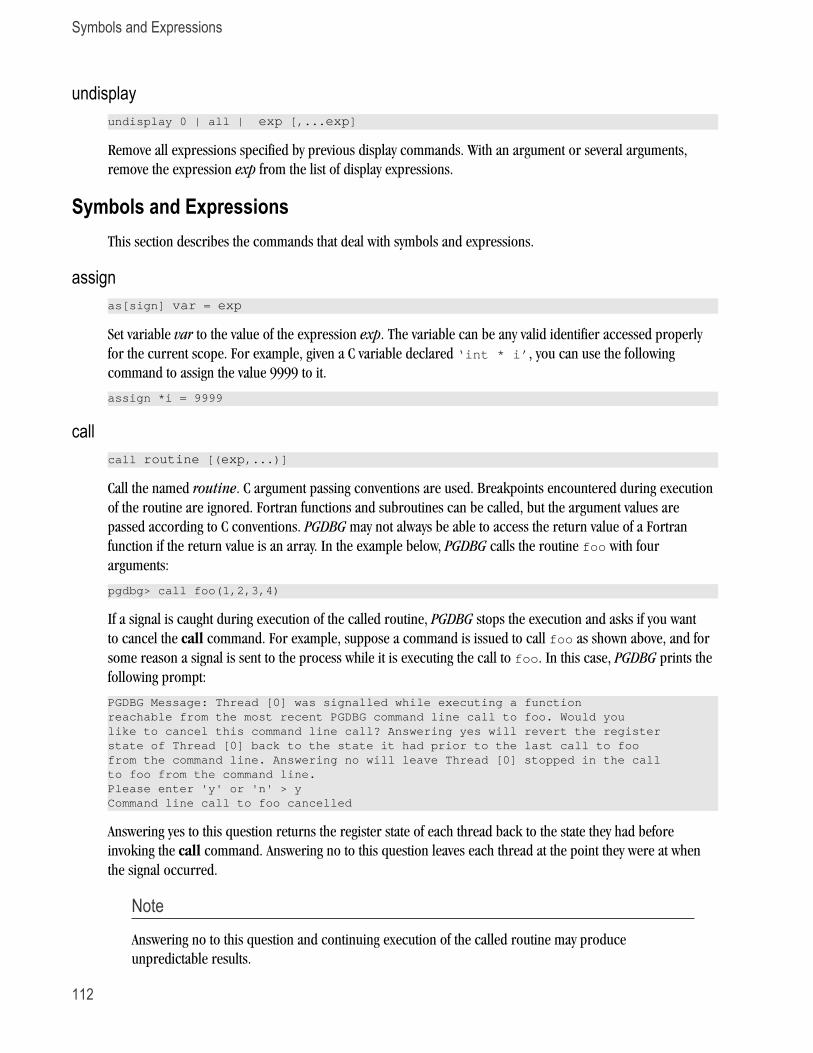
Symbols and Expressions
112
undisplayundisplay 0 | all | exp [,...exp]
Remove all expressions specified by previous display commands. With an argument or several arguments,
remove the expression exp from the list of display expressions.
Symbols and ExpressionsThis section describes the commands that deal with symbols and expressions.
assignas[sign] var = exp
Set variable var to the value of the expression exp. The variable can be any valid identifier accessed properly
for the current scope. For example, given a C variable declared ‘int * i’, you can use the following
command to assign the value 9999 to it.
assign *i = 9999
callcall routine [(exp,...)]
Call the named routine. C argument passing conventions are used. Breakpoints encountered during execution
of the routine are ignored. Fortran functions and subroutines can be called, but the argument values are
passed according to C conventions. PGDBG may not always be able to access the return value of a Fortran
function if the return value is an array. In the example below, PGDBG calls the routine foo with four
arguments:
pgdbg> call foo(1,2,3,4)
If a signal is caught during execution of the called routine, PGDBG stops the execution and asks if you want
to cancel the call command. For example, suppose a command is issued to call foo as shown above, and for
some reason a signal is sent to the process while it is executing the call to foo. In this case, PGDBG prints the
following prompt:
PGDBG Message: Thread [0] was signalled while executing a functionreachable from the most recent PGDBG command line call to foo. Would youlike to cancel this command line call? Answering yes will revert the registerstate of Thread [0] back to the state it had prior to the last call to foofrom the command line. Answering no will leave Thread [0] stopped in the call to foo from the command line.Please enter 'y' or 'n' > yCommand line call to foo cancelled
Answering yes to this question returns the register state of each thread back to the state they had before
invoking the call command. Answering no to this question leaves each thread at the point they were at when
the signal occurred.
Note
Answering no to this question and continuing execution of the called routine may produce
unpredictable results.
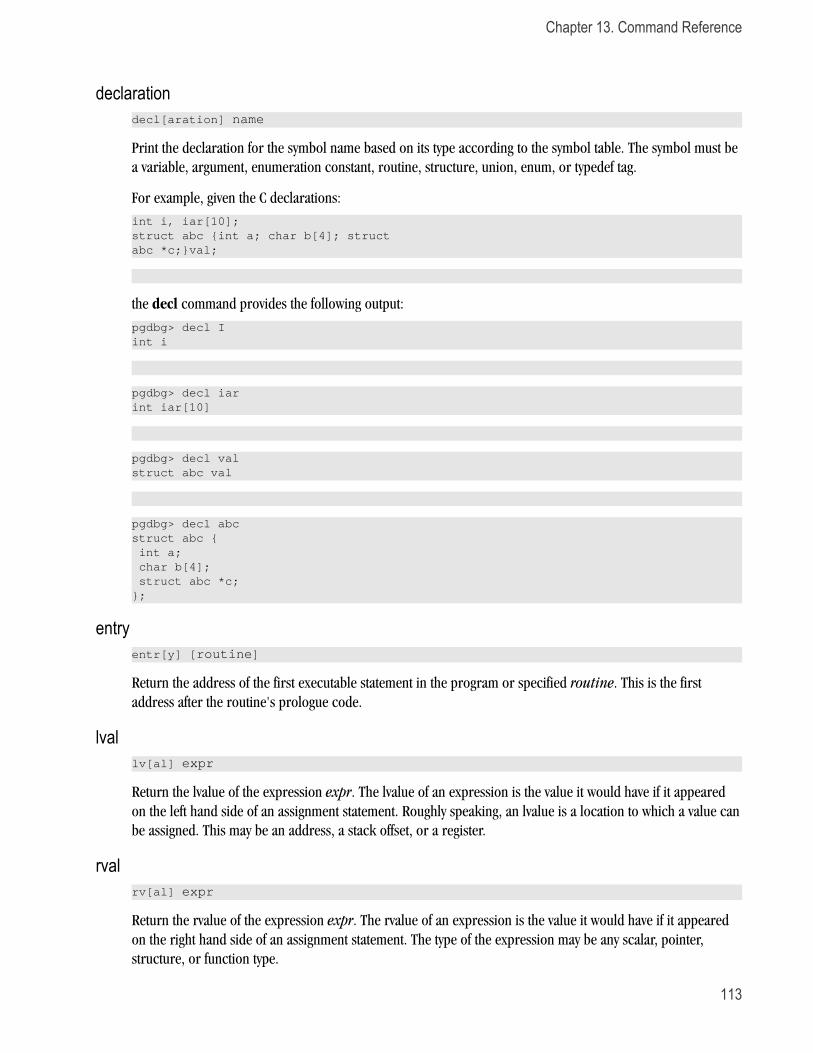
Chapter 13. Command Reference
113
declarationdecl[aration] name
Print the declaration for the symbol name based on its type according to the symbol table. The symbol must be
a variable, argument, enumeration constant, routine, structure, union, enum, or typedef tag.
For example, given the C declarations:
int i, iar[10];struct abc {int a; char b[4]; structabc *c;}val;
the decl command provides the following output:
pgdbg> decl Iint i
pgdbg> decl iarint iar[10]
pgdbg> decl valstruct abc val
pgdbg> decl abcstruct abc { int a; char b[4]; struct abc *c;};
entryentr[y] [routine]
Return the address of the first executable statement in the program or specified routine. This is the first
address after the routine's prologue code.
lvallv[al] expr
Return the lvalue of the expression expr. The lvalue of an expression is the value it would have if it appeared
on the left hand side of an assignment statement. Roughly speaking, an lvalue is a location to which a value can
be assigned. This may be an address, a stack offset, or a register.
rvalrv[al] expr
Return the rvalue of the expression expr. The rvalue of an expression is the value it would have if it appeared
on the right hand side of an assignment statement. The type of the expression may be any scalar, pointer,
structure, or function type.
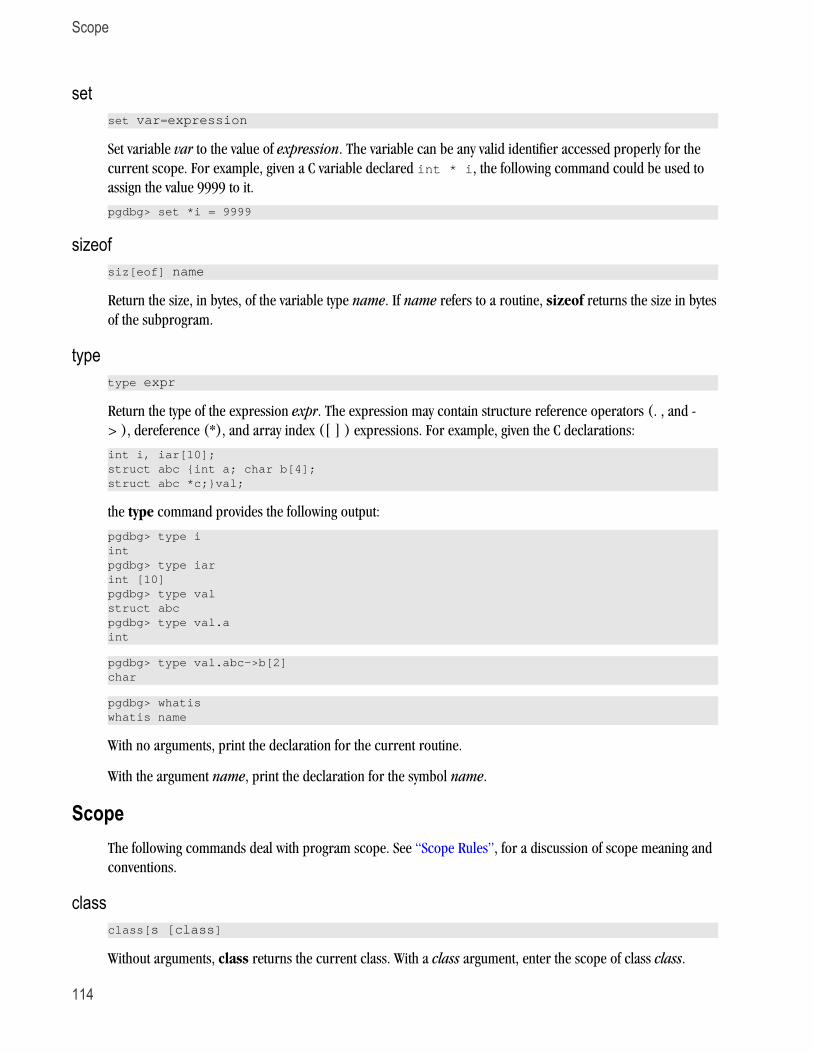
Scope
114
setset var=expression
Set variable var to the value of expression. The variable can be any valid identifier accessed properly for the
current scope. For example, given a C variable declared int * i, the following command could be used to
assign the value 9999 to it.
pgdbg> set *i = 9999
sizeofsiz[eof] name
Return the size, in bytes, of the variable type name. If name refers to a routine, sizeof returns the size in bytes
of the subprogram.
typetype expr
Return the type of the expression expr. The expression may contain structure reference operators (. , and -
> ), dereference (*), and array index ([ ] ) expressions. For example, given the C declarations:
int i, iar[10];struct abc {int a; char b[4]; struct abc *c;}val;
the type command provides the following output:
pgdbg> type iintpgdbg> type iarint [10]pgdbg> type valstruct abcpgdbg> type val.aint
pgdbg> type val.abc->b[2]char
pgdbg> whatis whatis name
With no arguments, print the declaration for the current routine.
With the argument name, print the declaration for the symbol name.
ScopeThe following commands deal with program scope. See “Scope Rules”, for a discussion of scope meaning and
conventions.
classclass[s [class]
Without arguments, class returns the current class. With a class argument, enter the scope of class class.
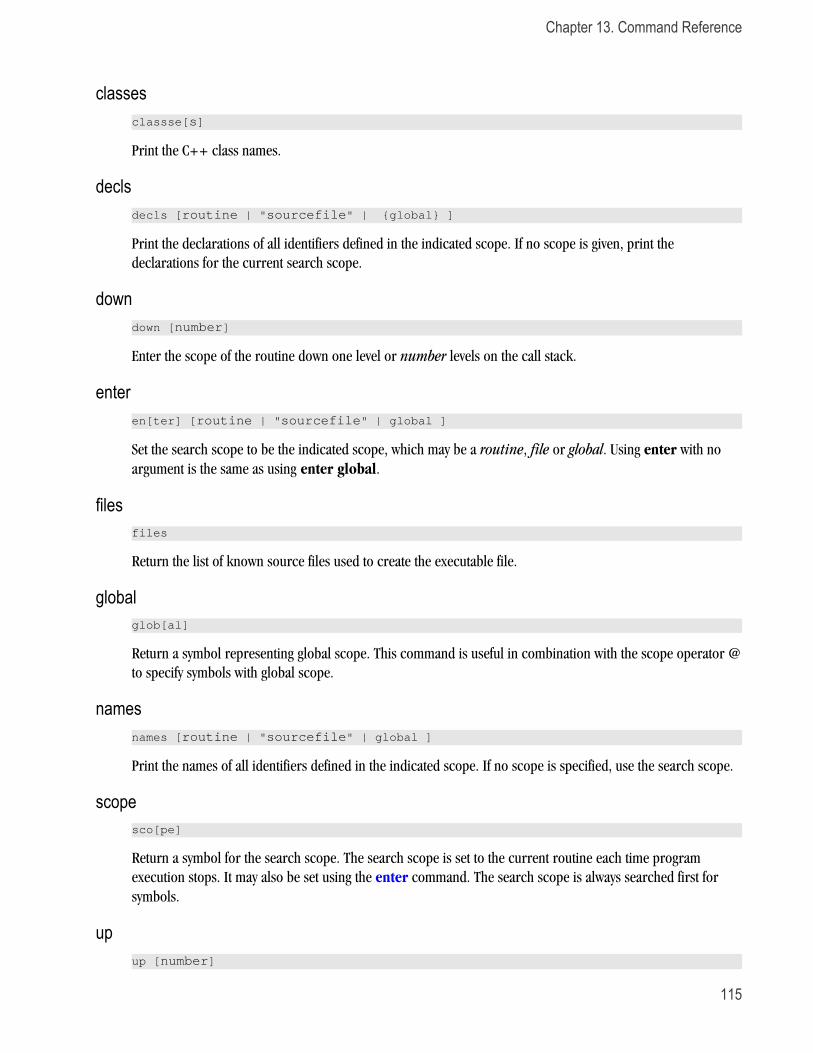
Chapter 13. Command Reference
115
classesclassse[s]
Print the C++ class names.
declsdecls [routine | "sourcefile" | {global} ]
Print the declarations of all identifiers defined in the indicated scope. If no scope is given, print the
declarations for the current search scope.
downdown [number]
Enter the scope of the routine down one level or number levels on the call stack.
enteren[ter] [routine | "sourcefile" | global ]
Set the search scope to be the indicated scope, which may be a routine, file or global. Using enter with no
argument is the same as using enter global.
filesfiles
Return the list of known source files used to create the executable file.
globalglob[al]
Return a symbol representing global scope. This command is useful in combination with the scope operator @
to specify symbols with global scope.
namesnames [routine | "sourcefile" | global ]
Print the names of all identifiers defined in the indicated scope. If no scope is specified, use the search scope.
scopesco[pe]
Return a symbol for the search scope. The search scope is set to the current routine each time program
execution stops. It may also be set using the enter command. The search scope is always searched first for
symbols.
upup [number]
Register Access
116
Enter the scope of the routine up one level or number levels from the current routine on the call stack.
whereiswhereis name
Print all declarations for name.
whichwhich name
Print the full scope qualification of symbol name.
Register AccessSystem registers can be accessed by name. For details on referring to registers in PGDBG, refer to “SSE
Register Symbols,” on page 53.
fpfp
Return the current value of the frame pointer.
pcpc
Return the current program address.
regsregsregs -info regs -grp=grp1[,grp2...]regs -fmt=fmt1[,fmt2...] regs -mode=scalar|vector
Print the names and values of registers. By default, regs prints the General Purpose registers. Use the –grp
option to specify one or more register groups, the –fmt option to specify one or more display formats, and
–mode to specify scalar or vector mode. Use the –info option to display the register groups on the current
system and the display formats available for each group. All optional arguments with the exception of –info
can be used with the others.
retaddrret[addr]
Return the current return address.
spsp
Return the current value of the stack pointer.
Chapter 13. Command Reference
117
Memory AccessThe following commands display the contents of arbitrary memory locations. For each of these commands, the
addr argument may be a variable or identifier.
creadcr[ead]addr
Fetch and return an 8-bit signed integer (character) from the specified address.
dreaddr[ead]addr
Fetch and return a 64-bit double from the specified address.
dumpdu[mp] address[, count[,format-string]]
This command dumps the contents of a region of memory. The output is formatted according to a descriptor.
Starting at the indicated address, values are fetched from memory and displayed according to the format
descriptor. This process is repeated count times.
Interpretation of the format descriptor is similar to that used by printf. Format specifiers are preceded by %.
The recognized format descriptors are for decimal, octal, hex, or unsigned:
%d, %D, %o, %O, %x, %X, %u, %U
Default size is machine dependent. The size of the item read can be modified by either inserting 'h' or 'l'
before the format character to indicate half word or long word. For example, if your machine’s default size is
32-bit, then %hd represents a 16-bit quantity. Alternatively, a 1, 2, or 4 after the format character can be used
to specify the number of bytes to read.
%c
Fetch and print a character.
%c
Fetch and print a float (lower case) or double (upper case) value using printf f, e, or g format.
%f, %F, %e, %E, %g, %G
Fetch and print a null terminated string.
%s
Interpret the next object as a pointer to an item specified by the following format characters. The pointed-to
item is fetched and displayed.
%p
Pointer to int. Prints the address of the pointer, the value of the pointer, and the contents of the pointed-to
address, which is printed using hexadecimal format.
%px
Fetch an instruction and disassemble it.
Conversions
118
%i
Display address about to be dumped.
%w, %W
Display nothing but advance or decrement current address by n bytes.
%z<n>, %Z<n>, %z<-n>, %Z<-n>
Display nothing but advance current address as needed to align modulo n.
%a<n>, %A<n>
Display nothing but advance current address as needed to align modulo n.
freadfr[ead]addr
Fetch and print a 32-bit float from the specified address.
ireadir[ead] addr
Fetch and print a signed integer from the specified address.
lreadlr[ead] addr
Fetch and print an address from the specified address.
mqdumpmq[dump]
Dump MPI message queue information for the current process. For more information on mqdump, refer to
“MPI Message Queues,” on page 89.
sreadsr[ead]addr
Fetch and print a short signed integer from the specified address.
ConversionsThe commands in this section are useful for converting between different kinds of values. These commands
accept a variety of arguments, and return a value of a particular kind.
addrad[dr] [n | line n | routine | var | arg ]
Create an address conversion under these conditions:
Chapter 13. Command Reference
119
• If an integer is given, return an address with the same value.
• If a line is given, return the address corresponding to the start of that line.
• If a routine is given, return the first address of the routine.
• If a variable or argument is given, return the address where that variable or argument is stored.
For example,
breaki {line {addr 0x22f0}}
functionfunc[tion] [[addr...] | [line...] ]
Return a routine symbol. If no argument is specified, return the current routine. If an address is given, return
the routine containing addr. An integer argument is interpreted as an address. If a line is specified, return the
routine containing that line.
linelin[e] [ n | routine | addr ]
Create a source line conversion. If no argument is given, return the current source line. If an integer n is given,
return it as a line number. If a routine is given, return the first line of the routine. If an address is given, return
the line containing that address.
For example, the following command returns the line number of the specified address:
line {addr 0x22f0}
TargetThe following commands are applicable to system architectures for which multiple debugging environment
targets are available. The commands in this section do not apply to the x86 or x86-64 environments.
connectcon[nect]con[nect] -t target [args] con[nect] -d path [args] con[nect] -f file con[nect] -f file name [args]
Without arguments, connect prints the current connection and the list of possible connection targets. Use -t
to connect to a specific target. Use -d to connect to a target specified by path. Use -f to print a list of possible
targets as contained in a file, or to connect to a target selected by name from the list defined in file. Pass
configuration arguments to the target as appropriate.
disconnectdisc[onnect]
Close connection to the current target.
nativenati[ve] [command]
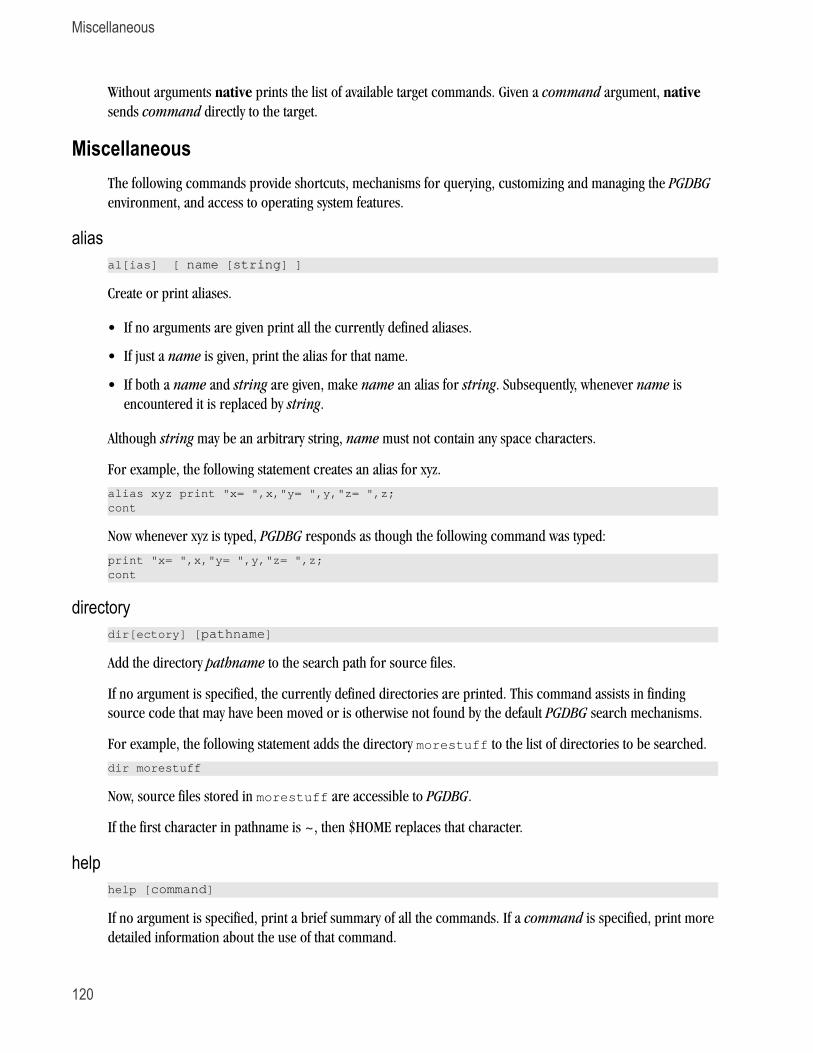
Miscellaneous
120
Without arguments native prints the list of available target commands. Given a command argument, native
sends command directly to the target.
MiscellaneousThe following commands provide shortcuts, mechanisms for querying, customizing and managing the PGDBG
environment, and access to operating system features.
aliasal[ias] [ name [string] ]
Create or print aliases.
• If no arguments are given print all the currently defined aliases.
• If just a name is given, print the alias for that name.
• If both a name and string are given, make name an alias for string. Subsequently, whenever name is
encountered it is replaced by string.
Although string may be an arbitrary string, name must not contain any space characters.
For example, the following statement creates an alias for xyz.
alias xyz print "x= ",x,"y= ",y,"z= ",z;cont
Now whenever xyz is typed, PGDBG responds as though the following command was typed:
print "x= ",x,"y= ",y,"z= ",z;cont
directorydir[ectory] [pathname]
Add the directory pathname to the search path for source files.
If no argument is specified, the currently defined directories are printed. This command assists in finding
source code that may have been moved or is otherwise not found by the default PGDBG search mechanisms.
For example, the following statement adds the directory morestuff to the list of directories to be searched.
dir morestuff
Now, source files stored in morestuff are accessible to PGDBG.
If the first character in pathname is ~, then $HOME replaces that character.
helphelp [command]
If no argument is specified, print a brief summary of all the commands. If a command is specified, print more
detailed information about the use of that command.
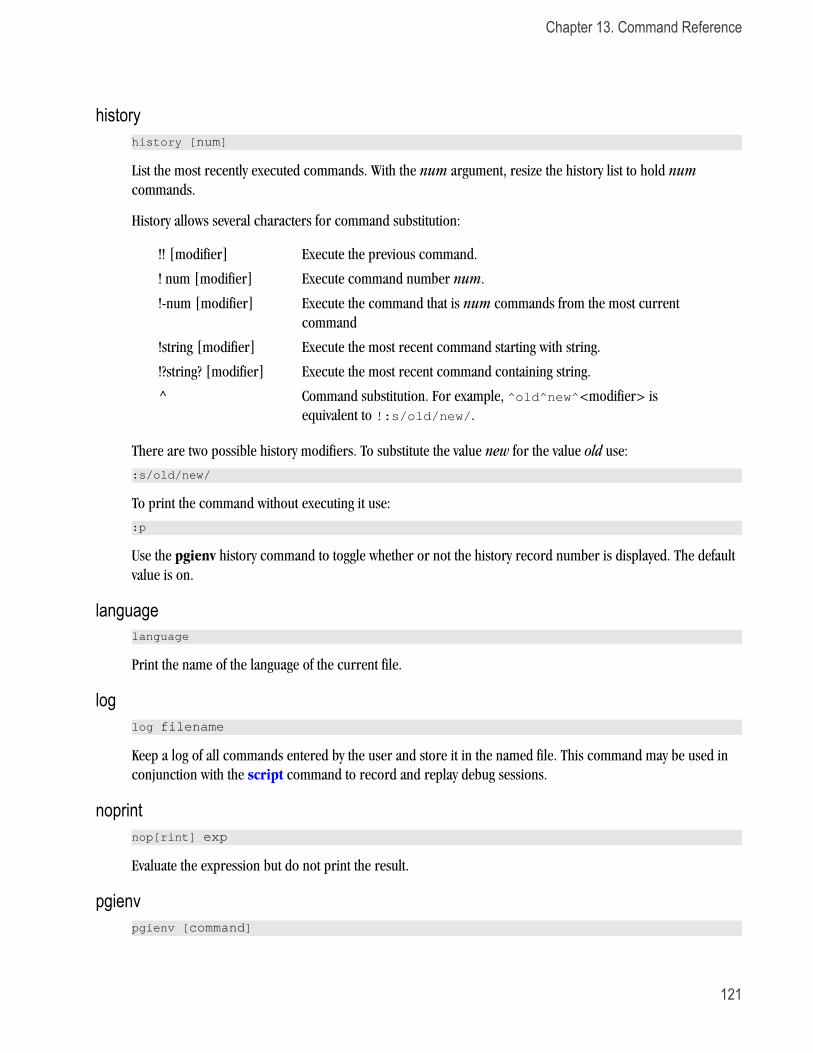
Chapter 13. Command Reference
121
historyhistory [num]
List the most recently executed commands. With the num argument, resize the history list to hold num
commands.
History allows several characters for command substitution:
!! [modifier] Execute the previous command.
! num [modifier] Execute command number num.
!-num [modifier] Execute the command that is num commands from the most current
command
!string [modifier] Execute the most recent command starting with string.
!?string? [modifier] Execute the most recent command containing string.
^ Command substitution. For example, ^old^new^<modifier> is
equivalent to !:s/old/new/.
There are two possible history modifiers. To substitute the value new for the value old use:
:s/old/new/
To print the command without executing it use:
:p
Use the pgienv history command to toggle whether or not the history record number is displayed. The default
value is on.
languagelanguage
Print the name of the language of the current file.
loglog filename
Keep a log of all commands entered by the user and store it in the named file. This command may be used in
conjunction with the script command to record and replay debug sessions.
noprintnop[rint] exp
Evaluate the expression but do not print the result.
pgienvpgienv [command]
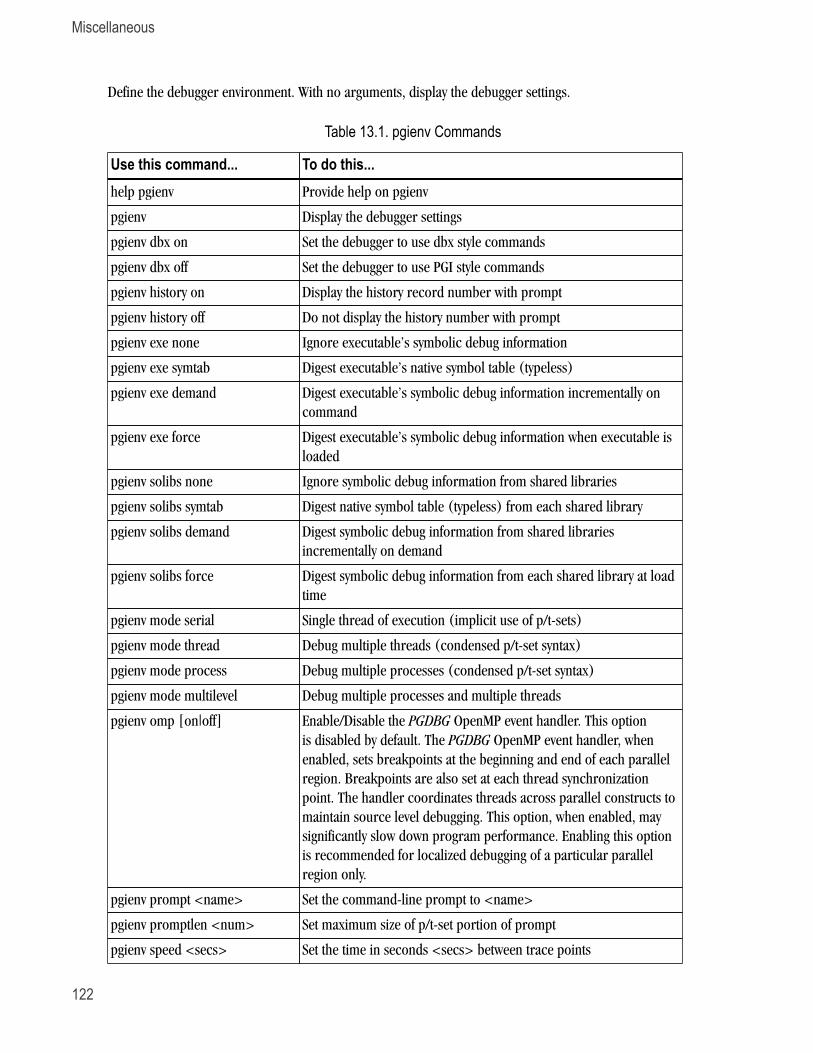
Miscellaneous
122
Define the debugger environment. With no arguments, display the debugger settings.
Table 13.1. pgienv Commands
Use this command... To do this...help pgienv Provide help on pgienv
pgienv Display the debugger settings
pgienv dbx on Set the debugger to use dbx style commands
pgienv dbx off Set the debugger to use PGI style commands
pgienv history on Display the history record number with prompt
pgienv history off Do not display the history number with prompt
pgienv exe none Ignore executable’s symbolic debug information
pgienv exe symtab Digest executable’s native symbol table (typeless)
pgienv exe demand Digest executable’s symbolic debug information incrementally on
command
pgienv exe force Digest executable’s symbolic debug information when executable is
loaded
pgienv solibs none Ignore symbolic debug information from shared libraries
pgienv solibs symtab Digest native symbol table (typeless) from each shared library
pgienv solibs demand Digest symbolic debug information from shared libraries
incrementally on demand
pgienv solibs force Digest symbolic debug information from each shared library at load
time
pgienv mode serial Single thread of execution (implicit use of p/t-sets)
pgienv mode thread Debug multiple threads (condensed p/t-set syntax)
pgienv mode process Debug multiple processes (condensed p/t-set syntax)
pgienv mode multilevel Debug multiple processes and multiple threads
pgienv omp [on|off] Enable/Disable the PGDBG OpenMP event handler. This option
is disabled by default. The PGDBG OpenMP event handler, when
enabled, sets breakpoints at the beginning and end of each parallel
region. Breakpoints are also set at each thread synchronization
point. The handler coordinates threads across parallel constructs to
maintain source level debugging. This option, when enabled, may
significantly slow down program performance. Enabling this option
is recommended for localized debugging of a particular parallel
region only.
pgienv prompt <name> Set the command-line prompt to <name>
pgienv promptlen <num> Set maximum size of p/t-set portion of prompt
pgienv speed <secs> Set the time in seconds <secs> between trace points
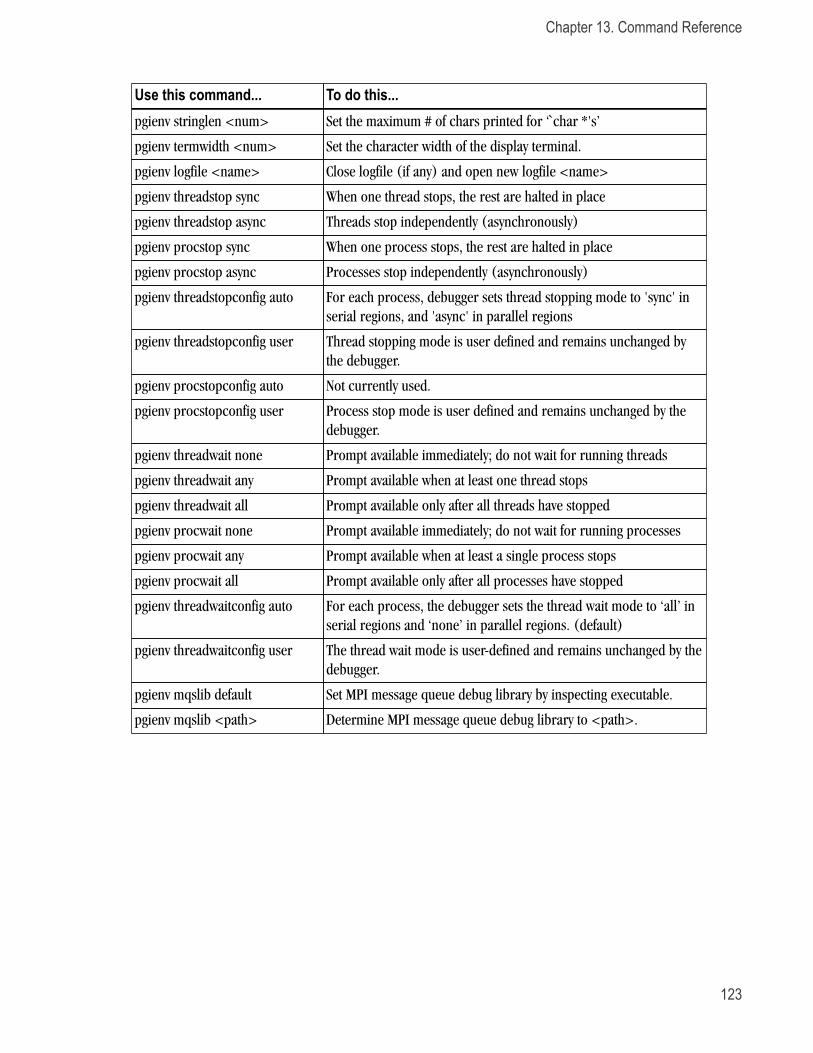
Chapter 13. Command Reference
123
Use this command... To do this...pgienv stringlen <num> Set the maximum # of chars printed for ‘`char *'s’
pgienv termwidth <num> Set the character width of the display terminal.
pgienv logfile <name> Close logfile (if any) and open new logfile <name>
pgienv threadstop sync When one thread stops, the rest are halted in place
pgienv threadstop async Threads stop independently (asynchronously)
pgienv procstop sync When one process stops, the rest are halted in place
pgienv procstop async Processes stop independently (asynchronously)
pgienv threadstopconfig auto For each process, debugger sets thread stopping mode to 'sync' in
serial regions, and 'async' in parallel regions
pgienv threadstopconfig user Thread stopping mode is user defined and remains unchanged by
the debugger.
pgienv procstopconfig auto Not currently used.
pgienv procstopconfig user Process stop mode is user defined and remains unchanged by the
debugger.
pgienv threadwait none Prompt available immediately; do not wait for running threads
pgienv threadwait any Prompt available when at least one thread stops
pgienv threadwait all Prompt available only after all threads have stopped
pgienv procwait none Prompt available immediately; do not wait for running processes
pgienv procwait any Prompt available when at least a single process stops
pgienv procwait all Prompt available only after all processes have stopped
pgienv threadwaitconfig auto For each process, the debugger sets the thread wait mode to ‘all’ in
serial regions and ‘none’ in parallel regions. (default)
pgienv threadwaitconfig user The thread wait mode is user-defined and remains unchanged by the
debugger.
pgienv mqslib default Set MPI message queue debug library by inspecting executable.
pgienv mqslib <path> Determine MPI message queue debug library to <path>.
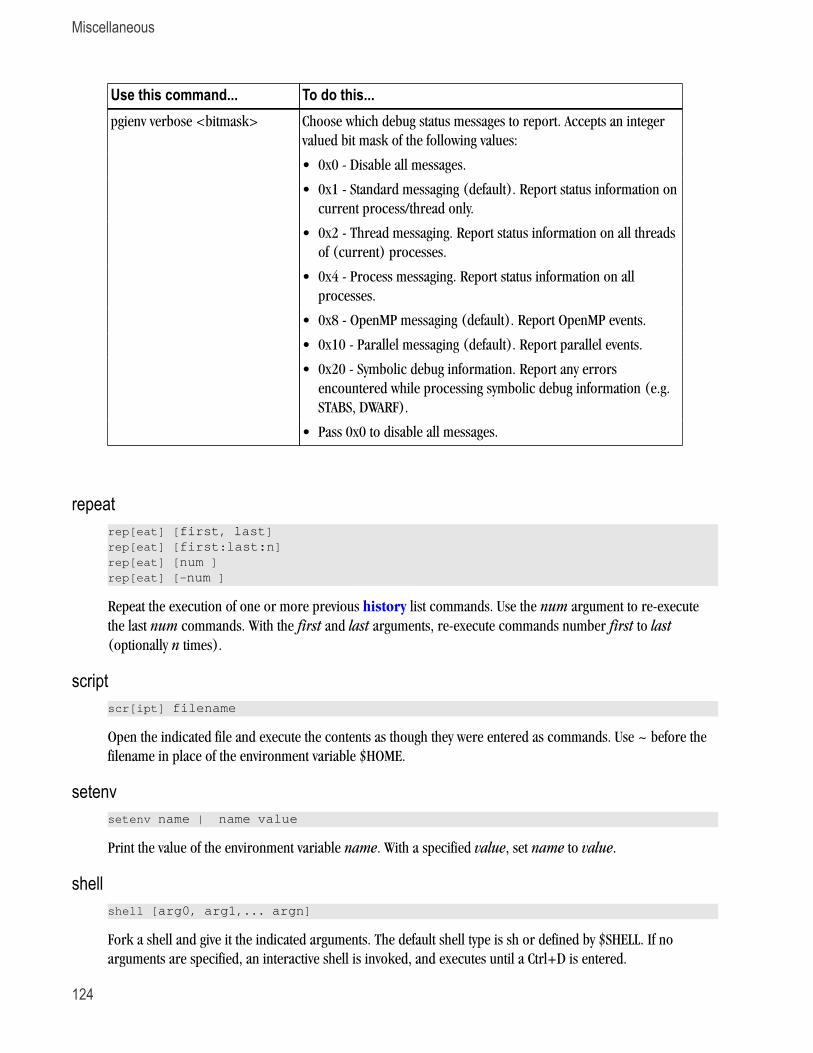
Miscellaneous
124
Use this command... To do this...Choose which debug status messages to report. Accepts an integer
valued bit mask of the following values:
• 0x0 - Disable all messages.
• 0x1 - Standard messaging (default). Report status information on
current process/thread only.
• 0x2 - Thread messaging. Report status information on all threads
of (current) processes.
• 0x4 - Process messaging. Report status information on all
processes.
• 0x8 - OpenMP messaging (default). Report OpenMP events.
• 0x10 - Parallel messaging (default). Report parallel events.
• 0x20 - Symbolic debug information. Report any errors
encountered while processing symbolic debug information (e.g.
STABS, DWARF).
pgienv verbose <bitmask>
• Pass 0x0 to disable all messages.
repeatrep[eat] [first, last]rep[eat] [first:last:n]rep[eat] [num ]rep[eat] [-num ]
Repeat the execution of one or more previous history list commands. Use the num argument to re-execute
the last num commands. With the first and last arguments, re-execute commands number first to last
(optionally n times).
scriptscr[ipt] filename
Open the indicated file and execute the contents as though they were entered as commands. Use ~ before the
filename in place of the environment variable $HOME.
setenvsetenv name | name value
Print the value of the environment variable name. With a specified value, set name to value.
shellshell [arg0, arg1,... argn]
Fork a shell and give it the indicated arguments. The default shell type is sh or defined by $SHELL. If no
arguments are specified, an interactive shell is invoked, and executes until a Ctrl+D is entered.
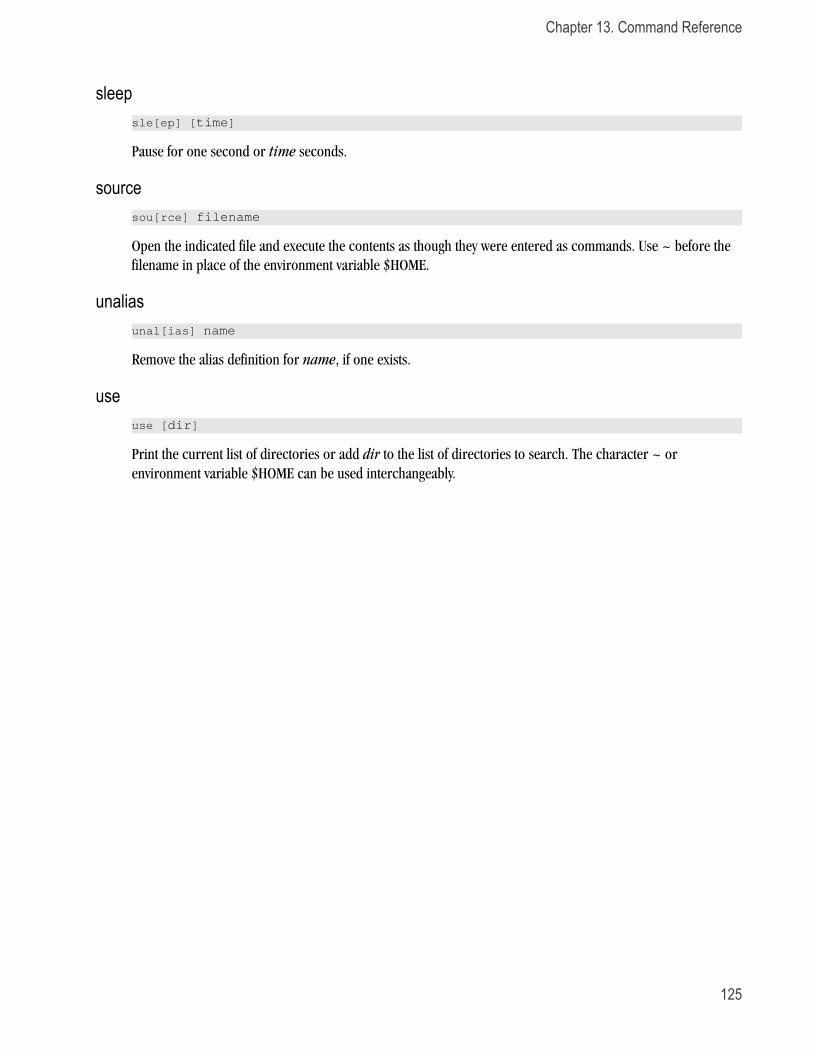
Chapter 13. Command Reference
125
sleepsle[ep] [time]
Pause for one second or time seconds.
sourcesou[rce] filename
Open the indicated file and execute the contents as though they were entered as commands. Use ~ before the
filename in place of the environment variable $HOME.
unaliasunal[ias] name
Remove the alias definition for name, if one exists.
useuse [dir]
Print the current list of directories or add dir to the list of directories to search. The character ~ or
environment variable $HOME can be used interchangeably.

126
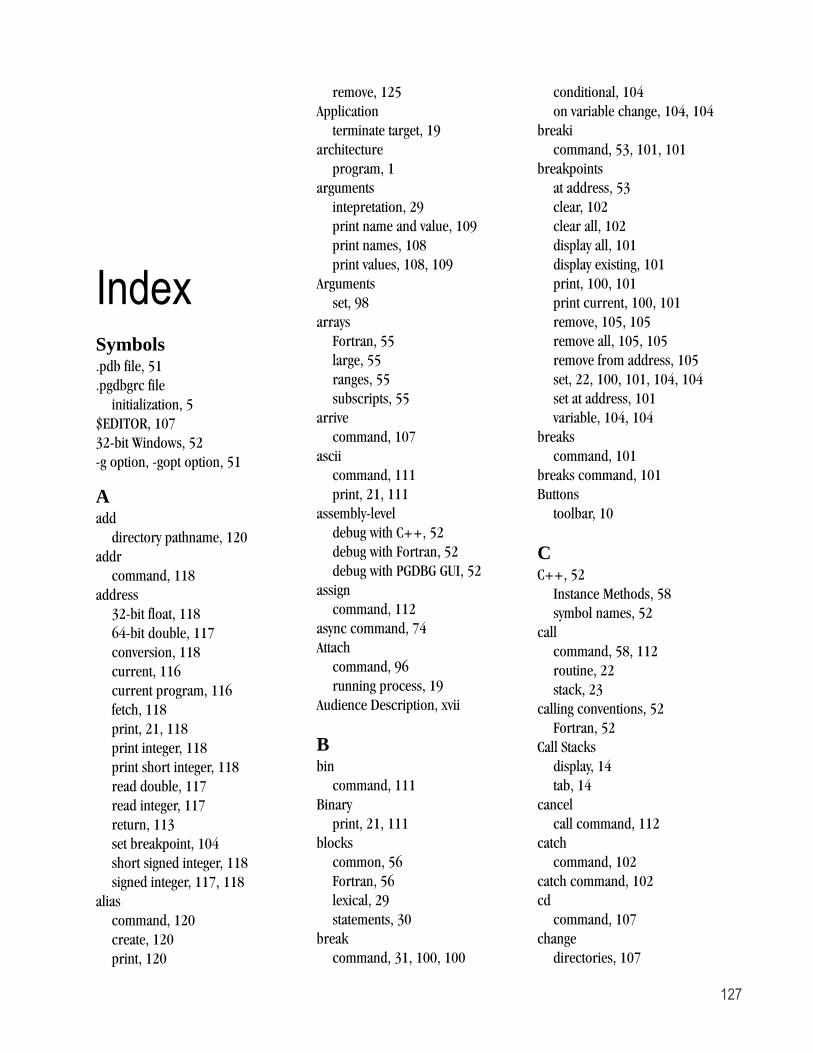
127
IndexSymbols.pdb file, 51
.pgdbgrc file
initialization, 5
$EDITOR, 107
32-bit Windows, 52
-g option, -gopt option, 51
Aadd
directory pathname, 120
addr
command, 118
address
32-bit float, 118
64-bit double, 117
conversion, 118
current, 116
current program, 116
fetch, 118
print, 21, 118
print integer, 118
print short integer, 118
read double, 117
read integer, 117
return, 113
set breakpoint, 104
short signed integer, 118
signed integer, 117, 118
alias
command, 120
create, 120
print, 120
remove, 125
Application
terminate target, 19
architecture
program, 1
arguments
intepretation, 29
print name and value, 109
print names, 108
print values, 108, 109
Arguments
set, 98
arrays
Fortran, 55
large, 55
ranges, 55
subscripts, 55
arrive
command, 107
ascii
command, 111
print, 21, 111
assembly-level
debug with C++, 52
debug with Fortran, 52
debug with PGDBG GUI, 52
assign
command, 112
async command, 74
Attach
command, 96
running process, 19
Audience Description, xvii
Bbin
command, 111
Binary
print, 21, 111
blocks
common, 56
Fortran, 56
lexical, 29
statements, 30
break
command, 31, 100, 100
conditional, 104
on variable change, 104, 104
breaki
command, 53, 101, 101
breakpoints
at address, 53
clear, 102
clear all, 102
display all, 101
display existing, 101
print, 100, 101
print current, 100, 101
remove, 105, 105
remove all, 105, 105
remove from address, 105
set, 22, 100, 101, 104, 104
set at address, 101
variable, 104, 104
breaks
command, 101
breaks command, 101
Buttons
toolbar, 10
CC++, 52
Instance Methods, 58
symbol names, 52
call
command, 58, 112
routine, 22
stack, 23
calling conventions, 52
Fortran, 52
Call Stacks
display, 14
tab, 14
cancel
call command, 112
catch
command, 102
catch command, 102
cd
command, 107
change
directories, 107
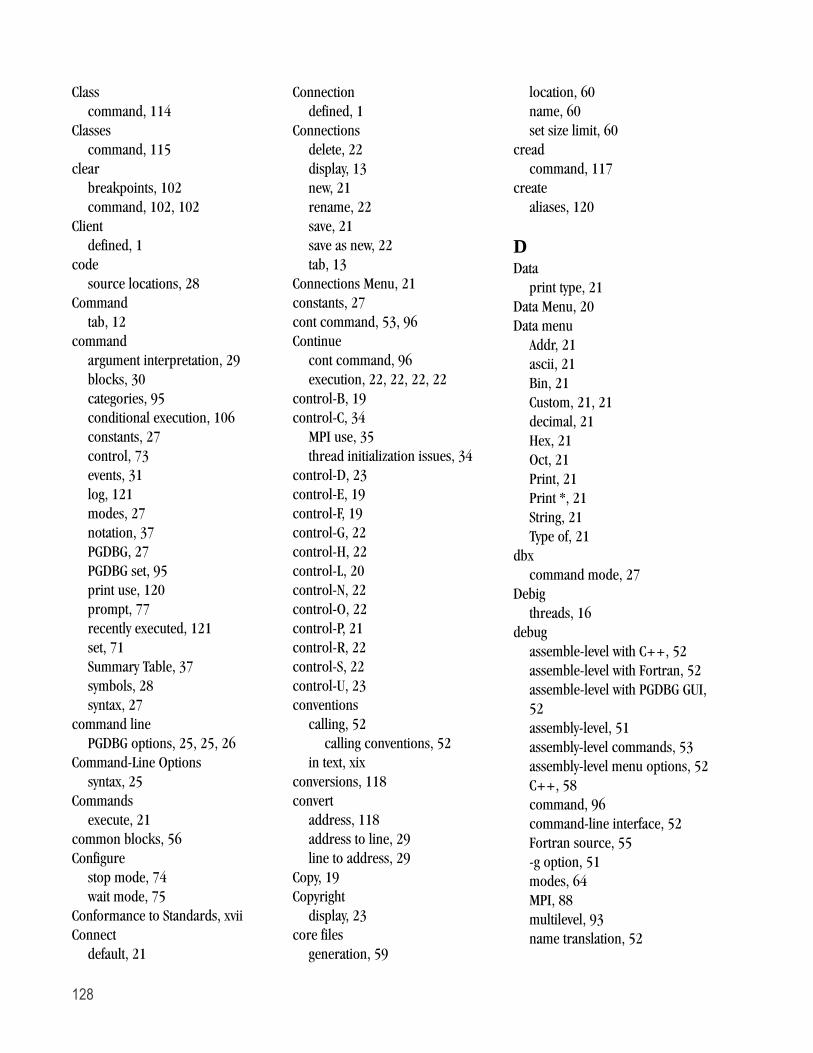
128
Class
command, 114
Classes
command, 115
clear
breakpoints, 102
command, 102, 102
Client
defined, 1
code
source locations, 28
Command
tab, 12
command
argument interpretation, 29
blocks, 30
categories, 95
conditional execution, 106
constants, 27
control, 73
events, 31
log, 121
modes, 27
notation, 37
PGDBG, 27
PGDBG set, 95
print use, 120
prompt, 77
recently executed, 121
set, 71
Summary Table, 37
symbols, 28
syntax, 27
command line
PGDBG options, 25, 25, 26
Command-Line Options
syntax, 25
Commands
execute, 21
common blocks, 56
Configure
stop mode, 74
wait mode, 75
Conformance to Standards, xvii
Connect
default, 21
Connection
defined, 1
Connections
delete, 22
display, 13
new, 21
rename, 22
save, 21
save as new, 22
tab, 13
Connections Menu, 21
constants, 27
cont command, 53, 96
Continue
cont command, 96
execution, 22, 22, 22, 22
control-B, 19
control-C, 34
MPI use, 35
thread initialization issues, 34
control-D, 23
control-E, 19
control-F, 19
control-G, 22
control-H, 22
control-L, 20
control-N, 22
control-O, 22
control-P, 21
control-R, 22
control-S, 22
control-U, 23
conventions
calling, 52
calling conventions, 52
in text, xix
conversions, 118
convert
address, 118
address to line, 29
line to address, 29
Copy, 19
Copyright
display, 23
core files
generation, 59
location, 60
name, 60
set size limit, 60
cread
command, 117
create
aliases, 120
DData
print type, 21
Data Menu, 20
Data menu
Addr, 21
ascii, 21
Bin, 21
Custom, 21, 21
decimal, 21
Hex, 21
Oct, 21
Print, 21
Print *, 21
String, 21
Type of, 21
dbx
command mode, 27
Debig
threads, 16
debug
assemble-level with C++, 52
assemble-level with Fortran, 52
assemble-level with PGDBG GUI,
52
assembly-level, 51
assembly-level commands, 53
assembly-level menu options, 52
C++, 58
command, 96
command-line interface, 52
Fortran source, 55
-g option, 51
modes, 64
MPI, 88
multilevel, 93
name translation, 52
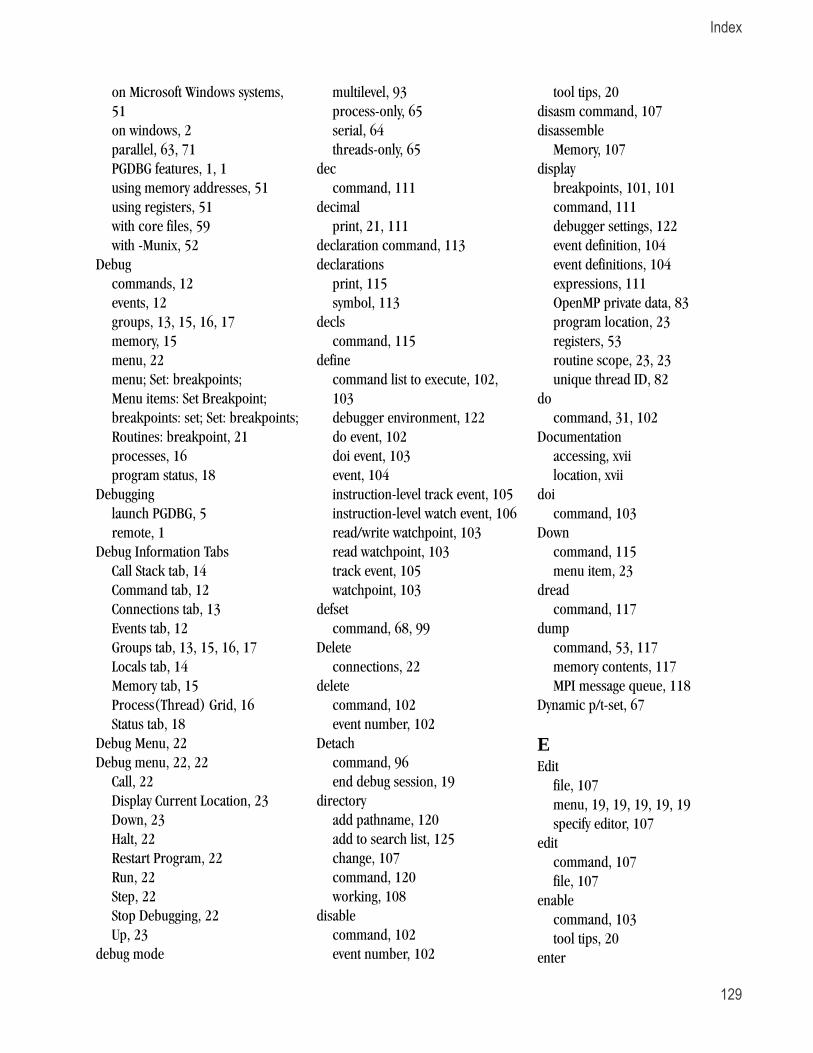
Index
129
on Microsoft Windows systems,
51
on windows, 2
parallel, 63, 71
PGDBG features, 1, 1
using memory addresses, 51
using registers, 51
with core files, 59
with -Munix, 52
Debug
commands, 12
events, 12
groups, 13, 15, 16, 17
memory, 15
menu, 22
menu; Set: breakpoints;
Menu items: Set Breakpoint;
breakpoints: set; Set: breakpoints;
Routines: breakpoint, 21
processes, 16
program status, 18
Debugging
launch PGDBG, 5
remote, 1
Debug Information Tabs
Call Stack tab, 14
Command tab, 12
Connections tab, 13
Events tab, 12
Groups tab, 13, 15, 16, 17
Locals tab, 14
Memory tab, 15
Process(Thread) Grid, 16
Status tab, 18
Debug Menu, 22
Debug menu, 22, 22
Call, 22
Display Current Location, 23
Down, 23
Halt, 22
Restart Program, 22
Run, 22
Step, 22
Stop Debugging, 22
Up, 23
debug mode
multilevel, 93
process-only, 65
serial, 64
threads-only, 65
dec
command, 111
decimal
print, 21, 111
declaration command, 113
declarations
print, 115
symbol, 113
decls
command, 115
define
command list to execute, 102,
103
debugger environment, 122
do event, 102
doi event, 103
event, 104
instruction-level track event, 105
instruction-level watch event, 106
read/write watchpoint, 103
read watchpoint, 103
track event, 105
watchpoint, 103
defset
command, 68, 99
Delete
connections, 22
delete
command, 102
event number, 102
Detach
command, 96
end debug session, 19
directory
add pathname, 120
add to search list, 125
change, 107
command, 120
working, 108
disable
command, 102
event number, 102
tool tips, 20
disasm command, 107
disassemble
Memory, 107
display
breakpoints, 101, 101
command, 111
debugger settings, 122
event definition, 104
event definitions, 104
expressions, 111
OpenMP private data, 83
program location, 23
registers, 53
routine scope, 23, 23
unique thread ID, 82
do
command, 31, 102
Documentation
accessing, xvii
location, xvii
doi
command, 103
Down
command, 115
menu item, 23
dread
command, 117
dump
command, 53, 117
memory contents, 117
MPI message queue, 118
Dynamic p/t-set, 67
EEdit
file, 107
menu, 19, 19, 19, 19, 19
specify editor, 107
edit
command, 107
file, 107
enable
command, 103
tool tips, 20
enter
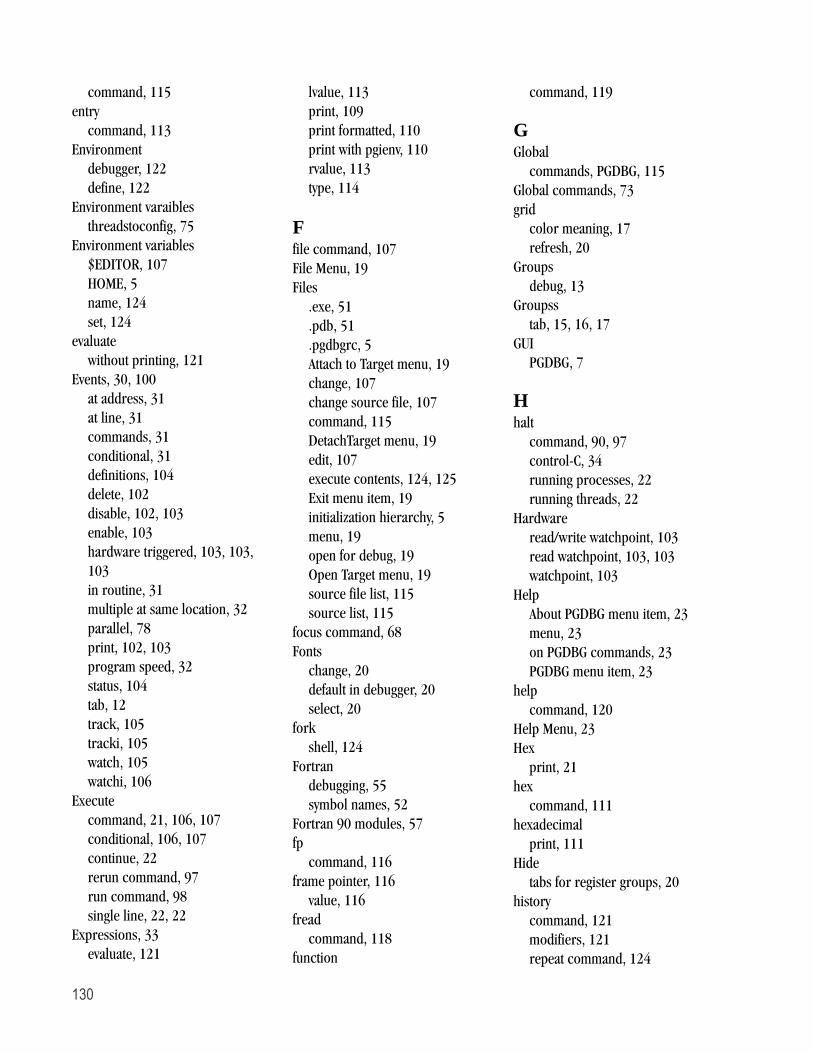
130
command, 115
entry
command, 113
Environment
debugger, 122
define, 122
Environment varaibles
threadstoconfig, 75
Environment variables
$EDITOR, 107
HOME, 5
name, 124
set, 124
evaluate
without printing, 121
Events, 30, 100
at address, 31
at line, 31
commands, 31
conditional, 31
definitions, 104
delete, 102
disable, 102, 103
enable, 103
hardware triggered, 103, 103,
103
in routine, 31
multiple at same location, 32
parallel, 78
print, 102, 103
program speed, 32
status, 104
tab, 12
track, 105
tracki, 105
watch, 105
watchi, 106
Execute
command, 21, 106, 107
conditional, 106, 107
continue, 22
rerun command, 97
run command, 98
single line, 22, 22
Expressions, 33
evaluate, 121
lvalue, 113
print, 109
print formatted, 110
print with pgienv, 110
rvalue, 113
type, 114
Ffile command, 107
File Menu, 19
Files
.exe, 51
.pdb, 51
.pgdbgrc, 5
Attach to Target menu, 19
change, 107
change source file, 107
command, 115
DetachTarget menu, 19
edit, 107
execute contents, 124, 125
Exit menu item, 19
initialization hierarchy, 5
menu, 19
open for debug, 19
Open Target menu, 19
source file list, 115
source list, 115
focus command, 68
Fonts
change, 20
default in debugger, 20
select, 20
fork
shell, 124
Fortran
debugging, 55
symbol names, 52
Fortran 90 modules, 57
fp
command, 116
frame pointer, 116
value, 116
fread
command, 118
function
command, 119
GGlobal
commands, PGDBG, 115
Global commands, 73
grid
color meaning, 17
refresh, 20
Groups
debug, 13
Groupss
tab, 15, 16, 17
GUI
PGDBG, 7
Hhalt
command, 90, 97
control-C, 34
running processes, 22
running threads, 22
Hardware
read/write watchpoint, 103
read watchpoint, 103, 103
watchpoint, 103
Help
About PGDBG menu item, 23
menu, 23
on PGDBG commands, 23
PGDBG menu item, 23
help
command, 120
Help Menu, 23
Hex
print, 21
hex
command, 111
hexadecimal
print, 111
Hide
tabs for register groups, 20
history
command, 121
modifiers, 121
repeat command, 124
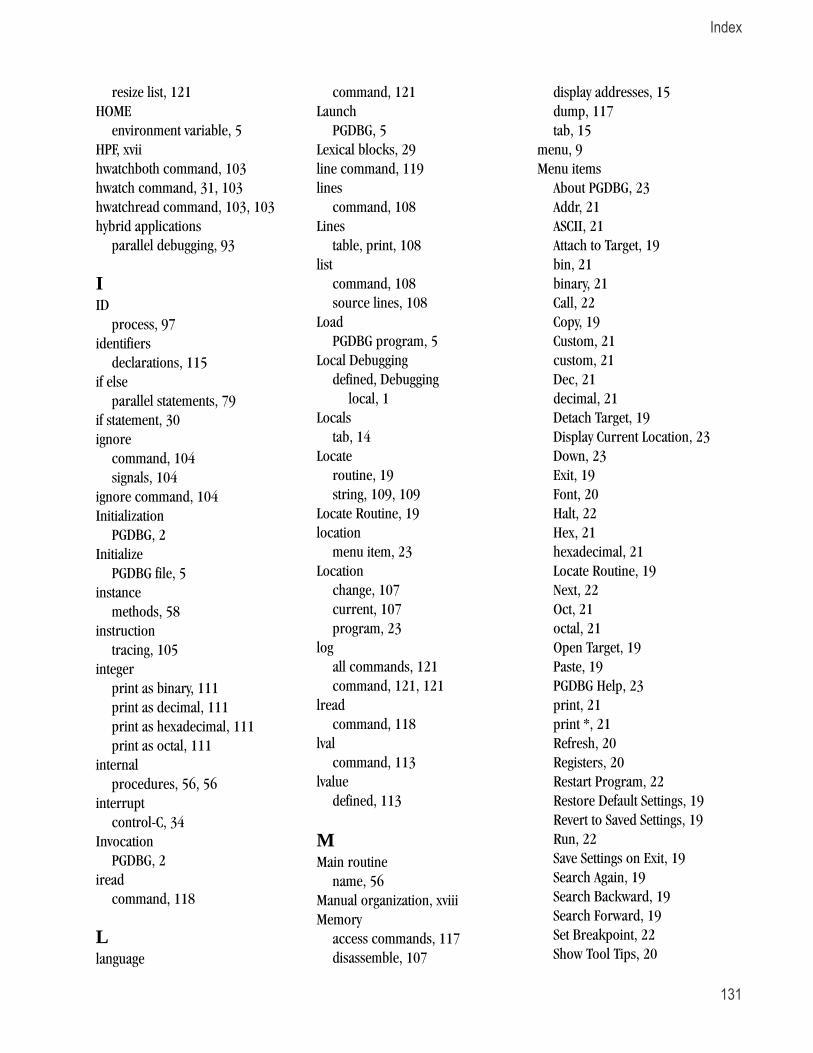
Index
131
resize list, 121
HOME
environment variable, 5
HPF, xvii
hwatchboth command, 103
hwatch command, 31, 103
hwatchread command, 103, 103
hybrid applications
parallel debugging, 93
IID
process, 97
identifiers
declarations, 115
if else
parallel statements, 79
if statement, 30
ignore
command, 104
signals, 104
ignore command, 104
Initialization
PGDBG, 2
Initialize
PGDBG file, 5
instance
methods, 58
instruction
tracing, 105
integer
print as binary, 111
print as decimal, 111
print as hexadecimal, 111
print as octal, 111
internal
procedures, 56, 56
interrupt
control-C, 34
Invocation
PGDBG, 2
iread
command, 118
Llanguage
command, 121
Launch
PGDBG, 5
Lexical blocks, 29
line command, 119
lines
command, 108
Lines
table, print, 108
list
command, 108
source lines, 108
Load
PGDBG program, 5
Local Debugging
defined, Debugging
local, 1
Locals
tab, 14
Locate
routine, 19
string, 109, 109
Locate Routine, 19
location
menu item, 23
Location
change, 107
current, 107
program, 23
log
all commands, 121
command, 121, 121
lread
command, 118
lval
command, 113
lvalue
defined, 113
MMain routine
name, 56
Manual organization, xviii
Memory
access commands, 117
disassemble, 107
display addresses, 15
dump, 117
tab, 15
menu, 9
Menu items
About PGDBG, 23
Addr, 21
ASCII, 21
Attach to Target, 19
bin, 21
binary, 21
Call, 22
Copy, 19
Custom, 21
custom, 21
Dec, 21
decimal, 21
Detach Target, 19
Display Current Location, 23
Down, 23
Exit, 19
Font, 20
Halt, 22
Hex, 21
hexadecimal, 21
Locate Routine, 19
Next, 22
Oct, 21
octal, 21
Open Target, 19
Paste, 19
PGDBG Help, 23
print, 21
print *, 21
Refresh, 20
Registers, 20
Restart Program, 22
Restore Default Settings, 19
Revert to Saved Settings, 19
Run, 22
Save Settings on Exit, 19
Search Again, 19
Search Backward, 19
Search Forward, 19
Set Breakpoint, 22
Show Tool Tips, 20
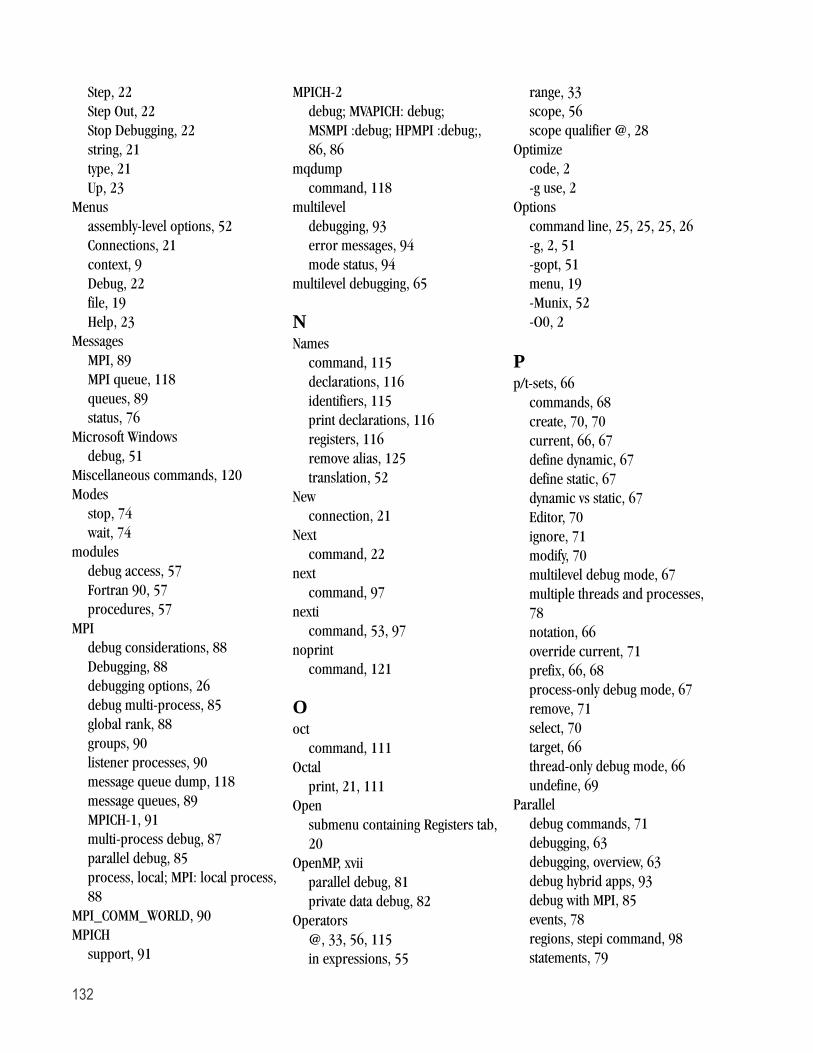
132
Step, 22
Step Out, 22
Stop Debugging, 22
string, 21
type, 21
Up, 23
Menus
assembly-level options, 52
Connections, 21
context, 9
Debug, 22
file, 19
Help, 23
Messages
MPI, 89
MPI queue, 118
queues, 89
status, 76
Microsoft Windows
debug, 51
Miscellaneous commands, 120
Modes
stop, 74
wait, 74
modules
debug access, 57
Fortran 90, 57
procedures, 57
MPI
debug considerations, 88
Debugging, 88
debugging options, 26
debug multi-process, 85
global rank, 88
groups, 90
listener processes, 90
message queue dump, 118
message queues, 89
MPICH-1, 91
multi-process debug, 87
parallel debug, 85
process, local; MPI: local process,
88
MPI_COMM_WORLD, 90
MPICH
support, 91
MPICH-2
debug; MVAPICH: debug;
MSMPI :debug; HPMPI :debug;,
86, 86
mqdump
command, 118
multilevel
debugging, 93
error messages, 94
mode status, 94
multilevel debugging, 65
NNames
command, 115
declarations, 116
identifiers, 115
print declarations, 116
registers, 116
remove alias, 125
translation, 52
New
connection, 21
Next
command, 22
next
command, 97
nexti
command, 53, 97
noprint
command, 121
Ooct
command, 111
Octal
print, 21, 111
Open
submenu containing Registers tab,
20
OpenMP, xvii
parallel debug, 81
private data debug, 82
Operators
@, 33, 56, 115
in expressions, 55
range, 33
scope, 56
scope qualifier @, 28
Optimize
code, 2
-g use, 2
Options
command line, 25, 25, 25, 26
-g, 2, 51
-gopt, 51
menu, 19
-Munix, 52
-O0, 2
Pp/t-sets, 66
commands, 68
create, 70, 70
current, 66, 67
define dynamic, 67
define static, 67
dynamic vs static, 67
Editor, 70
ignore, 71
modify, 70
multilevel debug mode, 67
multiple threads and processes,
78
notation, 66
override current, 71
prefix, 66, 68
process-only debug mode, 67
remove, 71
select, 70
target, 66
thread-only debug mode, 66
undefine, 69
Parallel
debug commands, 71
debugging, 63
debugging, overview, 63
debug hybrid apps, 93
debug with MPI, 85
events, 78
regions, stepi command, 98
statements, 79
Index
133
statements, return, 80
Paste, 19
pathname
add to search path, 120
pause, 125
pc
command, 116
PGDBG
Assembly-level debugging, 51
C++ debugging, 58
Command-Line Arguments, 25, 25
Command-Line MPI Debugging,
26
Command prompt, 77
Commands, 27, 95
Commands Summary, 37
Conversions, 118
Debugger, 1, 1
Debug modes, 64, 93
Default GUI appearance, 7
Events, 30, 100
Expressions, 33
Fortran arrays, 55
Fortran Common Blocks, 56
Fortran debugging, 55
Graphical user interface, 2, 7
Initialization, 2
Internal Procedures, 56
Invocation, 2
load program, 5
Main Window, 7, 7
Memory access, 117
Miscellaneous commands, 120
Name of main routine, 56
Operators, 34, 55
Printing and setting variables, 109
Process commands, 71
Process control commands, 96
Program locations, 107
Register access, 116
Register symbols, 28
Scope, 114
Scope rules, 28
Source code locations, 28
Statements, 30
Status messages, 76
Symbols and expressions, 112
Thread commands, 71
Wait modes, 74
PGDBG Commands
addr, 118
alias, 120
arrive, 107
ascii, 111
assign, 112
attach, 38, 96
bin, 111
break, 100
break command, 100
breaki, 53, 101
breaki command, 101
breaks, 101
breaks command, 101
call, 112
catch, 102
catch command, 102
cd, 107
class, 114
classes, 115
clear, 102
clear command, 102
cont, 53, 96
cread, 117
debug, 96
dec, 111
declaration, 113
decls, 115
defset, 68
defset command, 99
delete, 102
detach, 96
directory, 120
disable, 102
disasm, 107
display, 111
do, 102
doi, 103
down, 115
dread, 117
dump, 53, 117
edit, 107
enable, 103
enter, 115
entry, 113
file, 107
files, 115
focus, 68
focus command, 99
fp, 116
fread, 118
function, 119
global, 115
halt, 97
help, 120
hex, 111
history, 121
hwatch, 103
hwatchboth, 103
hwatchread, 103, 103
ignore, 104
iread, 118
language, 121
line, 119
lines, 108
list, 108
log, 121, 121
lread, 118
lval, 113
mqdump, 118
names, 115
next, 97
nexti, 53, 97
noprint, 121
oct, 111
pc, 116
pgienv, 122
print, 53, 109
printf, 110
proc, 97
procs, 97
pwd, 108
quit, 97
regs, 53, 116
repeat, 124, 124
rerun, 97
retaddr, 116
run, 53, 98
rval, 113
134
scope, 115
script, 124, 124
search backward, 109
search forward, 109
set, 114
setargs, 98
setenv, 124, 124
shell, 124, 124
sizeof, 114
sleep, 125, 125
source, 125, 125
sp, 116
sread, 118
stackdump, 53, 108
stacktrace, 53, 108
status, 104
step, 98
stepi, 53, 98
stepout, 98
stop, 104
stopi, 104
string, 111
sync command, 98, 99
synci command, 98, 99
thread command, 99
threads command, 99
trace, 104
tracei, 105
track, 105
tracki, 105
type, 114
unalias, 125, 125
unbreak, 105
unbreaki, 105
undefset, 69
undefset command, 99
undisplay, 112
up, 116
use, 125, 125
viewset
viewset command, 68
viewset command, 100
wait command, 99
watch, 105
watchi, 106
when, 106
wheni, 107
where, 109
whereis, 116
which, 116
whichsets, 68
whichsets command, 100
PGDBG control commands, 73
PGDBG GUI
assembly-level debugging, 52
PGDBG Signals, 61
pgi
command mode, 27
pgienv, 104, 105, 122
command, 122
pgienv command arguments, 122
active threads, 99
address, 21, 118
aliases, 120
all registers, 116
arg values and names, 108
ascii, 21, 111
binary, 21, 111
breakpoints, 100, 100, 101, 101
command, 53, 109
command info, 120
command summary, 120
current, 107
current file, 107
current location, 107
current working directory, 108
data type, 21
data value, 21, 21
dec, 21
decimal, 111
defined aliases, 120
defined directories, 120
directory list, 125
envirnment variable name, 124
events, 102, 103
expressions, 109, 111, 111
formated stack dump, 108
formatted expressions, 110
formatted register names, 116
hex, 21
hexadecimal, 111
identifier declarations, 115
identifier names, 115
ignored signals, 104, 104
integer address, 118
language name, 121
lines table, 108
list of signals ignored, 104
location, 107
name declarations, 116
noprint, 121
octal, 21, 111
procs command, 97
register info, 116
register value, 53
scope qualification, 116
scope qualified symbol name, 116
short integer address, 118
signals, 102, 102
stack dump, 108
stacktrace, 108, 108, 109
string, 21
strings, 111
symbol declaration, 113
values, 109
values as change, 105
watched event values, 105
printf command, 110
proc
command, 97
procedures
Fortran 90 modules, 57
internal, 56, 56
process
assign name, 99
IDs, 65
proc command, 97
process/thread set, 66
process and thread control, 73
process level commands, 71
process-only debugging, 65
stop mode, 74
wait mode, 75
Process/Thread
element color, 17
Processes
MPI rank, 64
Index
135
parallel debugging, 63
print, 97
Process-parallel debugging, 88
Process-thread sets, 99
Process grid tab, 16
process set
list members, 100
membership, 100
remove, 99
set target, 99
procwait, 75
Program
defined, 1
Program architecture
defined, 1
Program Architecture
described, 5
Program I/O
window, 11
program location
arrive, 23
sync command, 98, 99
synci command, 98, 99
thread command, 99
Programs
restart, 22
run or rerun, 22
status, 18
stop debugging, 22
prologue code, 113
prompt
return, 99
pwd
command, 108
Qquit
command, 97
Rread
watchpoint, 103, 103
record session, 121, 121
Refresh
Process/Thread Grid, 20
windows, 20
Registers
access, 116
formatted names, 116
print info, 116
symbols, 53
view mmenu, 20
register symbols, 28
regs
command, 53, 116
Related Publications, xx
Remore debugging
defined, 1
remove
alias definition, 125
all expressions, 112
breakpoint, 105, 105
expression from display list, 112
Rename
connections, 22
Repeat
command, 124
search, 19
replay debug session, 121, 121
Rerun
program, 22
rerun command, 97
Restart
program, 22
Restore
default settings, 19
retaddr
command, 116
return
address, 113
lvalue, 113
routine, 119
rvalue, 113
size of var type name, 114
statement, 80
type of expression, 114
Revert
saved settings, 19
Routines
breakpoint, 22
call, 112
clear breakpoints, 102
disassemble, 107
display in source panel, 19
edit, 107
enter scope, 116
first line, 119
instruction tracing, 105
list source code, 108
locate, 19
main name, 56
print lines table, 108
print name, 108, 109, 109
request, 22
return, 119
scope, 23, 23, 115
set breakpoint, 104
size of, 114
source line tracing, 104
step, 98
stepi, 98
step into, 22
stepout command, 98
step out of, 22
step over, 22
symbol, 119
rsh communication, 90
Run
program, 22
run command, 53, 98
rval
command, 113
rvalue
defined, 113
SSales
contact information, 23
Save
connection, 21
connections as new, 22
GUI settings, 19
scope, 114
change, 107
class, 114
classes, 115
command, 115
current, 28
136
enter, 116
global, 115, 115
identifiers defined, 115
operator, 56
print identifier names, 115
print symbol name qualification,
116
qualifier operator, 28
routine, 23, 23, 115
rules, 28
search, 28, 115
set, 115
start, 29
up one level, 116
script command, 124
Search
backward, 109
command, 109
for strings, 109, 109
forward, 109
keyword, 19, 19
last keyword, 19
path, 120
scope, 28, 115
Search Again, 19
Search Backward, 19
command, 109
Search Forward, 19
Search Forward command, 109
Server
defined, 1
Sessions
end debug, 19, 19
terminate, 97
Set
breakpoints, 22, 22
command, 114
search scope, 115
variable value, 112, 114
setargs
command, 98
setenv command, 124
Settings
display for debugger, 122
restore, 19, 19
Restore Default Settings menu
item, 19
revert, 19
Revert to Saved Settings menu
item, 19
saved, 19
save GUI state, 19
Save Settings on Exit menu item,
19
shell
command, 124
invoke, 124
Show
tabs for register groups, 20
tool tips, 20
signals, 61, 61
ignore, 104
ignored, 104, 104
interrupt, 102
Linux Libraries, 61
list, 102
PGDBG, 61
print, 102
Print, 104
SIGPROF, 61
size
variable, 114
sizeof
command, 114
sleep command, 125
Source
current, 119
line conversion, 119
list lines, 108
source code
locations, 28
source command, 125
source file
change, 107
source line
conversion, 119
source line tracing, 104
Source Window, 8, 10
Context Menu, 9
sp
command, 116
sread
command, 118
SSE Register Symbols, 53
ssh communication, 90
stack
display frames, 108
frame, 108
frames, display, 108
frames, display hex dump, 108
pointer, 116
pointer value, 116
print dump, 108
print stacktrace, 109
print trace, 108, 109
stackdump
command, 53, 108
stack frames
display, 109
stacktrace
command, 53, 108
Start
debug session, 19
PGDBG debugger, 1, 1
statements
block, 30
compound, 79
constructs, 30
execution order, 79
if, 30
parallel, 79
parallel if else, 79
parallel while, 79
PGDBG, 30
return, 80
simple, 30
while, 30
static p/t-set, 67
Status
program, 18
status
command, 104
events, 104
messages, 76
Statuss
tab, 18
Step
Index
137
into routines, 22
out of routine, 22
over routines, 22
step command, 98
stepi
command, 53, 98
Step into
called routines, 22
stepout
command, 98
Step Out, 22
Step over
called routines, 22
Stop
after return to caller, 98
at value change, 105, 106
configure mode, 74
execution, 98
modes, 74
program debugging, 22
stop
command, 104
stopi
command, 104
string
command, 111
Strings
locate, 109, 109
print, 21, 111
subroutines
nested, 56
Support
information, 23
symbol
declarations, 113
name qualification, 116
symbol names
C++, 52
Fortran, 52
Symbols, 28
global scope, 115
MAIN_, 52
print declaration, 113
register, 28
routine, 119
scope-qualified name, 116
search scope, 115
SSE register, 53
Symbols and Expressions, 112
sync
command, 98
sync command, 74, 89
synci command, 98, 99
TTables
routine lines, 108
Tabs
Call Stack, 14
Command, 12
Connections, 13
Events, 12
Groups, 13, 15, 16, 17
Locals, 14
Memory, 15
Process Grid, 16
Status, 18
Thread Grid, 16
Terminology
PGDBG, 1
Terms, 1
text mode debug, 91
Thread Grid tab, 16
Thread level commands, 72
Threads
assign name, 99
command, 99
commands, 71
grouping, 64
IDs in multilevel debug mode, 93
location, 99
logical id, 99
naming, 64
naming convention, 63
naming scheme, 93
OpenMP, 63
parallel debugging, 63
process/thread set, 66
stop mode, 74
threads-only debugging, 65
wait mode, 75
threads
command, 99
Threads, configure, 75
threads command, 82
thread set
list members, 100
membership, 100
remove, 99
set target, 99
threadstoconfig environment
variable, 75
threadwait, 75
Toolbar
buttons, 10
trace
command, 31, 104
conditional, 104
source, 104
subprogram routines, 104
tracei
command, 105
conditional, 105
source, 105
subprogram routines, 105
track
command, 31, 105
event, 105
tracki
command, 105
event, 105
type
command, 114
Uunalias command, 125
unbreak command, 105
unbreaki
command, 105
undefset command, 69, 99
undisplay
command, 112
up
command, 116
menu item, 23
use command, 125
Utilities
help, 23
138
VVariables
breakpoint, 104, 104
display local, 14
instruction tracing, 105
set value, 112, 114
trace changes, 104, 105
Versions
display, 23
View
Font menu item, 20
Refresh, 20
Registers menu item, 20
Show Tool Tips menu item, 20
View Menu, 20
viewset command, 100
Wwait command, 75, 99
wait mode, 74, 74
process, 75
thread, 75
watch
command, 105
event, 105
watch command, 31
watchi
command, 106
event, 106
Watchpoints
define, 103, 103
hardware, 103
hardware read, 103, 103
when command, 106
wheni command, 107
where
command, 109
whereis
command, 116
which command, 116
whichsets command, 68, 100
while
parallel statements, 79
while statement, 30
Window
source, 8, 10
Windows
build for debug, 2
PGDBG main, 7, 7
Program I/O, 11
refresh, 20
working directory
print, 108
write
watchpoiont, 103


