ANDRZEJ TRUTY, JAN SZARLI ´ NSKI, KRZYSZTOF PODLE ´ S, PAWEŁ ZIOBRO ´ N ∗ PARAMETRIC EFFECTIVENESS ASSESMENT OF JET GROUTING CUTOFF WALLS IN REHABILITATED FLOOD-PROTECTIVE DIKES PARAMETRYCZNA OCENA SKUTECZNO ´ SCI PRZESŁON INIEKCYJNYCH W REMONTOWANYCH WAŁACH PRZECIWPOWODZIOWYCH Abstract In the paper a problem of effectiveness of jet grouting cutoff walls with respect to the reduction of volume/amount of water seeping through the body and the ground of the reconstructed/renovated flood protective dikes has been considered and analyzed. A para- metric study for one cross section of the Vistula river dike in the Kaniów village has been made. Keywords: dikes, seepage, cutoff walls, numerical simulations Streszczenie W artykule rozwa˙ zono problem efektywno´ sci przesłon typu iniekcyjnego w kontek´ scie redukcji obj˛ eto´ sci przepływu filtracyjnego przez korpus i podło˙ ze remontowanych wałów przeciwpowodziowych. Wykonano studium parametryczne dla jednego przykładowego przekroju na Wi´ sle w Kaniowie. Słowa kluczowe: wały przeciwpowodziowe, przesłony szczelne, symulacje numeryczne ∗ Dr hab. in˙ z. prof. PK Andrzej Truty, Prof. dr hab. in˙ z Jan Szarli´ nski, dr in˙ z. Krzysztof Podle´ s, mgr in˙ z. Paweł Zio- bro´ n, Zakład Podstaw Konstrukcji In˙ zynierskich, Instytut Geotechniki, Wydział In˙ zynierii ´ Srodowiska, Politechnika Krakowska.
Transcript
ANDRZEJ TRUTY, JAN SZARLINSKI, KRZYSZTOF PODLES,
PAWEŁ ZIOBRON∗
PARAMETRIC EFFECTIVENESS ASSESMENT OF JET
GROUTING CUTOFF WALLS IN REHABILITATED
FLOOD-PROTECTIVE DIKES
PARAMETRYCZNA OCENA SKUTECZNOSCI PRZESŁON
INIEKCYJNYCH W REMONTOWANYCH WAŁACH
PRZECIWPOWODZIOWYCH
A b s t r a c t
In the paper a problem of effectiveness of jet grouting cutoff walls with respect to the
reduction of volume/amount of water seeping through the body and the ground of the
reconstructed/renovated flood protective dikes has been considered and analyzed. A para-
metric study for one cross section of the Vistula river dike in the Kaniów village has been
W artykule rozwazono problem efektywnosci przesłon typu iniekcyjnego w kontekscie
redukcji objetosci przepływu filtracyjnego przez korpus i podłoze remontowanych wałów
przeciwpowodziowych. Wykonano studium parametryczne dla jednego przykładowego
przekroju na Wisle w Kaniowie.
Słowa kluczowe: wały przeciwpowodziowe, przesłony szczelne, symulacje numeryczne
∗ Dr hab. inz. prof. PK Andrzej Truty, Prof. dr hab. inz Jan Szarlinski, dr inz. Krzysztof Podles, mgr inz. Paweł Zio-
bron, Zakład Podstaw Konstrukcji Inzynierskich, Instytut Geotechniki, Wydział Inzynierii Srodowiska, Politechnika
Krakowska.
2
1. Introduction
Rehabilitation and renovation of existing flood-protective dikes is a very important prob-
lem facing civil engineers, since a large number of them do not ensure sufficient safety in the
cases of passing the flood waves, for which they are, or at least should be, designed. Thus,
this problem of improving existing conditions of the dikes not satisfying safety requirements,
especially those concerning seepage and stability ones, by increasing their reliability in this
respect by application of Jet Grouting, executed/constructed inside the dikes, has been un-
dertaken within the framework of the PRODICON project. The main task of the Politechnika
Krakowska (PK) research group engaged in the Project is to compute, determine and analyze
the behaviour and safety of dikes in various rather extreme situations, for which they should
be foreseen and designed, to assess effectiveness of the proposed PRODICON measures. In
the first stage of the PK activity, since data for the actual and real bench-dike have not been
available yet, a parametric study/analysis has been carried out by the PK group for a typical
dike, with given (fixed) dimensions like those of the dike in Kaniow (0+100 km) of Vistula
river, but with various lengths of the cutoff wall and levels of water on the river side, and such
a study/analysis is presented in the paper, along with results of the computations and me-
chanical analysis of the dike, as well as some conclusions, which can be drawn from them.
The following text constitutes an excerpt from a broader elaboration, namely from a period-
ical report issued within the PRODICON project in the second year of its running (which is
to be delivered soon), thus everybody interested in some more detailed data concerning the
pertinent problem is referred to this foreseen report [7].
2. Rehabilitation technologies in the PRODICON project
Fig. 1. Installation of injection pipes
Rys. 1. Instalacja rur iniekcyjnych
The main goal of the PRODICON project was to enhance the existing product called
128
3
MTG-I, MTG-II used in the injection technologies applied to rehabilitation of dikes and
making impermeable barriers. The most important aspects studied in the project were related
to the modification of the MTG product with bentonite and fly ashes additives increasing
the injection range for the assumed pressure, inject workability and finally tightness of the
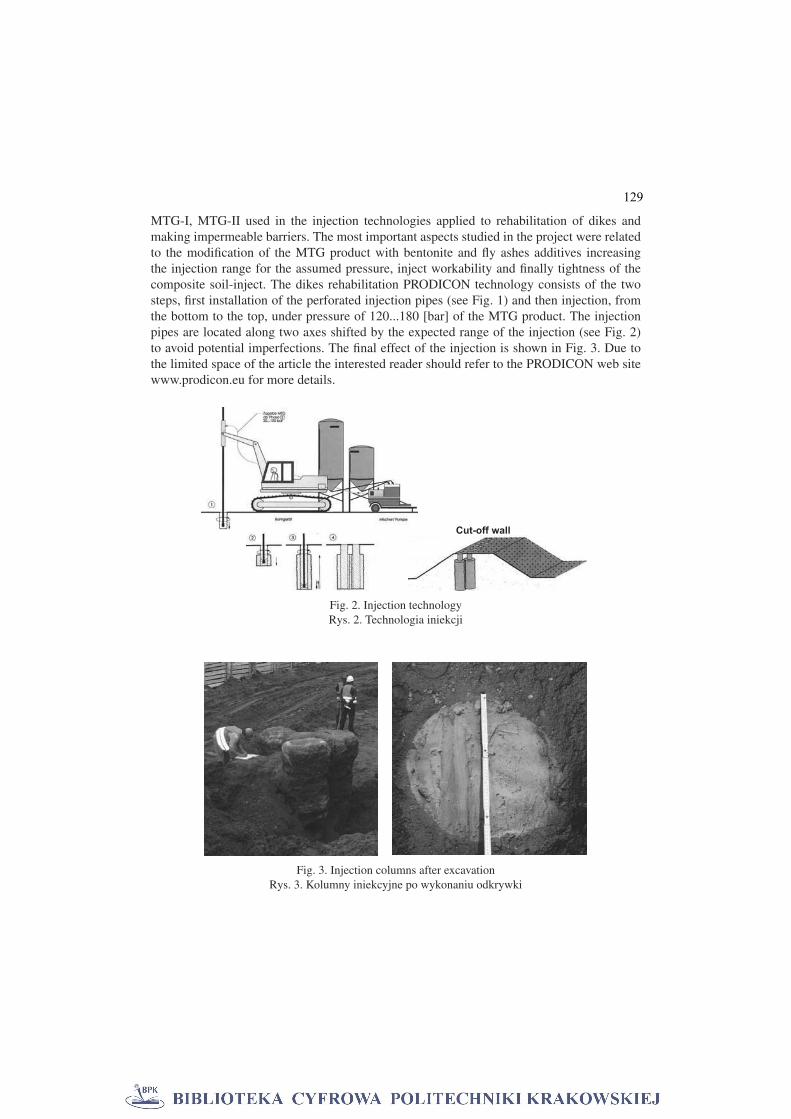
composite soil-inject. The dikes rehabilitation PRODICON technology consists of the two
steps, first installation of the perforated injection pipes (see Fig. 1) and then injection, from
the bottom to the top, under pressure of 120...180 [bar] of the MTG product. The injection
pipes are located along two axes shifted by the expected range of the injection (see Fig. 2)
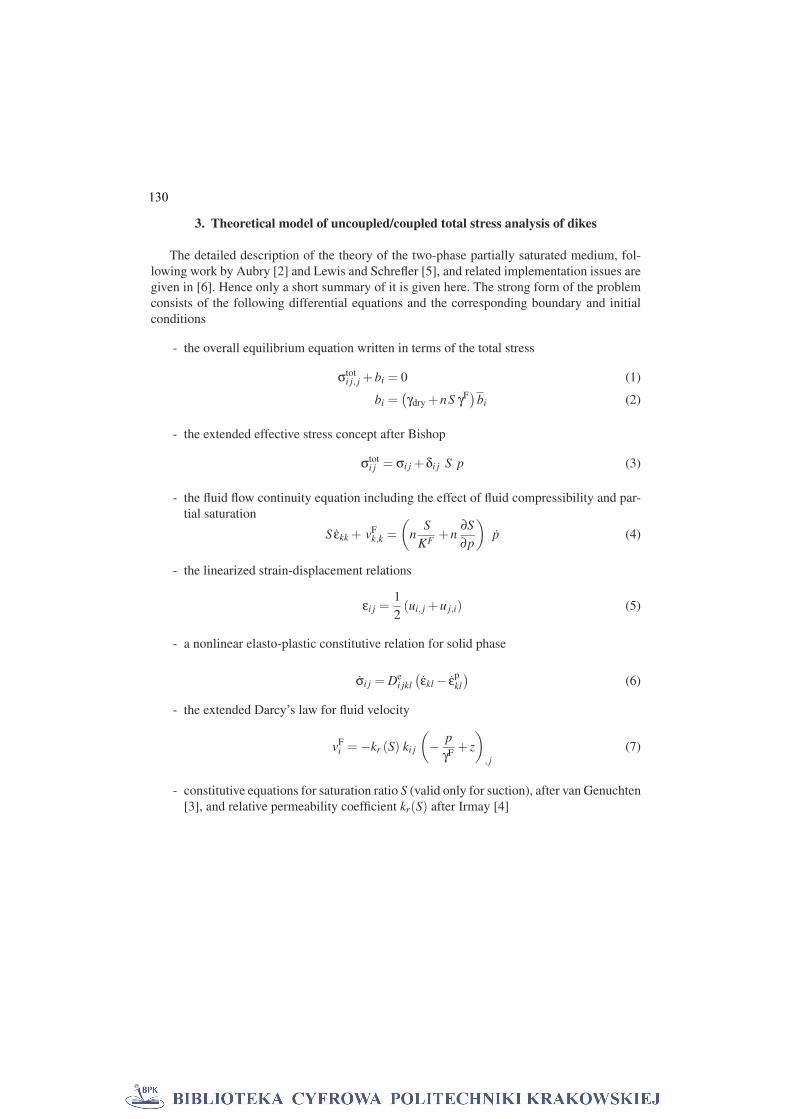
to avoid potential imperfections. The final effect of the injection is shown in Fig. 3. Due to
the limited space of the article the interested reader should refer to the PRODICON web site
www.prodicon.eu for more details.
Cut-off wall
Fig. 2. Injection technology
Rys. 2. Technologia iniekcji
Fig. 3. Injection columns after excavation
Rys. 3. Kolumny iniekcyjne po wykonaniu odkrywki
129
4
3. Theoretical model of uncoupled/coupled total stress analysis of dikes
The detailed description of the theory of the two-phase partially saturated medium, fol-
lowing work by Aubry [2] and Lewis and Schrefler [5], and related implementation issues are
given in [6]. Hence only a short summary of it is given here. The strong form of the problem
consists of the following differential equations and the corresponding boundary and initial
conditions
- the overall equilibrium equation written in terms of the total stress
σtoti j, j +bi = 0 (1)
bi =(γdry +nS γF
)bi (2)
- the extended effective stress concept after Bishop
σtoti j = σi j +δi j S p (3)
- the fluid flow continuity equation including the effect of fluid compressibility and par-
tial saturation
S εkk + vFk,k =
(n
S
KF+n
∂S
∂p
)p (4)
- the linearized strain-displacement relations
εi j =1
2(ui, j +u j,i) (5)
- a nonlinear elasto-plastic constitutive relation for solid phase
σi j = Dei jkl
(εkl − ε
pkl
)(6)
- the extended Darcy’s law for fluid velocity
vFi = −kr (S) ki j
(− p
γF+ z
)
, j
(7)
- constitutive equations for saturation ratio S (valid only for suction), after van Genuchten
[3], and relative permeability coefficient kr(S) after Irmay [4]
130
5
S (p) = Sr +(1−Sr)
[1+
(α
p
γF
)n]m
(8)
kr (S) =
(S−Sr
1−Sr
)3
(9)
where the residual saturation ratio is denoted by Sr, and α is a material parameter
responsible for decreasing the saturation ratio with increasing pressure suction while
parameters n and m are fixed to the values n = 2 and m = −0.5,
- boundary conditions to be satisfied at any time t ∈ [0,T ]
σtoti j n j = ti on Γt (10)
vFi ni = q on Γq (11)
ui = ui on Γu (12)
p = p on Γp (13)
Γt, Γq, Γu, Γp are parts of the boundary where the total stresses, fluid fluxes, displace-
ments and pore pressures are prescribed,
- initial conditions
ui(t = to) = uio (14)
p(t = to) = po (15)
3.1. van Genuchten model
The simplified van Genuchten model used for seepage analysis for partially saturated me-
dia depends on the two material parameters α and residual saturation ratio Sr. In the above
formulation no hysteretic effects, due to cycles of wetting and drying, are taken into account,
therefore parameter α is estimated to get best fit for both wetting and drying experimental
curves S(p). It must be emphasized here that in the practice we do not have access to such a
data, hence some values of these parameters, for certain classes of soils, have to be extrapo-
lated from the existing experiments. The comprehensive experimental data was recently pub-
lished in the paper by Yang et. al [8]. To illustrate how the simplified van Genuchten model
fits the experiments the analytical and experimental results for medium sand (Fig. 4), with
the following grain distribution characteristics D60 = 1.25 mm, D30 = 0.62 mm, D10 = 0.29mm, porosity n = 0.35, then for fine sand (Fig. 5) with D60 = 0.35 mm, D30 = 0.23 mm,
D10 = 0.17 mm, porosity n = 0.411, clayey sand I (Fig. 6) with D60 = 0.66 mm, D30 = 0.051mm, D10 = 0.003 mm, porosity n = 0.348 and clayey sand II (Fig. 7) with D60 = 0.56 mm,
D30 = 0.021 mm, D10 = 0.0005 mm, porosity n = 0.432 are presented. For medium and fine
sand the analytical and experimental results match very well while for the other cases it is
slightly worse. A better matching, as it is shown in the paper by Yang [8], can be obtained for
different, than default, values of m and n parameters.
131
6
0
0.1
0.2
0.3
0.4
0.5
0.6
0.7
0.8
0.9
1
0.01 0.1 1 10 100
p [kPa]
S [
-]
Drying
Wetting
van Genuchten(averaged)
Fig. 4. van Genuchten approximation of S(p) curve for medium sand (α = 11 m−1, Sr = 0)
Rys. 4. Aproksymacja van Genuchtena krzywej S(p) dla piasku sredniego (α = 11 m−1, Sr = 0)
0
0.1
0.2
0.3
0.4
0.5
0.6
0.7
0.8
0.9
1
0.01 0.1 1 10 100
p [kPa]
S [
-]
Drying
Wetting
van Genuchten(averaged)
Fig. 5. van Genuchten approximation of S(p) curve for fine sand (α = 8 m−1, Sr = 0)
Rys. 5. Aproksymacja van Genuchtena krzywej S(p) dla piasku drobnego (α = 8 m−1, Sr = 0)
132
7
0
0.1
0.2
0.3
0.4
0.5
0.6
0.7
0.8
0.9
1
0.01 0.1 1 10 100
p [kPa]
S [
-]
Drying
Wetting
van Genuchten(averaged)
Fig. 6. van Genuchten approximation of S(p) curve for clayey sand (α = 3 m−1, Sr = 0.2)Rys. 6. Aproksymacja van Genuchtena krzywej S(p) dla piasku gliniastego (α = 3 m−1, Sr = 0.2)
0
0.1
0.2
0.3
0.4
0.5
0.6
0.7
0.8
0.9
1
0.01 0.1 1 10 100
p [kPa]
S [
-]
Drying
Wetting
van Genuchten(averaged)
Fig. 7. van Genuchten approximation of S(p) curve for clayey sand (α = 2 m−1, Sr = 0.25)Rys. 7. Aproksymacja van Genuchtena krzywej S(p) dla piasku gliniastego (α = 2 m−1, Sr = 0.25)
133
8
4. Application to Vistula river dike at Kaniów
The cross-section of the rehabilitated dike of the Vistula river, located in the village of
Kaniow (0+100 km), has been taken as an example for parametric studies carried out with
aid of the FEM program Z_Soil.PC v2009. This dike due to relatively high permeability of
the embankment was supposed to be rehabilitated by using injection methods and hence the
question was what the optimal suspension level of the cutoff wall should be. The cross section
of the dike is presented in Fig. 8. The embankment is built of rock waste material (zone M1
in Fig. 8) (this material after certain time of deposition, change of the water content and
sudden change of the confining stress takes form of a granular medium with a relatively
low seepage coefficient). The other four important subsoil layers are: medium sand (zone
M2), gravelly sands (zone M3), peat (M5) and tertiary clays (zone M4). The layer tertiary
clays can be treated as impermeable during flood wave transition. Injection cutoff walls, like
MTG for instance, have rather low permeability far below 10−8 m/s and their thickness is
usually close to 40cm. This yields certain difficulties in the finite element modeling as size
of the embankment is rather large compared to the cutoff wall thickness. To eliminate the
need of discretization of the cutoff wall along the thickness and to avoid badly shaped finite
elements in that zone the domain of the cutoff wall can be represented in the discrete model by
means of an artificial (zero thickness) contact interface with an equivalent transversal seepage
coefficient k∗ =kd
twith thickness of the cutoff wall denoted by t and seepage coefficient of
the cutoff wall matrix denoted by kd . Assuming no material neither geometrical imperfections
one may treat the cutoff wall, in the analysis of flood wave transition, as fully impermeable.
All older and current versions of Z_Soil program offer this kind of the modeling tools to the
The typical flood hydrograph for the Vistula river at the considered cross section is shown
in Fig. 9. This hydrograph becomes an input for setting varying in space and time, pressure
boundary conditions, at the boundary B-C-D (Fig. 8). To simplify this setting the pressure
134
9
potential h(t) definition (h(t) = − p
γF+ y) is used. A special treatment is needed along free
boundaries (A-E-F) in order to allow for potential outflow through the downstream face of the
embankment (boundary A-E) and subsoil surface (boundary E-F) (see Fig. 8). As the pressure
field in the domain is not known apriori, therefore explicit setting of zero flux or zero pressure
boundary conditions along these boundaries is not possible. In the Z_Soil program special
seepage elements [9] are added at the foregoing domain boundaries to automatically switch
from zero flux to zero pressure once the compressive pore water pressure is detected at the
domain boundary. To start the analysis of flood wave transition we need also to specify the
initial conditions for the pore pressures and for the in situ effective stresses. This can easily
be made by running the initial state analysis which yields the initial effective stress state as
well as the steady state solution for the pressure field at time t = 0.
238.00
238.50
239.00
239.50
240.00
240.50
241.00
241.50
242.00
242.50
0 1 2 3 4 5 6 7
time [d]
Wate
r ele
vati
on
[m
.a.s
.l]
Fig. 9. Assumed flood hydrograph
Rys. 9. Załozony hydrogram powodzi
The material properties of all the material layers are specified in the Table 1. The stiffness
moduli were taken after Polish code PN-03020 [1] but it is obvious that values of these
parameters can be far from the measured ones. As the stiffness moduli do not affect values
of the stability factors and problem is driven mainly by the transient pore pressure field,
caused by varying in time pressure boundary conditions, therefore even rough estimation of
the stiffness should be good enough from the practical point of view. For all materials the
residual saturation ratio was assumed as Sr = 0. This is very important to avoid additional
cohesive effect due to partial saturation and to get safety factor predictions being on the
safe side. It has to be emphasized here that the strength parameters must be taken as effective
while the ones given in the Polish code [1] do not usually satisfy this restriction. This problem
concerns mainly cohesive soils for which effective friction angle is usually larger than the one
given in the Code while cohesion is definitely smaller. The relatively high value of seepage
coefficient in the embankment has been estimated by back analysis to confirm presence of
leakage effects on the downstream face of the dike during flood transition.
135
10
T a b l e 1
Material properties
Mat. E ν γdry eo k c φ α
[kN/m2] [-] [kN/m3] [-] [m/d] [kN/m2] o [m−1]
M1 56 000 0.35 18 0.47 2 5 34 5
M2 80 000 0.25 16.5 0.61 3.75 0 35 10
M3/M7 180000 0.25 18.5 0.43 700 0 38 10
M4 80000 0.32 20.0 0.32 0.0001 59 13 0.5
M5 10000 0.45 11 1.4 0.01 10 10 1
4.1. Cutoff wall effectiveness
Designing length of the cutoff wall is not so straightforward as it must take into account
current technical state of the dike, potential existing imperfections in the structure and ma-
terial properties of the dike and its subsoil. To assess the cutoff wall effectiveness, by taking
exclusively the effect of reduction of the outflow, the following two measures are proposed
Emax =
(1− Qmax
Q∗max
)×100% (16)
E =
(1−
∫ tendto
Q(t)dt∫ tend
toQ∗(t)dt
)×100% (17)
where
Qmax = max(Q(t)) for ∀ t ∈< to, tend > (18)
These measures can be applied to the outflow through the embankment only (then Q(t) =Qk(t)), to the outflow through the ground surface (then Q(t) = Qp(t)) as well as to the sum of
the outflows through the embankment and ground surface (then Q(t) = Qk(t)+ Qp(t)). Thecorresponding outflows for case of zero length cutoff wall are denoted by Q∗. The to is the
initial time of flood wave transition while tend is the time when the steady state is achieved.
4.2. Parametric analysis
The dike cross section, shown in Fig. 8, was considered as a template one, and the main
goal of carried out parametric analysis was to assess the cutoff wall effectiveness assuming
eight different lengths for the cutoff wall, specified in the Table 2. In the considered case the
coupled total stress analysis was carried out starting from to = 1 [d] to tend = 25 [d]. In the
period t = (1.0...6.25) [d] constant time steps were used with Δt = 0.1 [d], while later on,
up to time tend = 25 [d], a variable time steps were used by using the following recurrence
formula ΔtN = ΔtN−1×1.05 with the initial Δto = 0.1 [d].
4.3. Results
The outflow time histories through embankment only Qk(t), through ground surface onlyQp(t) and the overall one Q(t) = Qk(t)+Qp(t) are shown in Fig. 10, Fig. 11 and Fig. 12 re-
spectively. These results confirm reaching the steady state condition before tend = 25 [d]. The