Parametric modeling of root length density and root wateruptake in unsaturated soil
Sina BESHARAT1,*, Amir Hossein NAZEMI2, Ali Ashraf SADRADDINI2
1Department of Water Engineering, Faculty of Agriculture, University of Urmia, Urmia - IRAN2Department of Water Engineering, Faculty of Agriculture, University of Tabriz, Tabriz - IRAN
Received: 29.05.2009
Abstract: The problem of water movement through the root zone has attracted increasing interest during the last fewdecades. In this research, the spatial and temporal pattern of root water uptake in wetted soil was studied in the root zoneof a 6-year-old apple tree. An important part of the root water uptake model is root length density, which was measuredby sampling soil cores in one quarter of the root zone. The exponential model better described the observed apple rootdistribution. The measured data were compared against the outputs of the root density distribution model. A normalizedroot length density was used to simulate root water uptake and determine the effect of root distribution on the watercontent pattern. A 2-dimensional (2D) model of root water uptake was established, which includes root densitydistribution function, potential transpiration, and the soil water stress-modified factor. Root water uptake distributionwas measured with an array of time domain reflectometry (TDR) probes. Root water uptake parameters were optimizedby minimizing the residuals between measured and simulated soil water content values. Studies showed that themaximum root water uptake was at a depth of 10-50 cm. The results indicated an excellent agreement between themeasured and the simulated values, proving that the developed root water uptake model is effective and feasible.
Key words: Modeling, optimization, root distribution, TDR, water flow
IntroductionAn understanding of crop root distributions and
water uptake patterns has become increasinglyimportant as we seek to develop modern andenvironmentally friendly practices involving highfrequency irrigation and fertilization (Clothier andGreen 1994). Information about the structure andfunction of crop root systems is essential for matchingirrigation system design and management with croprequirements. Additionally, irrigation schedulingschemes that rely on monitoring soil water status mustconsider the influences of root water extraction
patterns on soil water dynamics. These crop factorsmay affect not only the selection of the mostappropriate soil water sensors and their bestplacements, but also the interpretation of soil waterinformation (Coelho and Or 1996, 1999).
Rooting patterns have traditionally been analyzedby means of root weight density or root length density.Root length density is often used to characterize theroot system. However, it is difficult and time-consuming to measure and determine root lengthdensity distributions accurately, especially in the field,because the distributions change with different soils,
plant species, growing seasons, climate conditions,and other factors.
There have been some investigations on the rootmorphology of trees, including the spatial distributiontableof roots under localized water application(Kjelgren et al. 1985; Meyer and Peck 1985; Roth andGardner 1985; Sakovich and Post 1986; Clausnitzerand Hopmans 1994). Information to date on thespatial and temporal distribution of root water andnutrient uptake is limited, especially for partiallywetted soils (Clothier 1989; Kramer and Boyer 1995).Root water uptake models that can describe spatialand temporal patterns were developed by Coelho andOr (1996) and Vrugt et al. (2001a).
Because of difficulties encountered in measuringdistributions of root water uptake rates directly in thelaboratory or in the field, some researchers haveestimated the root water uptake rate distributionsbased on the soil water balance method, byconsidering main factors such as soil water change,irrigation, and precipitation inputs (Asseng et al. 1998;Xue et al. 2003). Others have explored optimizationmethods to determine parameters of root wateruptake models (Coelho and Or 1996; Musters andBouten 1999; Vrugt et al. 2001a, 2001b; Hupet et al.2002).
The most common approach for modeling rootwater uptake in unsaturated flows is based onintroducing a sink term, S, in the Richards equation(Whisler et al. 1968; Clausnitzer and Hopmans 1994;Zuo and Zhang 2002; Hupet et al. 2003; Gardenas etal. 2005; Gong et al. 2006; Simunek et al. 2006). Theseroot water uptake models were not based on soiltexture and soil properties.
The objectives of this study were to test theusefulness of parametric models used for root wateruptake and to develop an empirically spatialdistribution model for apple tree roots. This modelwas established based on soil properties. Thismodeling approach was evaluated using root wateruptake data obtained from field plots.
Materials and methodsExperimental site and plant materialA single tree was selected from the middle of a
block of apple trees (Red Delicious variety). The tree
spacing was 3 m in each row with a distance of 3.2 mbetween rows. The tree was 6 years old with a trunkdiameter of about 10 cm and a crown height andwidth of about 3 m. The viable roots were mainlydistributed in the 0-1 m soil layer.
After the surface irrigation practice, soil watercontent was measured every 2 h using a TRIME-FMtime domain reflectometry (TDR) probe in 12 glassfiber tubes around the apple tree. Access tubes of 100and 200 cm in length were installed at the positionsshown in Figure 1. The profile of the soil watercontent in each tube was determined frommeasurements of soil water content at 20 cm intervalsfrom the soil surface to 200 cm in depth. Theexperiment was conducted over an 8-week period (22July to 22 September 2008). The soil type was clay-loam with low water permeability. Soil water retentioncharacteristics were measured by a pressure chamberand the soil’s unsaturated hydraulic conductivity wasestimated by determining the saturated hydraulicconductivity with a Guelph Permeameter. Fieldcapacity was determined with a Tensiometer in theorchard, and the water flow between layers wasneglected when the soil water content was below fieldcapacity.
Considering the vertical and radial variations ofthe root distribution, soil samples were taken fromaround the tree, and the position of each sample wasrecorded, including the radial distance from the trunkand the depth to the midpoint of each sample, at theend of the experiment. The root length density (cmcm-3) of each sample was determined by dividing thetotal root length by the sample volume. The 2D depth-and radial-wise distributions of the roots weredetermined from the average of the root lengthdensity of the same sample within the root zone(Figure 2).
Root distribution modelAs the basis of the new root water uptake model,
we used the exponential model of Vrugt et al. (2001b):
(1)
where β(z) denotes the dimensionless vertical rootdistribution, zm is the maximum rooting depth [L],
( ) 1z zz e *
mzp
z zm
z
b = - - -: D
Parametric modeling of root length density and root water uptake in unsaturated soil
440
and pz [-] and z* [L] are empirical parameters. Theseparameters were included to provide for zero rootwater uptake at z ≥ zm, to account for nonsymmetrical
root water uptake with depth, and to allow formaximum root water uptake at any depth, zmax (0 ≤zmax ≤ zm). The newly proposed model excludes pz andz*, but includes 4 additional parameters. The modelwas obtained based on the observation of root densityin the field (Figure 2), and the root densitydistribution was fitted to deduce the root densityfunction as follows:
(2)
where β(r,z,t) is the root density function [L L-3], Cir isa coefficient used to show the growing power of rootsthat is evaluated with a penetrometer tool [-], t is thecertain time, r is the distance in radial direction [L], zis the distance in vertical direction [L], rm(t) is themaximum root development radius [L] in the radialdirection at time t, zm(t) is the maximum root depth[L] in the vertical direction at time t, and β0, ρ, and τare the empirical parameters that were estimated tobe 0.3632, 0.5925, and -0.7519 cm cm-3, respectively.Values of the coefficient Cir in different soil, evaluatedfor root distribution ability, are given in Table 1. Thesevalues were calculated by using a penetrometer tool(Rimik CP20), which measures the resistance againstpenetration in soil. The instrument consists of a datalogger, a load cell, a cone attached to a shaft, and GPS.The data logger records the cone index value of theload required for insertion of the cone through thesoil as well as the time, date, and GPS coordinates. Thelogger plots these cone index values against the depth.
Optimized values of the empirical parameters ofEq. (2) were obtained by performing the simplexoptimization method. These values are presented inTable 2.
The equation for root density (Eq. (2)) includes 6parameters whose quantities were calculated for thefinal solution. The parameters rm and zm were takento be 150 and 100 cm, respectively, due to the limitedgrowth of roots during the experiment. The values ofτ, ρ and β0 were optimized for Cir values based on themeasured data (Table 2).
An analysis of the residual errors, the differencesbetween measured and simulated values, was used to
( , , ) ( ( ) ) ( ( ))r z t C r tr
z tz
e
1 1
( ( / ( )) ( / ( )))
irm m
r r t z z t0
m m
b
b
= - -
t x=
S. BESHARAT, A. H. NAZEMİ, A. A. SADRADDINI
441
150 cm
20
0 c
m 10
0 c
m
30cm r
z
Soil surface
Soil
dep
th
TDR tube
o
0
20
40
60
80
100
Soi
l dep
th (c
m)
0 30 60 90 120 150
Radial distance from trunk (cm)
0
0.02
0.04
0.06
0.08
0.1
0.12
0.14
0.16
0.18
0.2
Ro
ot
dis
trib
uti
on
(cm
cm
- 3)
Figure 2. Distribution of root density as determined from soilsamples in the root zone (cm cm-3).
Figure 1. Schematic view of the experimental plot and position ofTDR tubes.
evaluate model performance. Finally, fitting resultswere expressed as root mean square error (RMSE)values in the following form:
(3)
where β(mi) and β(pi) denote the measured andpredicted root density values, respectively, while n isthe number of measurements and m is the totalnumber of parameters.
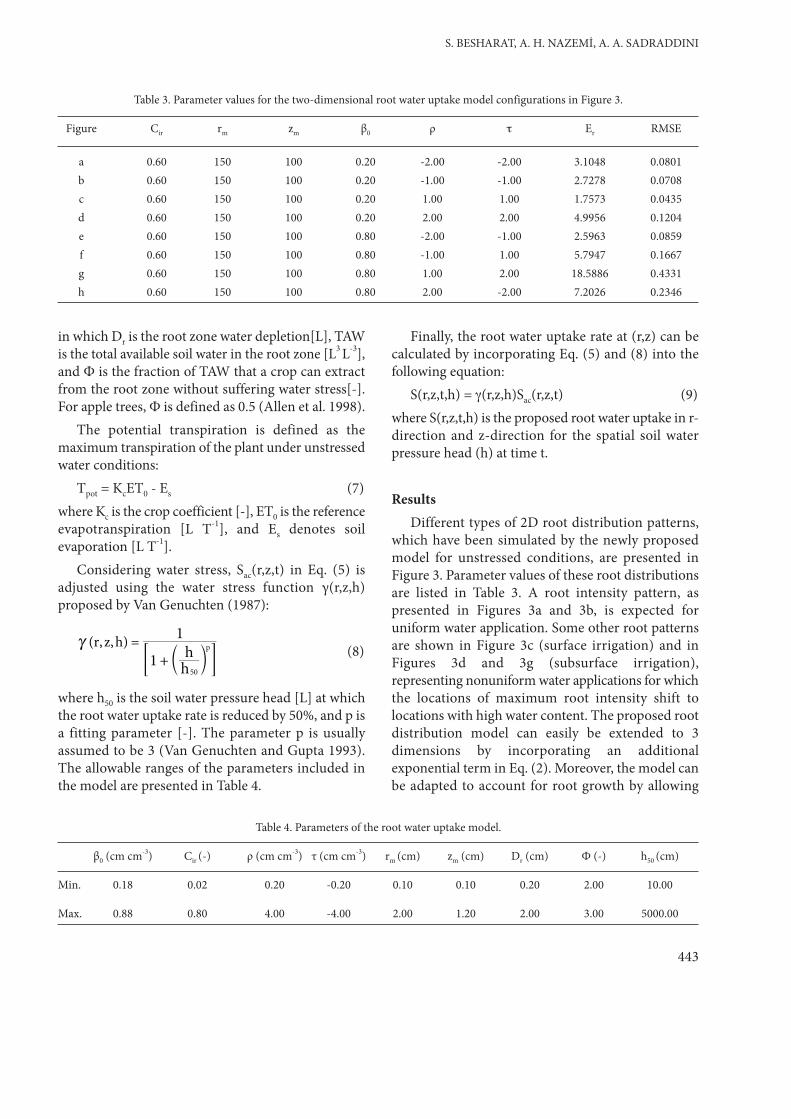
The soil of the field is loam-clay in which Cir = 0.6.The validity of the equation for root density wasinvestigated exactly by sensitivity analysis and rootdistribution changes. For this purpose, differentquantities of τ, ρ and β0 in Eq. (2) were evaluated(Table 3). The calculated root density data of theproposed equation were compared with the measureddata. Values of the relative error (Er) and RMSE arepresented in Table 3, which illustrates the sensitivity ofthe results against the values of coefficients τ, ρ andβ0 causing changes in the root density and error.
Root water uptake modelAs the potential cumulative root water uptake
must equal the potential transpiration rate (Tpot), themaximum root water uptake distribution, Smax [T-1],may be computed from (Simunek et al. 2006):
(4)
where Smax(r,z,t) denotes the maximum root wateruptake rate [T-1] and R is the size of the flow domainin the r-direction[L]. If rm ≤ R, the value of R in Eq. (4)equals rm.
According to the FAO’s crop water requirementestimation method (Allen et al. 1998), actualtranspiration is calculated by the product of potentialtranspiration and the transpiration reduction factor,i.e. Tac(t) = ksTpot(t), so:
(5)
where Sac(r,z,t) is the actual root water uptake withoutwater stress[T-1] and ks is a dimensionlesstranspiration reduction factor dependent on theavailable soil water (Allen et al. 1998),
(6)( )k TAWTAW D1s
r
U= --
( , , )
( , , ) ( )S (r, z, t)
r r z t drdz
R r z t k T t
2
s potrz
2
00
mmac =r b
r b
##
2 ( , , )
( , , ) ,S (r, z, t)r r z t drdz
R r z t Tpotrz
2
00
max mm=r
r b
b##
[ ( ) ( )]RMSE n m
m pi ii
n
1
2
=b b
--
=/
Parametric modeling of root length density and root water uptake in unsaturated soil
442
Table 1. Value of Cir in different soil textures.
Soil type sand sandy-loam loam silt-loam clay-loam silty-clay-loam sandy-clay clay
in which Dr is the root zone water depletion[L], TAWis the total available soil water in the root zone [L3 L-3],and Ф is the fraction of TAW that a crop can extractfrom the root zone without suffering water stress[-].For apple trees, Ф is defined as 0.5 (Allen et al. 1998).
The potential transpiration is defined as themaximum transpiration of the plant under unstressedwater conditions:
Tpot = KcET0 - Es (7)where Kc is the crop coefficient [-], ET0 is the referenceevapotranspiration [L T-1], and Es denotes soilevaporation [L T-1].
Considering water stress, Sac(r,z,t) in Eq. (5) isadjusted using the water stress function γ(r,z,h)proposed by Van Genuchten (1987):
(8)
where h50 is the soil water pressure head [L] at whichthe root water uptake rate is reduced by 50%, and p isa fitting parameter [-]. The parameter p is usuallyassumed to be 3 (Van Genuchten and Gupta 1993).The allowable ranges of the parameters included inthe model are presented in Table 4.
Finally, the root water uptake rate at (r,z) can becalculated by incorporating Eq. (5) and (8) into thefollowing equation:
S(r,z,t,h) = γ(r,z,h)Sac(r,z,t) (9)where S(r,z,t,h) is the proposed root water uptake in r-direction and z-direction for the spatial soil waterpressure head (h) at time t.
ResultsDifferent types of 2D root distribution patterns,
which have been simulated by the newly proposedmodel for unstressed conditions, are presented inFigure 3. Parameter values of these root distributionsare listed in Table 3. A root intensity pattern, aspresented in Figures 3a and 3b, is expected foruniform water application. Some other root patternsare shown in Figure 3c (surface irrigation) and inFigures 3d and 3g (subsurface irrigation),representing nonuniform water applications for whichthe locations of maximum root intensity shift tolocations with high water content. The proposed rootdistribution model can easily be extended to 3dimensions by incorporating an additionalexponential term in Eq. (2). Moreover, the model canbe adapted to account for root growth by allowing
1( , , )
hhr z h 1
50
pc+
=b l; E
S. BESHARAT, A. H. NAZEMİ, A. A. SADRADDINI
443
Table 3. Parameter values for the two-dimensional root water uptake model configurations in Figure 3.
Figure 3. Different configurations of the 2-dimensional spatial distribution of root density (cm cm-3).
time-dependent zm and rm values during a growingseason. Based on Figure 3, the increment of thecoefficient ρ value caused the increment of horizontalroot density (Figure 3h), and the increment of thecoefficient τ value caused the increment of verticalroot density (Figure 3f). The changing of parametercaused an increase or decrease of the root density
value (Figures 3e and 3g). The root length density (cmcm-3) was determined by soil samples taken aroundthe tree. The accuracy of the proposed model (Eq. (2))was evaluated by the relative error (Er) and the RMSEcriteria, indicating that the exhibited 2D model isflexible and can simulate root density distributionunder different conditions.
Figure 4. Two-dimensional maps of measured and simulated water content values.
Water movement in the root zoneThe presented 2D models of root water uptake
were evaluated using measured soil water contentvalues from around the apple tree during theirrigation period. For simulating water movement inthe soil, the 2D root water uptake model wasdeveloped, which was linked to a soil water dynamicmodel. The spatial 2D maps of simulated andmeasured water content values (m3 m-3) involving theeffects of root water uptake after irrigation on 3different days are shown in Figure 4. During theexperiment, the soil volumetric water contents werearound 12%. The surface soil water content reachedabout 34% (vol. %). The low water contents, centeredat a depth of 10-50 cm and a radial distance of 0-60cm, illustrated that the root water uptakes wereintensive in this area. The agreement between thesimulations and measurements was excellent (R2 =0.94, for 3 different days in Figure 4).
Root water uptake valueSimulated uptake values were calculated by the
proposed model in a 7-day period, and the model wasevaluated by data measured in the orchard. Figure 5illustrates the simulated and measured values ofuptake, in which the simulated root water uptakevalues are slightly greater than the measured values,and the highest value of water uptake was observed at10-50 cm depths and 0-60 cm radial distances.Comparison of the uptake values corresponding tothe first and the second 7-day periods in Figure 5indicates that the initial high moisture contentscaused high uptake values rather than those at the endof the irrigation period. The maximum values of rootwater uptake for the first 7 days and the second 7 dayswere measured as 0.08 and 0.04 m3 m-3 day-1,respectively. The water content of the top 0.4 m of theroot zone dropped rapidly from about 0.35 m3 m-3 to0.16 m3 m-3 (Figure 4). This reduction in moisture of
Parametric modeling of root length density and root water uptake in unsaturated soil
27 August - 2 September Measured 27 August - 2 September Simulated
Figure 5. Two-dimensional maps of measured and simulated root water uptake (m3 m-3 day-1) during theexperimental period.
some 19% is equal to 40-50 L of water extracted perday.
Finally, the measured volumetric water contentsvalues, which show more of a correlation with thesimulated values, are given in Figure 6, in which watercontent changes are presented for given depth andradial distance from the tree and for certain timesafter irrigation: 0, 72, 177, 216, 288, and 360 h. InFigure 6, 5 radial distances from the tree are shownand the average of the water content for all distancesis depicted for general comparison. Water changes atthe initial time are greater than those at the final timebecause of the high water content of the soilimmediately after irrigation. A low water stress factorcaused an increased uptake in high water content atthe same time. Meanwhile, water changes at depthsless than 40 cm were low because uptake reductionwas happening at depths greater than 40 cm. Theradial distance increment of the tree caused waterchanges and uptake decreases, too.
DiscussionThe aim of this research was to better understand
the dynamics of water uptake by apple trees in relationto the spatial distribution of soil water in the root zoneand to investigate how root function is related to rootdensity and soil properties (Tables 1 and 2). This workwas also prompted by a desire to test a simple modelof water uptake by apple trees. We used a TDRinstrument to study how water uptake by apple rootsis related to the soil depth and whether these roots canalter their uptake capacity in response to local changesin soil water availability. This facet of the experimentwas prompted by an apparent discord between ourmeasurements and those of Gong et al. (2006), notingthat their results showed the low water contentscentered at depths of 40-100 cm, whereas those in ourexperiments were centered at depths of 10-50 cm, asshown in Figure 4.
New measurement techniques are providingimproved means by which we can better observe boththe changing spatial patterns of water content in thesoil and the changing temporal patterns of wateruptake by the roots. In particular, TDR, for measuring
soil water content close to roots, is providing a sharperpicture of how root functioning can change rapidly inresponse to local changes in the water status of theroot zone or patterns of root growth (Green andClothier 1999).
Consequently, most of the tree root activity, asindicated by temporal and spatial changes in soilwater, was also concentrated in the surface soil layer.Water content profiles also revealed thatdeeper/younger parts of the root systems did notextract water as efficiently as shallower/older roots,suggesting that a significant axial resistance couldexist in deeper roots (Pierret et al. 2006). All of theseobservations converge and indicate that a precisedescription of root water uptake requires theintegration of data about soil and root hydraulicproperties as well as root spatial distribution. In orderto study all of these aspects of the soil-root interplayon water uptake, modeling can help, in conjunctionwith experimental work, to test these hypotheses onwater transfer in the soil-root system (Garrigues et al.2006).
For the 2 weeks of the experiment, the watercontent of the top 0.4 m of the root zone droppedrapidly from about 0.35 m3 m-3 to 0.16 m3 m-3 (Figure6). This reduction in moisture content ofapproximately 19% is equivalent to 600-700 L of waterbeing withdrawn from that part of the root zone. Inother words, on average, the water uptake from thetop 0.4 m of the root zone equals 40-50 L of water perday. These results are similar to the reported valuesfor Asian pears (Caspari et al. 1993) and the matureapple tree (Green and Clothier 1999). The maximumwater use of the apple tree exceeded 50 L day-1 in mid-summer, and thereafter it declined to around 20 L day-
1 during mid-autumn. This decline is due to areducing atmospheric demand for water, plus anincreasing frequency of rain later in the season.
AcknowledgementsThe authors are grateful for the financial support
of Urmia and Tabriz Universities and also offersincere thanks to Dr. Naseri and Mr. Habibzade fortheir advice.
S. BESHARAT, A. H. NAZEMİ, A. A. SADRADDINI
447
Parametric modeling of root length density and root water uptake in unsaturated soil
448
72144216
288360
0
20
40
60
80
100
10 15 20 25 30 35 40
72144
216288
360
0
20
40
60
80
100
10 15 20 25 30 35 40
072144216
288360
0
20
40
60
80
100
10 15 20 25 30 35 40
72144216
288
360
0
20
40
60
80
100
10 15 20 25 30 35 40
72144216
288
360
0
20
40
60
80
100
10 15 20 25 30 35 40
72144216
288
360
0
20
40
60
80
100
10 15 20 25 30 35 40
0 -45 cm 45 -75 cm
75 -105 cm 105 -135 cm
135 -165 cm Mean
Soil
dept
h (
cm)
Water content (%)
t = 0 t = 0
t =0
t = 0
t = 0 t = 0
Figure 6. Volumetric water content distribution throughout the soil profile for all measuring points immediately after irrigation forcertain distances from the trunk and for 0, 72, 177, 216, 288, and 360 h after irrigation.
S. BESHARAT, A. H. NAZEMİ, A. A. SADRADDINI
449
Allen R, Pereira LS, Raes D, Smith M (1998) Crop Evapotranspiration:Guidelines for Computing Crop Requirements - FAO Irrigationand Drainage Paper No. 56. FAO, Rome, Italy.
Asseng S, Ritchie JT, Smucker AJM, Robertson MJ (1998) Rootgrowth and water uptake during water deficit and recovering inwheat. Plant and Soil 201: 265-273.
Caspari HW, Green SR, Edwards WRN (1993) Transpiration of well-watered and water-stressed Asian pear trees as determined bylysimeter, heat pulse, and estimated by a Penman-Monteithmodel. Agric Forest Meteorol 67: 13-27.
Clausnitzer V, Hopmans JW (1994) Simultaneous modeling oftransient three-dimensional root growth and soil water flow.Plant Soil 164: 299-314.
Clothier BE (1989) Research imperatives for irrigation science. JIrrigation Drainage Eng 115: 421-448.
Clothier BE, Green SR (1994) Rootzone processes and the efficientuse of irrigation water. Agric Water Manag 25: 1-12.
Coelho EF, Or D (1996) A parametric model for two-dimensionalwater uptake by corn roots under drip irrigation. Soil Soc Am J60: 1039-1049.
Coelho EF, Or D (1999) Root distribution and water uptake patternsof corn under surface and subsurface drip irrigation. Plant Soil206: 123-136.
Gardenas AI, Hopmans JW, Hanson BR, Simunek J (2005) Two-dimensional modeling of nitrate leaching for various fertigationscenarios under micro-irrigation. Agric Water Manage 74: 219-242.
Garrigues E, Doussan C, Pierret A (2006) Water uptake by plant roots:formation and propagation of a water extraction front in matureroot systems as evidenced by 2D light transmission imaging.Plant and Soil 283: 83-98.
Gong D, Kang S, Zhang L, Du T, Yao L (2006) A two-dimensionalmodel of root water uptake for single apple trees and itsverification with sap flow and soil water content measurements.Agric Water Manage 83: 119-129.
Green S, Clothier B (1999) The root zone dynamics of water uptakeby a mature apple tree. Plant Soil 206: 61-77.
Hupet F, Lambot S, Feddes RA, van Dam JC, Vanclooster M (2003)Estimation of root water uptake parameters by inverse modelingwith soil water content data. Water Resour Res 39; doi:10.1029/2003WR002046.
Hupet F, Lambot S, Javaux M, Vanclooster M (2002) On theidentification of macroscopic root water uptake parametersfrom soil water content observations. Water Resour Res 38; doi:10.1029/2002WR001556.
Kjelgren R, Goldhamer DA, Uriu K, Weinbaum SA (1985) Almondtree response to variable nitrogen fertilization rates through lowvolume sprinklers. In: Proceedings of the 3rd InternationalDrip/Trickle Irrigation Congress, Vol 2 ASAE, Fresno, CA.
Kramer PJ, Boyer JS (1995) Water Relations of Plants and Soils.Academic Press, San Diego, CA.
Meyer JL, Peck D (1985) Avocado root distribution withmicrosprinklers. In: Proceedings of the 3rd InternationalDrip/Trickle Irrigation Congress, Vol 2 ASAE, Fresno, CA, pp.682-686.
Musters PAD, Bouten W (1999) Assessing rooting depths of anAustrian Pine stand by inverse modeling soil water contentmaps. Water Resour Res 35: 3041-3048.
Pierret A, Doussan C, Pages L (2006) Spatio-temporal variations inaxial conductance of primary and first-order lateral roots of amaize crop as predicted by a model of the hydraulic architectureof root systems. Plant Soil 282: 117-126.
Roth RL, Gardner BR (1985) Root distribution of mature orange treesirrigated by pressurized systems. In: Proceedings of the 3rdInternational Drip/Trickle Irrigation Congress, Vol. 2 ASAE,Fresno, CA, pp. 579-586.
Sakovich NJ, Post SEC (1986) Lemon root distribution in sprinklerdrip systems. Citrograph 71: 143-144.
Simunek J, Sejna M, Van Genuchten MT (2006) The HYDRUSSoftware Package for Simulating the Two- and Three-Dimensional Movement of Water, Heat, and Multiple Solutesin Variably-Saturated Media, User Manual, Version 1.0. PC-Progress, Prague, Czech Republic.
Van Genuchten MT, Gupta SK (1993) A reassessment of the croptolerance response function. Indian Soc Soil Sci 4: 730-737.
Van Genuchten MT (1987) A numerical model for water and solutemovement in and below the root zone. U.S. Salinity Laboratory,USDA, ARS, Riverside, CA.
Vrugt JA, Hopmans JW, Simunek J (2001a) Calibration of a two-dimensional root water uptake model. Soil Sci Soc Am J 65:1027-1037.
Vrugt JA, van Wijk MT, Hopmans JW, Simunek J (2001b) One-, two-, and three-dimensional root water uptake functions fortransient modeling. Water Resour Res 37: 2457-2470.
Whisler FD, Klute A, Millington RJ (1968) Analysis of steady-stateevapotranspiration from a soil column. Soil Sci Soc Am Proc32: 167-174.
Xue Q, Zhu Z, Musick JT, Stewart BA, Dusek DA (2003) Root growthand water uptake in winter wheat under deficit irrigation. Plantand Soil 257: 151-161.
Zuo Q, Zhang R (2002) Estimating root-water-uptake using an inversemethod. Soil Sci 167: 561-571.