Parapet Effects on Full-Scale Wind-Induced Pressures Russell R. Carter, P.E. 1 , Douglas A. Smith Ph.D., P.E. 2 1 Project Structural Engineer, Parkhill, Smith, & Cooper, Inc., Lubbock, Texas, USA, [email protected]2 Associate Professor of Civil Engineering, Texas Tech University, Lubbock, Texas, USA, [email protected]ABSTRACT Parapet walls around the perimeter of a building affect the wind-induced pressures on the walls and roof surfaces of the building. Full-scale testing on the Texas Tech University’s (TTU) Wind Engineering Field Laboratory (WERFL) test building with and without a parapet around the entire building perimeter was performed to provide a holistic view of the effects to the pressures of the building surfaces by the parapet. The 204 pressure taps of the WERFL building provide the capability to observe the pressures on the building surface and parapet with a high degree of detail so that the windward wall, roof, and leeward wall pressures are correlated. The use of aerodynamic symmetry provides a full data set so that comparisons can be made and uncertainties can be accounted. The building centerline reflected summary pressure coefficients for the building with and without a parapet are presented. INTRODUCTION Parapets perform a variety of functions. Architecturally they cap the building and hide roof top equipment. From an engineering perspective they change the wind flow and thus the wind pressure on the roof. A number of general observations can be made about parapets. Baskaran and Stathopoulos [1] note parapet thickness does not affect the roof pressures; however, the height of the parapet does. High parapets decrease the wind pressures on the roof where as low parapets decrease the frequencies of fluctuating pressure, stabilizing the loading process but creating high pressure fluctuations. This is specifically for parapets less than 1 m (3.3 ft) tall and most notable in corner sections where delta-wind vortices form for specific angles of attack. The increased pressures based on parapet height is also noted by Beinkiewicz and Sun [2] who concluded small relative parapet heights, defined as the ratio of parapet height to building height, increases the overall maximum uplift which always occurs very close to the windward edge. While there has been a great deal of research to understand how parapets affect the roof pressures there is very limited data on the wind loads on the parapet wall themselves. Stathopoulos et al. [3] was the first to report on the pressures acting of the parapet itself. This research determined that the corners experienced greater pressures than the middle span section of the parapet wall. Stathopoulos et al. [3] noted the importance of correlated pressures from both sides of the parapet wall. Using peak pressures from both surfaces, without considering correlation, overestimates the resulting loads. Stathopoulos et al. [4] compared this research to the standards being adopted by ASCE 7-02 [5]. They determined that the assumptions used by ASCE 7-02 were conservative. ASCE 7-05 [6] reduced the main wind force combined net pressure coefficients based on Stathopoulos et al. [4] observations.
Transcript
Parapet Effects on Full-Scale Wind-Induced Pressures
Russell R. Carter, P.E. 1, Douglas A. Smith Ph.D., P.E.2
2Associate Professor of Civil Engineering, Texas Tech University, Lubbock, Texas, USA,[email protected]
ABSTRACT
Parapet walls around the perimeter of a building affect the wind-induced pressures on the wallsand roof surfaces of the building. Full-scale testing on the Texas Tech University’s (TTU) WindEngineering Field Laboratory (WERFL) test building with and without a parapet around theentire building perimeter was performed to provide a holistic view of the effects to the pressuresof the building surfaces by the parapet. The 204 pressure taps of the WERFL building providethe capability to observe the pressures on the building surface and parapet with a high degree ofdetail so that the windward wall, roof, and leeward wall pressures are correlated. The use ofaerodynamic symmetry provides a full data set so that comparisons can be made anduncertainties can be accounted. The building centerline reflected summary pressure coefficientsfor the building with and without a parapet are presented.
INTRODUCTION
Parapets perform a variety of functions. Architecturally they cap the building and hide roof topequipment. From an engineering perspective they change the wind flow and thus the windpressure on the roof. A number of general observations can be made about parapets. Baskaranand Stathopoulos [1] note parapet thickness does not affect the roof pressures; however, theheight of the parapet does. High parapets decrease the wind pressures on the roof where as lowparapets decrease the frequencies of fluctuating pressure, stabilizing the loading process butcreating high pressure fluctuations. This is specifically for parapets less than 1 m (3.3 ft) tall andmost notable in corner sections where delta-wind vortices form for specific angles of attack. Theincreased pressures based on parapet height is also noted by Beinkiewicz and Sun [2] whoconcluded small relative parapet heights, defined as the ratio of parapet height to building height,increases the overall maximum uplift which always occurs very close to the windward edge.
While there has been a great deal of research to understand how parapets affect the roofpressures there is very limited data on the wind loads on the parapet wall themselves.Stathopoulos et al. [3] was the first to report on the pressures acting of the parapet itself. Thisresearch determined that the corners experienced greater pressures than the middle span sectionof the parapet wall. Stathopoulos et al. [3] noted the importance of correlated pressures fromboth sides of the parapet wall. Using peak pressures from both surfaces, without consideringcorrelation, overestimates the resulting loads. Stathopoulos et al. [4] compared this research tothe standards being adopted by ASCE 7-02 [5]. They determined that the assumptions used byASCE 7-02 were conservative. ASCE 7-05 [6] reduced the main wind force combined netpressure coefficients based on Stathopoulos et al. [4] observations.
EXPERIMENTAL SETUPThe goal of this research was to determine how a parapet affects the wind induced pressures onthe building walls and roof. To achieve this goal a wooden parapet was constructed around theentire perimeter of the test structure. The test structure was the 9.1 m x 13.7 m x 3.9 m (30 ft x45 ft x 13 ft) flat roof research building at the Wind Engineering Research Field Laboratory(WERFL). The roof is considered flat, but does have a 1.2 deg slope to shed rainfall. Thestructure rests on a metal rail embedded in a concrete slab. This allows the building to be rotated360 degrees to receive differing wind angle of attack. The WERFL building instrumentationincluded a 3-axis ultrasonic anemometer mounted above the test structure at 10 m (33 ft). TheWERFL field site also has a 49 m (160 ft) meteorological tower with six levels of anemometers.
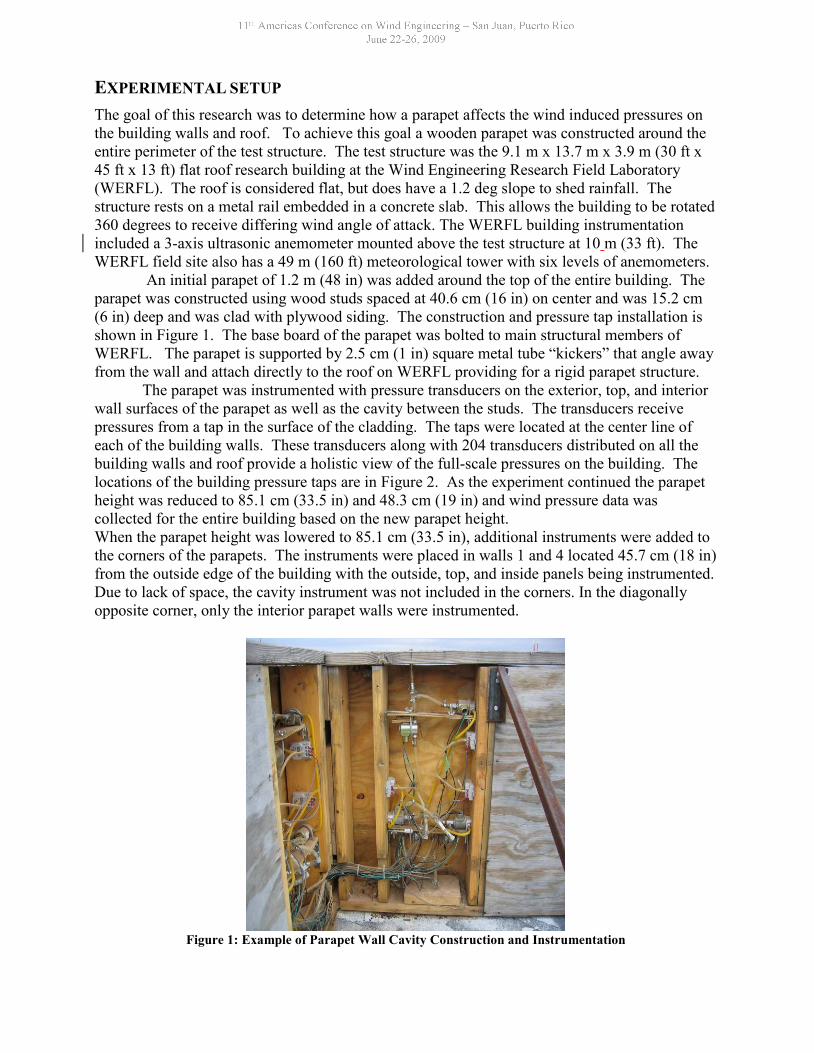
An initial parapet of 1.2 m (48 in) was added around the top of the entire building. Theparapet was constructed using wood studs spaced at 40.6 cm (16 in) on center and was 15.2 cm(6 in) deep and was clad with plywood siding. The construction and pressure tap installation isshown in Figure 1. The base board of the parapet was bolted to main structural members ofWERFL. The parapet is supported by 2.5 cm (1 in) square metal tube “kickers” that angle awayfrom the wall and attach directly to the roof on WERFL providing for a rigid parapet structure.
The parapet was instrumented with pressure transducers on the exterior, top, and interiorwall surfaces of the parapet as well as the cavity between the studs. The transducers receivepressures from a tap in the surface of the cladding. The taps were located at the center line ofeach of the building walls. These transducers along with 204 transducers distributed on all thebuilding walls and roof provide a holistic view of the full-scale pressures on the building. Thelocations of the building pressure taps are in Figure 2. As the experiment continued the parapetheight was reduced to 85.1 cm (33.5 in) and 48.3 cm (19 in) and wind pressure data wascollected for the entire building based on the new parapet height.When the parapet height was lowered to 85.1 cm (33.5 in), additional instruments were added tothe corners of the parapets. The instruments were placed in walls 1 and 4 located 45.7 cm (18 in)from the outside edge of the building with the outside, top, and inside panels being instrumented.Due to lack of space, the cavity instrument was not included in the corners. In the diagonallyopposite corner, only the interior parapet walls were instrumented.
Figure 1: Example of Parapet Wall Cavity Construction and Instrumentation
Figure 2: Diagram of pressure tap locations on WERFL and the definition of angle of attack. The shadedarea is the region of the walls and roof where the data correlates to when it is reflected about the longitudinal
and transverse axes.
Angle of Attack.AOA
TransverseAxis
LongitudinalA
xis, AO
A=0 deg
Tap Locations Prior to Mode 1000 Subsequent to Mode 1000
DATA PROCESSING AND VALIDATIONThe full scale data was collected for the first experiment configuration (Mode 1200) over a threemonth period. During that time 1497 15-minute duration runs were collected with a mean windspeed over 6.7 m/s (15 mph). From the 1497 runs collected 302 runs were stationary both inwind speed and in wind direction. The time histories of the 302 qualifying runs were validatedusing a three step validation procedure to first identify anomalies based on summary statistics,second to look at pressure coefficients for each individual tap as a function of angle of attack,and finally to flag the anomaly to remove it from the data set for this comparison.
The tap layout of the test structure has two planes of aerodynamic symmetry, thus thepressure coefficient data can be reflected about the two axes. Reflecting the data about the axesof symmetry quadrupled the data set for development of confidence intervals.
RESULTS
This research was to determine how a parapet affects the wind induced pressures on the buildingwalls and roof. The effects are determined by comparing the pressures of the taps on the axes ofthe building when the building did not have a parapet and when it did have a parapet. Theexperimental configuration of the building without a parapet was Mode 1001. Data from bothMode 1001 and Mode 1200 were processed and validated using the same methods. This paperpresents the comparisons for specific pressure tap locations based on the angle of attack versesthe mean, standard deviation, minimum and maximum pressure coefficients (Cp).
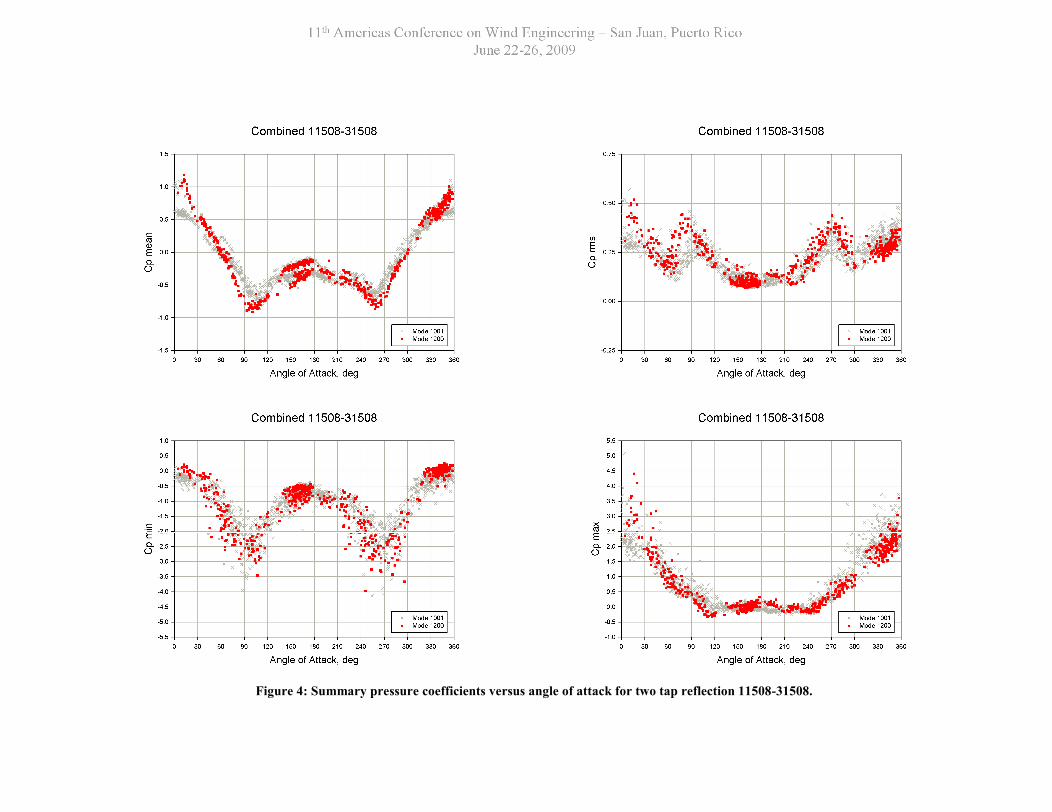
Figures 3 thru 9 provide the summary pressure coefficient (mean, standard deviation,minimum, and maximum) versus angle of attack for the centerline two tap reflection about thetransverse axis of the building. Figure 3 is the comparisons for lowest wall tap at 1.2 m (4 ft) offof the ground on the short walls of the building. The comparison shows that there is very littledifference between the mean pressure coefficients for the building with and without a parapet.This is also true for the summary pressure coefficient comparison of the 2.4 m (8 ft) wallpressure taps shown in Figure 4.
Figure 5 is the 4 m (13 ft) wall taps that had been near the top of the building when it didnot have a parapet. As expected the mean and maximum pressure coefficients are greater inmagnitude for an angle of attack near 0 deg for Mode 1200.
Figure 6 is for the first of the roof data comparisons. The taps are located 1.5 m (5 ft)from the roof and short wall edge of the building. The mean pressure coefficients are decreasedin magnitude when the tap location is beyond the windward wall parapet but the data alsoindicates that the roof surface experiences positive pressure when the parapet is on the leewardwall. The data shows that while the minimum pressure coefficients for the roof are effectivelysimilar with or without a parapet, the maximum pressure coefficients are distinctly different.The maximum pressure coefficients can be positive for all angles of attack except near 0 deg orperpendicular to the near wall.
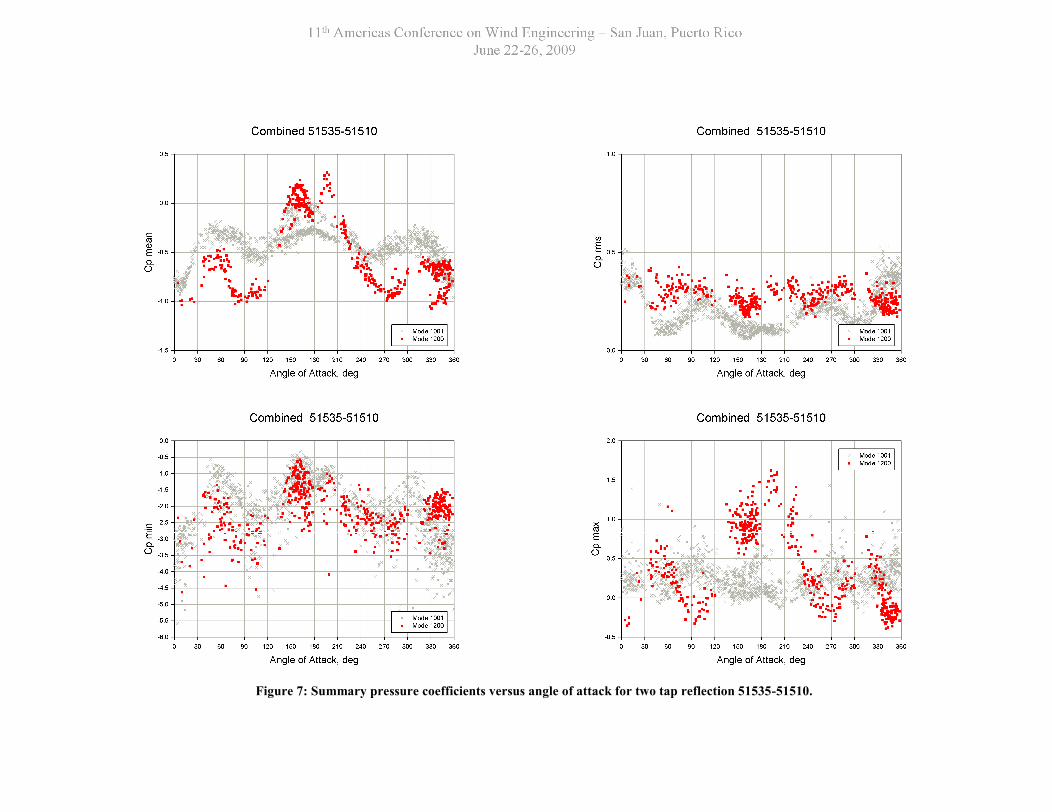
Figure 7 is for the roof tap located 3 m (10 ft) from the edge of the building. Theobservations of taps 51540-51505 in Figure 6 are evident again although maximum pressurecoefficients do not deviate as much between Mode 1001 and Mode 1200. However, the meanpressure coefficients do indicate a larger deviation when the wind angle of attack is 90 deg orparallel to the short walls of the building. The difference between the mean pressure coefficientsis due to the parapet along the long wall. The long wall parapet increases the magnitude of thenegative pressure on the roof when the angle of attack is 90 deg.
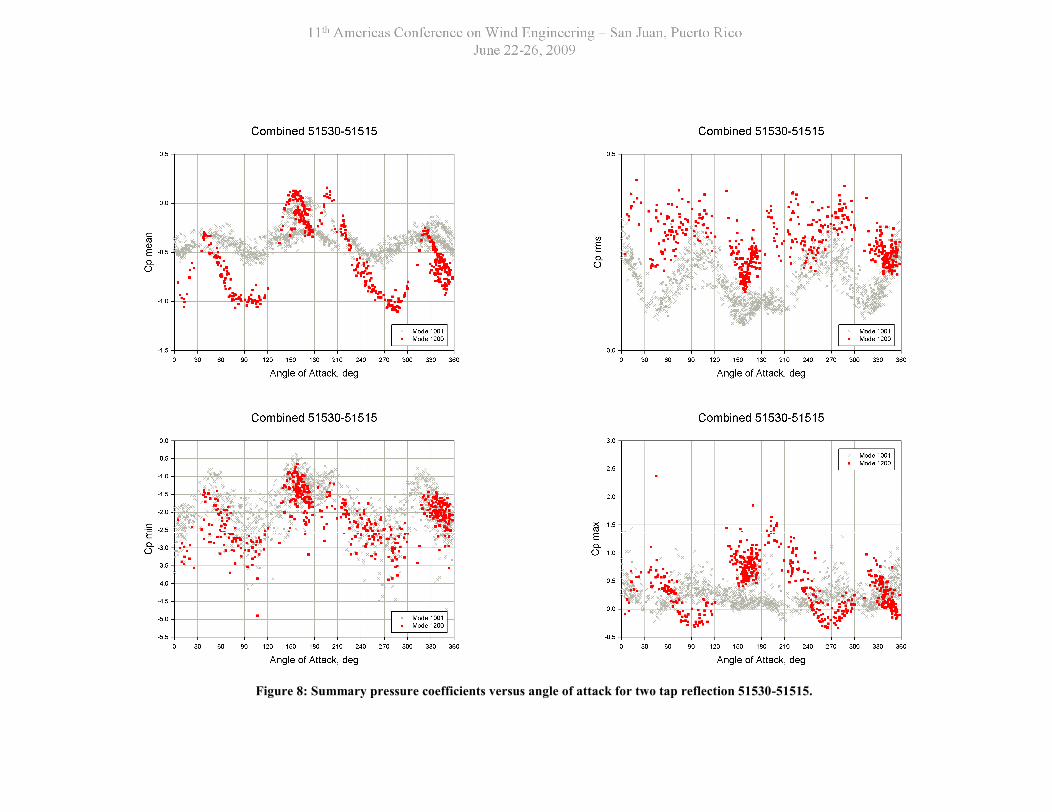
Figures 8 and 9 have the same trends previously described for the roof taps. The tapsnearer the transverse axis of Figures 8 and 9 also indicate a trend that the maximum pressurecoefficients occur when the wind angle of attack is approximately 30 deg from normal to thewall (30, 150, 210, and 330 angles of attack).
CONCLUSIONS
This research shows that the parapet wall can significantly change the wind-induced pressures onthe walls and roof of a building. The change is most prevalent on the roof. The positive pressurecreated by the leeward wall parapet on the roof is of particular interest as the mean positivepressure coefficient is approximately 1/3 of the mean negative pressure coefficient.
The peak mean positive pressure coefficient occurring at wind angles of attack 30, 150,210, and 330 for the roof taps is an observation that needs to be further investigated. Dataanalysis resulting in a four tap data reflection will provide more information in the corner areasof the roof and possibly indicate the aerodynamic cause of these peak pressure coefficients.
ACKNOWLEDGEMENT
This work was conducted under the auspices of the NIST/TTU Wind Storm Mitigation Initiative.The authors would like to acknowledge Stephen M. Morse, Ph.D. whose processing program anddatabase make the data processing and validation possible. The authors would also like toacknowledge the student assistants of the Wind Science and Engineering Research Center whosededication to maintaining the field site and processing the data make this work possible.
Figure 3: Summary pressure coefficients versus angle of attack for two tap reflection 11504-31504.
Figure 4: Summary pressure coefficients versus angle of attack for two tap reflection 11508-31508.
Figure 5: Summary pressure coefficients versus angle of attack for two tap reflection 11513-31513.
Figure 6: Summary pressure coefficients versus angle of attack for two tap reflection 51540-51505.
Figure 7: Summary pressure coefficients versus angle of attack for two tap reflection 51535-51510.
Figure 8: Summary pressure coefficients versus angle of attack for two tap reflection 51530-51515.
Figure 9: Summary pressure coefficients versus angle of attack for two tap reflection 51525-51520.
REFERENCES
[1] Baskaran, A. and T. Stathopoulos, “Roof Corner Wind Loads And Parapet Configurations,”Journal of Wind Engineering and Industrial Aerodynamics, v 29 pt 2, n 1-3, Aug, 1988, p 79-88.
[2] Bienkiewicz, B. and Y. Sun, “Local Wind Loading On The Roof Of A Low-Rise Building,”Journal of Wind Engineering and Industrial Aerodynamics, v 45, n 1, Dec, 1992, p 11-24.
[3] Stathopoulos, T., P. Saathoff, and X. Du, “Wind Loads on Parapets,” Journal of WindEngineering and Industrial Aerodynamics, 2002, p 503-514.
[4] Stathopoulos, T., P. Saathoff, and R. Bedair, “Wind Pressures On Parapets Of Flat Roofs,”Journal of Architectural Engineering, v 8, n 2, June, 2002, Enhancing the Performance of BuildingSystems in High Wind Regions, p 49-54.
[5] ASCE 7 (2002) “Minimum Design Loads for Buildings and Other Structures,” American Societyof Civil Engineers, Reston, Virginia.
[6] ASCE 7 (2005) “Minimum Design Loads for Buildings and Other Structures,” American Societyof Civil Engineers, Reston, Virginia.