13
QIMPRO CHAMPIONS LEAGUE Challenge 4 “Pareto Diagram” PREPARED BY: TAMANNA KAKKAR MAMTA AGRAWAL SANJANA SINGH (BANASTHALI UNIVERSITY)
| Date post: | 06-Aug-2015 |
| Category: |
Education |
| Upload: | tamanna-kakkar |
| View: | 81 times |
| Download: | 5 times |

QIMPRO CHAMPIONS LEAGUE
Challenge 4
“Pareto Diagram”
PREPARED BY:TAMANNA KAKKARMAMTA AGRAWAL
SANJANA SINGH(BANASTHALI UNIVERSITY)

Introduction
Pareto charts, which display the relative frequency of quality-related problems in a process or operation.
The frequencies are represented by bars that are ordered in decreasing magnitude.
Pareto charts provide a tool for visualizing the Pareto principle:a small subset of problems tend to occur much more frequently than the remaining problems.
Construct Pareto charts from unsorted raw data or from a set of distinct categories and corresponding frequencies.
Construct Pareto charts based on the percentage of occurrence of each problem, frequency
Add a curve indicating the cumulative percentage across categories
Construct side-by-side Pareto charts or stacked Pareto charts
You can use the PARETO procedure to :

• Construct comparative Pareto charts that enable : compare the Pareto frequencies across levels of one or two classification variables.
• Highlight the "vital few" and the "useful many" categories by using different colors for bars corresponding to the n most frequently occurring categories or least frequently occurring categories.
• Create charts with bars oriented vertically or horizontally• Highlight special categories by using different colors for
specific bars

Construction of pareto diagram

Create charts as traditional graphics, ODS Graphics output, or legacy line printer charts
Annotate traditional graphics chart Inset summary statistics in graphical output Save traditional graphics output in a graphics
catalog for subsequent replay Display sample sizes on Pareto charts Display frequencies above the bars Define characters used for features of line
printer charts Save information associated with the categories
(such as the frequencies) in an output data set Restrict the number of categories displayed to
the most frequently occurring categories

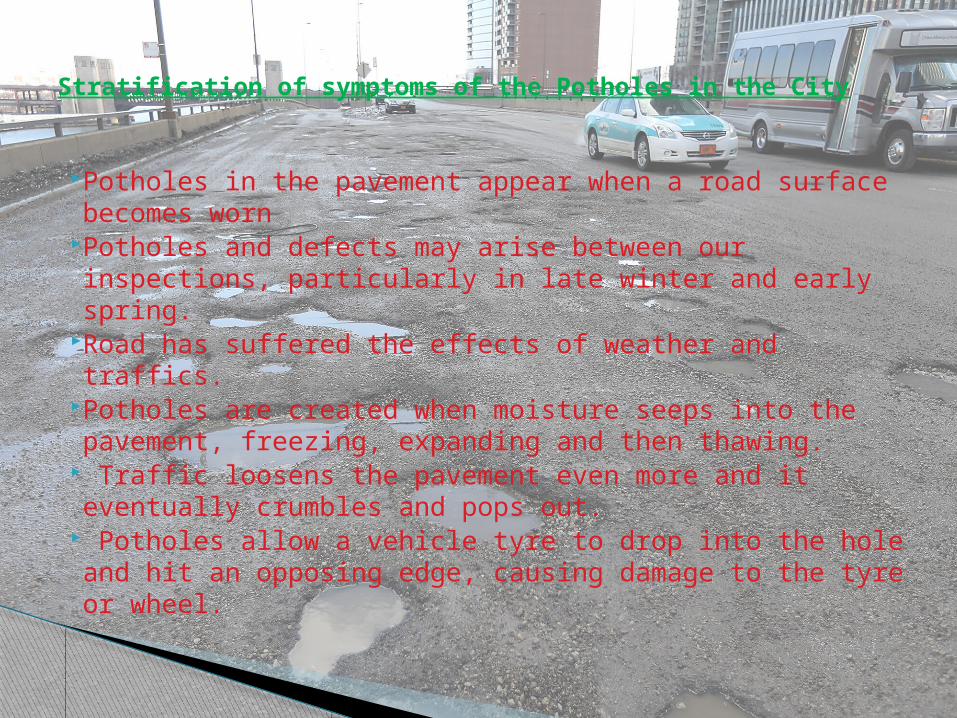
Potholes in the pavement appear when a road surface becomes worn
Potholes and defects may arise between our inspections, particularly in late winter and early spring.
Road has suffered the effects of weather and traffics. Potholes are created when moisture seeps into the
pavement, freezing, expanding and then thawing. Traffic loosens the pavement even more and it
eventually crumbles and pops out. Potholes allow a vehicle tyre to drop into the hole
and hit an opposing edge, causing damage to the tyre or wheel.
Stratification of symptoms of the Potholes in the City

PARETO DIAGRAM FOR POTHOLES IN THE CITY

By inspection- Road inspects city roadways throughout
the year to identify areas that need pavement repairs.
Major roads are inspected twice a year. Collector roads are inspected once a
month. Residential roads rely on 311 reports from
residents and on incidental reporting by field crews.
PROBLEM DEFINITION BASED ON POTHOLES

Weather affects potholes repairs in several ways –
The weather plays a key role in the formation of potholes. If rain water gets between two layers of asphalt and then freezes, the expanding ice lifts out a thawing cycle is very destructive for our roadways in generals.
When we go to repair potholes it cannot be full of water. This creates a very short-lived repair.
In order to permanent fix potholes, dry pavement and warm weather conditions are needed
Potholes are generally begins in April and goes throughout the summer months.
The majority of repairs are done during the days , but repair on major roads are often done at night when there is less traffic.

The city should give some effort to try to fix the holes.
The city should fill the holes with loose asphalt and pound it firm with shovels.
On the road instead of using asphalt they used concrete.
Concrete is more water proof and more durable than asphalt.
Concrete reacts better to the freeze-thaw cycle because it is able to stretch and contract
Lesson learned by the team
Photos credits: Google images


![Qcl 14-v3 [pareto diagram potholes in city]-[banasthali vidyapith]_[reena arora]](https://static.documents.pub/doc/80x56/55a868db1a28ab50028b461e/qcl-14-v3-pareto-diagram-potholes-in-city-banasthali-vidyapithreena-arora.jpg)
![Qcl 14-v3 [pareto diagram]-[banasthali university]_[shalu singh]](https://static.documents.pub/doc/80x56/55a58d9d1a28ab636c8b457d/qcl-14-v3-pareto-diagram-banasthali-universityshalu-singh.jpg)


![QCL-14-v3_[Pareto Diagram]_[SIIB]_[Sandeep Majumder]](https://static.documents.pub/doc/80x56/55c291ffbb61eb522b8b4723/qcl-14-v3pareto-diagramsiibsandeep-majumder.jpg)


![Qcl 14-v3 [pareto-diagram]-[banasthali university]_[devanshi agarwal]](https://static.documents.pub/doc/80x56/55c37d36bb61eb805e8b489e/qcl-14-v3-pareto-diagram-banasthali-universitydevanshi-agarwal.jpg)

![Qcl 14 v3_[pareto diagram]_[banasthali university]_[anjali}.ppt](https://static.documents.pub/doc/80x56/55a8986c1a28ab0f3e8b478f/qcl-14-v3pareto-diagrambanasthali-universityanjalippt.jpg)


