21
Parks Master Plan Phase II - December 2015 | 67 PARK SECTOR 3

Parks Master Plan Phase II - December 2015 | 67
PARK SECTOR
3

68 | Parks Master Plan Phase II - December 2015
PARK SECTOR 3 PRIORITIES
RECOMMENDATIONS
PARK SECTOR 3 SUMMARY
These priorities were developed by using condition assessment information from site visits, standard-based needs analysis (NRPA standards and data from the Trust for Public Land ParkScore™ Project), and public input via online survey, park user interviews, community events and Capital Improvement Plan (CIP) meetings.
1. Preserve environmentally sensitive areas 2. Revitalize existing parks 3. Develop new park facilities 4. Develop Neighborhood connections to parks and trails 5. Acquire new parkland 6. Develop partnerships with the school system and other entities
The park in Park Sector 3 that has the highest need for redevelopment is Dylan Duncan Memorial Skatepark. Farnsworth, Kingwood, and San Jacinto Parks are all undeveloped and could serve as sites for future amenities.
Over six acres of parkland are needed in this Park Sector. Schools not participating in the SPARK School Park Program (Non-SPARK schools) should be explored as potential future partnerships for park space. There are a multitude of private parks maintained by private Home Owner Associations in this Park Sector, primarily west of Lake Houston. Private parkland dedication through the Parks and Open Spaces Ordinance of the Planning Department’s Chapter 42 has occurred in this Park Sector for new single-family subdivisions. As the private park model is the preferred park in this area, new subdivisions should be encouraged to dedicate land for their residents to keep up with the residential growth and the parkland level of service in the area.
This Park Sector is deicient in outdoor basketball courts and tennis courts. In the 2014 survey, the top three priorities of residents in Park Sector 3 when asked what recreational needs existed in their Neighborhood were: open space and natural areas, dog parks, and upgraded community centers. Other services and amenities that residents asked for in the write-in portion of the survey were: evening recreational programming, more connections into Lake Houston Wilderness Park, itness programs, adult tennis programs, ishing activities, youth nature programs, adult softball leagues, dance and theater programs, and outdoor environmental education and camping.
A quarter of the population in this Park Sector is over 55 years old, which is a greater proportion of the population as compared to all other Park Sectors and the city as a whole of (19%). Over 37% of the population is obese compared to 30.1% for the City of Houston (City of Houston). Based on this health proile, partnerships focused on increasing physical activity levels and programming that promote healthy living should be explored.
Sources: 2010 Census, 2010 Health of Houston Survey, American Community Survey 2013, Houston Parks Board, HPARD 2014 Survey, Trust for Public Land*Source H-GAC population projections by Park Sector

Parks Master Plan Phase II - December 2015 | 69

70 | Parks Master Plan Phase II - December 2015
EXISTING HPARD PARKS
Facility Name Address StreetTotal
Acres
Trail
Length
Pocket Parks Total HPARD Pocket Park Acreage 0.00
Neighborhood ParksDylan Duncan Memorial Skate Park (formerly Kingwood Skate Park) 3950 Rustic Woods 1.02 N/A
Kingwood Community Center Park 4102 Rustic Woods Drive 2.52 N/AKingwood Park 2700 Bens Branch @ Bens View 4.28 N/ASan Jacinto Park 22100 US-59/San Jacinto River 8.92 N/A Total HPARD Neighborhood Park Acreage 16.74
Community Parks
Farnsworth Park Basin St./Walden Woods Subdivision 22.00 N/A
Total HPARD Community Park Acreage 22.00
Regional ParksLake Houston Wilderness Park 22031 Baptist Encampment Road 4,786.60 11.60 Total HPARD Regional Park Acreage 4,786.60 Total HPARD Park Acreage 4,825.34
Total HPARD Trail Length 11.60
EXISTING COMMUNIT Y CENTERS AND POOLS
Community Centers and Pool Facilities Address Zip Code Agency Responsible
Kingwood Community Center Park 4102 Rustic Woods Drive 77018 HPARDKingwood Neighborhood Community Centers and Pools
Various locations Various HOAs/Neighborhood Associations
PARK SERVICE AREAS
The Park Service Area map was produced using data provided by the Trust for Public Land ParkScore™ Project to identify areas of park need. The green areas represent a ½ mile service area of public parks (city or county) and SPARK Parks (school parks open to the public after school) or other publicly accessible non-HPARD Parks.
The orange represents areas where there is not access to a park within a ½ mile. The degree of need (orange is high need) is based on population density, household income (less than $35,000), and presence of youth (19 yrs or younger). The ofice and industrial land uses are represented in gray, to speciically highlight residential and commercial areas of need. Approximately 38% of the area in this Park Sector is in need of parkland accessible within a ½ mile, as compared to the 45% of the population of the City of Houston who need park access. Non-SPARK schools are indicated on the map as black lags to explore as potential future partnerships for park space.

Parks Master Plan Phase II - December 2015 | 71
NEEDS ASSESSMENT FOR AMENITIES IN PARK SECTOR
PARK SECTOR FACTS
The table below shows the total existing amenities (including, HPARD, County and SPARK Parks) as of 2015, the target goal per amenity, and the amenities needed based on population standards for each amenity using 2010 US Census Population. The last row shows the estimated number of amenities needed based on the H-GAC population projections for 2040 and standards used in the 2007 Master Parks Plan.
• This Park Sector contains 6,790 acres of parkland (Harris County, HPARD and other providers) and 12 miles of HPARD trails. Of the 39,948 acres in this Park Sector, 17% of this acreage is parkland. • There are over 70,000 residents. Over 77% of the population is Non-Hispanic White (higher than the City of Houston 26%). • An additional 6.4 acres of parkland are needed. This is based on the current population (2010 US Census) of the Park Sector and needs assessment done for Pocket, Neighborhood and Community parks (number of acres per 1,000 people).• H-GAC population projections estimate that this area will add over 65,000 residents by 2040. To meet the parkland needs for the estimated 2040 population an additional 67 acres of parkland will be needed.
2015 Goal 24 10 85 6 7 2 1 1 8 12 1 10 5 17
2015 Existing 24 10 85 4 4 2 1 1 8 12 1 10 5 17
2015 Needed - - - 2 3 - - - - - - - - -
2040 Needed 4 1 - 5 7 - - - - - - - - -
AMEN
ITY
PLAY
GRO
UND
S
PICN
IC S
HEL
TERS
TRAI
LS (M
ILES
)
TEN
NIS
VOLL
EYBA
LL
DOG
PAR
KS
SKAT
E PA
RKS
SWIM
MIN
GPO
OLS
OUTD
OOR
SPRA
YGRO
UND
S
BASE
BALL
(L
IT a
nd U
NIT
)
SOFT
BALL
(L
IT a
nd U
NIT
)
SOCC
ER(L
IT a
nd U
NIT
)
COM
MUN
ITY
CEN
TERS
OUTD
OOR
BASK
ETBA
LL
COUR
TS

72 | Parks Master Plan Phase II - December 2015
GUIDE FOR ESTIMATED COST OF NEW AMENITIES, PARKLAND, AMENIT Y RENOVATIONS AND OPERATION AND MAINTENANCE FOR PARK SECTOR
The table below contains costs estimates (in 2015 dollars) based on the needs assessment using 2010 US Census population and population projections provided by H-GAC per Park Sector for 2040, for both amenities and land in this Park Sector. In addition, the cost estimates (in 2015 dollars) for renovation of existing facilities and operation and maintenance are listed. A general explanation of each igure and its source is listed below:
1. Cost of New System Amenities: This is the estimated cost for amenities based on the needs assessment above. Costs are estimated for 2015 and 2040 based on costs of 2014 HPARD projects. These costs are a guide and do not include site speciic constraints such as utility extensions, lood mitigation or the purchase of land if expansion of the park was needed for these amenities.
2. Cost of Park Land: This is the land needed to meet the parkland standards for 2015 and 2040
based on the 2010 US Census and the H-GAC estimated population projections respectively. Land costs are based on land values by Park Sector, provided by H-GAC, from 2014 HCAD values for properties greater than 5,000 sq ft in size and with no structures.
3. Cost of HPARD Amenity Renovation: The 2015 cost estimate is based on the assessment that 30% of the existing facilities in this Park Sector need renovation. The 2040 cost estimate is based on the assessment that the remaining 2/3 of the facilities from 2015 and 30% of the new facilities will need renovation to meet the population growth. Costs are estimated for 2015 and 2040 based on costs of 2014 HPARD projects.
4. Annual Operation and Maintenance: This igure is based on the national average for parks and
recreation operational spending amount ($63) per resident in 2013 according the Trust for Public Land publication “2014 City Park Facts.” Houston spent $29 per resident on parks and recreation per resident in 2013. This igure shows what the cost of spending this average amount per resident would be based on the current population and the projected population in 2040.
1 2 3 4COST OF NEW SYSTEM
AMENITIES COST OF NEW PARK
LAND COST OF HPARD EXISTING
AMENITY RENOVATIONANNUAL COST OF OPERATION
AND MAINTENANCE2015 $4,000,000 6.4 Acres- $300,000 $3,000,000 $5,000,000
2040 $12,000,000 67 Acres- $3,000,000 $12,000,000 $4,000,000
TOTAL 2040 $16,000,000 73 Acres- $3,300,000 $15,000,000 $9,000,000
Parks Master Plan Phase II - December 2015 | 73
PARK SECTOR PROFILE 3
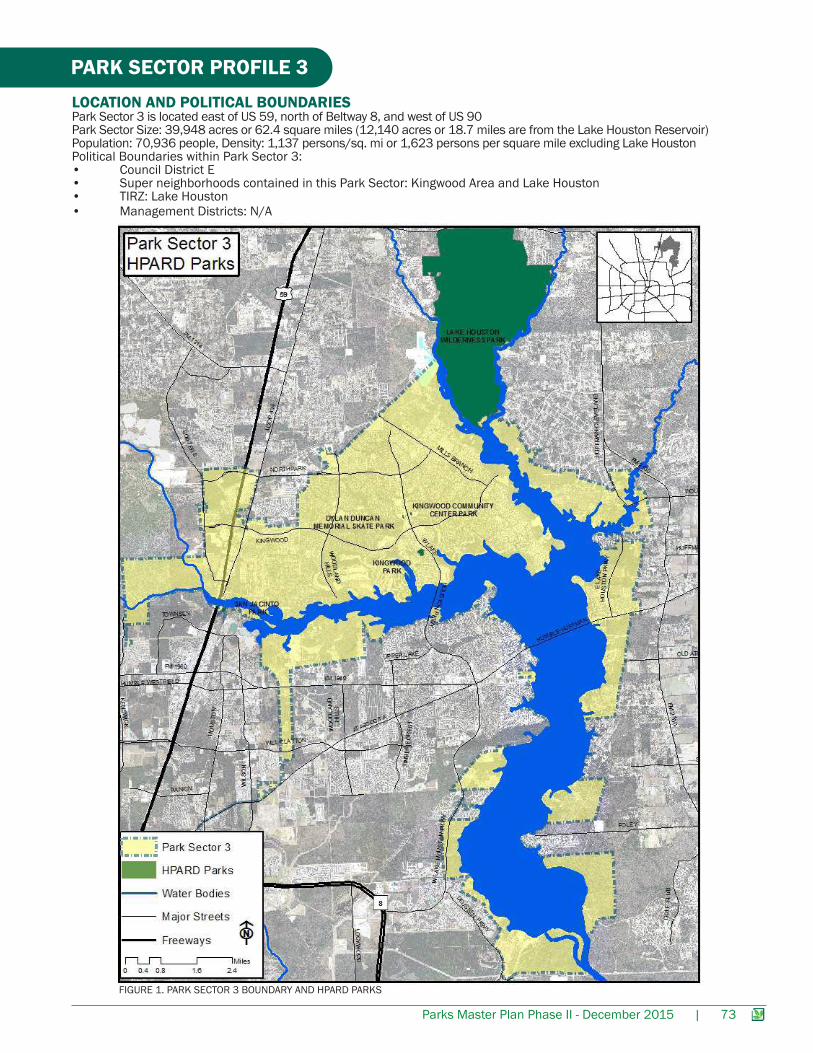
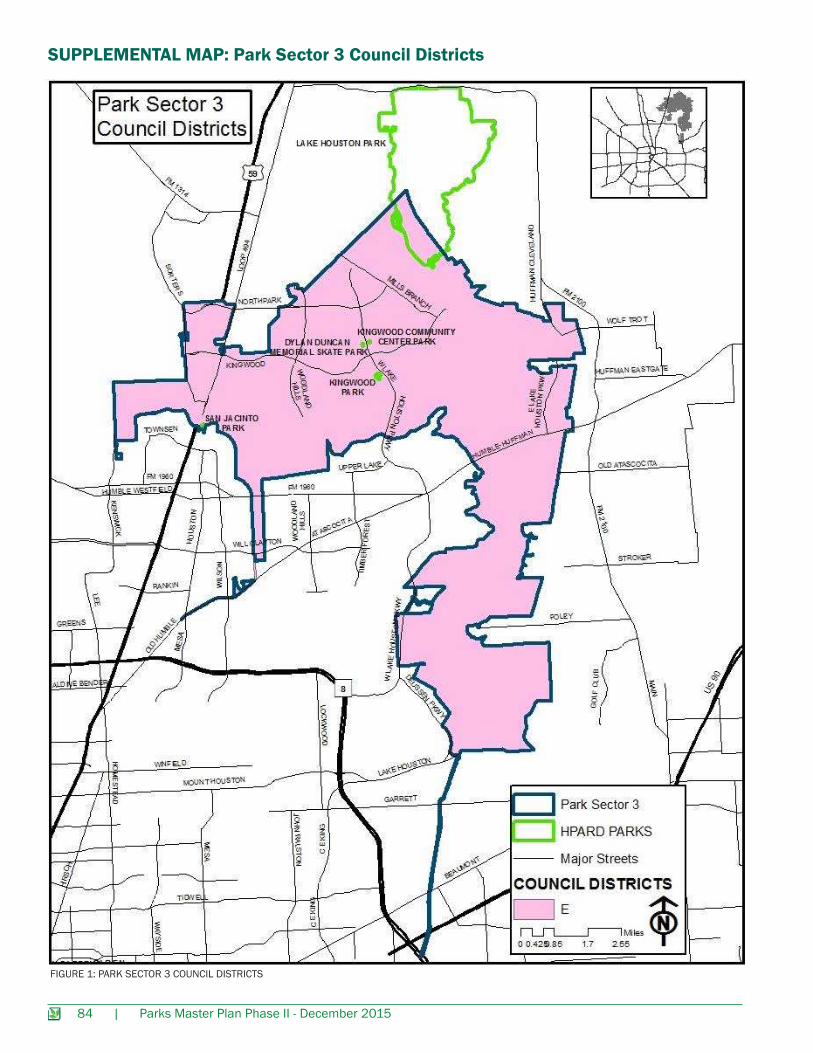
LOCATION AND POLITICAL BOUNDARIESPark Sector 3 is located east of US 59, north of Beltway 8, and west of US 90Park Sector Size: 39,948 acres or 62.4 square miles (12,140 acres or 18.7 miles are from the Lake Houston Reservoir)Population: 70,936 people, Density: 1,137 persons/sq. mi or 1,623 persons per square mile excluding Lake HoustonPolitical Boundaries within Park Sector 3:• Council District E• Super neighborhoods contained in this Park Sector: Kingwood Area and Lake Houston• TIRZ: Lake Houston• Management Districts: N/A
FIGURE 1. PARK SECTOR 3 BOUNDARY AND HPARD PARKS

74 | Parks Master Plan Phase II - December 2015
DEMOGRAPHIC PROFILE
Park Sector 3Population
Park Sector 3 Percent of
Total
HoustonPopulation
Houston Percent of
Total
Total Population 70,936 - 2,119,831 -Hispanic or Latino 9,101 12.8% 919,668 43.8%Non-Hispanic White 54,689 77.1% 537,901 25.6%Non-Hispanic Black 3,597 5.1% 485,956 23.1%Non-Hispanic American-Indian 230 0.3%
126,098 6.1%Non-Hispanic Asian 2,108 3.0%Non-Hispanic Hawaiian or Paciic Islander 71 0.1%Non-Hispanic Some Other Race 1,440 1.6% 26,828 1.3%
TABLE 1. PARK SECTOR 3 ETHNICITY (2010 CENSUS & CITY OF HOUSTON PLANNING AND DEVELOPMENT DEMOGRAPHIC DATA)
This Park Sector contains about 3.3% of the population of Houston; the majority (77%) of the residents are Non-Hispanic Whites, Latinos (13%), followed by Non-Hispanic Blacks (5%), and Non-Hispanic Asians (3%). The most dense portions of the Park Sector are the areas north of Lake Houston.
The age proile for this Park Sector shows that the percent of population under 19 (29%) is very close to the percentage of the rest of the city (28%). Further breakdown of the age groups, as shown in Figure 2., reveals that the age group between 0- 4 years old is smaller and the equivalent for the entire city (6% vs. 8%) and that the percentage of adults 55 and older makes up a quarter of the population (25%) which is signiicantly higher than that of the City of Houston (19%). This age break down might indicate that people in this portion of the city are aging in place. The percentage of adults 20-54 years old (46%) is lower than the entire City of Houston (52%). These demographic trends can help inform future programming and park improvements.
City of HoustonPark Sector 3
Seniors 55 yrs+ 19%
25%
52%46%
20%23%
8%6%
Adults20-54 yrs
Youth5-19 yrs
Children0-4 yrs
FIGURE 2. CITY OF HOUSTON VS. PARK SECTOR 3 AGE CITY OF HOUSTON ORTS BY HPARD PROGRAM AGES (2011 AMERICAN COMMUNITY SURVEY, CITY OF HOUSTON PD)
ProgramGroup
Age Groups
PS 3Population
PS 3 Percent of
Total
Program Age Group
City of Houston
Population
City of Houston
Percent of Total
Program Age Group
Children 0-4 yrs 3,916 6% 6% 166,066 8% 8%
Youth5-9 yrs 4,853 7%
23%148,843 7%
21%10-14 yrs 5,672 8% 135,622 7%15-19 yrs 5,240 8% 140,673 7%
Adults20-34 yrs 10,619 16%
46%539,348 26%
52%35-44 yrs 9,464 14% 286,117 14%45-54 yrs 11,219 16% 265,060 13%
Senior55-64 yrs 9,363 14%
25%204,852 10%
19%65 yrs + 7,823 11% 192,689 9%
TABLE 2. CITY OF HOUSTON VS. PARK SECTOR 3 AGE CITY OF HOUSTON ORTS WITH FURTHER BREAKDOWN FOR ALL PROGRAM AGE GROUPS
Ethnicity
Population by Age

Parks Master Plan Phase II - December 2015 | 75
Children 0-4 yrs 3,916 6% 6% 166,066 8% 8%
Youth5-9 yrs 4,853 7%
23%148,843 7%
21%10-14 yrs 5,672 8% 135,622 7%15-19 yrs 5,240 8% 140,673 7%
Adults20-34 yrs 10,619 16%
46%539,348 26%
52%35-44 yrs 9,464 14% 286,117 14%45-54 yrs 11,219 16% 265,060 13%
Senior55-64 yrs 9,363 14%
25%204,852 10%
19%65 yrs + 7,823 11% 192,689 9%
Housing
Income
Educational Attainment
There are a total of 26,599 housing units in this Park Sector. The percent of vacant housing in Park Sector 3 (7.1%) is much lower than the vacancy rates for the entire city (12.3%). Home ownership for this Park Sector (69.8%) is the highest in the city, which as a whole has a 39.7% home ownership rate. Similarly, the share of renters is 23 %, which is about half of that of the city’s as a whole at 47.1%.
The median household income for this Park Sector ($84,714) is the highest in the entire city, with that of the City of Houston being $48,322. According to the City of Houston Housing and Community Development data (low to moderate income derived from 2000 Census as per federal regulations) 12.8% of the population is comprised of those with low to moderate income levels.
Within Park Sector 3 the percent (45%) of individual 25+ years of age with a Bachelor’s degree or above is signiicantly higher than the relative percent for the entire City of Houston (28%). Conversely, the percentage of those within this Park Sector without a high school degree (6%) is almost three times less than for the same population for the City of Houston (25%).
EDUCATIONAL ATTAINMENT FOR THE POPULATION 25 YRS +
City of HoustonPark Sector 3
Bachelor’s Degree or Above 28%45%
4%7%
18%24%
23%18%
11%4%
9%1%
3%1%
2%0%
Associate Degree
Some College
High School Graduate, GED, or Alternative
9th-12th Grade (No Diploma)
5th-8th Grade
Less than 5th Grade
No Schooling Completed
FIGURE 3. EDUCATIONAL ATTAINMENT (2011 CITY OF HOUSTON PD)
Community Health
The Health of Houston Survey 2010 data (aggregated by Park Sector by the Houston Department of Health and Human Services) shows that 37.1% of the adult population in this Park Sector is considered obese, as compared to 30.8% for the entire population of the City of Houston. The survey also showed that 16.8% of the adult population received a diagnosis of diabetes by a professional, which is above the level for the entire city (11.4%). In addition, this survey inquired about physical activity level and the results indicate that over 27% of the respondents in this Park Sector engage in a moderate physical activity for 5 or more days a week, which is lower than that of the entire city (32%).
The national initiative, Healthy People 2020, has a goal to increase the amount of adults who engage in moderate physical activity for at least 5 days a week for 30 minutes to 47.9% of the population. The current national average of adults engaging in this level of aerobic activity is 43.5%. Finally, the survey shows that almost a third of the population in this Park Sector (32.5%) does not engage in moderate physical activity at all, which is much higher than the rate for the entire city (21.2%). As HPARD plans and prioritizes investments for future parks and trails, it should take into account the accessibility of parks, amenities provided and the impact to the health of the community in the long term. HPARD is an active participant in the Healthy Communities Initiative, Community Transformation Initiative, Healthy Kids Houston, and the Sustainable Communities Houston-Galveston Regional Plan, among other efforts. This involvement should continue with an emphasis on partnerships, measurable outcomes, and engagement with the community to encourage physical activity and help identify physical barriers to park access.

76 | Parks Master Plan Phase II - December 2015
Normal Weight30.1%
Overweight32.8%
Obese37.1%
ADULT BMI CATEGORY FOR PARK SECTOR 3
(NORTHWEST SIDE OUTSIDE LOOP)
LAND USE ANALYSIS
Moderate Physical Activity
in the Last Seven DaysPercentage (%)
0 32.501 7.602 11.603 9.504 11.705 13.106 6.407 7.70
FIGURE 4. HEALTH OF HOUSTON SURVEY (2010)- ADULT BODY MASS INDEX TABLE 3. HEALTH OF HOUSTON SURVEY (2010)- MODERATE PHYSICAL ACTIVITY
Number of Parcels Percent of Parcels Acreage of Parcels Percent of Acreage
Single-Family 21,608 74.5% 6,577 24%Multi-Family 346 1.2% 333 1.2%Commercial 231 0.8% 244 0.9%Ofice 98 0.3% 71 0.3%Industrial 62 0.2% 1,348 4.9%Public & Institutional 62 0.2% 473 1.7%Transportation 45 0.2% 147 0.5%Parks & Open Space 157 0.5% 1,621 5.9%Undeveloped 5,517 19.0% 8,546 31.2%Agriculture Production 888 3.1% 8,060 29.4%TOTAL 29,014 100% 27,420 100%
TABLE 4. LAND USE BY DESCRIPTION (2013 HCAD)
Park Sector 3 straddles 2 counties, both Harris and Montgomery. This Park Sector has a signiicant number of residential parcels (75.7%), with single-family parcels (74.5%) comprising the majority of these. However, the residential land use only accounts for a quarter (25.6%) of the acreage in this Park Sector. The majority of the acreage, over 66%, is classiied undeveloped, agricultural production or parks and open space. Lake Houston Reservoir comprises 12,240 acres inside this Park Sector.

Parks Master Plan Phase II - December 2015 | 77FIGURE 5. PARK SECTOR 3 LAND USE MAP (2011 HCAD) AND HPARD, COUNTY, AND SPARK PARKS

78 | Parks Master Plan Phase II - December 2015
Facility Name Address StreetTotal
Acres
Trail
Length
Pocket ParksTotal HPARD Pocket Park Acreage 0.00
Neighborhood ParksDylan Duncan Memorial Skate Park (for-merly Kingwood Skate Park) 3950 Rustic Woods 1.02 N/A
Kingwood Community Center Park 4102 Rustic Woods Drive 2.52 N/AKingwood Park 2700 Bens Branch @ Bens View 4.28 N/ASan Jacinto Park 22100 US-59/San Jacinto River 8.92 N/ATotal HPARD Neighborhood Park Acreage 16.74
Community Parks
Farnsworth Park Basin St./Walden Woods Subdivision 22.00 N/A
Total HPARD Community Park Acreage 22.00
Regional ParksLake Houston Wilderness Park 22031 Baptist Encampment Road 4,786.60 11.6Total HPARD Regional Park Acreage 4,786.60 Total HPARD Park Acreage 4,825.34
Total HPARD Trail Length 11.6
TABLE 5. HPARD PARKS, ACREAGE, AND TRAILS INTERNAL TO HPARD PARKS, BAYOU AND URBAN/SHARED USE TRAILS IN PARK SECTOR 3
HPARD PARKS AND TRAILS
Lake Houston Wilderness Park has 11.6 miles of natural trails located at the most northwesterly portion of the park. All of Lake Houston Wilderness Park is owned and maintained by HPARD. This park is considered as serving the entire Houston region. Harris County parks Alexander Deussen and Jesse H. Jones have a total of 8.3 miles.Kingwood has over 65 miles of trails connecting the community (PWE Bikeway GIS). Kingwood information cannot be veriied and may not be updated since each of the villages has a password protected access to the information and trail maps are only given to residents of Kingwood. According to the Kingwood website, Kingwood Service Association maintains 75 miles in the Kingwood Greenbelt; however, the map in Figure 6 only accounts for 65 miles.
A 10-mile portion of Spring Creek trail runs from Jesse H. Jones Park to the San Jacinto River. Phase II of the development of the trail began in March 2012 and continues going north on Spring Creek towards the Hardy Toll Road. At build-out, the trail will be at least 33 linear miles long.

Parks Master Plan Phase II - December 2015 | 79
FIGURE 6. PARK SECTOR 3 BAYOU TRAILS, ON- AND OFF-STREET BIKEWAY SYSTEM (PWE), HPARD, COUNTY, SPARK, PRIVATE PARKS, BIKE/PED BRIDGES AND LIGHT RAIL

80 | Parks Master Plan Phase II - December 2015
EXISTING PARK FACILITIES
There are no SPARK Parks in Sector 3.
County Park
Facility Name Address Street Total Acres Trail Length
Alexander Deussen Park 12303 Sonnier Street 309.00 2.30Dwight D. Eisenhower Park 13400 Aqueduct Road 682.50 N/AJesse H. Jones Park and Nature Center 20634 Kenswick Drive 312.00 6.00 Total HC Park Acreage 1,303.50 Total HC Trail Length 8.30
County Parks and Trails
SPARK Parks
TABLE 6. TRAILS INTERNAL TO COUNTY PARKS, BAYOU AND URBAN/SHARED USE TRAILS IN PARK SECTOR 3
Park Type
Population 70,936Pocket Park (<1 acre) 0 0 1 0 0 0.6 0.6 0.005 ac/
1,000 people - - 0.35 -0.25
Neighborhood Park (1-15 acres) 4 0 17 16.74 0 47.81 64.6 1 ac/1,000
people 0.24 0.91 54.20 6.39
Community Park (16-150 acres) 1 2 5 22.00 621.0 295.5 938.5 1.5 ac/1,000
people 0.31 13.23 84.40 -832.09
Regional Park (151+ acres) 1 1 1 4,786.60 682.5 322.85 5791.95 8.0 ac/1,000
people
TOTAL 6 3 24 4,825.3 1,303.5 666.75 6,789.93 138.95 6.39
HPA
RD P
ark
Num
ber
HC
Park
Num
ber
HPA
RD A
crea
ge
Coun
ty A
crea
ge
Othe
r Pro
vide
rs
Othe
r Pro
vide
rs
Tota
l Par
k Ac
reag
e
Curr
ent
HPA
RD L
OS
Curr
ent T
otal
Inve
ntor
y LO
S
Tota
l Inv
ento
ry
NEE
D 2
010
Popu
latio
n
HPA
RD N
EED
(2
010
Popu
latio
n)
HPA
RD
Reco
mm
ende
d St
anda
rd
FIGURE 7. PARK SECTOR 3 HPARD LOS AND PARKLAND NEED ANALYSISA negative number in the last two columns means there is a surplus, a positive number means there is a need
Open and Green SpaceTo determine level of service the 2007, Master Plan outlined standard distances based on park classiication as well as population. Analysis in this section will be done based on population (acres/1,000 people) as well as park accessibility within a ½ mile radius using data provided by The Trust for Public Land ParkScore™ Project. Figure 6 below shows the level of service (LOS) based on the 2007 HPARD recommended standards of a number of acres per 1,000 people using the 2010 Census population. HPARD recommends standards per park type (2007 HPARD Master Plan Criteria Facility Needs) of 0.005 acres/1,000 people for a Pocket Park; using this standard Park Sector 3 meet this need for Pocket Parks. For the HPARD recommended standards per park type of 1.5 acres/1,000 people for a Community Park, Park Sector 3 also meets this standard. According to the HPARD recommended standards per park type of 1 acres/1,000 people for a Neighborhood Park, Park Sector 3 needs 6.39 acres of parkland. The analysis for level of service and needs is shown below.
It is worth mentioning that almost 6 acres of land have been dedicated as private parks (to be maintained by HOAs) in this area as park of the Parks and Open Spaces Ordinance which required developers to either pay a fee-in-lieu or dedicate private or public parks. Kingwood has at least 21 parks accounting for 660 acres maintained by the Kingwood Service Association (KSA). It is possible that there are additional parks in the area, but the information is not readily available and will need to be validated by residents. Figure 7 includes all of the parks maintained by the KSA and also those dedicated by developers to meet the requirements of the ordinance.

Parks Master Plan Phase II - December 2015 | 81
Another way to measure the level of service provided by parks is by looking at a “walkable” distance (1/2 mile radius) from the park regardless of the size of this park. The Rice University Shell Center for Sustainability published the Houston Sustainable Development Indicators: A Comprehensive Development Review for Citizens, Analysts, and Decision Makers used ¼ of a mile distance of persons living from a park as a sustainability indicator for quality of life and determined that 44% of residents have access to a public space (King 2012). The Trust for Public Land (Trust for Public Land (TPL)) ParkScore™ Project mapped the park needs of the City of Houston based on accessibility by density, age, and income. The methodology used by Trust for Public Land (TPL) ParkScore™ factors in the accessibility to a public park within ½ mile considering freeways and major thoroughfares as barriers to park access. Trust for Public Land (TPL) ParkScore™ found that 45% of residents have access to public spaces (Trust for Public Land (TPL) 2012). The map was produced using data provided by Trust for Public Land (TPL) ParkScore™ Project. The areas in green on the map in Figure 7 represent the area within ½ mile of existing parks not blocked by freeways or major roads. Roughly 38% of the live/play areas in this Park Sector are not served by a park, which is much lower than that of the entire city (55%). This percentage was calculated by subtracting the areas served, industrial areas, the Lake Houston Reservoir, and acreage of private parks from the total acreage of the Park Sector. The majority of residential areas are served; however, there are small Pockets of residential development in the eastern portion of the Park Sector that are not being served by a public or a private park. Additional development of vacant acreage is occurring in this Park Sector and some private park dedication is being provided to new residents. The hatched areas are not accounted in the percentage for the areas served at this time, so the service area percentage is underestimated.
FIGURE 7. PARK SERVICE AREAS IN (1/2) MILE ACCESS) AND LIVE/PLAY AREAS OF NEED
82 | Parks Master Plan Phase II - December 2015
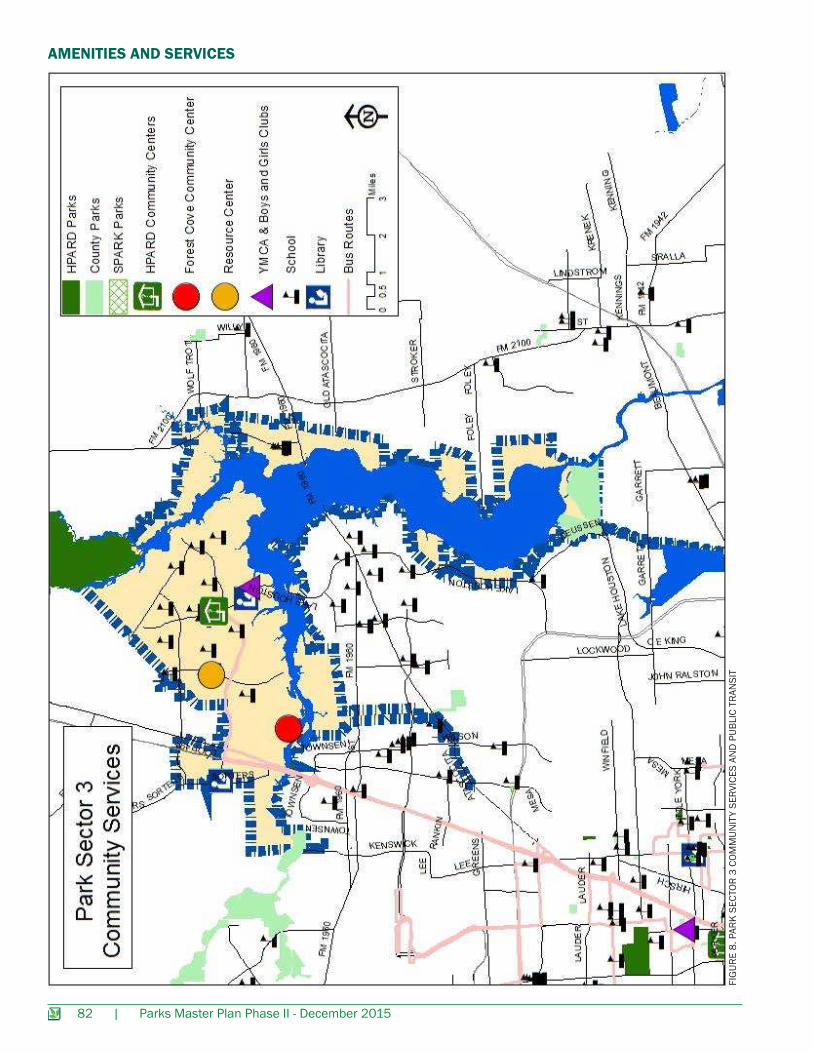
AMENITIES AND SERVICES
FIG
URE
8. P
ARK
SECT
OR 3
COM
MUN
ITY
SERV
ICES
AN
D P
UBLI
C TR
ANSI
T

Parks Master Plan Phase II - December 2015 | 83
TABLE 8. LEVEL OF SERVICE FOR AMENITIES IN PARK SECTOR 3A negative number in the last two columns means there is a surplus, a positive number means there is a need.
The 2007 HPARD standards by amenity have been applied to the amenities in Park Sector 3. The irst column after the recommended HPARD standards indicates the level of service (LOS) accounting for HPARD facilities only, the total inventory standard accounts for facilities from all providers. Then, the standard for each amenity is compared to the 2010 Census population data for this Park Sector to determine if the standard has been met or if more amenities are needed. The last two columns show the number of facilities needed to meet the standard using HPARD inventory only and using all providers in the Park Sector. According to these recommended HPARD standards, Harris County and other providers are meeting the needs of the residents for playgrounds, picnic shelters, volleyball courts, dog parks, skate parks, community centers, swimming pools, outdoor spraygrounds, ball ields, and soccer ields. This Park Sector is deicient in outdoor basketball courts (2), and tennis courts (3). Since information about Kingwood Parks is not easily accessible, it is possible that these amenities exist in some of the parks.
Amenities-Level of Service
HPARDHarris
County
Other
ProvidersTotal
Recommended
HPARD
Standard
Current
HPARD
Level of
Service
Current
Total Inventory
Level of Service
HPARD
NEEDS
Over/Under
Service
Total
Inventory
NEEDS
Over/Under
Standard
Population 70,936
Playgrounds 0 5 19 24 1 4,000 1 70,936 1 2,956 18 -6Picnic
Shelters 2 2 6 10 1 10,000 1 35,468 1 7,094 5 -3
Trails 11.6 8.3 65 85 0.2 1,000 0.05 1,000 1.2 1,000 3 -71
Outdoor Basketball
Courts0 0 4 4 1 12,000 0 70,936 1 17,734 6 2
Tennis 0 0 4 4 1 10,000 1 70,936 1 17,734 7 3Volleyball 1 0 1 2 1 50,000 1 70,936 1 35,468 1 0Dog Parks 0 0 1 1 1 100,000 0 70,936 1 70,936 1 0
Skate Parks 1 0 0 1 1 100,000 0 70,936 1 70,936 0 0Community
Centers 1 0 7 8 1 30,000 1 70,936 1 8,867 1 -6
Swimming Pools 0 0 12 12 1 50,000 1 70,936 1 5,911 1 -11
Outdoor Spraygrounds 0 0 1 1 1 100,000 1 70,936 1 70,936 1 0
Baseball (Lit & Unlit) 0 3 7 10 1
ield 30,000 1 70,936 1 7,094 2 -8
Softball (Lit & Unlit) 0 0 5 5 1
ield 30,000 1 70,936 1 14,187 2 -3
Soccer (Lit & Unlit) 0 0 17 17 1
ield 10,000 1 70,936 1 4,173 7 -10
• Dylan Duncan improvements for skate park are planned.• Lake Houston has been allotted $1 million for plans to install a one lane vehicular bridge over Peach Creek, 3 new cabins, and a restroom facility on the west side of the lake. The work was completed in 2015.
Status of Projects (POS/CIP/CDBG/Grants)
The previous map shows some of the community services available in this area: community centers, resource centers, schools, libraries, YMCAs, and Boys and Girls Clubs. There are two community centers and one resource center located in Park Sector 3: Kingwood and Forest Cove Community Centers and Will’s Kids.The Kingwood Service Center provides many services, such as: senior programs, a variety of exercise and craft classes and facility rentals for events and special programs. The Forest Cove Community Center offers: a private Neighborhood community center providing special events for the community and facility rentals for private events or programs for Forest Cove Community members. Will’s Kids is also located in this Park Sector and offers: a need-based program that provides ongoing private lessons in sports, tutoring, scholarships and technology acquisition, a club which mentors middle and high school aged kids in science and math, and an after-school program for elementary kids focusing on ine arts and sports. The libraries in this Park Sector provide computer access, community meeting space, and educational programs.
84 | Parks Master Plan Phase II - December 2015
FIGURE 1: PARK SECTOR 3 COUNCIL DISTRICTS
SUPPLEMENTAL MAP: Park Sector 3 Council Districts

Parks Master Plan Phase II - December 2015 | 85
FIGURE 2: PARK SECTOR 3 MANAGEMENT DISTRICTS AND TIRZS
Park Sector 3 Tax Increment Reinvestment Zones (TIRZs) and Management Districts

86 | Parks Master Plan Phase II - December 2015
FIGURE 3: PARK SECTOR 3 SUPER NEIGHBORHOODS
Park Sector 3 Super neighborhoods

Parks Master Plan Phase II - December 2015 | 87
Park Sector 3 Floodplain Areas
FIGURE 4: PARK SECTOR 3 FLOODPLAIN AREAS


