100 Parkers Mill • Oswego, IL 60543 • (630) 554-3618 Website: www.oswegoil.org Posted: Date: ___________ Time: ___________ Place: ___________ Tina Touchette Initials: ___________ Village Clerk NOTICE AND AGENDA NOTICE IS HEREBY GIVEN THAT A SPECIAL COMMITTEE OF THE WHOLE MEETING OF THE OSWEGO VILLAGE PRESIDENT AND BOARD OF TRUSTEES WILL BE HELD ON March 03, 2018 9:00 AM Location: Village Hall A. CALL TO ORDER B. ROLL CALL C. CONSIDERATION OF AND POSSIBLE ACTIONS ON ANY REQUESTS FOR ELECTRONIC PARTICIPATION IN MEETING D. PUBLIC FORUM E. OLD BUSINESS F. NEW BUSINESS F.1. Review The Capital Improvement Plan Years 2019-2038 and Fiscal Year 2019 Draft Village Budget. Memo_for_Budget_Workshop (2).docx BudgetPresentation2019.pdf 1
Discuss and review the Capital Improvement Plan and the Fiscal Year 2019 Village Budget
BOARD/COMMISSION REVIEW:
N/A
ACTION PREVIOUSLY TAKEN:
Date of Action Meeting Type Action TakenN/A N/A N/A
DEPARTMENT: Finance
SUBMITTED BY: Mark G. Horton, Finance Director
FISCAL IMPACT: N/A
BACKGROUND:
Staff annually presents the latest Capital Improvement Plan and Draft Budget to the Village Board for review and discussion at the Saturday workshop. The workshop allows for discussion on the Capital Improvement Plan and Draft Budget in a more relaxed environment. The Capital Improvement Plan and Village Budget are formally adopted at a Village Board meeting in April.
DISCUSSION:
Staff will present the Capital Improvement Plan and Draft Budget to the Village Board for review and discussion. The Capital Improvement Plan, Draft Budget and presentation for the meeting are included for review before the workshop.
RECOMMENDATION:
Staff recommends proceeding to the public hearing on the Village Budget at the April 3rd Village Board meeting.
3
Budget Workshop3/3/20182 | P a g e
ATTACHMENTS:
Presentation
Capital Improvement Plan
Draft Budget
4
Budget WorkshopMarch 3, 2018
5
WHY ARE WE HERE
Review the Capital Improvement Plan (CIP)
Review the Fiscal Year 2019 Village Budget
6
CIP LIST OF PROJECTS
Project list
$96 million in listed projects in the next five years
$13 million in Fiscal Year 2019
7
FISCAL YEAR 2019 CAPITAL IMPROVEMENTS
$ 150,000 ERP Implementation$ 8,000,000 Police Headquarters Construction$ 75,000 Annual Road Program$ 150,000 Wolf’s Crossing segment one; phase 2 & 3 engineering$ 110,000 Police squad car mobile computer upgrade$ 225,000 PD network switch & computer refresh$ 35,000 Village Hall camera monitoring system$ 242,000 Traffic signal & IDOT shared road improvements$ 1,444,600 Downtown road/parking improvements $ 330,500 Vehicle and Equipment replacements$ 2,416,300 Water & sewer capital improvements
Replacement Vehicles - Public Works 150,000 - - - -
Smart Trailer 17,000 - - 20,000 -
Vehicles Total 330,500 266,970 394,569 292,862 352,780
Vehicle Fund Total 330,500 266,970 394,569 292,862 352,780
11
Capital Improvement 5-Yr Plan by Fund FY 2019 FY 2020 FY 2021 FY 2022 FY 2023
Water & Sewer Capital Fund
Public Works
Booster Station #2 Repairs 130,000 - - - -
Engineering for Sanitary Lift Station Generators 75,000 - - - -
Generators Wells 3 & 4 - - 450,000 - -
New Main - Minkler Road Watermain - - - - 375,000
New Main - Wolf Road Watermain - 695,000 5,096,500 - -
Transmission Lines from Plant to Towers - - 2,000,000 9,000,000 9,000,000
Water Meter & Reader Replacement 1,725,750 1,256,750 1,256,750 1,246,750 -
Water Tower - Fox Chase - - - 750,000 -
Water Tower - Hunt Club - 1,000,000 - - -
Water Tower - Village Center - - - - 625,000
Water Towers - Cleaning - - - - 45,000
Water Treatment Facility - New 5 MGD - - 1,767,450 1,767,450 14,512,600
Water Treatment Facility - Preliminary Engineering & Land Acquisition 405,600 21,600 7,200 - -
Sanitary Sewer Lining Program 80,000 80,000 80,000 80,000 80,000
Lead Service Line Replacement Program - 50,000 50,000 50,000 50,000
Public Works Total 2,416,350 3,103,350 10,707,900 12,894,200 24,687,600
Water & Sewer Capital Fund Total 2,416,350 3,103,350 10,707,900 12,894,200 24,687,600
12
THE DRAFT BUDGET
Review the Fiscal Year 2019 Village Budget
13
WHAT’S IN THE BUDGET
Funding to provide for;
Normal operations/personnel costs Shared Facilities Manager – full year $13.2 million in capital improvements
$10.8 million funded from bond proceeds and sales taxes $2.4 funded from water revenues
$4.4 million for debt service Regional positioning Special events Economic development ERP implementation TIF District development Water/sewer operations Garbage collection Vehicle replacements Pension contributions
14
WHAT’S IN THE BUDGET
Line item increases Bi-ennial Community Survey - $25,000 Code codification project - $12,000 Aurora Area Convention/Visitors Bureau - $72,000; increased from $60,000 Regional
Positioning budget PD cost of KenComm software upgrade - $27,000 PD dispatching cost increases - $40,400 Facility landscaping cost increases - $36,700 TIF public improvements - $1,102,000 Water & Sewer Fund
Well maintenance increases - $41,000 Communication costs up - $15,000 Meter supplies up - $12,000
Police pension expenses up - $261,000 Line item Decreases
VH and PD building maintenance expenses moved to PW budget PD fuel costs down - $9,600 PW snow removal costs down - $20,000 PW maintenance streets/storm sewers down - $13,000 PW tool expense down - $6,500 PW tree purchases down - $40,000 MFT Fund public improvements down - $825,000 Debt Service Fund debt payouts down - $98,000 Capital Improvement Fund expenses down - $16 million Water & Sewer Fund engineering down $112,000 expenses moved to Water & Sewer
Capital Fund Water & Sewer Fund debt service payouts down - $87,000
15
Fiscal Year 19 BudgetOverview
Total revenues of $38.5 milliono 11% compared to current fiscal yearo Total tax revenue of $21 milliono Charges for serviceso Transfers
Total expenditures of $47.1 milliono 20% compared to current fiscal yearo Personnel & benefits of $14.9 milliono Capital improvements of $13.2 milliono Transfers
16
Fiscal Year 19 BudgetRevenues
Total revenues of $38.5 million Less transfers of $4.5 million Net total revenues of $34 million
Taxes, $21,098,677
Charges, $9,447,500
Other, $3,508,565
17
Fiscal Year 19 BudgetTaxes
Total tax revenue - $21.1 million 62% of total revenue General Fund - $15.9 million; 75% of total tax revenues Capital Improvement Fund - $3.8 million Motor Fuel Tax Fund - $0.9 million
Total tax revenue up 11% compared to FY 18 Budget Local Food & Beverage tax - $700,000 Local MFT tax - $720,000 Sales and HR Sales taxes – up $261,000 Income tax – up $168,000
$17,500,000
$18,000,000
$18,500,000
$19,000,000
$19,500,000
$20,000,000
$20,500,000
$21,000,000
$21,500,000
FY 2017ACTUAL
FY 2018BUDGET
FY 2018PROJECTED
FY 2019BUDGET
Taxes
18
Fiscal Year 19 BudgetCharges for Services
Total Charges for Services - $9.5 million 28% of total revenue Water & Sewer Fund - $6.3 million; 66% of total Garbage Collection Fund - $2.5 million; 26% of total
Total Charges for Services revenue up 13% compared to FY 18 Budget Water rate revenue up $1.3 million
Rate increases October, 2017; May, 2018
$7,600,000
$7,800,000
$8,000,000
$8,200,000
$8,400,000
$8,600,000
$8,800,000
$9,000,000
$9,200,000
$9,400,000
$9,600,000
FY 2017ACTUAL
FY 2018BUDGET
FY 2018PROJECTED
FY 2019BUDGET
Charges for Services
19
Fiscal Year 19 BudgetOther
Total Other revenues - $3.5 million 10% of total revenue
$0
$500,000
$1,000,000
$1,500,000
$2,000,000
$2,500,000
$3,000,000
FY 2017ACTUAL
FY 2018BUDGET
FY 2018PROJECTED
FY 2019BUDGET
Licenses and Permits Grants/Intergovernmental Fines and ForfeituresFranchise Fees Donations/ Contributions Interest
20
FY 2019 Expenditures
Total expenditures - $47.2 million Less transfers - $4.5 million Net expenditures - $42.7 million
21
Fiscal Year 19 BudgetPersonnel Staffing
Shared Facility Manager Change in staff count – last 5
yrs. VH down .25 FTE PD up 2 FTE PW up 3.5 FTE
‐
20
40
60
80
100
120
140
FY 2015 FY 2016 FY 2017 FY 2018 FY 2019
Full Time Equivalents
Village Clerk Corporate Building & Zoning
Community Development Community Relations Economic Development
Finance Information Technology Police Department
Public Works Department
22
Personnel
Actual Actual Actual Budget BudgetFY 2015 FY 2016 FY 2017 FY 2018 FY 2019
Total Full-Time EmployeesVillage President/Trustees,Clerk's Dept. 2.50 2.50 2.50 2.50 2.50 Corporate 3.50 3.50 3.50 3.50 3.50 Building and Zoning 7.00 7.00 7.00 7.00 7.00 Community Development 6.00 6.00 5.00 4.00 4.00 Community Relations 2.00 2.00 2.00 2.00 2.00 Ecomomic Development 1.00 1.00 1.00 1.00 1.00 Finance 6.00 6.00 6.00 6.00 6.00 Information Technology - - 1.00 1.00 1.00 Police Department 59.00 59.00 60.00 60.00 60.00 Public Works Department 20.00 21.00 22.00 23.00 23.00
Total Full-Time Employees 107.00 108.00 110.00 110.00 110.00 Village President, Trustees, Clerk's Depart - Corporate 0.75 0.75 1.75 1.50 1.50 Building and Zoning 0.30 0.30 0.30 0.50 0.50 Community Development - - - - - Community Relations - - - 0.25 0.25 Ecomomic Development - - - - - Finance - - - - - Information Technology - 0.25 - Police Department 4.00 5.00 5.00 5.00 5.00 Public Works Department 1.00 1.00 1.00 1.50 1.50 Total Part-Time Employees 6.05 7.05 8.05 9.00 8.75 (Equates to Full-Time Equivalents) 6.05 8.05 8.05 9.00 8.75
Total Staff by FT Equivalents 113.05 116.05 118.05 119.00 118.75
Based on national average wage increase (SHRM, World at Work, Willis Towers Watson, etc.)
Maintain 1% Bonus pool
Compensation Study in advance of FY20 budget
25
INSURANCE AND BENEFITS
Preliminary health insurance renewals higher than we have seen in some time.
Projected PPO increase of 12% to 14%
Projected HMO increase of 4% to 6%
Projected dental decrease of 0%
Final numbers in spring
Anticipate good renewals for liability and workers comp (calendar year)
Compensation study will also review full benefit package (time off, insurance program structure, etc.)
26
BARGAINING UNITS
Two Union agreements and Sergeants agreement expire 4/30/2018
Goal of aligning benefits
Working conservatively with wages, but outcome unknown at this time
27
Fiscal Year 19 BudgetDebt
Total outstanding debt - $67.8 million Principal - $46.9 million Interest - $20.9 million 6 O/S bond issues – 5 refunding issuances General supported - $56.5 million (p&i)Water revenue supported - $11.2 (p&i) IEPA loan water supported - $607,000 Final maturity of December, 2037
Operating expenditures - $8.8 million Professional services - $2.5 mill for Garbage Collection Professional services - $965,000 in General Fund
Corporate, Community Relations, IT, Police - $100,000 to $190,000 Contractual services - $2.4 million in General Fund; $1.6 million in Water & Sewer
Fund General Fund- Public Works $1.3 million, IT $536,000, Police $389,000 Water & Sewer Fund – electricity & maintenance costs
29
FY 2019 GENERAL FUND DEPARTMENTS
FY19 DRAFT BUDGET.pdf
Corporate- pg. 127
Building & zoning- pg. 137
Community development- pg. 145
Economic development- pg. 150
Community relations- pg. 160
Finance- pg. 167
Information technology- pg. 174
Police- pg. 180
Public Works- pg. 191
30
Special Events
Village has accounted for each event as its own entity Track beginning balance, revenue, expenses, ending balance New methodology- combine all into one account
Events become self sustaining Goal to not include special events budget in operations
Community Relations Accounts:
Beginning Balance External Village Paid Expenses
Encumbered(Not Yet Paid) Ending Balance
Account Name: Cash Account #: 5/1/2017 2/23/2018Cultural Arts 9990000‐110149 1,088.43 2,000.00 (418.78) 2,669.65 Fine Arts 9990000‐110201 2,102.86 2,102.86 Movies in the Park 9990000‐110171 468.50 478.30 1,500.00 (1,951.79) 495.01 Holiday House Walk 9990000‐110161 4,410.03 4,410.03 Wine on the Fox 9990000‐110192 69,007.84 65,674.23 (53,108.40) (240.00) 81,333.67 Concerts in the Park 9990000‐110148 393.68 393.68 Christmas Walk 9990000‐110147 ‐ 17,180.00 18,500.00 (12,255.71) (3,750.50) 19,673.79 Beats & Eats 9990000‐110143 0.00 7,729.91 (7,729.91) ‐ Downtown Business Events 9990000‐110194 7,369.62 2,955.00 (10,324.62) ‐ Fireworks 9990000‐110158 12,743.67 ‐ 8,500.00 (16,133.69) 5,109.98 LunaFest 9990000‐110170 1,424.49 112.46 (984.10) 552.85 Misc Other Events 9990000‐110212 2,200.00 2,200.00
Goal: Create a financially sustainable special event program, with the aim of growing Village event offerings and other initiatives
The Village plans over two years to alter how it funds events, as follows: Special events will no longer be budgeted from the General Fund on a per-event cost basis
Funds will be moved to an event-only restricted fund, both costs and revenues will be located in this fund
Over time, all special events will be run out of this fund. In FY19, the Village will apply this to Wine on the Fox and Christmas Walk
Ideally, increased profits from events will smooth the transfer of other events, such as fireworks and the Village contribution to Beats and Eats
Village Staff will propose a reserve policy to ensure that the fund balance is protected against weather or other factors which could limit/prevent revenue
Potential excess over the reserve amount could be contributed to other initiatives, such as public art or downtown decorations, etc.
SPECIAL EVENTS PROGRAM
32
HOW’S IT LOOK AT FY END 2019
FUND
Projected Fund Balance May 1, 2018 Revenues Expenditures
Fund Balance April 30, 2019
% of Expenditures
General $7,539,371 $17,907,814 $17,868,481 $7,578,704 42%
Motor Fuel Tax $843,610 $855,758 $402,500 $1,296,868 316%
Village of Oswego Capital Improvement Program (CIP)
Fiscal Years 2019-2023 The Village adopted the CIP Plan for Fiscal Years 2019-2038 in April, 2018. The CIP is updated annually and discussed in conjunction with the Annual Village Budget. A summary of the first five years of the CIP are included within the Village Budget since the Fiscal Year 2019 capital projects have been included in the Budget. The goal of the CIP is to assist the Village Board and Staff in the long term financial planning of capital improvements. The Strategic Plan adopted by the Village in February, 2017 provides guidance and prioritizing capital improvements for the next three years. There are a number of high cost projects listed in the Strategic Plan which require staff to work on;
Infrastructure for roadways and water/sewer lines Defining an alternate water source and associated costs Construction of a new Police Headquarters Facility Bringing METRA (train service) to the Village Researching funding alternatives for widening Wolf’s Crossing Road
Background The population of Oswego increased from 13,000 residents in calendar year 2000 to over 33,000 residents in calendar year 2016. With the increased population came numerous new subdivisions, commercial development and a host of public infrastructure improvements. With the new development came miles of new roadways, curb and gutter, water mains, sewer mains, storm sewers, street lighting, traffic signals, wells and water towers, street signage and landscaping. The Village is responsible for the maintenance and future replacement of this entire new infrastructure. Long term planning discussions allow the Village to appropriately schedule and secure the funding needed to ensure the Village infrastructure is maintained at acceptable levels for the residents now and in the future. Capital Planning The Capital Planning process is a financial tool used to plan for future infrastructure replacement. By identifying the future costs and year of replacement for the respective project/infrastructure improvement, action can be taken to determine the sources of funding to use to pay for the capital item. Accumulating the money over time or using debt financing are a couple of possible funding options. The end product of this planning is formally known as a Capital Improvement Plan/Program (CIP).
Capital Improvement Plan (Program), or CIP, is a short-range plan, usually four to ten years, which identifies capital projects and equipment purchases, provides a planning schedule and funding options for the plan. Capital Improvement/Project- a capital improvement is a substantial, nonrecurring expenditure for a physical improvement with a useful life greater than one year. Repairs and maintenance expenditures are generally not considered as capital improvements unless the repair extends the useful life or productive capacity of the asset. Capital improvements/projects included in the CIP have a cost equal to or greater than $25,000. Vehicle replacements are included in the CIP for long term planning purposes.
DRAFT
2
39
The CIP has extended the time period to twenty years because the majority of the public infrastructure within the Village is around ten years old and will require replacement beyond ten years from today. A concern for the Village is the fact that a large amount of the infrastructure replacement will need to be done over the span of a few years bringing with it a large price tag. The CIP process attempts to alleviate this problem by identifying resources to pay for the replacements and scheduling the improvements out over a number of years. Overview Capital planning requires that infrastructure needs be examined on a regular basis so that repair and replacement schedules can be determined over a multi-year period. The Capital Plan provides the basis for planning large capital expenditures over a twenty year period. The key factor regulating the spending for these capital items will be the availability of funding. Some of the capital projects will be able to be decided upon annually as a part of the annual budget process but others will require the funding source to be determined to allow for the accumulation of funds over time before the capital project can be completed. All the listed projects in the CIP are reviewed to determine if they should remain in the listed year, moved out to a new year, costs are still accurate or the project is no longer viable. The CIP is presented using a broad overview to show the annual cost of needed projects and the available funding for the projects. The majority of the CIP has no funding at this time and needs to be determined as we move forward with identifying and prioritizing of the listed projects. Definitions Capital Improvement/Project- a capital improvement is a substantial, nonrecurring expenditure for a physical improvement with a useful life greater than one year. Repairs and maintenance expenditures are generally not considered as capital improvements unless the repair extends the useful life or productive capacity of the asset. Capital improvements/projects included in this CIP have a cost equal to or greater than $25,000.
1. Characteristics of a capital project: Essential public purpose Long useful life Infrequent and expensive Related to other government functions Village's general responsibility to provide/maintain or facilitate its occurrence
2. What qualifies for the CIP? Road maintenance (preservative and restorative sealers, crack filling, patching, resurfacing, overlays) and reconstruction New road construction and roadway extensions Purchase of land and/or buildings Additions to or renovations of buildings that exceed $25,000 Improvements to land other than buildings that exceed $25,000 Infrastructure additions/improvements, (i.e., water and sewer lines, storm sewers, parking lots, streetscape improvements, signalization, path/sidewalk extensions) Vehicle and equipment replacements
DRAFT
3
40
3. What costs are chargeable to a capital project? Construction costs (labor and material), Engineering fees (Phase I, II, III), Architect fees Legal fees associated with the project Acquisition of land or other property for the project, including brokerage fees Preparation of land for construction and landscaping during or after construction Easements related to the project Equipment and furnishings that are affixed to the project Initial inventory of movable furnishings and equipment Interest and other financing charges during construction
Category Descriptions Facilities- Facilities include three Village buildings and grounds related items. Buildings have long useful lives requiring costly repairs to maintain the buildings in good condition. Newly constructed facilities, major renovations or expansion of existing facilities are also capital items. Other- Items in this category are those that are of a community wide nature such as signage, costly non-registered/titled equipment, IT items, and items not specific to one of the other categories of the CIP. Vehicles/equipment- All titled or registered mobile equipment including vehicles, tractors, trucks, trailers, generators, etc. are listed within this category. Replacement is based on the estimated useful life of the vehicle/equipment, overall usage and condition of the item. Water & Sewer improvements-Water and sewer utilities are comprised of infrastructure related to the Village's water main and sanitary sewer collection systems. They include: water mains, fire hydrants, valves, services, wells, pressure adjusting stations, water towers, pumping stations, water treatment systems, sanitary sewer mains, laterals, manholes, lift stations, force mains and other components. Public Improvements (TIF)-This category is for all public improvements associated with the Tax Increment Financing district, including, but not limited to Water & Sewer improvements and roadway improvements. Roadway improvements- Roadways include all structures and appurtenances associated with the Village's roadway system including streets, sidewalks, paths, street lights, roadway drainage and storm water systems, pavement markings, signs, curb and gutter, bridges, culverts, traffic control signals and parkway landscaping. Capital Plan Funding Funding is one of the biggest concerns for all municipalities in developing a CIP. The list of capital improvements generally is never fully funded due to the expansive costs associated with the projects. The Village of Oswego currently has the following available revenue sources to fund capital improvements;
General Obligation Bonds General operating revenues Grants/donations Debt issuance & other borrowings Developer contributions Motor Fuel tax revenue Water & Sewer operating revenues Roadway capital improvement fees Expiring Sales tax sharing agreements
DRAFT
4
41
A single revenue source or a combination of revenue sources may be allocated for the completion of a specific project. The Village actively solicits financial assistance or engages in partnerships with other units of government to secure grant or other cost-sharing participation for completion of capital projects. The Village may decide to earmark specific revenue sources for capital improvements by implementing any of the options listed in this section.
Gasoline tax Property tax increase Local sales tax increase Tax increment financing (TIF) General Obligation Bonds
Special service area tax Sales taxes Utility tax increases Water & sewer utility surcharges Storm water fees
Currently, the Village has dedicated 60% of the local sales tax received for funding capital projects. State shared revenues are the major sources of revenue for the Village allowing capital improvements to be completed. Concerns of the Village are the external threats from legislative changes to reduce these existing revenues, such as State-shared revenue distribution formulas, which would have the potential to impact the long-term viability of the funding from General Fund operating revenues for the CIP. Capital improvements to our water distribution and sanitary sewage collection systems are normally funded entirely from user fees billed to customers. Billing rates are generally established to cover both the day-to-day costs of operating these systems as well as to fund capital improvements and infrastructure improvements to the systems. Fiscal Year 2019-2023 CIP The CIP has listed expenditures over the next five years in excess of $97 million. The Village Board and staff will be reviewing the listed capital projects to determine priorities, determine project timing, determining the need for the project and identifying funding sources. Projects may be deferred or even eliminated if no funding can be found to pay for the project. All of the listed Fiscal Year 2019 projects have been approved and included in the Fiscal Year 2019 Budget. Funding for the projects is provided from the General Fund, Motor Fuel Tax Fund, TIF Fund, Capital Improvement Fund and the Water & Sewer Capital Fund. The expenditures for all the capital improvements are accounted for in the Motor Fuel Tax Fund, TIF Fund, Capital Improvement Fund, the Water & Sewer Capital Fund or the Vehicle Fund. The following table shows the capital improvements listed by category and by year for Fiscal Year 2019-2023.
TOTAL $13,317,150 $7,321,320 $14,040,469 $29,054,062 $33,663,380
DRAFT
5
42
Facilities expenditures are 60% of the capital projects for Fiscal Year 2019. The new police headquarters facility accounts for $8 million of the total costs. The new facility is anticipated to be completed in October, 2018. The Village issued debt of $27 million in FY 2017 to provide the funding for the project. The local sales tax revenue will be used to pay the annual debt service on the debt issuances over the next 19 years.
Water & Sewer Improvements total $2.4 million with the meter replacement program getting underway at a cost in year one of $1.7 million. Downtown development public improvements are budgeted at $1.5 million in two blocks of the TIF District. Vehicles/equipment average an annual cost of $600,000 over the first five years of the CIP. The Village vehicle policy and grading system are used to determine the year of replacement for each vehicle and piece of equipment. Even though an item’s grading score warrants the item for replacement, many vehicles and equipment are not replaced until sometime after the scheduled replacement year. For Fiscal Year 2019, $440,500 is budgeted including $110,000 for new Mobile Data Terminals for the police department fleet, $27,000 for a Building & Zoning pickup truck replacement, $136,000 for police vehicles and a police smart trailer and $150,000 for a Public Works vehicle replacement. Fiscal Year 2024-2038 CIP Expenditures for Fiscal Years 2024-2038 of the Capital Improvement Plan are listed in the following tables. The majority of these expenditures are for the Water & Sewer improvements and Roadway improvements categories. All of these will be reevaluated as we get closer to the actual fiscal year to determine if the capital item is still a viable project and a benefit to the Village of Oswego and its residents. Funding is not shown for these fiscal years at this time as doing so might suggest the Village already has this funding on hand which is certainly not the case. Long term funding solutions need to be identified for how to pay for these listed capital improvements.
TOTAL $4,279,581 $16,640,700 $10,641,047 $2,170,000 $10,589,033 Included in the appendix are the detailed project pages for listed items contained in the CIP for the first five years. Each of these pages have a description of the project, justification for the project, costs by fiscal year of the project and a description of the operational impact of the project. Capital Projects beyond 20 Years The 20 Year Capital Improvement Plan schedule includes descriptions for six roadways which will require expansion based on future growth within the Village occurring outside the 20 year scope of this CIP. These roadways were identified in the Baxter & Woodman 2011 Transportation Plan completed at the request of the Village. These roadway expansions will be paid for by the new development as it occurs with some costs to be paid by the Village. The roadways have been listed in the 20 Year Plan schedule with the costs identified for the entire improvement for reference purposes and potential discussion. Recommendations Staff and the Village Board have discussed the capital items listed in the CIP at previous Village Board meetings. Staff will work with the Village Board to determine where funding can be found to complete the listed capital projects. Staff will pursue all sources of revenue available to the Village to reduce as much of the burden on residents as possible. Specific amounts of General Fund operating revenues and Water & Sewer Fund revenues may be authorized to be used for funding the CIP on an annual basis.
DRAFT
7
44
Captital Improvement 5-Yr Plan by FundFY
2019 FY
2020 FY
2021 FY 2022
FY 2023
Capital Improvement FundFacilitiesPolice Headquarters 8,000,000 - - - -
Facilities Total 8,000,000 - - - - OtherDowntown Holiday Lights - 10,000 10,000 10,000 10,000 ERP System 150,000 - - - - Network Switch (New PD Facility) 145,000 - - - - Planimetric Capture - - - - 125,000 Village Facility Surveillance Camera System 35,000 - - - - Computer Replacements 80,000 - - 200,000 - Server Refresh - - - 200,000 - Network Switches - - - - 200,000
Other Total 410,000 10,000 10,000 410,000 335,000 VehiclesSquad CAR MDT UpgradeMil 110,000 - - - 110,000
Vehicles Total 110,000 - - - 110,000 Roadway ImprovementsBridge Repair (3) - Barnaby, Old Post, & Pearce's Ford - - - - 18,000 Traffic Signal at Galena/S. Concord 150,000 - - - - US Route 34 Village Share of IDOT Rd Construction 71,000 - - - - Village's Share of IDOT Improvements - US 30 at Intersection with Treasure Road 21,000 - - - - Wolf's Crossing- Section 1 - Phase 2 & 3 150,000 954,000 324,000 12,874,000 - Wolf's Crossing- Section 2 - Phase 2 & 3 - - 383,000 198,000 5,171,000 Annual Road Program (CI) - - - 1,400,000 1,400,000
Roadway Improvements Total 392,000 954,000 707,000 14,472,000 6,589,000 Capital Improvement Fund Total 8,912,000 964,000 717,000 14,882,000 7,034,000
Motor Fuel Tax Roadway ImprovementsAnnual Road Program (MFT) 75,000 200,000 600,000 600,000 600,000
Roadway Improvements Total 75,000 200,000 600,000 600,000 600,000 Motor Fuel Tax Total 75,000 200,000 600,000 600,000 600,000
Public Improvements Total 1,583,300 2,383,000 1,360,000 225,000 638,000 Tax Increment Financing Fund Total 1,583,300 2,383,000 1,360,000 225,000 638,000
Vehicles Total 330,500 670,970 655,569 452,862 703,780
DRAFT
8
45
Captital Improvement 5-Yr Plan by FundFY
2019 FY
2020 FY
2021 FY 2022
FY 2023
Vehicle Fund Total 330,500 670,970 655,569 452,862 703,780
Water & Sewer Capital FundPublic WorksBooster Station #2 Repairs 130,000 - - - - Engineering for Sanitary Lift Station Generators 75,000 - - - - Generators Wells 3 & 4 - - 450,000 - - New Main - Minkler Road Watermain - - - - 375,000 New Main - Wolf Road Watermain - 695,000 5,096,500 - - Transmission Lines from Plant to Towers - - 2,000,000 9,000,000 9,000,000 Water Meter & Reader Replacement 1,725,750 1,256,750 1,256,750 1,246,750 - Water Tower - Fox Chase - - - 750,000 - Water Tower - Hunt Club - 1,000,000 - - - Water Tower - Village Center - - - - 625,000 Water Towers - Cleaning - - - - 45,000 Water Treatment Facility - New 5 MGD - - 1,767,450 1,767,450 14,512,600 Water Treatment Facility - Preliminary Engineering & Land Acquisition 405,600 21,600 7,200 - - Sanitary Sewer Lining Program 80,000 80,000 80,000 80,000 80,000 Lead Service Line Replacement Program - 50,000 50,000 50,000 50,000
Public Works Total 2,416,350 3,103,350 10,707,900 12,894,200 24,687,600 Water & Sewer Capital Fund Total 2,416,350 3,103,350 10,707,900 12,894,200 24,687,600 Grand Total 13,317,150 7,321,320 14,040,469 29,054,062 33,663,380
DRAFT
9
46
Village of Oswego20-Year Capital Improvement PlanFY 2019-2038
Project Name CategoryLead Dept. Brief description
Fiscal Year 2024
Fiscal Year 2025
Fiscal Year 2026
Fiscal Year 2027
Fiscal Year 2028
Fiscal Year 2029
Fiscal Year 2030
Fiscal Year 2031
Fiscal Year 2032
Fiscal Year 2033
Fiscal Year 2034
Fiscal Year 2035
Fiscal Year 2036
Fiscal Year 2037
Fiscal Year 2038
FACILITIES1 Ampitheater FACILITIES PW Construct an ampitheater at police station 40,000 460,000
2 Metra Station FACILITIES PWNew Metra train station at Park & Ride facility ; 80/20 split between Metra and Village; $3 million total cost 200,000 800,000
3 Park-n-Ride Lot - Resurface FACILITIES PW Resurface existing Park & Ride facility parking lot 204,7004 Police Facility/land site FACILITIES Pol Construct a new police station facility5 Public Works Facility - Temporary Storage FACILITIES PW Construct a temporary storage shed for vehicles 250,0006 Public Works Facility - Expansion FACILITIES PW Construct additional building for Vehicle/equip. storage 426,000 4,728,000 946,0007 Public Works Facility - Parking Lot Resurface FACILITIES PW Resurface existing Public Works Facility parking lot 250,0008 Public Works Facility - Roof Replacement FACILITIES PW roof replacement 500,0009 Public Works Facility Parking Lot Repairs FACILITIES PW Partial repair of PW Facility Parting Lot 58,000
10 Public Works Facility - Fenced Area Expansion FACILITIES PW 75,00011 Public Works Salt Dome FACILITIES PW Construct a new salt dome 215,00012 Tap House Lot - Resurface FACILITIES PW Resurface parking lot at existing Tap House 94,00013 Village Hall - Buildout FACILITIES B&Z Complete build out of unfinished floors 50,000 500,000 450,000 500,00014 Village Hall - Roof Replacement FACILITIES PW Roof Replacement 750,00015 Village Hall- Parking Lot Resurface FACILITIES PW Resurface existing Village Hall parking lot 208,00016 TOTAL: FACILITIES 473,000 1,688,000 6,882,700 1,146,000 800,000 0 500,000 0 0 0 215,000 0 0 0 01718 OTHER19 Downtown Holiday Lights OTHER PW Holiday lights for Main Street & Washington Street 10,000 10,00020 ERP System OTHER Fin New financial/work mgmt./adjudication software
21 Planimetric Capture OTHER ITPlanimetric Mapping and Aerial Imagery (Initial Map in FY18, update every 3 years) 50,000 50,000 50,000 50,000 50,000
22 Computer Replacements (every 4 years) OTHER IT Purchase Computer Replacement (All Facilities) 200,000 200,000 200,000 200,000
23 Server Refresh (every 4 years) OTHER IT Server Refresh 200,000 200,000 200,000 200,000
24 Network Switches (every 5 years) OTHER IT Network Switches. Access Points & Firewalls 200,000 200,000 200,000
25 Network Switch (New PD Facility) OTHER IT Network Switches. Access Points & Firewalls
26 Village Facility Surveillance Camera System OTHER ITPurchase Surveillance equipment for Village Hall and Public Works Facility
27 TOTAL: OTHER 10,000 60,000 400,000 0 250,000 0 400,000 50,000 0 200,000 450,000 0 0 50,000 600,0002829 VEHICLES/EQUIPMENT30 Fuel Tanks - Public Works EQUIPMENT PW Replace fuel tanks, pumps, and monitoring system 30,00031 Leaf Machine EQUIPMENT PW New Leaf VAC Machine 186,00032 Replacement Vehicles - B&Z VEHICLES CD Building & Zoning Vehicles/Vehicle Replacements 51,198 30,475 30,475 30,475
33 Replacement Vehicles - CD VEHICLES CD Community Development Vehicle Replacement 37,935 37,93534 Replacement Vehicles - Police VEHICLES Pol Police Vehicles/Equipment Replacements 439,850 354,100 447,730 304,880 234,375 410,150 336,400 441,500 452,535 571,812 203,031 474,800 663,047 7,033,59235 Replacement Vehicles - Public Works VEHICLES PW Public Works Vehicle Replacements36 Replacement Vehicles/Equipment - Public Works VEHICLES PW Public Works Vehicle/Equipment Replacements 0 171,213 44,493 746,50637 Sewer Vacuum/Excavator Truck VEHICLES PW New Vactor Truck 600,00038 Smart Trailer EQUIPMENT Pol Purchase one new speed trailer 28,500 34,600
39 Squad CAR MDT UpgradeMil EQUIPMENT IT Update all Mobile Digital Compters40 Tire Mounter & Wheel Balancer EQUIPMENT PW Purchase a tire mounter and wheel balancer41 Wood Chipper EQUIPMENT PW Wood chipper to replace existing 2002 chipper 85,00042 Replacement - Backhoe/Loader EQUIPMENT PW Replacement backhoe/loader 117,00043 Trailer Mounted Diesel Generator EQUIPMENT PW Replacement trailer mounted generator 80,00044 TOTAL: VEHICLE/EQUIPMENT 469,850 711,313 1,143,421 401,790 319,375 410,150 366,875 471,975 452,535 606,412 203,031 474,800 663,047 0 7,818,0334546 WATER & SEWER IMPROVEMENTS47 Generators Wells 3 & 4 W&S PW Initial installation of generators at Wells 3 & 4
48 Engineering for Sanitary Lift Station Generators W&S PWEngineering to determine the size and design of lift station generators
49 Booster Station #2 Repairs W&S PW50 New Main - Minkler Road Watermain W&S PW New water main along Hunt Club Road 1,950,00051 New Main - Wolf Road Watermain W&S PW New 12" watermain along Wolf Road
52 New Well & Tower W&S PW
New Elevated Tower at Grove Rd and Reservation Rd dependent on future development. To be paid by development and tap on fees; $6.5 million estimated cost 594,000 4,356,000
53 Orchard Rd Loop & Booster Station W&S PWWatermain & Booster Station (To be paid from Development/Tap on Reserves)
54 Roof Replacement - Wells 03 and 06 W&S PW Roof Replacement 65,00055 Roof Replacement - Wells 04, 09, 10, and 11 W&S PW Roof Replacement 142,00056 Roof Replacement - Wells 07 and 08 W&S PW Roof Replacement 61,00057 Sanitary Sewer Lining W&S PW Annual Sewer Lining Program 100,000 100,000 100,000 100,000 100,000 100,000 100,000 100,000 100,000 100,000 100,000 100,000 100,000 120,000 120,00058 Water Meter & Reader Replacement W&S PW Replace 12,000 water meters and readers58 Lead Service Line Replacement W&S PW Replace 5 service lines/year for 10 years 50,000 50,000 50,000 50,000 50,000 50,00059 Water Tower - Fox Chase W&S PW Repair and repaint water tower60 Water Tower - Hunt Club W&S PW Repair and repaint water tower
2/22/2018 3:26 PM
DRAFT
1047
Village of Oswego20-Year Capital Improvement PlanFY 2019-2038
Project Name CategoryLead Dept. Brief description
Fiscal Year 2024
Fiscal Year 2025
Fiscal Year 2026
Fiscal Year 2027
Fiscal Year 2028
Fiscal Year 2029
Fiscal Year 2030
Fiscal Year 2031
Fiscal Year 2032
Fiscal Year 2033
Fiscal Year 2034
Fiscal Year 2035
Fiscal Year 2036
Fiscal Year 2037
Fiscal Year 2038
61 Water Tower - Ogden Falls W&S PW Repair and repaint water tower 830,00062 Water Tower - Orchard Road W&S PW Repair and repaint water tower 825,00063 Water Tower - Village Center W&S PW Repair and repaint water tower64 Water Towers - Cleaning W&S PW Wash all water towers 47,000 49,000 51,000
65 Water Treatment Facility - New 5 MGD W&S PWConstruction of a 5 MGD Water Treatment Facility at the Fox River 10,584,900
66 Transmission Lines from Plant to Towers W&S PWContstruct transmission lines from new water source to existing water towers
Governance review, land acquisition, and Fox River water quality testing for a future water treatment facility.
70 TOTAL: WATER & SEWER IMPROVEMENTS 12,684,900 1,040,000 744,000 4,506,000 197,000 353,000 930,000 100,000 100,000 1,130,550 1,411,550 14,165,900 7,978,000 120,000 171,0007172 VILLAGE TOWN CENTER RENOVATION
73 Village Town Center Infrastructure Roadways VTC PWin 2004. This project includes replacement of water/sewer lines and improving the roadways. 40,000 980,000 8,450,000 7,700,000 11,300,000
74 Village Town Center Infrastructure Water/Sewer VTC PW Install all new water/sewer/storm infrastructure 60,000 301,80075 TOTAL: TOWN CENTER RENOVATION 0 0 100,000 1,281,800 8,450,000 7,700,000 11,300,000 0 0 0 0 0 0 0 07677 TIF DISTRICT
93 Bridge Repair (3) - Barnaby, Old Post, & Pearce's Ford RI PW Bridge repairs - Barnaby, Old Post, & Pearce's Ford 109,00094 Bridge Repair-Pfund Court RI PW Bridge repair on Pfund 94,000 518,000
95 Bridge-Minkler Rd (Replacement) RI PW Reconfigure and reconstruct the Minkler Rd bridge 190,000 298,000 454,400
96 Kendall Point Dr and bridge improvement RI PW
Engineering & Construction of Kendall Point Dr and bridge. Developer driven project or SSA to provide funding. 34,800 465,100
100 Waubonsee Creek Repairs RI PW Repair basin embankment washed out by storm 10,000 40,000
101 Lincoln Station Drainage System Improvements RI PWInstall basin to collect water runoff from adjacent property and divert water into existing storm sewer 60,000
102 Old Reserve Drainage Improvements RI PW Roadside ditch maintennace 580,000
103Stormwater System Improvements - SEPARATED INTO SEPARATE PROJECTS RI PW Repair drainage issues throughout the Village
Village of Oswego20-Year Capital Improvement PlanFY 2019-2038
Project Name CategoryLead Dept. Brief description
Fiscal Year 2024
Fiscal Year 2025
Fiscal Year 2026
Fiscal Year 2027
Fiscal Year 2028
Fiscal Year 2029
Fiscal Year 2030
Fiscal Year 2031
Fiscal Year 2032
Fiscal Year 2033
Fiscal Year 2034
Fiscal Year 2035
Fiscal Year 2036
Fiscal Year 2037
Fiscal Year 2038
116 TRAFFIC ENHANCEMENT PROJECTS
117 Traffic Signal at Galena/S. Concord RI PW Install traffic signal intersection of Galena & S. Concord
118 Traffic Calming - Washington Street RI PWInstall traffic calming measures on Washington Street from Harrison to Madison 75,000 200,000 1,337,500 1,337,500
119 Traffic Signal at Washington/Harrison RI PW Install traffic signal at this intersection 30,000 300,000
123 Goodwin Drive Extension RI PWEngineering & Construction of Goodwin Dr Extension. Developer driven project or SSA to provide funding. 76,100 1,017,900
124 Road Access & Paved Area for Metra Station RI PWRoad access and a paved area for a future Metra station site along Orchard Road 175,700 137,000
125 US 30 Streetscape RIInstall trees and vegetation in right-of-way of US 30 corridor 1,500,000
126 US Route 34 Village Share of IDOT Rd Construction RI PWVillage's Share of IDOT Road Reconstruction on Rt 34 from IL 47 to Orchard Rd
127Village's Share of IDOT Improvements - US 30 at Intersection with Treasure Road RI PW
Village's Share of IDOT Intersection Improvements at US 30 & Treasure Road - New Traffic Signal
128 Weisbrook Drive connection improvement RI PWEngineering & Construction of Weisbrook Dr. Developer driven project or SSA to provide funding.
129 Wolf's Crossing- Section 1 - Phase 2 & 3 RI PWReconstruction of Wolfs Crossing Road to a five lane cross section from Harvey to Eola; STP Funding
130 Wolf's Crossing- Section 2 - Phase 2 & 3 RI PWReconstruction of Wolfs Crossing Road to a five lane cross section from Roth to Harvey; STP Funding
131 Wolf's Crossing- Section 3 - Phase 2 & 3 RI PWReconstruction of Wolfs Crossing Road to a five lane cross section from Fifth to Roth; STP Funding 358,000 178,000 4,828,000
132 Wolf's Crossing- Section 4 - Phase 2 & 3 RI PWReconstruction of Wolfs Crossing Road to a five lane cross section from Douglas to Fifth; STP Funding 822,000 448,000 11,122,000
133 Wolf's Crossing- Section 5 - Phase 2 & 3 RI PWReconstruction of Wolfs Crossing Road to a five lane cross section from US 34 to Douglas; STP Funding 753,000 417,000 10,168,000
134
135
2011 Transportation Plan - the following roadways are the arterial roads which would be expanded at some time in the future.
This plan was developed to show the major arterial roadways which would be improved when development and growth required the expansions. The costs of these improvements may be borne by developers.
136 Collins Rd-estimated costs $65.1 million RI PWReconstruction of Collins Road to a four lane cross section from IL Route 71 to US Route 30
137 Fifth Street-estimated costs $23.9 million RI PWReconstruction of Fifth Street to a three lane cross section from Plainfield Road to Farmington Lakes Road.
138 Grove Rd-estimated costs $31.9 million RI PWReconstruction of Grove Road to a three lane cross section from Wheeler Road to Plainfield Road.
139 Rance Road- estimated costs $26.2 million RI PWReconstruction of Rance Road to a three lane cross section from Southbury Boulevard to US Route 30.
140 Reservation Rd- estimated costs $19 million RI PWReconstruction of Reservation Road to a three lane cross section from Minkler Road to Schlapp/Douglas Road.
141 Roth Rd- estimated costs $16.6 million RI PWReconstruction of Roth Road to a three lane cross section from Collins Road to Ogden Falls Boulevard.
142 Schlapp Rd- estimated costs $41.6 million RI PW
Reconstruction of Schlapp Road/Douglas Road Roth Road to a three lane cross section from Wheeler Road to Wolfs Crossing Road.
143 Stewart Rd- estimated costs $30.1 million RI PW
Reconstruction of Stewart Road/Wikaduke Trail to a four lane cross section from Collins Road to Wolfs Crossing Road
185186 TOTAL CAPITAL IMPROVEMENTS 16,448,850 7,257,713 17,305,221 13,089,490 14,627,875 23,592,650 16,401,875 3,038,975 12,720,535 3,936,962 4,279,581 16,640,700 10,641,047 2,170,000 10,589,033
2/22/2018 3:26 PM
DRAFT
1249
VEHICLE/EQUIPMENT SCHEDULES The following pages are a listing of the Village’s vehicles and large equipment. The Village Vehicle Replacement Policy is used to determine when a vehicle or large piece of equipment is eligible for replacement. The vehicles intended on being replaced are highlighted in the listing. The vehicle grading sheets for vehicles/equipment which have a score qualifying them for replacement are included.
DRAFT
13
50
Village of Oswego
Fleet Replacement Policy
It is the policy of the Village of Oswego to provide staff with the equipment needed to perform their jobs in a professional, competent and safe manner. Some of the largest purchases involve vehicles and other motorized equipment. These items are a very substantial financial investment and are a large portion of each fiscal year’s capital outlay, therefore the purchase, useful life and disposal of these must be handled in an economic manner. The village must do the best to maximize the return on the investment of these purchases while still providing safe and efficient equipment to the employees.
The selection of an appropriate vehicle type is an essential part of the cost effective fleet management system. It is the objective of each department’s fleet manager to supply the appropriate vehicles that are suited to performing the work assigned to that department and its specialties. Past performance of a certain type of vehicle will be reviewed during the planning for any replacements. Fleet managers will ensure that appropriate manufacturer ratings, including load carrying capacity and trailer pulling capacity, will be followed when selecting vehicles for acquisition.
Vehicles are normally purchased based on performance, price, fuel economy and fleet purchasing. Whenever possible fleet managers should utilize vehicles available through the Illinois State Contracts or Municipal Conference Contracts, these will generally offer the lowest purchase costs for the vehicles or equipment. Suitability and appropriateness for the specified job will be balanced with cost, maintenance factors, compatibility with the rest of the fleet and any technical specifications for that particular vehicle or piece of equipment.
The 100,000 mile mark has been identified by the American Public Works Association (APWA), The University of Tennessee, as well as many other industry groups as the tipping point between repair and replacement. This mileage mark pertains to all sedans and light duty trucks rated at one ton or less, for the Village of Oswego this would apply to all vehicles in the Police Department fleet, Building and Zoning fleet, Administration fleet and most vehicles in the Public Works fleet. The large heavy duty trucks and off road equipment in the Public Works fleet would be rated based on hour meter readings. After 100,000 miles the cost to operate a vehicle generally increases considerably, the cost of an engine or transmission repair or replacement can exceed the value of the vehicle at this point. Although an engine or transmission repair/replacement could be required earlier it is more likely after the 100,000 mile mark. Additionally the internal wear and tear on vehicles at this point will often have torn/worn seats and carpeting, damaged or worn steering wheels and door/instrument panels with significant wear. Also undercarriage corrosion (especially in vehicles used in snow plowing operations) and wear on steering components becomes more evident and problematic.
It is important to note that a vehicle approaching its recommended maximum age or mileage is an indicator of its eligibility for replacement. The fleet manager must exercise discretion and assess each vehicle based on its condition. A vehicle that is approaching its maximum life or mileage according to the policy might be kept longer due to a superior condition or low maintenance cost. Conversely a vehicle that is not yet at its maximum recommended life or
DRAFT
14
51
mileage may be a candidate for replacement due to poor condition or abnormally high maintenance costs.
Vehicle Replacement Program
The Fleet Manager of each Department in the Village of Oswego will annually evaluate the vehicles assigned to that department for potential replacement. This evaluation will normally be conducted in conjunction with the annual budget preparation to determine the proper number of vehicles and associated costs for equipment to request in each fiscal year budget. Fleet Managers will use the Village of Oswego Vehicle Replacement Guideline Evaluation Form when conducting these evaluations and will apply the appropriate scoring numbers based on the descriptions.
All vehicles will be evaluated on the assigned form. Heavy duty trucks (those rated greater than 1 ton), construction type equipment and off road equipment will be evaluated using the hour meter reading and not the odometer (if equipped with one) for those vehicles and equipment. When evaluating all vehicles for the Maintenance and Repair category a cumulative total of all maintenance and repair costs during the lifetime of the vehicle will be used, any costs associated with accident/crash repairs should not be included.
All vehicles will be graded on the evaluation sheets for the individual vehicle conditions and final scores on that form will be used to budget replacements. As we know some vehicles may see lighter use than others in the same fleet for various reasons and may last longer. Therefore it is required to evaluate each vehicle and consider all the factors on the evaluation form. Requests for replacements will be based off the individual evaluation forms however a general guideline for replacements is listed below. Vehicles that score in the Condition III or Condition IV should be candidates for replacement unless the Fleet Manager provides additional information to delay that replacement. Priority for replacement will be assigned to the Condition IV vehicles as those are the worst condition vehicles in the fleet. We will apply the following factors to determine replacement justification:
1. Replacement Year
2. Scoring Point System
3. Fleet Managers Input
Guidelines for Vehicle Replacement:
Police Patrol Cars (hot seat) 3 – 5 years 100,000 miles
Light Duty Pickups 5 – 9 years 100,000 miles
Administration Vehicles 7 – 10 years 100,000 miles
Heavy Duty Trucks 12 years 4,500 hours
Off Road Equipment 12 years 4,000 hours
Back Hoe/Loader 12 years 6,000 hours
DRAFT
15
52
Street Sweeper 10 years 4,000 hours
Sewer Jetter 10 years 4,000 hours
Trailers Evaluate by condition (generally 15 + years)
Miscellaneous Equipment Evaluate by condition (i.e. air compressors, welders, etc.)
Replacement Point Range:
Under 18 points Condition I Excellent
18 – 22 points Condition II Good
23 – 27 points Condition III Qualifies for replacement
28 + points Condition IV High priority for replacement
DRAFT
16
53
Oswego Veh #
Vehicle Year Make Model
Fiscal Year Obtained Useful Life
Vehicle Policy Score as of April
2017Estimated Replacement
Year based on score Replacement Cost BUILDING & ZONING
24 2015 Ford F150 2015 10 6 2025 $33,26325 2015 Ford F150 2015 10 5 2025 $34,01531 2016 Ford F150 2016 10 3 2026 $35,00029 2005 Chevrolet Silverado 2005 10 22 2019 $27,04030 2006 Chevrolet Silverado 2006 10 23 2020 $28,809
BUILDING & ZONING TOTAL $158,127COMMUNITY DEVELOPMENT
2014 Ford F250 2015 10 7 2023 $35,046COMMUNITY DEVELOPMENT TOTAL $35,046
To Be Replaced in 2019
DRAFT
1754
Oswego Veh #
Vehicle Year Make Model
Fiscal Year Obtained Useful Life
Vehicle Policy Score as of April
2017Estimated Replacement
Year based on score Replacement Cost PUBLIC WORKSPW Vehicles
930 2016 Caterpillar Wheel Loader 930M 2017 12 2029 255,563 Total Public Works Equipment 1,451,976 To Be Replaced in 2019 PUBLIC WORKS TOTAL 3,857,831.05
DRAFT
1956
Oswego Veh #
Vehicle Year Make Model
Fiscal Year Obtained Useful Life
Vehicle Policy Score as of April
2017Estimated Replacement
Year based on score Replacement Cost POLICE
18 1990 Ford E-350 - Evidence Tech Van 2011 10 42101 2006 Ford F-150 CPAAA 2006 10 31 2019 31,920 11 2008 Chevrolet Malibu Hybrid 2008 10 27 2019 17,300 22 2010 Ford Escape - Hybrid 2009 3 24 2019 42,000 36 2010 John Deere Gator 2011 15 13 2026 16,083 1 2011 Ford Expedition 2011 5 23 2020 52,125 26 2011 Ford F-150 Truck 2011 6 22 2017-2020 31,920 3 2012 Ford Escape 2011 4 19 2021 47,235 4 2012 Ford Explorer 2012 3 19 2021 40,010 28 2012 Ford Escape 4X4 2014 8 17 2023 22,000 13 2013 Ford Taurus 2012 3 28 2020 45,635 15 2013 Chevrolet Impala 2014 10 18 2023 17,920 23 2013 Ford F-150 2013 7 15 2023 31,920 6 2014 Ford Taurus 2014 3 16 2021 45,635 7 2014 Ford Utility 2013 3 17 2020 44,071 9 2014 Ford Taurus 2014 3 21 2019 45,635
12 2014 Ford Taurus 2013 3 20 2019 45,635 24 2014 Ford Focus 2014 10 13 2024 22,800 30 2014 Chevrolet Equinox 2014 10 16 2023 20,000 33 2014 Ford Taurus 2013 3 17 2021 45,635 34 2014 Ford Taurus 2014 3 16 2021 45,635 2 2015 Ford Sedan Interceptor 2015 3 11 2020 49,865 5 2015 Ford Explorer 2014 3 11 2021 46,635
17 2015 Ford Taurus 2014 3 16 2020 45,635 27 2015 Ford Taurus 2014 3 16 2020 45,635 8 2016 Ford Sedan Interceptor 2016 3 8 2022 43,550
14 2016 Ford Utility Interceptor 2015 3 14 2019 50,960 16 2016 Ford Utility Interceptor 2015 3 11 2027 50,960 10 2017 Ford Utility Interceptor 2017 10 2 2020 19,500 19 2017 Ford Utility Interceptor 2016 3 9 2020 45,929 20 2017 Ford Utility Interceptor 2016 3 9 2020 45,661 32 2017 Ford Utility Inceptor - DEA 2017 10 3 2026 29,770 29 Total Vehicles in Fleet (Not Including: CPAAA - Sq 101, Gator - Sq 36 & CSI - Sq 18) POLICE TOTAL: 1,185,214
To Be Replaced in 2019VILLAGE-WIDE TOTAL 5,236,218
DRAFT
2057
DRAFT21
58
Vehicle # Year
Make Model
Miles Hours
Original $ in (date)
Under 18 points Condition I
Life Expectancy 18 - 22 points Condition II
Type of Service 23 - 27 points Condition III
Division 28+ points Condition IV
FACTOR POINTSVEHICLE
SCORE
AGE 1 141112345123
4
51234512
3
4
5
TOTAL 29
Imperfections in body & paint, paint fading & dents, interior fair (no rips, tears, burns), and a good drive trainNoticeable imperfections in body and paint surface, some minor rust, minor damage from add-on equipment, worn interior (one or more rips, tears, burns), and a weak or noisy drive trainPrevious accident damage, poor paint and body condition, rust (holes), bad interior (tears, rips, cracked dash), major damage from add-on equipment, and one drive train component bad
In shop more than twice within a one month time period, no major breakdown or road callIn shop more than once within one month time period, two or more breakdowns/road calls within the same time periodIn shop more than twice monthly, two or more breakdowns within one month time periodMaintenance costs (cumulative total) are ≤ 10% of purchase costMaintenance costs (cumulative total) are ≤ 25% of purchase costMaintenance costs (cumulative total) are ≤ 45% of purchase cost
Public Works
5-Yard Dump/Plowing/Anti-Ice
12
Replacement Point Range:
High priority replacement
Qualifies for replacement
Good
Excellent
VILLAGE OF OSWEGO
Evaluation FormVehicle Replacement Guideline
11
11/05/2003
Acterra
2004
3,000
78,370.00
Sale /Auction / Estimated Trade-in $
Budgeted Replacement $
RELIABILITY (PM work is not
included)
MAINTENANCE AND REPAIR
COSTS (Accident Repairs not included)
CONDITION
32,324
Sterling
Vehicles that pull trailers, haul heavy loads, has continued off-road usage, and police administrationAny vehicle involved in snow removalPolice emergency response vehiclesIn shop one time within a three month time period, no major breakdowns or road callsIn shop one time within a three month time period, 1 breakdown or road call within a three month period
Previous accident damage, poor paint, bad interior, drive train that is damaged or inoperative, major damage from add-on equipment
DESCRIPTION
Maintenance costs (cumulative total) are ≤ 60% of purchase costMaintenance costs (cumulative total) are ≥ 61% of purchase costGood drive train and minor body imperfections (road chips, scratches)
Each year of chronological ageEach 10,000 miles of usageEach 700 hours of usage (priority over miles on heavy duty and off-road equipment)Standard sedans and light pickups
MILES / HOURS
TYPE OF SERVICEStandard vehicles with the occasional off-road usage
4
3
2
2
4
DRAFT
2259
DRAFT
2360
DRAFT
2461
DRAFT
2562
WATER AND SEWER INFRASTRUCTURE The water system includes eight wells, six water towers, the radium removal systems, 863,123 feet (163 miles) of water main, 2,559 fire hydrants and several thousand feet of water service lines. The sewer system consists of 632,511 feet (120 miles) of sanitary sewer lines 15” and smaller and six lift stations. The system has 11,200 water meters installed providing the basis for billing customers which generates the revenues to support the capital improvements. The following pages are a listing of the Village’s Water and Sewer lines. They are listed in order of age by size and subdivision.
DRAFT
26
63
Village of OswegoWater & Sewer Line Schedule as of 4/30/17 Inflation %: 0.02
Description Aquired Date
(YYYYMMDD) Aquired
Year Cost Basis
Replacement Year (Based on Useful
Life-70 yrs) Replacement Cost
SEWER LINES - 8'' - OLD TOWN - 29340' 19350101 1935 22,595.83 2017 114,615.24 WATER LINES - 4'' - OLD TOWN - 39588' 19350101 1935 47,192.81 2017 239,381.13 WATER LINES - 6'' - CEDAR GLEN - 12852' 19600101 1960 61,308.57 2030 245,207.20 SEWER LINES - 8'' - BROOKSIDE- 6168' 19620101 1962 17,306.59 2032 69,218.71 WATER LINES - 6'' - BROOKSIDE- 6906' 19620101 1962 34,055.35 2032 136,206.36 SEWER LINES - 8'' - KINGSBROOK - 6242' 19530101 1953 16,942.70 2035 85,940.27 WATER LINES - 8'' - KINGSBROOK - 5100' 19530101 1953 31,350.52 2035 159,022.59 SEWER LINES - 8'' - OLD WINDCREST (UNITS 1 & 2) - 2144' 19660101 1966 6,692.76 2036 26,768.08 WATER LINES - 6'' - OLD WINDCREST (UNITS 1 & 2) - 5329' 19660101 1966 29,235.99 2036 116,931.04 SEWER LINES - 8'' - BOULDER HILL - 11565' 19740101 1974 64,216.86 2044 256,839.07 WATER LINES - 6'' - BOULDER HILL - 10200' 19740101 1974 99,539.45 2044 398,113.83 SEWER LINES - 8'' - NEW WINDCREST (UNIT 3) - 2766' 19860101 1986 30,480.79 2056 121,909.69 WATER LINES - 12'' - DOUGLAS ROAD - 9390' 19860101 1986 397,484.19 2056 1,589,761.16 WATER LINES - 12'' - RT. 30 -4380' 19860101 1986 185,407.96 2056 741,549.93 WATER LINES - 12'' - RT. 34 -19020' 19860101 1986 805,127.73 2056 3,220,155.23 WATER LINES - 6'' - NEW WINDCREST (UNIT 3) - 2779' 19860101 1986 53,821.31 2056 215,261.46 SEWER LINES - 8'' - HERRONS RUN - 2141' 19870101 1987 23,897.54 2057 95,579.60 SEWER LINES - 8'' - NEW WINDCREST (UNIT 4) - 2980' 19870101 1987 33,262.33 2057 133,034.63 WATER LINES - 6'' - STONEGATEESTATES - 1500' 19870101 1987 29,425.19 2057 117,687.76 WATER LINES - 8'' - HERRONS RUN - 3048' 19870101 1987 93,711.48 2057 374,804.52 WATER LINES - 8'' - NEW WINDCREST (UNIT 4) - 3382' 19870101 1987 103,980.38 2057 415,875.58 SEWER LINES - 6'' - WEST END - 2180' 19880101 1988 25,731.93 2058 102,916.35 SEWER LINES - 8'' - KENDALL POINT BUSINESS - 8190' 19880101 1988 327,063.26 2058 1,308,108.55 SEWER LINES - 8'' - NEW WINDCREST (UNIT 5) - 2142' 19880101 1988 25,283.39 2058 101,122.39 WATER LINES - 12'' - KENDALL POINT BUSINESS - 5250' 19880101 1988 238,042.98 2058 952,066.76 WATER LINES - 6'' - NEW WINDCREST (UNIT 5) - 2504' 19880101 1988 51,944.77 2058 207,756.13 WATER LINES - 6'' - WEST END - 2270' 19880101 1988 47,090.51 2058 188,341.24 SEWER LINES - 10'' - STONEHILL INDUSTRIAL PARK - 12006' 19890101 1989 322,030.38 2059 1,287,979.25 WATER LINES - 8'' - STONEHILLINDUSTRIAL PARK - 11408' 19890101 1989 383,008.58 2059 1,531,865.12 SEWER LINES - 6'' - NEW WINDCREST CONDOS (UNIT 8) - 375' 19900101 1990 4,636.87 2060 18,545.43 SEWER LINES - 8'' - NEW WINDCREST (UNITS 6 & 7) - 7235' 19900101 1990 89,460.65 2060 357,803.08 WATER LINES - 8'' - NEW WINDCREST (UNITS 6 & 7) - 5502' 19900101 1990 187,393.90 2060 749,492.81 SEWER LINES - 10'' - MILL RACE - THE PONDS - 19212' 19910101 1991 530,001.06 2061 2,119,770.10 WATER LINES - 8'' - MILL RACE- THE PONDS - 15083' 19910101 1991 520,825.67 2061 2,083,072.59 SEWER LINES - 10'' - LAKEVIEWESTATES EAST - 9050' 19920101 1992 122,881.06 2062 491,469.95 SEWER LINES - 8'' - FOX CHASE(UNIT 1) - 3549' 19920101 1992 46,699.42 2062 186,777.05
DRAFT
2764
Village of OswegoWater & Sewer Line Schedule as of 4/30/17 Inflation %: 0.02
Village of OswegoWater & Sewer Line Schedule as of 4/30/17 Inflation %: 0.02
Description Aquired Date
(YYYYMMDD) Aquired
Year Cost Basis
Replacement Year (Based on Useful
Life-70 yrs) Replacement Cost
WATER LINES- 8in SOUTHBURYAUTUMN GATE POD 9 - 5,530' 20041130 2004 116,130.00 2074 464,468.70 WATER LINES- 10IN SOUTHBURYAUTUMN GATE POD 9 - 2,961' 20041130 2004 71,064.00 2074 284,224.61 SEWER LINES- 8IN SOUTHBURYAUTUMN GATE POD 9 - 5,247' 20041130 2004 131,175.00 2074 524,642.05 WATER LINES- 12IN SOUTHBURYWOOLEY RD - 1,675' 20041130 2004 45,225.00 2074 180,880.02 WATER LINES - 8" - DEERPATH TRAIL(UNITS 4,5 & 6) - 2,744' 20041130 2004 57,624.00 2074 230,470.54 WATER LINES - 8IN SOUTHBURYVILLAGE POD 7 - 5,862' 20050103 2005 123,102.00 2075 492,353.62 SEWER LINES - 8IN SOUTHBURYVILLAGE POD 7 - 3,892' 20050103 2005 97,300.00 2075 389,157.02 WATER LINES-8'' CHURCHILL CLUBUNIT #7-5515' 20050430 2005 115,815.00 2075 463,208.84 WATER LINES-12IN CHURCHIL CLUBUNIT 7-1130' 20050430 2005 30,510.00 2075 122,026.52 SEWR LINES-8'' CHURCHILL CLUBUNIT 7-5099' 20050430 2005 127,475.00 2075 509,843.68 SEWER LINES-14IN CHURCHIL CLUBUNIT 7-334' 20050430 2005 16,700.00 2075 66,792.62 WATER LINES-8IN STEEPLE CHASE-4,650' 20050430 2005 97,650.00 2075 390,556.86 WATER LINES- 12IN STEEPLECHASE-4,700' 20050430 2005 126,900.00 2075 507,543.94 WATER LINES-8IN SOUTHBURYVILLAGE POD 3-CLUB HOUSE- 506' 20050430 2005 10,626.00 2075 42,499.31 SEWER LINES-8IN SOUTHBURYVILLAGE POD 3-CLUB HOUSE- 415' 20050430 2005 10,375.00 2075 41,495.42 WATER LINES - 8' WASHINGTONPLACE - 145' 20050430 2005 3,045.00 2075 12,178.65 WATER LINES - 8in KENDALL PTLOT 12 - 1867' 20060430 2006 57,877.00 2076 231,482.43 WATER LINES - 8in STONEHILLLOT 15 UNIT 3 - 728' 20060430 2006 22,568.00 2076 90,262.03 WATER LINES - 16IN HUNT CLUB(OFF SITE) - 18' 20060430 2006 1,530.00 2076 6,119.32 WATER LINES - 8IN ORCHARDGROVE - 2541' 20060430 2006 20,328.00 2076 81,303.02 WATER LINES - 10IN ORCHARDWOODS - 1252 20060430 2006 56,340.00 2076 225,335.11 WATER LINES - 12in - ORCHARDWOODS - 285 20060430 2006 17,100.00 2076 68,392.45 WATER LINES - 6in - PRAIRIEMARKET WEST - 186' 20060430 2006 4,026.00 2076 16,102.22 WATER LINES - 8IN - PRAIRIEMARKET WEST - 3671 20060430 2006 113,801.00 2076 455,153.73 WATER LINES - 10IN - PRAIRIEMARKET WEST - 6733' 20060430 2006 302,985.00 2076 1,211,806.15 SEWER LINES - IN - PRAIRIEMARKET WEST - 2404' 20060430 2006 62,504.00 2076 249,988.39 SEWER LINES - 10IN - PRAIRIEMARKET WEST - 2012 20060430 2006 70,420.00 2076 281,648.89 SEWER LINES - 8IN - PRAIRIEMARKET (WALMART) - 2869' 20060430 2006 74,594.00 2076 298,343.05 SEWER LINES - 10IN - PRAIRIEMARKET (WALMART) - 1699' 20060430 2006 59,465.00 2076 237,833.73 SEWER LINES - 12IN - PRAIRIEMARKET (WALMART) - 2435' 20060430 2006 146,100.00 2076 584,335.46 TOWN CENTER PROJECT(WATER PORTION) 20060430 2006 4,358,679.59 2076 17,432,792.79 WATER MAIN - Douglas RdREPLACEMENT 20070430 2007 145,257.19 2077 580,964.59 WATER LINES - 6 IN. - BICKFORDCOTTAGE - 77' 20070430 2007 6,160.00 2077 24,637.28 WATER LINES - 8 IN - BICKFORDCOTTAGE - 683' 20070430 2007 68,300.00 2077 273,169.83 SEWER LINES - 6 IN - BICKFORDCOTTAGE - 395' 20070430 2007 13,825.00 2077 55,293.89 WATER LINES - 8 IN - 5TH STMARKTE PLACE - 1,628' 20070430 2007 162,800.00 2077 651,128.08
DRAFT
3370
Village of OswegoWater & Sewer Line Schedule as of 4/30/17 Inflation %: 0.02
Description Aquired Date
(YYYYMMDD) Aquired
Year Cost Basis
Replacement Year (Based on Useful
Life-70 yrs) Replacement Cost
WATER LINES - 12 IN - 5TH STMARKET PLACE - 892' 20070430 2007 115,960.00 2077 463,788.77 SEWER LINES - 8 IN - ORCHARDWAY LOT 10 - 436' 20070430 2007 23,980.00 2077 95,909.41 WATER LINES - 8IN - JEWEL/OSCO1,339' 20070430 2007 133,900.00 2077 535,540.85 WATER LINES - 12IN - JEWEL/OSCO - 624' 20070430 2007 81,120.00 2077 324,444.16 WATER LINES - 6IN - EARLYCHILDHOOD CENTER - 150' 20070430 2007 12,000.00 2077 47,994.70 WATER LINES - 4IN - ASHCROFTJUNIOR HIGH - 30' 20070430 2007 1,800.00 2077 7,199.20 WATER LINES - 6IN - ASHCROFTJUNIOR HIGH - 30' 20070430 2007 2,400.00 2077 9,598.94 WATER LINES - 8IN - ASHCROFTJUNIOR HIGH - 2,137' 20070430 2007 213,700.00 2077 854,705.59 WATER LINES - 4IN - HUNT CLUBELEMENTARY - 61' 20070430 2007 3,660.00 2077 14,638.38 WATER LINES - 6IN - HUNT CLUBELEMENTARY - 71' 20070430 2007 5,680.00 2077 22,717.49 WATER LINES - 8IN - HUNT CLUBELEMENTARY - 2,135' 20070430 2007 213,500.00 2077 853,905.68 WATER LINES - 4IN - SOUTHBURYELEMENTARY - 71' 20070430 2007 4,260.00 2077 17,038.12 WATER LINES - 8IN - SOUTHBURYELEMENTARY - 1,906' 20070430 2007 190,600.00 2077 762,315.80 SEWER LINES - 8IN - ORCHARDGROVE - 2,715' 20070430 2007 149,325.00 2077 597,234.03 SEWER LINES - 8IN - ORCHARDWOODS - 1,466' 20070430 2007 80,630.00 2077 322,484.38 WATER LINES - 6IN - SOUTHBURYELEMENTARY 20070430 2007 6,800.00 2077 27,197.00 WATER LINES - 8 IN - EARLYCHILDHOOD CENTER - 1450' 20070430 2007 145,000.00 2077 579,935.94 SEWER LINES - 6 IN - EARLYCHILDHOOD CENTER - 715' 20070430 2007 25,025.00 2077 100,088.94 WATER LINES - 8 IN - MASONSQUARE OFFICE CONDO - 500' 20080430 2008 52,500.00 2078 209,976.81 WATER LINES - 8'' - NEW CENTRLFIRE STATION - 1313' 20080430 2008 137,865.00 2078 551,399.09 WATER LINES - 12'' - CENTRALFIRE STATION - 692' 20080430 2008 65,928.00 2078 263,682.87 SEWER LINES - 8IN - JEWEL OSCO719' 20080430 2008 40,983.00 2078 163,913.89 WATER LINES - 6'' - ODGEN FALLBUILDING #7 - 65' 20080430 2008 5,395.00 2078 21,577.62 WATER LINES - 8'' - ODGEN FALLBUILDING #7 - 1170' 20080430 2008 122,850.00 2078 491,345.73 WATER LINES - 6'' - ODGEN FALLBUILDING #8 - 30' 20080430 2008 2,490.00 2078 9,958.90 WATER LINES - 8'' - ODGEN FALLBUILDING #8 - 725' 20080430 2008 76,125.00 2078 304,466.37 WATER LINES - 10'' -LA FITNESS1131' 20080430 2008 141,375.00 2078 565,437.54 SEWER LINES - 6'' -LA FITNESS622' 20080430 2008 22,392.00 2078 89,558.11 WATER LINES - 8''VILLAGE HALL - 507' 20080430 2008 53,235.00 2078 212,916.48 WATER LINES - 8'' - THOMPSONJR HIGH ADDITIONS - 885' 20080430 2008 92,925.00 2078 371,658.95 WATER LINES - 6'' - PACIFICRIDGE (WM EXTENSION) 50' 20080430 2008 4,150.00 2078 16,598.17 WATER LINES - 10'' - PACIFICRIDGE - 2116' 20080430 2008 264,500.00 2078 1,057,883.15 WATER LINES - 12'' - PACIFICRIDGE - 680' 20080430 2008 91,120.00 2078 364,439.75 WATER LINES - 6'' - PRAIRIEMARKET EAST - 98' 20080430 2008 8,134.00 2078 32,532.41 WATER LINES - 8'' - PRAIRIEMARKET EAST - 144' 20080430 2008 8,928.00 2078 35,708.06 WATER LINES - 10'' - PRAIRIEMARKET EAST - 1778' 20080430 2008 222,250.00 2078 888,901.82
DRAFT
3471
Village of OswegoWater & Sewer Line Schedule as of 4/30/17 Inflation %: 0.02
Description Aquired Date
(YYYYMMDD) Aquired
Year Cost Basis
Replacement Year (Based on Useful
Life-70 yrs) Replacement Cost
SEWER LINES - 6'' - PRAIRIEMARKET (OLIVE GARDEN) - 184' 20080430 2008 11,408.00 2078 45,626.96 WATER LINES - 8'' - STONEHILLLOT 9, UNIT 1 - 370' 20080430 2008 22,940.00 2078 91,749.87 TOWN CENTER PROJECT (WTR)ADDITIONAL EXPENSE 20080430 2008 21,920.53 2078 87,672.44 WATER MAIN - RT 34 (ARBOR LANETO ORCHARD) 20080501 2008 259,247.68 2078 1,036,876.19 WATER LINES - 6''- KENDALL PNTRETAIL UNIT 3 LOT 2 - 55' 20090430 2009 2,860.00 2079 11,438.74 SEWER LINES - 6'' KENDALL PNTRETAIL UNIT 3 LOT 2 - 267' 20090430 2009 21,894.00 2079 87,566.33 SEWER LINES - 6'' - NEW CENTRLFIRE STATION - 164' 20090430 2009 13,448.00 2079 53,786.06 SEWER LINES - 8'' - NEW CENTRLFIRE STATION - 478' 20090430 2009 33,460.00 2079 133,825.22 SEWER LINES - 8'' - PRAIRIEMARKET EAST - 526' 20090430 2009 43,132.00 2079 172,508.95 SEWER LINES - 8'' - PRAIRIEMARKET EAST - 389' 20090430 2009 27,230.00 2079 108,907.97 WATER LINES - 8'' - PRAIRIEMARKET (PANDA EXP) - 220' 20090430 2009 12,100.00 2079 48,394.65 SEWER LINES - 6'' - PRAIRIEMARKET (PANDA EXP) - 157' 20090430 2009 12,874.00 2079 51,490.31 WATER LINES '' - GERRY PLAZALOT 3 - 30' 20110430 2011 3,300.00 2081 13,198.54 WATER MAIN - ROUTE 71 20140430 2011 2,907,921.34 2081 11,630,400.71 WATER LINES - 6IN - AUTUMNLEAVES - 93' 20120430 2012 3,627.00 2082 14,506.40 WATER LINES - 8IN - AUTUMNLEAVES - 1177' 20120430 2012 51,788.00 2082 207,129.12 SEWER LINES - 6IN - AUTUMNLEAVES - 279' 20120430 2012 6,975.00 2082 27,896.92 WATER MAIN - ROUTE 34 RELOCATION 20160430 2016 238,391.95 2086 953,462.48
Next 20-Years 266,681.12 1,193,290.63 20 Years + 44,314,487.81 176,284,911.63 REPORT TOTAL 44,581,168.93 177,478,202.26 DRAFT
3572
VILLAGE STREET LISTING This section lists the Village owned roadways by length and width. Each road also has a road rating which details the condition of the road and helps to determine when future maintenance will be required. The Village hired IMS Infrastructure Management Services to inspect the roads using engineering instruments including lasers. This method looks not only at the surface of the road but also the subbase to determine if the road is built on solid ground. IMS completed the roadway analysis in the fall of 2014. On average, our road system is in “Very Good” condition. This rating is influenced by the miles of roads installed in the past ten years. More than 54% of the road area in the Village is “Very Good” or better as shown in the table below. Of concern is the 9% of the pavement area that is currently rated at “Fair” or “Poor”. These roads will require work sooner rather than later. Within the next five years, the average road condition will decrease from an engineering assessment rating of 80 to 71 if no work is done. More importantly, the percentage of road area rated “Fair” or “Poor” (rating of 60 to 40) will increase to 18%. Roads with a score of 69 today will reach a score of 40 within 10 years. The score of 40 is important, as this is the score at which resurfacing is no longer viable and total road reconstruction is necessary.
Current Conditions = Average System Rating = 80
RANGE
CONDITION
RELATIVE REMAINING
LIFE (Some
Maintenance is assumed) DEFINITION
% BY AREA
85 and Above
Excellent 12 to 15 years
Sections may require some minor patching and crack
27%
80 - 84 Very Good 10 to 12 years
Sections may require seal coating or possibly thin overlays
27%
70 - 79 Good 8 to 10 years
Sections will require seal coating, thin overlay or thicker
37%
60 - 69 Fair 6 to 8 years
Sections will require thicker overlay, surface replacement or some base reconstruction
8%
40 - 59 Poor 3 to 6 years
Sections will require surface replacement, base reconstruction and possibly some subgrade stabilization
1%
10 - 39 Very Poor Less than 3 years
Sections will require total reconstruction with subgrade preparation
0%
DRAFT
36
73
Street From To Length Width Rank2ND ST N MADISON ST N ADAMS ST 341 22.0 73
ABINGDON DR BLOOMFIELD CIR E EAST END 397 30.0 85
ADDISON CT WILLINGTON WAY WILLINGTON WAY 295 30.0 82
AFFIRMED AVE AUBURN DR BLUEGRASS PKWY 512 30.0 79
ALEX CT WATERBURY CIR WEST END 141 28.0 71
ALEXANDER CT RIDGEFIELD RD WEST END 338 30.0 83
ALLINGTON CT COLCHESTER DR EAST END 246 30.0 50
AMHERST CIR DEERFIELD DR ANDOVER DR 1948 30.0 62
AMHERST CIR ANDOVER DR DEERFIELD DR 2305 30.0 11
AMHERST CT WEST END AMHERST CIR 187 30.0 73
AMSTON CT BLOOMFIELD CIR W NORTH END 285 30.0 44
ANDOVER DR MARTY LN PLAINFIELD RD 3821 30.0 73
ANDOVER DR AMHERST CIR AMHERST CIR 1130 2.0 11
ANGELA CIR OLD POST RD OLD POST RD 1203 30.0 73
ANTHONY CT WATERFORD DR WEST END 499 30.0 81
APOLLO LN MARKET DR SOUTH END 728 30.0 84
ARBOR CT ARBOR LN WEST END 266 30.0 76
ARBOR LN US RTE 34 BAYBERRY DR 2811 30.0 73
ARBORETUM WAY WHITE PINES LN ASHCROFT LN 3517 29.3 73
ARROWWOOD DR ARBOR LN EAST END 259 30.0 79
ASH GROVE LN WILLOWWOOD DR GATES CREEK DR 1358 30.0 76
ASHCROFT CT GREENWOOD PL ASHCROFT LN 259 30.0 79
ASHCROFT LN AMHERST CT ARBORETUM WAY 3000 30.0 76
ASHLAND ST GARFIELD ST E WASHINGTON ST 1335 30.0 80
STONEWATER LN GREENVIEW LN WASHINGTON ST 1577 30.0 79
SUDBURY CIR BLUE HERON DR BLUE HERON DR 5037 28.3 75
SUFFIELD CT CANTON DR NORTH END 407 30.0 85
SUNSHINE CT TREASURE DR TREASURE DR 348 24.0 59
TAFT DR MILLSTREAM LN EISENHOWER DR 928 36.0 78
TEMPLETON DR STONEHILL RD PLAINFIELD RD 2013 30.0 69
TERRACE CT TERRACE LN WEST END 236 30.0 76
TERRACE LN CARNATION DR PARADISE PKWY 1410 30.0 86
TEWKSBURY CIR CHESTERFIELD DR CHESTERFIELD DR 1020 30.0 83
TEWKSBURY CT TEWKSBURY CIR SOUTH END 207 30.0 76
THEODORE DR STONEHILL RD PLANK DR 1207 30.0 62
THORNBURY CT THORNBURY DR SOUTH END 164 30.0 80
THORNBURY DR CHESTERFIELD DR CHESTERFIELD DR 820 30.0 79
TORRINGTON CT TORRINGTON CT WINTHROP DR 810 30.0 76
TOWNS XING DOUGLAS RD EAST END 184 20.0 59
TOWNSEND DR DEVOE DR HARVEY RD 820 39.8 82
TREASURE DR WEST END OGDEN FALLSBLVD
450 28.0 44
TREASURE DR OGDEN FALLS BLVD BLUE RIDGE DR 1384 28.0 53
TREASURE DR BLUE RIDGE DR HARVEY RD 1522 28.0 78
10/26/2015 Page 14
DRAFT
50
87
Street From To Length Width RankTREASURE DR HARVEY RD US RTE 30 1729 37.7 73
TRUMAN DR TRUMAN DR N TRUMAN DR N 1998 36.0 80
TRUMAN DR N TRUMAN DR TRUMAN DR 282 30.0 82
TRUMAN DR S TRUMAN DR SOUTH END 180 30.0 79
TUSCANY TRL CITY LIMIT ORCHARD RD 2443 30.0 59
UNNAMED 1 ORCHARD RD WEST END 1216 30.0 82
UNNAMED 2 ORCHARD RD WEST END 716 30.0 81
UNNAMED 3 WHITE OAK DR STATION DR 642 30.0 79
UNNAMED 4 ORCHARD RD STATION DR 358 30.0 83
UNNAMED 5 STATION DR ORCHARD RD 351 30.0 80
VALENTINE WAY DEVOE DR DEVOE DR 1118 30.0 81
VERNON DR KENSINGTON DR EAST END 249 30.0 76
VERSAILLES PKWY FIFTH ST BLUEGRASS PKWY 2338 30.0 69
VICTORIA LN METINA DR CHAROLOTTE LN 875 30.0 73
VINCA LN LINDEN DR COLCHESTER DR 1088 30.0 56
VISTA DR WEST END ARBORETUM WAY 922 30.0 81
VISTA DR ARBORETUM WAY ARBORETUM WAY 1889 30.0 76
W BENTON ST WEST END S MADISON ST 852 24.0 62
W BLOOMFIELD CIR AMSTON CT BLOOMFIELD CIRE
1216 30.0 83
W JACKSON ST HARRISON ST S ADAMS ST 331 18.0 56
W JACKSON ST S ADAMS ST S MADISON ST 708 28.0 79
W JEFFERSON ST E JEFFERSON ST S MADISON ST 321 30.0 83
W MERCHANTS DR N MERCHANTS DR PENDLETON PL 446 50.0 82
W TYLER ST S ADAMS ST S MADISON ST 692 21.0 73
W VAN BUREN ST S ADAMS ST S MAIN ST 358 18.0 41
W VAN BUREN ST S MAIN ST S MADISON ST 364 30.0 64
W WASHINGTON ST LYNX LN US RTE 34 3756 37.3 53
WATERBURY CIR OGDEN FALLS BLVD OGDEN FALLSBLVD
4225 28.0 44
WATERFORD DR RIDGEFIELD RD PEARCES FRD 2657 30.0 69
WAUBONSEE CIR OLD POST RD PEARCES FRD 3424 30.0 79
WAUBONSEE CIRCLECT
WAUBONSEE CIR WAUBONSEE CIR 272 24.0 82
WAYSIDE CT HALF ROUND RD SOUTH END 380 24.0 79
WEAVER CT WEAVER ST WEST END 131 45.0 79
WEAVER ST CARPENTER AVE EAST END 351 30.0 71
WEAVER ST SOUTH END HUNT CLUB DR 820 30.0 81
WEAVER ST HUNT CLUB DR NORTH END 1039 30.0 73
WEMBLEY RD CHAROLOTTE LN SAUGATUCK RD 472 30.0 50
WEST END CT DOUGLAS ST SOUTH END 305 24.0 76
WESTFORD PL COLCHESTER DR JUNIPER ST 1385 2.0 11
10/26/2015 Page 15
DRAFT
51
88
Street From To Length Width RankWESTMINSTER CT KENSINGTON DR NORTH END 374 28.0 82
WHITE OAK DR UNNAMED 3 DS@660N UNNAMED3
571 30.0 79
WHITE OAK DR DS@660N UNNAMED 3 NORTH END 249 30.0 86
WHITE OWL LN BUCKTAIL DR WOLVERINE DR 689 28.0 78
WHITE PINES CT WHITE PINES LN EAST END 430 30.0 81
WHITE PINES LN WHITE PINES CT DANBURY DR 830 30.0 79
WHITETAIL XING FOX CHASE DR N DEERPATH DR 1017 30.0 79
WHITEWATER LN NORTH END HOOVER DR 964 30.0 79
WIESBROOK DR DOUGLAS RD FIFTH ST 1611 30.0 64
WIESBROOK DR FIFTH ST EAST END 2561 30.0 80
WILLINGTON WAY SOUTHBURY BLVD SOUTHBURY BLVD 4069 30.0 64
WILLOWWOOD DR ARBOR LN MILL RD 3925 30.0 83
WILLOWWOOD DR N MILL RD WILLOWWOOD DR N 4412 30.0 64
WILMETTE AVE EAST END E WASHINGTON ST 863 18.0 50
WILMORE DR PARIS AVE FAYETTE DR 522 30.0 83
WILSON PL S ADAMS ST S MADISON ST 689 18.0 53
WILSON PL S MADISON ST E BENTON ST 981 24.0 79
WILTON CT WINTHROP DR WEST END 243 30.0 85
WINDCREST DR LOMBARDYLN ORCHARD AVE 797 30.0 82
WINDSOR DR DANBURY DR MORGAN VALLEYDR
2637 30.0 69
WINGATE CT WINGATE DR NORTH END 771 28.0 36
WINGATE DR WATERBURY CIR WINGATE CT 1367 28.0 75
WINTHROP DR WILLINGTON WAY WILLINGTON WAY 1446 30.0 84
WOLF RD US ROUTE 34 US RTE 30 14295 27.7 73
WOLF RD HAWTHORNE DR DOUGLAS RD 7368 25.5 73
WOLLMINGTON DR OLD POST RD SETON CREEK DR 984 30.0 79
WOLVERINE DR BUCKTAIL DR DS@660N DONEGALCT
935 30.0 73
WOLVERINE DR DS@660N DONEGAL CT OTTER WAY 1555 30.0 69
WOODCHUCK TRL FERRET XING BISON RD 794 30.0 76
WOODFORD RD NORTH END PREAKNESS DR 2027 30.0 82
WOODLAND WAY ASHCROFT LN ASHCROFT LN 1043 30.0 75
WOOLLEY RD PLAINFIELD RD DS@1320ECOLCHESTER DR
3469 35.6 81
WOOLLEY RD DS@1320E COLCHESTERDR
DOUGLAS RD 5207 22.0 47
YEADON DR BROCKWAY DR CIRCLE DR W 331 28.0 80
YOAKUM BLVD FIFTH ST BLUEGRASS PKWY 2405 52.9 82
YOAKUM BLVD BLUEGRASS PKWY EAST END 2227 51.6 82
YORK DR LENNOX DR CENTURY DR 394 30.0 71
10/26/2015 Page 16
DRAFT
52
89
Village of Oswego - Community Investment Plan
Project Information
Title Project Police Headquarters
Account #
Location 3355 Woolley Road
Department Police
Type
New to CIP No
Prepared BY Chief Jeff Burgner
Useful Life 40 Years
Project Snapshot
Description
Design, construct and furnish a new police facility to accommodate current and expected growth for at least 20 years. This facility would be part of a public safety "campus" with sufficient land for future expansion opportunities.
Justification
The police department is currently housed in an aging 25 year old facility built for a staff of 50. Currently we house 69 employees. With expected growth our operational abilities will be severely limited, not only from a facility stand point but from a land/parking standpoint. Our current facility is land locked and does not lend to the possibility of expansion.Expenditures FY'18 FY'19 FY'20 FY'21 FY'22 or > Total
Construction 20,000,000 $8,000,000.00 28,000,000
Total 20,000,000 $8,000,000.00 28,000,000
Funding Sources
Capital Fund 20,000,000 $8,000,000.00 28,000,000
General Fund
Vehicle Fund
Water & Sewer Fund
Other - Vendor Financed
Total 20,000,000 $8,000,000.00 28,000,000
Operational Impact/Other
The current police department facility, built to house 50 employees, is 25 years old and is beyond its capacity. The existing furnishings, equipment and exterior lighting are beyond their life expectancy and will require major renovation and/or replacement. In addition, our operational abilities are limited due to the surrounding land and inability to expand. With the future growth of the Village a new police facility will allow for improved operational capabilities and growth. The $30,000 spent during FY '16 was utilized to update the space needs analysis and identify any major changes to projected staffing levels and services based on the Villages long range plan. Because this is such an expansive project the money designated for FY '17, '18 and '19 would be spread over three budget years. The architectural portion of this project is the most important part as this will help solidify a building that is expansive enough to meet future needs. This figure may be adjusted based on the speed at which this project progresses. During FY '18 the bid process will begin along with initial construction. Final completion of this project is expected during FY '19. The intended site of this facility is adjacent to Oswego Fire Station #1 creating a public safety campus with shared parking and storm water detention.
DRAFT
53
90
Village of Oswego - Community Investment Plan
Project Information
Title Project Holiday Decorations
Account #
Location Town/Village Hall
Department Public Works
Type Improvement
New to CIP No
Prepared BY Mark D. Runyon
Useful Life 15 Years
Project Snapshot
Description
Install new holiday decorations at Village Hall and replace existing decorations along Main Street, US 34 and other areas where we currently install annual decorations. This will also fund the annual live holiday tree at Village Hall, ground display at Village Hall, pole mounted snowflakes, pole mounted artificial garland, pole mounted decoration incorporating some aspect of the Village logo.
Justification
The vast majority of consumer retail expenditures happen during the holiday season. Colorful, vibrant holiday lights, particularly those at a pedestrian scale, attract consumers to the retail areas. We currently install wreaths on light poles, artificial non-lighted garland on the railings and incandescent light strings in the trees on Main Street. The wreathes have faded, are losing their original appeal and require light bulb replacement. The trees on Main Street have grown to a size that we can no longer install enough lights to make them look vibrant due to power limitations. Replacing the incandescent decorations with LED will provide brighter, longer lasting, and more energy efficient decorations. We currently fund for the live lighted Village Hall tree through the Tree Planting budget line item. Expenditures FY'19 FY'20 FY'21 FY'22 FY'23 or > Total
Other $10,000.00 $10,000.00 $10,000.00 $80,000.00 $110,000.00
Total $10,000.00 $10,000.00 $10,000.00 $80,000.00 $110,000.00
Funding Sources
Capital Fund $50,000.00 $50,000.00
General Fund $10,000.00 $10,000.00 $10,000.00 $30,000.00 $60,000.00
Vehicle Fund
Water & Sewer Fund
Other - Vendor Financed
Total $10,000.00 $10,000.00 $10,000.00 $80,000.00 $110,000.00
Operational Impact/Other
This project proposes making an initial expenditure in 2020 of $10,000 per year for six years out of the operating fund to purchase the annual lighted tree at Village Hall and begin replacing all of our aging decorations and downtown tree lights. The initial stage of a ground display at Village Hall is included. Funding increases to $50,000 in 2026 to add to decorations as needed. Public Works staff spends approximately 160 staff hours per year maintaining, installing, and removing decorations. Converting to LED will save annual staff maintenance time and cost for bulb replacements. The LED lighting will be more appealing and will save energy costs. Some costs may be offset through sponsorships or donations.
DRAFT
54
91
Village of Oswego - Community Investment Plan
Project Information
Title Project Enterprise-Wide Software
Account #
Location All Facilities
Department Finance
Type Other
New to CIP No
Prepared BY Billie Robinson
Useful Life 25 years
Project Snapshot
Description
Purchase and install an enterprise-wide software solution to include new financial software with integrated modules for accounting, cash receipting, payroll, human resources, payables, permitting, reporting, budget, customer service, utility billing, accounts receivable billing, etc. Modules will also include integrated adjudication software, ticketing software, work management software, and land management software. This system will be accessible and used by all departments. Total project cost is approximately $800,000 plus annual SaaS (Software as a Service) fees of $205,000 per year.
Justification
The Village's current financial software has been in place since 2002. Implementation of a new software system would increase efficiencies in all departments and eliminate the duplication of invoice storage, manual spreadsheets' and allow all department heads and Village board access to the financial data and other modules. Expenditures FY'19 FY'20 FY'21 FY'22 FY'23 or > Total
Other $150,000.00 $150,000.00
Total $150,000.00 $150,000.00
Funding Sources
Capital Fund $150,000.00 $150,000.00
General Fund
Vehicle Fund
Water & Sewer Fund
Other - Vendor Financed
Total $150,000.00 $150,000.00
Operational Impact/Other
Elimination of duplicate record keeping in other departments of financial data and copy of invoices. Access to the financial data and other modules to allow for improved decision making. Work transference between current staffing which will provide for better operational flow of data, greater transparency and operational efficiencies. The annual costs for the ERP system are $205,000.
DRAFT
55
92
Village of Oswego - Community Investment Plan
Project Information
Title Project Network Switches, Access Points, and Firewall
Account #
Location Police Department
Department Information Technology
Type
New to CIP Yes
Prepared BY IT Manager
Useful Life 5 Years
Project Snapshot
Description
Cisco Meraki network switches, access points and firewalls are best of breed technology. They offer a centrally managed cloud solution. This enables rapid deployment in any disaster recovery scenario. They have built in multi-site management, automatic monitoring and alerts. Since they are cloud managed, they are always up to date, with seamless over the web firmware updates. The access pints are built for performance. They have dedicated security radios imbedded into the devices. The enterprise license term is 5 years. Longer license terms are also available.
Justification
The new Police Department HQ needs Enterprise grade Switches, Access Points and Firewalls that are dependable. The Meraki approach to networking is a revolutionary new design scheme, which simultaneously makes high-speed networks with nearly-infinite scaling potential, while providing the easiest administration tools in the business. This is accomplished thanks to a mesh-based network system, where every device attached is aware of and collaborating with every other device. Whenever a new piece of hardware is added to Meraki networks, the network automatically detects it and re-configures itself to make optimal use of the new hardware. No administrator configuration is required for this, beyond typing the new device's serial number and license into the operating system. Likewise, should a device go offline, it doesn't hamstring the network. It's self-healing and simply reconfigures to work around the missing piece. Beyond that, Meraki networks have a range of features which appeal to the Village such as: 1. the WiFi technology is future-focused, utilizing currently top-grade 802.1ac Wave 2 systems which will be the standard for years to come. 2. Additional specialty devices, such as dedicated firewalls, can be added to the network at any time, with the same zero-effort installation procedures. 3. The OS, system software, and any anti-virus/anti-malware systems are kept automatically updated via cloud systems. 4. Content-filtering packages are integrated directly into the software to simplify access restrictions. And perhaps biggest of all: As long as they are kept in-license, Meraki networks are 100% fully supported by Meraki for their entire useful lifespan, regardless of how long that is. You get lifetime defective hardware replacements, and unlimited technical support for as long as the devices are used.
Expenditures FY'19 FY'20 FY'21 FY'22 FY'23 or > Total
Equipment $145,000.00 $145,000.00
Total $145,000.00 $145,000.00
Funding Sources
Capital Fund $145,000.00 $145,000.00
General Fund
Vehicle Fund
Water & Sewer Fund
Other - Vendor Financed
Total $145,000.00 $145,000.00
Operational Impact/Other
Recurring CIP funds for Networking equipment replacements every four - five years.
DRAFT
56
93
Village of Oswego - Community Investment Plan
Project Information
Title Project Planimetric Capture & Aerial Imager Capture
Account #
Location
Department Information Technology
Type
New to CIP No
Prepared BY Joe Renzetti
Useful Life Data is good until development occurs
Project Snapshot
Description
Planimetric features are contours, roads, driveways, sidewalks, building footprints, etc. Planimetric data is obtained by looking at aerial photographs taken from a plane. By taking the picture twice with a slight offset, the image can be projected in three dimensions to establish contours (lines of equal elevations).
Justification
The Village of Oswego has limited planimetric data for the Village. Planimetric data allows the Village to do indepth analysis utilizing the GIS. With the growth that Oswego has had over the past decade, there is significant gaps in the available data. This project will capture the data in a cost-effective manner. Engineers use the contours to ascertain drainage patterns. The planimetric data is used to manage assets and to analyize the relationship between them. Examples include determining the limits of a floodplain and the number of structures within it.
Expenditures FY'19 FY'20 FY'21 FY'22 FY'23 or > Total
Construction $125,000.00 $125,000.00
Other
Other
Total $125,000.00 $125,000.00
Funding Sources
Capital Fund $125,000.00 $125,000.00
General Fund
Vehicle Fund
Water & Sewer Fund
Other - Vendor Financed
Total $125,000.00 $125,000.00
Operational Impact/Other
Once an initial Planimetric capture is completed, periodic updates will be needed as areas develop. This project improves efficency and accuracy of the mapping system.
DRAFT
57
94
Village of Oswego - Community Investment Plan
Project Information
Title Project Village Facility Surveillance Camera System
Account #
Location Village Hall & Public Works
Department Information Technology
Type Other
New to CIP Yes
Prepared BY Joe Renzetti
Useful Life 10 + Years
Project Snapshot
Description
Surveillance cameras are video cameras used for the purpose of observing an area. They are often connected to a recording device or IP network, and may be watched by a security guard or law enforcement officer.
Justification
The Village Facilities (Village Hall & Public Works) do not currently have a any camera surveillance systems. Video surveillance in the workplace protects both the company and its employees. Install video surveillance systems inside and outside the workplace to record criminals who vandalize or steal company property. The video images will help the police in the ensuing investigation. Video surveillance cameras also record acts of employee theft. The cameras can act as a crime deterrent. When criminals see a surveillance camera, or employees know surveillance is in place, it discourages criminal activity. Video surveillance systems protect employees both directly and indirectly. With future upgrades, we could set up video cameras in facility parking lots and outside the building to record criminal activity and allow peace of mind to employees that in reaching their vehicles safely. The video system can record instances of employee abuse or harassment towards other employees, which can be used as evidence against the antagonist. Video surveillance protects employees indirectly by monitoring each visitor who comes into the building and keeps a video record of suspicious activity. Managers and supervisors can use video surveillance to monitor employee productivity, determine job performance areas where the employee needs improvement and insure that employees follow company safety rules. Maintenance employees can use video surveillance cameras to detect equipment that needs repair and equipment that is operating in an unsafe manner. Because employees, managers and supervisors cannot be everywhere at once, a video surveillance system monitors productivity without hiring additional personnel.Expenditures FY'19 FY'20 FY'21 FY'22 FY'23 or > Total
Total $35,000.00 $0.00 $0.00 $0.00 $0.00 $35,000.00
Funding Sources
Capital Fund $35,000.00 $35,000.00
General Fund
Vehicle Fund
Water & Sewer Fund
Other - Vendor Financed
Total $35,000.00 $35,000.00
Operational Impact/Other
Annual maintenance costs for system a five camera solution at Village Hall and a nine camera solution at Public Works is $300/year
DRAFT
58
95
Village of Oswego - Community Investment Plan
Project Information
Title Project Workstation Refresh
Account #
Location Police Department
Department Information Technology
Type
New to CIP Yes
Prepared BY IT Manager
Useful Life 4 Years
Project Snapshot
Description
Dependable, efficient IT hardware is necessary for the Village's operations. In FY 18, the Village IT Department upgraded Village Hall and Public Works computers. The Police Department did not receive any upgraded computers do to the new construction of he Police Headquarters. With the new PD coming online in September of 2018, the decision was made to upgrade their computer hardware at the same time the Police Department opens for business.
Justification
Creating a Refresh Cycle every four years allows the Village to curb many issues (money lost in keeping an aged piece of hardware functioning, and how much time is lost when running slow machine) and provide other benefits at the same time. Replacement of outdated Village computers will now be centralized utilizing a predetermined refresh cycle. This move is expected to simplify the process, ensure more standard security protection against viruses, and ultimately save the Village money through volume purchasing. - Computers (PC's) will be replaced every 4 to 5 years - Volume price discounts will be achieved through bulk purchases. - Unused or rarely used computers will be identified and removed if possible thus reducing support costs and information security risks. - Older machines will be replaced thus providing a consistent platform capable of keeping up with evolving computer needs and standards. - All upgrades will be coordinated by the Village IT Department thus eliminating the need for departments to order upgrades on an individual basis. - Village IT Department will be charged with the centralize management of the refresh logistics, and scheduling.Expenditures FY'19 FY'20 FY'21 FY'22 FY'23 or > Total
Equipment $80,000.00 $80,000.00
Total $80,000.00 $80,000.00
Funding Sources
Capital Fund $80,000.00 $80,000.00
General Fund
Vehicle Fund
Water & Sewer Fund
Other - Vendor Financed
Total $80,000.00 $80,000.00
Operational Impact/Other
Recurring CIP funds for computer replacements every four years.
DRAFT
59
96
Village of Oswego - Community Investment Plan
Project Information
Title Project Server Refresh
Account #
Location Oswego
Department Information Technology
Type
New to CIP Yes
Prepared BY IT Manager
Useful Life 5 Years
Project Snapshot
Description
Replacing servers and other critical hardware allows the Village to deploy updated equipment intended to improve reliability, enable new and anticipated capabilities, and save money in the long term. Memory constitutes a particularly crucial feature of servers in virtual environments, because VMs (virtual machines) are essentially disk images that reside in server memory. More memory is vital for higher levels of consolidation, and the reliability of that memory will impact the overall reliability of all the VMs on that server. Future capabilities may include support for new chipsets that can handle additional memory types, faster I/O, and higher bus speeds.
Justification
Servers are replaced or refreshed for many different reasons. Some of the reasons, or drivers, for server refresh that are: - Servers are no longer viable or desirable for upgrades or need additional capability that is not available through an upgrade. -Existing system is being retired because of nonsupport or maintenance issues. -The system is unable to support the growth of the current application and will be re-purposed to run another application. -To meet consolidation requirements, a server with higher performance, more memory capacity, and increased I/O capabilities is required. - Restructuring, using virtualization to gain better utilization and flexibility, exceeds the system's capabilities. - Power and cooling constraints and/or goals require more efficient systems. - Space constraints require servers with "smaller footprints." - Operational efficiency requires more efficient server systems. Expenditures FY'19 FY'20 FY'21 FY'22 FY'23 or > Total
Equipment $200,000.00 $200,000.00
Total $200,000.00 $200,000.00
Funding Sources
Capital Fund $20,000.00 $20,000.00
General Fund
Vehicle Fund
Water & Sewer Fund
Other - Vendor Financed
Total $20,000.00 $20,000.00
Operational Impact/Other
Recurring CIP funds for Server replacements every four years.
DRAFT
60
97
Village of Oswego - Community Investment Plan
Project Information
Title Project Network Switches, Access Points and Firewalls
Account #
Location All Village Facilities
Department Information Technology
Type
New to CIP Yes
Prepared BY IT Manager
Useful Life 5 Years
Project Snapshot
Description
Cisco Meraki network switches and access points are best of breed technology. They offer a centrally managed cloud solution. This enables rapid deployment in any disaster recovery scenario. They have built in multi-site management, automatic monitoring and alerts. Since they are cloud managed, they are always up to date, with seamless over the web firmware updates. The access pints are built for performance. They have dedicated security radios imbedded into the devices. The enterprise license term is 5 years. Longer license terms are also available.
Justification
The Village's current network switches are nearing end of life expectancy. The current infrastructure does not contain a centrally managed location. The current access points are also end of life. With the Village adding many more devices to the network, upgrading the network switches and access points are integral to the network infrastructure. Creating a Refresh Cycle every four years allows the Village to curb many issues (money lost in keeping an aged piece of hardware functioning, and how much time is lost when running slow machine) and provide other benefits at the same time. Replacement of outdated Village computers will now be centralized utilizing a predetermined refresh cycle. This move is expected to simplify the process, ensure more standard security protection against viruses, and ultimately save the Village money through volume purchasing. - Computers (PC's) will be replaced every 4 to 5 years - Volume price discounts will be achieved through bulk purchases. - Unused or rarely used computers will be identified and removed if possible thus reducing support costs and information security risks. - Older machines will be replaced thus providing a consistent platform capable of keeping up with evolving computer needs and standards. - All upgrades will be coordinated by the Village IT Department thus eliminating the need for departments to order upgrades on an individual basis. - Village IT Department will be charged with the centralize management of the refresh logistics, and scheduling.Expenditures FY'19 FY'20 FY'21 FY'22 FY'23 or > Total
Equipment $200,000.00 $200,000.00
Total $200,000.00 $200,000.00
Funding Sources
Capital Fund $200,000.00 $200,000.00
General Fund
Vehicle Fund
Water & Sewer Fund
Other - Vendor Financed
Total $200,000.00 $200,000.00
Operational Impact/Other
The current switches and access points are nearing end of life.
DRAFT
61
98
Village of Oswego - Community Investment Plan
Project Information
Title Project Squad Car MDT Upgrade
Account #
Location All Facilities
Department Information Technology
Type Other
New to CIP Yes
Prepared BY Joe Renzetti
Useful Life 5 years
Project Snapshot
Description
A mobile data terminal (MDT) or mobile digital computer (MDC) is a computerized device used for the Police Department's fleet of vehicles. These MDT's are used to display the CAD software. MDTs generally require specific installation protocols to be followed for proper ergonomics, power and communications functionality. MDT installation companies specialize in designing the mount design, assembling the proper parts, and installing them in a safe and consistent manner away from air bags, vehicle HVAC controls, and driver controls. Frequently installations will include a WAN modem, power conditioning equipment, and a WAN, WLAN, and GPS antenna mounted external to the vehicle.
Justification
The current fleet of Oswego Squad Car MDT's are not consistent. The fleet comprises of older Panasonic toughbooks that are past their useful life span, and a mixture of different model Fujitsu tablets. This current mixture of devices allows for multi factor inconsistencies across the board from hardware/software troubleshooting, to compatibility issues with current video systems within the squads to officer training. Expenditures FY'19 FY'20 FY'21 FY'22 FY'23 or > Total
Equipment $100,000.00 $100,000.00 $200,000.00
Maintenance $10,000.00 $10,000.00 $20,000.00
Total $110,000.00 $110,000.00 $220,000.00
Funding Sources
Capital Fund
General Fund
Vehicle Fund $110,000.00 $110,000.00 $220,000.00
Water & Sewer Fund
Other - Vendor Financed
Total $110,000.00 $110,000.00 $220,000.00
Operational Impact/Other
With a potential lease option for the MDT/MDC, the Police Squad cars would have updated consistent hardware/software across the entire fleet, many time consuming, time burdensome, downtime laden tasks/issues will be resolved. As having one type of MDT across the entire fleet will improve efficiencies from the the officer standpoint, to the the technical implications of setup and ongoing maintenances.
DRAFT
62
99
Village of Oswego - Community Investment Plan
Project Information
Title Project B&Z Vehicles
Account #
Location Village Hall
Department Building & Zoning
Type Vehicle
New to CIP No
Prepared BY Jay Hoover
Useful Life 7-8 years
Project Snapshot
Description
Replace Building and Zoning vehicle #30 for Inspection and Enforcement operations, with a new Ford F-150 ext cab 4x4
Justification
The vehicles in FY 19 and FY 20 are needed to replace existing B&Z vehicles #29 and # 30that have already surpassed the 10 year life expectancy in the fleet. All vehicles being replaced have met the criteria for vehicle replacement.All Vehicles are shared, but have a primary driver.Expenditures FY'19 FY'20 FY'21 FY'22 FY'23 or > Total
Vehicle Fund $27,040.00 $27,970.00 $28,809.00 $29,555.00 $113,374.00
Water & Sewer Fund
Other - Vendor Financed
Total $27,040.00 $27,970.00 $28,809.00 $29,555.00 $113,374.00
Operational Impact/Other
Replacing Vehicle #30 will allow for all 3 inspectors and a supervisor to respond to field duties and inspections. Failure to replace will result in delays to inspections, code enforcement, and/or other potential B&Z service interruptions. Truck #30 has a point score of 29 and is ready for immediate replacement. Truck 30 has ongoing regular mechanical/ electrical problems and failures. It has been removed from daily service. Truck 29 is in slightly better condition and will be retained for the time being.
DRAFT
63
100
Village of Oswego - Community Investment Plan
Project Information
Title Project Police Vehicles
Account #
Location 3525 Route 34
Department Police
Type
New to CIP No
Prepared BY Chief Jeff Burgner
Useful Life 4-5 Years
Project Snapshot
Description
Replace aging police vehicle(s) for Department operations. The Police Department is requesting approval for the purchase of (1) CSO Squad, (1) Patrol Sedan and (1) Patrol SUV.
Justification
These vehicle(s) are needed to replace existing vehicle(s) that have either surpassed life expectancy or will be re-purposed to replace other vehicles that have surpassed their life expectancy. All vehicles being replaced meet the vehicle replacement guidelines for Qualifies for Replacement. A new Community Service Vehicle (CSO) will be purchased and the current CSO vehicle will be re-purposed for use by our Citizens Police Academy (CPA) group. The CPA's current vehicle (which is a retired CSO squad) will be sold. Two new patrol vehicles will be purchased and the current patrol vehicles will be re-purposed to a Cadet vehicle and a Investigations vehicle. The current Cadet vehicle and Investigation vehicle meet the vehicle replacement guidelines for Qualifies for Replacement. These two vehicles will also be sold. Expenditures FY'19 FY'20 FY'21 FY'22 FY'23 or > Total
Total $136,460.00 $239,000.00 $365,760.00 $243,307.00 $352,780.00 $1,337,307.00
Funding Sources
Capital Fund
General Fund
Vehicle Fund $136,460.00 $239,000.00 $365,760.00 $243,307.00 $352,780.00 $1,337,307.00
Water & Sewer Fund
Other - Vendor Financed
Total $136,460.00 $239,000.00 $365,760.00 $243,307.00 $352,780.00 $1,337,307.00
Operational Impact/Other
Under the "hot seat" program vehicles will spend an expected four (4) to five (5) years as a front line patrol vehicle and then is retired or transitions to administrative use for up to three (3) years. The projected cost associated with squad purchases beyond FY '19 reflect a 2.5% to 5% increase per year. The current vehicle utilized by the Citizens Police Academy is a retired CSO vehicle and the maintenance costs will out value the vehicle. Future fiscal years include a K-9 vehicle and 2 additional Patrol vehicles due to growth in the personnel and the Department's desire to provide additional services to police operations. Over the last four fiscal years, the Vehicle Maintenance budget has been reduce from $51,650 to $34,600 (33% reduction). This reduction is mainly due to a reduction in the cost to repair mechanical issues with the fleet which in comprised of newer vehicles. None of the changes in the FY19 request will increase the size of the fleet which is currently at 29 vehicles.
DRAFT
64
101
Village of Oswego - Community Investment Plan
Project Information
Title Project 2018 KW 3 Yard Dump Truck
Account #
Location Fleet
Department Public Works
Type Vehicle
New to CIP Yes
Prepared BY A. Bavuso
Useful Life 15 Years
Project Snapshot
Description
T300 Series Truck with Dump Body, Plow, Anti-Ice Tanks and Salt Spreader
Justification
The PW is requesting the purchase of an Medium Duty Dump Truck with Dump Body, Plow, Anti-Ice Tanks and Salt Spreader. This vehicle will be capable of moving large amounts of snow during the winter months as well as providing essential day to day PW operations year round. Unlike the PW's large 5-Yard dump trucks primary used for snow removal and stored during the warmer months with little use. This vehicle can be utilized for several village tasks such as but not limited to cold patching, barricade delivery, dirt and sod restoration, landscaping and hauling materials. Currently, the Village owns four Class 8 trucks manufactured by Paccar as the vehicle listed above would be the fifth. Owning trucks of the same manufacture will lower maintenance costs by having the ability to stock the same commonly used parts that can be installed on several Village owned vehicles. This vehicle replaces PW10, a 2004 Sterling Acterra with a Condition III (qualifies for replacement).Expenditures FY'19 FY'20 FY'21 FY'22 FY'23 or > Total
Vehicles $150,000.00 $150,000.00
Total $150,000.00 $150,000.00
Funding Sources
Capital Fund
General Fund
Vehicle Fund $150,000.00 $150,000.00
Water & Sewer Fund
Other - Vendor Financed
Total $150,000.00 $150,000.00
Operational Impact/Other
We propose to begin replacing the PW's aging fleet with new, multi-purpose trucks capable of being utilized all year round. Medium duty trucks have the same snow removing capability as the larger trucks as well as the versatility of the smaller Village owned vehicles. In return, the Village can utilize vehicles for multiple roles eliminating the need to purchase vehicles that are only utilized during the winter months. Replacing PW10 can reduce maintenance cost by $3,000 per year. Currently, PW10 serves the Village as a back-up plow truck and 1010 gallon anti-icing tanker truck. If we do not realign and replace vehicles, the Village faces a diminished anti-icing program as well as no reserve plow truck if PW10 was to break-down during the winter months.
DRAFT
65
102
Village of Oswego - Community Investment Plan
Project Information
Title Project Public Work Vehicles and Equipment
Account #
Location
Department Public Works
Type Vehicle
New to CIP Yes
Prepared BY A. Bavuso
Useful Life 9-12 Years
Project Snapshot
Description
Justification
The Public Works Department uses vehicles and equipment for day to day operations as well as specialty needs. These vehicles are needed to replace existing ones that have surpassed life expectancy. The vehicles and equipment being replaced have met the criteria for vehicle replacement. FY'19 vehicle replacement has its own sheet,Expenditures FY'19 FY'20 FY'21 FY'22 FY'23 or > Total
Total $404,000.00 $261,000.00 $160,000.00 $351,000.00 $1,176,000.00
Funding Sources
Capital Fund
General Fund
Vehicle Fund $404,000.00 $261,000.00 $160,000.00 $351,000.00 $1,176,000.00
Water & Sewer Fund
Other - Vendor Financed
Total $404,000.00 $261,000.00 $160,000.00 $351,000.00 $1,176,000.00
Operational Impact/Other
Public Work vehicles and equipment are used to perform day to day operations as well as performing special needs such as snow, tree and leaf removal. The equipment and vehicles have reached, or will be reaching their useful life span and require replacement. In order to keep vehicles from becoming used beyond repair or having limited to no salvage value, it is crucial to have vehicles and equipment replaced when they reach Condition III (qualifies for replacement) criteria.
DRAFT
66
103
Village of Oswego - Community Investment Plan
Project Information
Title Project 2019 Smart Trailer
Account #
Location 3525 Route 34
Department Police
Type
New to CIP No
Prepared BY Chief Jeff Burgner
Useful Life 5-7 Years
Project Snapshot
Description
Message board/speed trailer to be utilized to display public service messages as well as conduct speed/traffic studies.
Justification
Currently the Department has a radar trailer purchased in FY99 and a message board/speed trailer purchased in FY14. The 1999 radar trailer does not have the ability to conduct speed/traffic studies and is no longer serviceable due to age. Replacement parts have become unavailable and the 1999 trailer is no longer functioning.Expenditures FY'19 FY'20 FY'21 FY'22 FY'23 or > Total
Equipment $17,000.00 $20,000.00 $37,000.00
Total $17,000.00 $20,000.00 $37,000.00
Funding Sources
Capital Fund
General Fund
Vehicle Fund $17,000.00 $20,000.00 $37,000.00
Water & Sewer Fund
Other - Vendor Financed
Total $17,000.00 $20,000.00 $37,000.00
Operational Impact/Other
The need for two message board/speed trailers will increase due to a rising need for this equipment. Traffic complaints traditionally rise with population increases and the potential for an increase in the number of special events exists. The Village currently processes over eighty special event permits per year many of which provide use of a message board trailer. These two issues will increase the need to have the ability to deploy more than one trailer at different locations during a single special event or have them functioning separately for separate issues. Without these trailers, staff will not be able to provide a portable messaging system to warn motorists of safety concerns or other important messages. The Department would need to rely on other jurisdictions to borrow this equipment which may not be available during our time of need.
DRAFT
67
104
Village of Oswego - Community Investment Plan
Project Information
Title Project Booster Station 2
Account #
Location 1580 US Route 34
Department Public Works
Type
New to CIP Yes
Prepared BY Zachary T. Jardine
Useful Life 15-20 Years
Project Snapshot
Description
Booster Station 2 was built in 1987. It has one 50 gpm pump and two 900 gpm pumps to feed water to the high zone from the mid zone.
Justification
The Village has two wells (wells 7 and 9) providing water to the high pressure zone. When one of these wells is taken out of service for maintenance, the Village can supplement the available water in the zone by pushing water uphill from the medium zone by using Booster Station 2. We inspected this station in the fall of 2017 and identified required repairs to ensure this station will work. The repairs include replacement of the inoperable Variable Frequency Drive (VFD). The VFD allows the pump to adjust the volume of water based upon demand, thereby allowing a consistent pressure in the system. Without the VFD, the pump will either be in an on-or-off condition. The Station is located in the Kendall Point subdivision.Expenditures FY'19 FY'20 FY'21 FY'22 FY'23 or > Total
Equipment $130,000.00 $130,000.00
Total $130,000.00 $130,000.00
Funding Sources
Capital Fund
General Fund
Vehicle Fund
Water & Sewer Fund $130,000.00 $130,000.00
Other - Vendor Financed
Total $130,000.00 $130,000.00
Operational Impact/Other
The VFD improvements will restore both manual speed operation and automatic control. These improvements will provide a reliable backup between the mid and high pressure zones in the event that one or both of the wells in the high zone are out of service. Well #9 is the next well to be pulled for scheduled maintenance. If the repairs are delayed the risk of having low water pressure and no means to fill the Ogden Falls water tower in the high zone increases.
DRAFT
68
105
Village of Oswego - Community Investment Plan
Project Information
Title Project Engineering for Sanitary Lift Stations Generators
Account #
Location Lift Stations
Department Public Works
Type Lift Station Improvement
New to CIP Yes
Prepared BY Timothy A. Zasada
Useful Life 20+ years
Project Snapshot
Description
Engineering to install generators at 6 lift stations to provide emergency power during power interruptions.
Justification
In the event of a power loss from ComEd, the sanitary lift stations will be unable to pump sewage. Installing generators at these sites will allow all facilities to pump sewage under emergency conditions when the regular power supply is interrupted. Completion of this project will result in capital improvement projects that are not currently budgeted.Expenditures FY'19 FY'20 FY'21 FY'22 FY'23 or > Total
Engineering $75,000.00 $75,000.00
Other
Total $75,000.00 $75,000.00
Funding Sources
Capital Fund
General Fund
Vehicle Fund
Water & Sewer Fund $75,000.00 $75,000.00
Other - Vendor Financed
Total $75,000.00 $75,000.00
Operational Impact/Other
Should the lift stations fail without emergency generators on site, the sanitary system will begin to fill and may back up into the service lines and homes triggering violations of IEPA regulations. One options is the use of a portable generator for isolated power outages; this option will not be useful in a large scale power outage or catastrophic event. Using a rental company is an option but does not guarantee the availability when the generators are needed. The use of a contractor with vacuum tank trucks can be time consuming and not an efficient option because the trucks need to go to the interceptor to dump and return to the lift station. Phase two engineering will include each individual lift station design and construction. Postponement of this project maintains the existing risk.
DRAFT
69
106
Village of Oswego - Community Investment Plan
Project Information
Title Project Generator Well #3 and Well #4
Account #
Location 340 South Madison (3), 401 Chicago Road(4)
Department Public Works
Type Water & Sewer Improvement
New to CIP No
Prepared BY Timothy A. Zasada
Useful Life 20+ years
Project Snapshot
Description
Install generators at Wells 3 and 4 to provide emergency power during power interruptions.
Justification
In the event of a power loss from Com-Ed, these wells will be unable to supply water to the water distribution system. Installing generators at these sites will allow both wells to operate In an emergency. Providing water for drinking, cooking and sanitary purposes, along with fire suppression. IEPA inspected the Village water system in 2014 and recommended installing generators at all well sites. In 2015, used generators were installed at Wells 6 and 7. We propose to install used generators at Wells 3 and 4.Expenditures FY'19 FY'20 FY'21 FY'22 FY'23 or > Total
Equipment $400,000.00 $400,000.00
Engineering $50,000.00 $50,000.00
Total $450,000.00 $450,000.00
Funding Sources
Capital Fund
General Fund
Vehicle Fund
Water & Sewer Fund $450,000.00 $450,000.00
Other - Vendor Financed
Total $450,000.00 $450,000.00
Operational Impact/Other
Well 3 and the associated Village Center Tower are located in the low zone. When power is lost to this well, water can flow from the middle zone (west of the river) to provide needed water pressure. A catastrophic failure to the 12" water main that crosses the river and if well 3 is not able to run, then Village Center tower would fill from the middle zone east of the river from the 6 pressure reducing stations provided the these stations have power. Well 4 is located in the middle zone and does not have an associated tower. When power is lost at Well 4, we supply water to this area from either the combination of Wells 7 & 9 or Wells 8 & 10. As our water system continues to expand, the ability of these wells to maintain pressure in the area around well 4 will diminish. The risk of system failure increases over time as the system ages.
DRAFT
70
107
Village of Oswego - Community Investment Plan
Project Information
Title Project Minkler Rd Water Main
Account #
Location Minkler Road
Department Public Works
Type Water Main
New to CIP No
Prepared BY Timothy A. Zasada
Useful Life 50+ Years
Project Snapshot
Description
Install a new 12" water main (7,500') along Minker Road to provide a loop to the Hunt Club subdivision. This project is scheduled to start in FY 2023.
Justification
Currently there is only one 12" water main that feeds Hunt Club subdivision. This new 12" water main along Minkler Road will alleviate a potential situation if the water main that feeds Hunt Club needs to be shut down for repair or if a catastrophic event happens that damages the current water main. The current 12" water main that feeds Hunt Club and any future development northwest of Well #10 tower is a dead end water main. For better water quality and pressure, this water main should be looped and tied into the rest of the water system. This project should be completed in conjunction with system improvements necessitated to distribute the new water source throughout the Village.
Expenditures FY'19 FY'20 FY'21 FY'22 FY'23 or > Total
Engineering $375,000.00 $375,000.00
Construction $1,650,000.00 $1,650,000.00
Other $300,000.00 $300,000.00
Total $2,325,000.00 $2,325,000.00
Funding Sources
Capital Fund
General Fund
Vehicle Fund
Water & Sewer Fund $2,325,000.00 $2,325,000.00
Other - Vendor Financed
Total $2,325,000.00 $2,325,000.00
Operational Impact/Other
By adding this additional water main, the Village will have a looped water system out to Hunt Club subdivision. Pricing for Engineering and Construction will need to be revaluated in 2020.
DRAFT
71
108
Village of Oswego - Community Investment Plan
Project Information
Title Project Wolf Road (Crossing) Water main
Account #
Location Wolf Road
Department Public Works
Type Water & Sewer Improvement
New to CIP No
Prepared BY Tim Zasada
Useful Life 50+ years
Project Snapshot
Description
There are several places along Wolf Road that do not have any water mains. The 2014 Water Study [page VIII-1] by HR Green recommends installing a 12" water main along Wolf Road. This project would span over two fiscal years.
Justification
The new 12" water main and connections will allow for better fire protection while improving water quality and circulation in the middle pressure zone and the southern end of the high pressure zone. This will also allow for future development that will front Wolf Road as now a 12" water main will run from Prescott Mills to Route 71. This new water main will be needed as future expansion will create higher demands on the middle pressure zone. The lead time for this project is approximately 1.5 years prior to the start of construction This project should be completed in conjunction with system improvements necessary to distribute the new water source water throughout the Village.Expenditures FY'18 FY'19 FY'20 FY'21 FY'22 or > Total
Planning/Design $695,000.00 $695,000.00
Land Acquisition $772,200.00 $772,200.00
Construction $4,324,300.00 $4,324,300.00
Total $695,000.00 $5,096,500.00 $5,791,500.00
Funding Sources
Capital Fund
General Fund
Vehicle Fund
Water & Sewer Fund $695,000.00 $5,096,500.00 $5,791,500.00
Other - Vendor Financed
Total $695,000.00 $5,096,500.00 $5,791,500.00
Operational Impact/Other
The addition of this water main and connections will make the Village's water system stronger and safer. The project should be completed in conjunction with development along Wolf Road, during the reconstruction of Wolf Road, or as an independent project based upon system needs. As of 2016, the project is forecasted to be constructed with the reconstruction of Wolf's Crossing Road. Road construction is projected to occur in 2021, which is the projected first year of road improvements. The Village's water model makes assumptions about future demand and schedules. The Village will continue to monitor development against these assumptions to confirm the timing of the main construction. Developer contributions may fund all or a portion of this project depending on timing.
DRAFT
72
109
Village of Oswego - Community Investment Plan
Project Information
Title Project Transmission Lines from Plant to Towers
Account #
Location Various
Department Public Works
Type Water Main
New to CIP Yes
Prepared BY Timothy A. Zasada
Useful Life 50+ Years
Project Snapshot
Description
Construct new water transmission mains from the new water source to existing water towers.
Justification
The Village proposes to obtain a new water supply to augment or replace the the depleting aquifer. The Village is considering two sources: the Fox River or Lake Michigan. In either scenario, the Village will need to pump water from the source connection point to water towers for distribution. The new mains need to be constructed prior to connection to the new source. Details of this capital project are yet to be developed. The total cost of $20,000,000 is an estimate provided by EEI based upon studies of the City of Yorkville and Village of Montgomery systems.Expenditures FY'19 FY'20 FY'21 FY'22 FY'23 or > Total
Construction $724,600.00 $8,400,000.00 $8,400,000.00 17,524,600
Other
Total $2,000,000.00 $9,000,000.00 $9,000,000.00 20,000,000
Funding Sources
Capital Fund
General Fund
Vehicle Fund
Water & Sewer Fund $2,000,000.00 $9,000,000.00 $9,000,000.00 20,000,000
Other - Vendor Financed
Total $2,000,000.00 $9,000,000.00 $9,000,000.00 20,000,000
Operational Impact/Other
Staff time will be required to manage this project. Construction will impact Village roads, rights-of-way, and well sites.
DRAFT
73
110
Village of Oswego - Community Investment Plan
Project Information
Title Project Water Meter and Reader Replacement
Account #
Location Village Wide
Department Public Works
Type
New to CIP Yes
Prepared BY Timothy Zasada
Useful Life 20 Years
Project Snapshot
Description
The Village has approximately 12,000 water meter accounts. In accordance with industry best practices and equipment obsolescence, Staff recommends replacing all water meters and outside readers over a five year period. We will replace 2,500 meters per year. We will contract program management, coordination with property owners, and installation.
Justification
A water meter measures the amount of water used by each account holder. As meters age, their accuracy declines resulting in non-revenue water loss. Some of the current water meters have been in service for 10-15 years and have reached the end of their useful lives. Replacing old meters improves revenue recovery. The vendor for the existing outside transmitters will no longer be producing these after December 31, 2016. These outside transmitters send the meter readings remotely to a central data collection point, relieving the Village of having to send personnel to read each meter. Not only is production of the outside transmitters ending, but a number of the current outside transmitters are reaching the end of their service life as their battery dies. This program will also replace the outside transmitters with new transmitters that read the new meters.Expenditures FY'19 FY'20 FY'21 FY'22 FY'23 or > Total
Total $1,725,750.00 $1,256,750.00 $1,256,750.00 $1,246,750.00 $5,486,000.00
Funding Sources
Capital Fund
General Fund
Vehicle Fund
Water & Sewer Fund $1,725,750.00 $1,256,750.00 $1,256,750.00 $1,246,750.00 $5,486,000.00
Other - Vendor Financed
Total $1,725,750.00 $1,256,750.00 $1,256,750.00 $1,246,750.00 $5,486,000.00
Operational Impact/Other
Updated meters will increase accuracy with water meter billing and also increase revenue. Once this project is complete, meter reading staff can be utilized to other Public Works activities.
DRAFT
74
111
Village of Oswego - Community Investment Plan
Project Information
Title Project Fox Chase Tower Rehabilitation
Account #
Location 245 Lennox Rd
Department Public Works
Type Water & Sewer Improvement
New to CIP No
Prepared BY Timothy A. Zasada
Useful Life 15-20 Years
Project Snapshot
Description
Inspect, repair, and paint the 300,000 gallon water tower. This water tower was built in 1992 and was repainted in 2007. The exterior will be high pressure cleaned with water to remove any delamination or flaking coating followed by spot power tool cleaning to bare metal with vacuum attachments for any rusted or failed areas. By cleaning the exterior of the tank this way, no containment curtain will be needed. The interior of the tower will be abrasive blast cleaned and then repainted.
Justification
Repairs and repainting is necessary to reduce any further deterioration of the tower. Water towers are focal points of the Village, and failure to keep them in good shape reflects poorly upon the community and undermines the message that our water is safe to drink.Expenditures FY'19 FY'20 FY'21 FY'22 FY'23 or > Total
Planning/Design $50,000.00 $50,000.00
Construction $700,000.00 $700,000.00
Total $750,000.00 $750,000.00
Funding Sources
Capital Fund
General Fund
Vehicle Fund
Water & Sewer Fund $750,000.00 $750,000.00
Other - Vendor Financed
Total $750,000.00 $750,000.00
Operational Impact/Other
The rehabilitation will save on more expensive repairs in subsequent years to the tower. The estimated cost is based upon historical project costs for similar towers. The schedule is based upon installation dates and estimated maintenance schedules. The need for repairs will be evaluated annually based on the exterior condition of the tank. Some minor rust spots have surfaced and are cause for concern and may require repairs before the interior wet is due for repainting.
DRAFT
75
112
Village of Oswego - Community Investment Plan
Project Information
Title Project Hunt Club Water Tower Rehabilitation
Account #
Location Hunt Club
Department Public Works
Type Water & Sewer Improvement
New to CIP No
Prepared BY Timothy A. Zasada
Useful Life 15-20 Years
Project Snapshot
Description
Inspect, repair, and repaint the 1,500,000 gallon water tower. This tower was constructed in 2005. The exterior will be high pressure cleaned with water to remove any delamination or flaking coating followed by spot power tool cleaning to bare metal with vacuum attachments for any rusted or failed areas. By cleaning the exterior of the tank this way, no containment curtain will be needed. The interior of the tower will be abrasive blast cleaned and then repainted. It is also recommended to have a mixing system installed to optimize water quality in this large tank at an estimated cost of $100,000. The mixing system circulates the water in the tank to ensure disinfection throughout the tank all year long.
Justification
Repairs and repainting is necessary to reduce any further deterioration of the tower. Water towers are focal points of the Village, and failure to keep them in good shape reflects poorly upon the community and undermines the message that our water is safe to drink.Expenditures FY'19 FY'20 FY'21 FY'22 FY'23 or > Total
Planning/Design $50,000.00 $50,000.00
Construction $850,000.00 $850,000.00
Equipment $100,000.00 $100,000.00
Total $1,000,000.00 $1,000,000.00
Funding Sources
Capital Fund
General Fund
Vehicle Fund
Water & Sewer Fund $1,000,000.00 $1,000,000.00
Other - Vendor Financed
Total $1,000,000.00 $1,000,000.00
Operational Impact/Other
The rehabilitation will save on more expensive repairs in subsequent years to the tower. The estimated cost is based upon historical project costs for similar towers. The schedule is based upon installation dates and estimated maintenance schedules. The water tower is showing signs of the coating system failing. Rust is beginning to show at the crown of the tower. At 15 years old, the tower will need an engineering inspection to evaluate the overall condition and repairs that need to be done. A full blasting of the paint may be needed.
DRAFT
76
113
Village of Oswego - Community Investment Plan
Project Information
Title Project Village Center Water Tower Rehabilitation
Account #
Location Village Center
Department Public Works
Type Water & Sewer Improvement
New to CIP No
Prepared BY Timothy A. Zasada
Useful Life 15-20 Years
Project Snapshot
Description
Inspect, repair, and repaint the 500,000 gallon water tower.
Justification
Repairs and repainting is necessary to reduce any further deterioration of the tower. Water towers are focal points of the Village, and failure to keep them in good shape reflects poorly upon the community and undermines the message that our water is safe to drink.Expenditures FY'19 FY'20 FY'21 FY'22 FY'23 or > Total
Planning/Design
Construction
Equipment $625,000.00 $625,000.00
Total $625,000.00 $625,000.00
Funding Sources
Capital Fund
General Fund
Vehicle Fund
Water & Sewer Fund $625,000.00 $625,000.00
Other - Vendor Financed
Total $625,000.00 $625,000.00
Operational Impact/Other
The rehabilitation will save on more expensive repairs in subsequent years to the tower. The estimated cost is based upon historical project costs for similar towers. The schedule is based upon installation dates and estimated maintenance schedules. The water tower is showing signs of the coating system failing. Rust is beginning to show at the crown of the tower. At 15 years old, the tower will need an engineering inspection to evaluate the overall condition and repairs that need to be done. A full blasting of the paint may be needed.
DRAFT
77
114
Village of Oswego - Community Investment Plan
Project Information
Title Project Water Tower Tank Cleaning
Account #
Location Various Locations
Department Public Works
Type
New to CIP No
Prepared BY Zach Jardine
Useful Life Five years
Project Snapshot
Description
Cleaning the exterior of all water towers in the Village to remove mold and mildew and treat to prevent future growth.
Justification
The design of a water tower creates a perfect environment for mold and mildew to grow. The bottom bowl section of any water tower is cloaked in a shadow, and almost always moist. In the summer the tank is warmed by the sun, while the water inside the tower is typically around 55 degrees, causing condensation to form. Airborne dirt and dust clings to the condensation and creates the unsightly "dirty" look. Mold and mildew will continue to grow because the underside of the bowl blocks the sun and the underside never dries out. Over time the mildew stains keep the painted surface moist and cause the painted surface to to crack, peel and flake that will eventually leave rust marks on the surface of the tank. Tower cleaning is proposed for five-year intervals commencing in FY'23 (last done in FY'18).Expenditures FY'18 FY'19 FY'20 FY'21 FY'22 or > Total
Maintenance $45,000.00 $45,000.00
Total $45,000.00 $45,000.00
Funding Sources
Capital Fund
General Fund
Vehicle Fund
Water & Sewer Fund $45,000.00 $45,000.00
Other - Vendor Financed
Total $45,000.00 $45,000.00
Operational Impact/Other
Cleaning the water towers will prevent maintenance costs in subsequent years and extend the longevity of the painted surface. This maintenance cleaning of the towers could possibly delay painting of a tower a couple of years from the current schedule. This will need to be evaluated on an annual basis.
DRAFT
78
115
Village of Oswego - Community Investment Plan
Project Information
Title Project Water Treatment Facility
Account #
Location Orchard Road Area
Department Public Works
Type Improvement
New to CIP No
Prepared BY Tim Zasada
Useful Life 50+ Years
Project Snapshot
Description
This new 5 million gallon per day (MGD) water treatment facility will extract water from the Fox River. The project includes construction of an intake structure or shallow well. The project requires installation of 3 new Booster Stations. The water treatment for this water source will be different than the treatment for the existing wells. Further explanation on this facility is in the Water Model Report on page VIII-2 . The Opinion of Probable Costs is based upon 2014 costs (see Table VIII-3 on page VIII-3).
Justification
The "Groundwater Studies for Water Supply Planning in Kendall County, IL", prepared by the Illinois State Water Survey in 2014, concludes that the aquifers in northern Kendall County are becoming depleted. The Strategic Plan Objective 4.1.6 (Research and Consider Alternative Water Sources) makes use of the study in determing alternative water sources. As pointed out in the study, aquifers in northern Kendall County could be dewatered by the year 2050. Further impacts by drilling deep wells and drawing from the existing aquifer will expedite this dewatering. The plant is anticipated to be required when Village population reaches 80,000. The plant could be justified if a consortium of communities can band together to build the plant. Expenditures FY'19 FY'20 FY'21 FY'22 FY'23 or > Total
Total $1,767,450.00 $1,767,450.00 25,097,500 28,632,400
Funding Sources
Capital Fund
General Fund
Vehicle Fund
Water & Sewer Fund $1,767,450.00 $1,767,450.00 25,097,500 28,632,400
Other - Vendor Financed
Total $1,767,450.00 $1,767,450.00 25,097,500 28,632,400
Operational Impact/Other
The operational impact of this new Treatment Facility will be more costly to construct and build and to operate than the existing wells. During drought conditions the existing wells would need to be utilized to provide the majority of the drinking water. But long term this Treatment Facility will lessen the impacts to the existing aquifers. The project will take approximately 3 years from the start of design to the start of construction.
DRAFT
79
116
Village of Oswego - Community Investment Plan
Project Information
Title Project Water Treatment Plant - Preliminary Engineering
Account #
Location To Be Determined
Department Public Works
Type Water & Sewer Improvement
New to CIP No
Prepared BY Jennifer Hughes
Useful Life 10+ Years
Project Snapshot
Description
Perform governance review, land acquisition, and Fox River water quality testing for a future water treatment facility. The Oswego's share is estimated to be 48% based upon the Sub-Regional Water Supply Study completed in 2016. The Village of Montgomery and the United City of Yorkville will be responsible for their pro-rated share of the costs. Governance Review - $60,000 (Village share $28,800) over two years beginning in FY'18 (carried over from FY'18). Land Acquisition - $800,000 (Village share $384,000) including professional services in FY'19 (carried over from FY'18). Fox River Water Quality Testing - $15,000 per year (Village share $7,200) for three years beginning in FY'19
Justification
The "Groundwater Studies for Water Supply Planning in Kendall County, IL", prepared by the Illinois State Water Survey in 2014, concludes that the aquifers in northern Kendall County are becoming depleted. The Strategic Plan Objective 4.1.6 (Research and Consider Alternative Water Sources) makes use of the study in determining alternative water sources. As pointed out in the study, aquifers in northern Kendall County could be dewatered by the year 2050. Further impacts by drilling deep wells and drawing from the existing aquifer will expedite this dewatering. In 2016, The Villages of Oswego and Montgomery and the United City of Yorkville studied the feasibility of constructing a facility to serve all three communities. This CIP project secures the land prior to development, obtains the permit from IEPA to ensure the Village can take water from the Fox River, and formalizes the governance structure for facility construction.Expenditures FY'19 FY'20 FY'21 FY'22 FY'23 or > Total
Total $845,000.00 $45,000.00 $15,000.00 $905,000.00
Funding Sources
Capital Fund
General Fund
Vehicle Fund
Water & Sewer Fund $405,600.00 $21,600.00 $7,200.00 $434,400.00
Other - Vendor Financed $439,400.00 $23,400.00 $7,800.00 $470,600.00
Total $405,600.00 $21,600.00 $7,200.00 $905,000.00
Operational Impact/Other
The Village cannot fail to obtain a second source of water to guard against de-watering of the aquifer. Advance planning for a treatment facility will allow the Village to secure land prior to others seeking to develop it.
DRAFT
80
117
Village of Oswego - Community Investment Plan
Project Information
Title Project Sanitary Sewer Lining
Account #
Location Various Locations
Department Public Works
Type Inspection Program
New to CIP Yes
Prepared BY Tim Zasada/Zachary Jardine
Useful Life 50 years
Project Snapshot
Description
Line sanitary sewer pipes in-situ to eliminate inflow and infiltration.
Justification
A proactive sanitary sewer inspection program prioritizes corrective actions such as debris removal, grease and/or root abatement, repair, and replacement prior to sanitary overflows and backups. Sanitary sewers where known inflow and infiltration problems occur are televised to determine whether pipes can be lined to eliminate these problems. In spring 2013, the Village of Oswego and Fox Metro Water Reclamation District signed an intergovernmental agreement allowing the Village to utilize Fox Metro's contractor and keep costs down to improve the sanitary system. By utilizing this contractor to line the sanitary lines the root foaming costs will be eliminated and inflow and infiltration will be eliminated. Expenditures FY'19 FY'20 FY'21 FY'22 FY'23 or > Total
Total $80,000.00 $80,000.00 $80,000.00 $80,000.00 $80,000.00 $400,000.00
Funding Sources
Capital Fund
General Fund
Vehicle Fund
Water & Sewer Fund $80,000.00 $80,000.00 $80,000.00 $80,000.00 $80,000.00 $400,000.00
Other - Vendor Financed
Total $80,000.00 $80,000.00 $80,000.00 $80,000.00 $80,000.00 $400,000.00
Operational Impact/Other
The sanitary sewer inspections occur each year in selected areas. Postponing this project will mean that the Village will incur costs to pump at lift stations stormwater that enters the sanitary sewers. Inflow and infiltration can lead to system backups and overflows.
DRAFT
81
118
Village of Oswego - Community Investment Plan
Project Information
Title Project Lead Service Line Replacement
Account #
Location Various
Department Public Works
Type Water Main
New to CIP Yes
Prepared BY Timothy A. Zasada
Useful Life 50+ Years
Project Snapshot
Description
Replace lead water service lines. The exact number of service lines to be replaced and the cost of replacement will be determined in future years based upon an inventory to be performed by the Village. For budgeting purposes, assume 5 lead water service lines will be replaced per year for ten years at a cost of $10,000 per service line.
Justification
Homes built prior to 1986 may have lead service lines. Lead can enter the drinking water supply as these pipes corrode. Lead can cause developmental disabilities, particularly in children who are exposed to it. The state and federal Environmental Protection Agencies are contemplating adoption of regulations to require municipal water suppliers to replace lead water service lines. This project anticipates such requirements.Expenditures FY'19 FY'20 FY'21 FY'22 FY'23 or > Total
Engineering
Construction $50,000.00 $50,000.00 $50,000.00 $350,000.00 $500,000.00
Other
Total $50,000.00 $50,000.00 $50,000.00 $350,000.00 $500,000.00
Funding Sources
Capital Fund
General Fund
Vehicle Fund
Water & Sewer Fund $50,000.00 $50,000.00 $50,000.00 $350,000.00 $500,000.00
Other - Vendor Financed
Total $50,000.00 $50,000.00 $50,000.00 $350,000.00 $500,000.00
Operational Impact/Other
This project will require staff to conduct an inventory of lead service lines and oversee the replacement program. There are more than 11,000 water service lines within Oswego, of which staff estimates 50 are lead lines.
DRAFT
82
119
Village of Oswego - Community Investment Plan
Project Information
Title Project Blocks 4 & 5 Public Improvements
Account #
Location Adams, Harrison, Jackson, & Washington Streets
Department Public Works
Type Roadway / Utility Improvements
New to CIP Yes
Prepared BY Jennifer Hughes
Useful Life 20 years
Project Snapshot
Description
Reconstruct watermain, sanitary sewer, storm sewers, parking, sidewalks and roadways on Blocks 4 and 5 of the Original Oswego Subdivision. This project involves the reconstruction of Harrison, Jackson, and Adams Streets. The existing watermain will be replaced. Sanitary sewer lines will be extended to Blocks 4 & 5 to allow for redevelopment of properties in the area. Road improvements include sidewalks, street lighting, and streetscape.
Justification
The existing roads are in poor condition and provide limited on-street parking. The area does not meet subdivision regulations as no sanitary sewers serve the area. Defined pedestrian facilities do not exist. The watermain is aging and should be replaced when the road is reconstructed. Utilities will be buried as a part of this project. This project supports the Strategic Priorities for an expanded downtown, growth in residential units, and safe and efficient infrastructure. Expenditures FY'19 FY'20 FY'21 FY'22 FY'23 or > Total
Construction $176,000.00 $1,907,000.00 $1,088,000.00 $180,000.00 $510,000.00 $3,861,000.00
Other
Total $220,000.00 $2,383,000.00 $1,360,000.00 $225,000.00 $638,000.00 $4,826,000.00
Funding Sources
Capital Fund $102,000.00 $1,325,000.00 $225,000.00 $450,000.00 $2,102,000.00
Motor Fuel Tax Fund $65,000.00 $137,000.00 $830,000.00 $1,033,000.00
Vehicle Fund
Water & Sewer Fund $53,000.00 $921,000.00 $530,000.00 $188,000.00 $1,691,000.00
Other - Vendor Financed
Total $220,000.00 $2,383,000.00 $1,360,000.00 $225,000.00 $638,000.00 $4,826,000.00
Operational Impact/Other
Anticipated cost reductions for road maintenance will be offset by increased maintenance costs for streetscape improvements and snow removal. Improved roads will result in decreased wear and tear on Village vehicles.
DRAFT
83
120
Village of Oswego - Community Investment Plan
Project Information
Title Project Downtown Parking Lot
Account #
Location Block 11 - 110 S. Adams Street
Department Public Works
Type Roadway Improvement
New to CIP Yes
Prepared BY Jennifer Hughes
Useful Life 20 years
Project Snapshot
Description
Construct a parking lot on vacant village-owned property. The lot will have a18-20 spaces plus one accessible stall. Install retaining walls, fence, lights, and one neighborhood garbage collector.
Justification
This facility will provide off-street parking for approximately 18-21 vehicles. This lot will primarily serve future businesses located along Washington Street where on-street parking is prohibited by agreements with the State. The project will be constructed during or after improvements to the adjacent alley. Expenditures FY'19 FY'20 FY'21 FY'22 FY'23 or > Total
Engineering $16,000.00 $16,000.00
Construction $184,000.00 $184,000.00
Other $100,000.00 $100,000.00
Total $300,000.00 $300,000.00
Funding Sources
Capital Fund $300,000.00 $300,000.00
General Fund
Vehicle Fund
Water & Sewer Fund
Other - Vendor Financed
Total $300,000.00 $300,000.00
Operational Impact/Other
The estimated cost to seal the parking lot every three years is $800. The estimate cost to stripe the pavement markings is $100 every three years. Electricity for street lights is estimated to be less than $50/year. The estimated cost to plow the lots is $50/year if included in the cul-de-sac plow contract. Therefore, the total estimated annual cost is $400/year.
DRAFT
84
121
Village of Oswego - Community Investment Plan
Project Information
Title Project Block 11 Public Improvements
Account #
Location Btwn: Adams & Main; VanBuren & Washington
Department Public Works
Type Roadway / Utility Improvements
New to CIP Yes
Prepared BY Jennifer Hughes
Useful Life 20 years
Project Snapshot
Description
Install new watermain and sanitary sewer beneath alley connecting Main and Adams between Washington and Van Buren. Reconstruct alley. Bury overhead utility lines. Construct parking lot w/ trash compactor. All in Block 11 of the Original Town of Oswego.
Justification
The watermain is needed to provide domestic and fire service to the western edge of the block. A new sanitary sewer is required to provide service for any new development on the block. The alley needs to be reconstructed as the pavement has reached the end of its service life. Utilities will be buried as a part of this project to provide for redevelopment of the block. This project supports the Strategic Priorities for an expanded downtown, growth in residential units, and safe and efficient infrastructure. Expenditures FY'19 FY'20 FY'21 FY'22 FY'23 or > Total
Engineering $138,700.00 $138,700.00
Construction $924,600.00 $924,600.00
Other
Total $1,063,300.00 $1,063,300.00
Funding Sources
Capital Fund $834,700.00 $834,700.00
Motor Fuel Tax Fund $10,000.00 $10,000.00
Vehicle Fund
Water & Sewer Fund $218,600.00 $218,600.00
Other - Vendor Financed
Total $1,063,300.00 $1,063,300.00
Operational Impact/Other
Anticipated cost reductions for road maintenance will be offset by increased maintenance costs for streetscape improvements and snow removal. Improved roads will result in decreased wear and tear on Village vehicles. Source: EEOPC prepared by Roake Associates, Inc. 12/4/17 + 7% Design Engineering & 8% Construction Engineering.
DRAFT
85
122
Village of Oswego - Community Investment Plan
Project Information
Title Project Bridge Repairs - Barnaby, Old Post & Pearces Ford
Account #
Location Barnaby,Old Post & Pearces Ford Roadways
Department Public Works
Type Roadway Improvements
New to CIP No
Prepared BY D. Markowski
Useful Life 50 Years
Project Snapshot
Description
Repair to three bridges; Barnaby Road, Old Post Road and Pearces Ford Road. The scope of work includes minor deck repair, replacement of rip-rap, and maintenance and correction of settled pavement (by removing and reconstructing pavement, curb and gutter, and drainage structures near each structure). The scope of each project will need to be revised based upon the next bridge inspections.
Justification
HR Green conducts regular inspection of these bridges in accordance with IDOT guidelines. The bridges are in relatively good shape but do require minor maintenance to prevent more severe deterioration. This project was originally scheduled for FY2017 but has been delayed due to fiscal constraints.Expenditures FY'19 FY'20 FY'21 FY'22 FY'23 or > Total
Planning/Design $18,000.00 $18,000.00
Construction $101,000.00 $101,000.00
Engineering $8,000.00 $8,000.00
Total $18,000.00 $109,000.00 $127,000.00
Funding Sources
Capital Fund $18,000.00 $109,000.00 $127,000.00
General Fund
Vehicle Fund
Water & Sewer Fund
Other - Vendor Financed
Total $18,000.00 $109,000.00 $127,000.00
Operational Impact/Other
Future inspection dates: Bridge Inspection: 047- 6302 - Old Post Road over Waubonsee creek Due April 16,2020 Bridge Inspection: 047 - 6304 - Pearces Ford over Waubonsee Creek Due April 16, 2018 Bridge Inspection: 047 - 6303 - Barnaby Drive over Waubonsee Creek Due March 29, 2021 The bridges will continue to deteriorate due to delays in the project. By delaying the inspections, costs to do minor repairs may escalate into major repairs.
DRAFT
86
123
Village of Oswego - Community Investment Plan
Project Information
Title Project New Traffic Signal
Account #
Location Galena Road at South Concord Drive
Department Public Works
Type Roadway Improvement
New to CIP Yes
Prepared BY Jennifer Hughes
Useful Life 20 years
Project Snapshot
Description
Village share of the construction of a new traffic signal at the intersection of Galena Road and South Concord Drive.
Justification
The Intergovernmental Agreement between the Villages of Oswego and Montgomery, dated March 26, 2001, requires the Village of Oswego to pay 50% of the cost of traffic signals along the shared boundary. The Village of Montgomery will pay the other 50% share. Montgomery anticipates commencing design in the spring of 2018 with construction to follow. Expenditures FY'19 FY'19 FY'20 FY'21 FY'22 or > Total
Engineering $50,000.00 $50,000.00
Construction $250,000.00 $250,000.00
Other
Total $300,000.00 $300,000.00
Funding Sources
Capital Fund $150,000.00 $150,000.00
General Fund
Vehicle Fund
Water & Sewer Fund
Other - Vendor Financed $150,000.00 $150,000.00
Total $150,000.00 $300,000.00
Operational Impact/Other
The Village will be responsible for 50% of future electrical and maintenance costs.
DRAFT
87
124
Village of Oswego - Community Investment Plan
Project Information
Title Project US RT 34 Village Share of IDOT Rd Reconstruction
Account #
Location Rt. 34 from W. Village limits to Orchard Road
Department Public Works
Type Roadway Improvement
New to CIP No
Prepared BY Jennifer Hughes
Useful Life 50+ years
Project Snapshot
Description
This project is the Village's cost share of a project to be constructed by the Illinois Department of Transportation. IDOT will install traffic signals, lighting, sidewalks/bike paths, emergency vehicle preemption devices and utility relocations along IL US 34.
Justification
IDOT initiated this project to improve US 34 from IL 47 to Orchard Road/Minkler Road; (FAP Route 591), State section 13C & 13 R & T; State job number: C-93-011-10; Contract No. 66884. The Village approved resolution 15-R-29 authorizing an Intergovernmental Agreement with IDOT on April 21 2015. The agreement obligates the Village to pay approximately $283,000. Based upon the progress to date, the project will be approximately 75% complete at the end of FY'18.Expenditures FY'19 FY'20 FY'21 FY'22 FY'23 or > Total
Construction $71,000.00 $71,000.00
Total $71,000.00 $71,000.00
Funding Sources
Capital Fund $71,000.00 $71,000.00
General Fund
Vehicle Fund
Water & Sewer Fund
Other - Vendor Financed
Total $71,000.00 $71,000.00
Operational Impact/Other
IDOT let this project in November 2015. Due to utility delays, IDOT began clearing right-of-way in November 2016. Construction started in early 2017 and is anticipated to continue through the summer of 2018. The Village is obligated to make installment payments in an amount of the total Village cost multiplied by the percentage of the contractor's invoice of the whole contract amount. The budget is based upon IDOT's estimate. Payments will be made based upon bid prices.
DRAFT
88
125
Village of Oswego - Community Investment Plan
Project Information
Title Project US 30-Village Share of IDOT Improvements
Account #
Location Route 30 at Treasure Rd / Harvey Road
Department Public Works
Type Roadway Improvement
New to CIP No
Prepared BY Jennifer Hughes
Useful Life 50 years
Project Snapshot
Description
This project is the Village's share of cost of a project to be constructed by the Illinois Department of Transportation. IDOT will install traffic signals and Emergency Vehicle Preemption devices at the intersection of U.S. 30 and Treasure Drive. IDOT will close Harvey Road at US 30 and construct a cul-de-sac on Harvey Road.
Justification
IDOT initiated this project to improve US 30 at Treasure Road and at Harvey Road; (FAP Route 349), State section 16-N-1; State job number: C-91-101-16; Contract No. 62B68. The Village approved resolution 17-R-89 authorizing an Intergovernmental Agreement with IDOT on October 3, 2017. The agreement obligates the Village to pay approximately $283,000.Expenditures FY'19 FY'20 FY'21 FY'22 FY'23 or > Total
Construction $21,000.00 $21,000.00
Total $21,000.00 $21,000.00
Funding Sources
Capital Fund $21,000.00 $21,000.00
General Fund
Vehicle Fund
Water & Sewer Fund
Other - Vendor Financed
Total $21,000.00 $21,000.00
Operational Impact/Other
The intersection improvements will increase maintenance costs to the Village for the traffic signals and other devices by approximately $4,000 per year. The Village will need to pay to relocate the water mains within the project to avoid conflicts. The timing of this project will be driven by IDOT. IDOT anticipates a January 2018 letting for this project. Work will start shortly thereafter. The Village is obligated to make installment payments in an amount of the total Village cost multiplied by the percentage of the contractor's invoice of the whole contract amount. The budget is based upon IDOT's estimate. Payments will be made based upon bid prices.
DRAFT
89
126
Village of Oswego - Community Investment Plan
Project Information
Title Project Wolfs Crossing Road Recon.-Segment 1
Account #
Location Wolf's Crossing Road
Department Public Works
Type Roadway Improvement
New to CIP No
Prepared BY Jennifer Hughes
Useful Life
Project Snapshot
Description
Reconstruction of Wolf's Crossing Road to a five (5) lane cross section from US Route 34 to US Route 30. Reconstruction will include six (6) four leg intersections. The project may be constructed in five (5) segments. Phase 1 engineering will start in 2015/2016 for all projects. This project is for the construction of segment 1. Segment From To Design Row Construction 1 Harvey Eola 2018 2019 2019 2 Roth Harvey 2021 2022 2023 3 Fifth Roth 2024 2025 2026 4 Douglas Fifth 2027 2028 2029 5 US 34 Douglas 2030 2031 2032
Justification
The proposed project will improve east/west traffic flow through the community. This project is identified in the Village's May 2012 Transportation Plan prepared by Baxter & Woodman. Phase 1 engineering (concept, environmental) will be completed for all segments under a separate project. Phase 2 engineering creates the design. Phase 3 engineering inspects the construction.Expenditures FY'19 FY'20 FY'21 FY'22 FY'23 or > Total
Total $150,000.00 $954,000.00 $324,000.00 12,874,000 14,302,000
Funding Sources
Capital Fund $150,000.00 $477,000.00 $162,000.00 11,013,000 11,802,000
General Fund
Vehicle Fund
Water & Sewer Fund
Other - Vendor Financed $477,000.00 $162,000.00 $1,861,000.00 $2,500,000.00
Total $150,000.00 $477,000.00 $162,000.00 11,013,000 14,302,000
Operational Impact/Other
The proposed roadway section for Wolf's Crossing is a four-lane urban cross section composed of two 12 foot travel lanes in each direction and a 21 foot landscaped median. The parkways will consist of a 5 foot sidewalk on the north side of the road and a 10 foot bicycle path on the south side of the road within a proposed 120 foot wide right-of-way. 10 foot wide public utility easements will be adjacent to the roadway right-of-way. Lighting will be installed in the proposed parkways. The Village may acquire needed right-of-way through dedications associated with development. The cost estimate is updated by Benesch from the Village's May 2012 transportation plan (Baxter & Woodman). The total project cost is shown. The project may be broken up into logical sections. IDOTwill conduct a transportation study in 2014 to confirm the need for the project. The project is anticipated to utilize $2.5M of Federal funding under the Surface Transportation Program. In 2015, the Village will partner with IDOT and additional stakeholders to study the corridor. IDOT will pay 80%, Oswego will pay 20% but will ask additional stakeholders to contribute.
72
DRAFT
127
Village of Oswego - Community Investment Plan
Project Information
Title Project Wolfs Crossing Road Recon.-Section 2
Account #
Location Wolf's Crossing Road
Department Public Works
Type Roadway Improvement
New to CIP No
Prepared BY Jennifer Hughes
Useful Life
Project Snapshot
Description
Reconstruction of Wolf's Crossing Road to a five (5) lane cross section from US Route 34 to US Route 30. Reconstruction will include six (6) four leg intersections. The project may be constructed in five (5) segments. Phase 1 engineering commenced for the entire corridor in August 2016. Segment From To Design Row Construction 1 Harvey Eola 2018 2019 2019 2 Roth Harvey 2021 2022 2023 3 Fifth Roth 2024 2025 2026 4 Douglas Fifth 2027 2028 2029 5 US 34 Douglas 2030 2031 2032
Justification
The proposed project will improve east/west traffic flow through the community. This project is identified in the Village's May 2012 Transportation Plan prepared by Baxter & Woodman. Phase 1 engineering (concept, environmental) will be completed for all segments under a separate project. Phase 2 engineering creates the design. Phase 3 engineering inspects the construction.Expenditures FY'19 FY'20 FY'21 FY'22 FY'23 or > Total
Engineering $383,000.00 $383,000.00
Land Acquisition $198,000.00 $198,000.00
Construction $5,171,000.00 $5,171,000.00
Total $383,000.00 $198,000.00 $5,171,000.00 $5,752,000.00
Funding Sources
Capital Fund $383,000.00 $198,000.00 $5,171,000.00 $5,752,000.00
General Fund
Vehicle Fund
Water & Sewer Fund
Other - Vendor Financed
Total $383,000.00 $198,000.00 $5,171,000.00 $5,752,000.00
Operational Impact/Other
The proposed roadway section for Wolf's Crossing is a four-lane urban cross section composed of two 12 foot travel lanes in each direction and a 21 foot landscaped median. The parkways will consist of a 5 foot sidewalk on the north side of the road and a 10 foot bicycle path on the south side of the road within a proposed 120 foot wide right-of-way. 10 foot wide public utility easements will be adjacent to the roadway right-of-way. Lighting will be installed in the proposed parkways. The Village may acquire needed right-of-way through dedications associated with development. The cost estimate is updated by Benesch from the Village's May 2012 transportation plan (Baxter & Woodman). The total project cost is shown. The project may be broken up into logical sections. IDOT will conduct a transportation study in 2014 to confirm the need for the project. The Village apply to utilize Federal funding under the Surface Transportation Program. The STP pays for 80% of the project costs with a local match of 20%. In 2015, the Village will partner with IDOT and additional stakeholders to study the corridor. IDOT will pay 80%, Oswego will pay 20% but will ask additional stakeholders to contribute.
73
DRAFT
128
Village of Oswego - Community Investment Plan
Project Information
Title Project Annual Resurface Project
Account #
Location Various Streets
Department Public Works
Type Roadway Improvements
New to CIP No
Prepared BY Jennifer Hughes
Useful Life 20 years
Project Snapshot
Description
Each year's project includes the removal of the surface course, sub grade patching, installation of a new surface course, curb repairs, installation of handicap ramps and pavement markings. Repair of concrete pavement may include joint repairs and sealing. We propose to repair various alleys in the downtown area in FY'19.
Justification
The Village conducted pavement analysis in the fall of 2014. We rated each pavement segment based upon surface and subsurface condition, ride ability, potholes and other elements. The roads are selected for resurfacing in particular years based upon the rating; deterioration since last rating and proximity to adjacent projects including resurfacing, utility improvements and drainage improvements.Expenditures FY'19 FY'20 FY'21 FY'22 FY'23 or > Total
Construction $69,000.00 $176,000.00 $1,780,000.00 $1,780,000.00 $1,780,000.00 $5,585,000.00
Other $120,000.00 $120,000.00 $120,000.00 $360,000.00
Total $75,000.00 $200,000.00 $2,000,000.00 $2,000,000.00 $2,000,000.00 $6,275,000.00
Funding Sources
Capital Fund $1,400,000.00 $1,400,000.00 $1,400,000.00 $4,200,000.00
General Fund
Vehicle Fund
Moter Fuel Tax Fund $75,000.00 $200,000.00 $600,000.00 $600,000.00 $600,000.00 $2,075,000.00
Other - Vendor Financed
Total $75,000.00 $200,000.00 $2,000,000.00 $2,000,000.00 $2,000,000.00 $6,275,000.00
Operational Impact/Other
The Village passed a sales tax increase of 0.75% in 2015 to generate revenue for street repairs. Failure to resurface streets in a timely manner will result in roads having to be reconstructed to replace failed base course. The cost to replace a road is approximately 6 times more than to resurface the same road.
74
DRAFT
129
Draft
VILLAGE OF OSWEGO, IL
FISCAL YEAR MAY 1, 2018– APRIL 30, 2019
DRAFT BUDGET
1 2/23
130
Draft
Principal Officials
VILLAGE PRESIDENT
Gail Johnson (Term Expires April 2019)
VILLAGE TRUSTEES
Pam Parr
Ryan Kauffman (Term Expires April 2021)
(Term Expires April 2019)
Luis Perez
Karen McCarthy-Lange
(Term Expires April 2021)
(Term Expires April 2019)
Judy Sollinger
Joe West (Term Expires April 2021)
(Term Expires April 2019)
MANAGEMENT STAFF
Dan Di Santo Village Administrator
Rod Zenner Community Development Director
Christina Burns Assistant Village Administrator/ Human Resource Director
Corinna Cole Economic Development Director
Tina Touchette Village Clerk
Jennifer Hughes Public Works Director
Mark Horton Finance Director/Village Treasurer
Jeff Burgner Police Chief
Officials and Staff may be contacted at: [email protected] or 630/554-3618
The Government Finance Officers Association of the United States and Canada (GFOA) presented a Distinguished Budget Presentation Award to the Village of Oswego, Illinois for its annual budget for the fiscal year beginning May 1, 2017. In order to receive this award, a governmental unit must publish a budget document that meets program criteria as a policy document, as an operations guide, as a financial plan and as a communications device. This award is valid for a period of one year only. We believe our current budget continues to conform to program requirements, and we are submitting it to GFOA to determine its eligibility for another award.
3 2/23
132
Draft
READER’S GUIDE TO UNDERSTANDING THE BUDGET
The various sections of the budget are described here to assist the reader in understanding this complex budget document. BUDGET MESSAGE This is a message about the challenges, opportunities and uncertainties the Village faces in preparing the annual budget. The message highlights the Village’s budget priorities and the principles adhered to in developing the budget. GOALS AND PLANS This section contains a copy of the Village’s long-term, entity-wide goals and the current Strategic Plan. VILLAGE OVERVIEW The Village Overview section gives general information about the Village of Oswego, including location, history, demographics, community economics, and organizational charts. BUDGET OVERVIEW The Budget Overview section includes descriptions of the Village’s fund structure and basis of accounting, summarizes the financial management policies, details the overall budget process and gives a basic understanding of how the Village creates and presents a budget and provides detailed explanations of the major revenue sources and financial trends of the Village. BUDGET SUMMARIES The Budget Summaries present the Village’s Budget in table and chart form. The Village presents this financial information in several different ways and compares current year information to prior years in order to gain a better understanding of the flow of funds and to note significant changes year after year. This section contains information on staffing levels and changes in fund balances for each of the Village’s funds. CAPITAL PLANNING & DEBT A summary of the Capital Improvement Program (CIP) is included within this section. A summary of the first five years of capital projects is listed by project category. Each capital project that is categorized as significant and non-routine will have a detailed explanation of the project by fund and will specify its impact on the Operating Budget. The budget for the Capital Improvements Program is developed and presented separate from the Operating Budget. The section also includes financial details on current debt obligations, including the effects of existing debt on current operations. FUNDS & DEPARTMENTAL BUDGETS Budget Narratives are included by fund, then department, then division, if applicable. Each fund, as well as each department/division within each fund, will have a budget narrative. These narratives start with a description of the department/division, historical staffing levels, analysis of the upcoming Budget, current challenges/issues, prior year accomplishments, goals and objectives for the current year budget. It also shows performance measures for the specific department. The goals for each division will reflect the linkage to the Village’s strategic goals, if applicable. APPENDIX The Appendix of this document includes a copy of the Ordinance Adopting the Village Budget, the annual compensation disclosure required by State Statute and a statistical section, a glossary, a list of common acronyms used in this document.
4 2/23
133
Draft
Table of Contents INTRODUCTION Principal Official ...................................................................................................................2 Distinguished Budget Award ................................................................................................3 Readers Guide .......................................................................................................................4 Table of Contents ..................................................................................................................5 BUDGET MESSAGE and BUDGET HIGHLIGHTS ...............................................................8 VILLAGE GOALS AND PLANS Long Term Goals and Objectives ........................................................................................19 Strategic Plan .......................................................................................................................20 Strategic Plan Update January 16, 2018…………………………………………………. 31 VILLAGE OVERVIEW History and Community Profile ..........................................................................................37 Village Organizational Chart……………………………………………………………...41 Corporate Organizational Chart ........................................................................................42 Building and Zoning Organizational Chart .......................................................................43 Community Development Organizational Chart ...............................................................44 Community Relations Organizational Chart .....................................................................45 Economic Development………………………………………………………………….46 Finance Organizational Chart ............................................................................................47 Information Technology ....................................................................................................48 Police Organizational Chart ..............................................................................................49 Public Work……………………………………………………………………………...50 BUDGET OVERVIEW Fund Structure and Basis of Accounting and Budgeting ....................................................51 Financial Management Policies ...........................................................................................56 Budget Process, Budget Structure ………………………………………………………..62 Major Revenue Descriptions/Analysis ................................................................................66 Revenue and Expenditure Trends ........................................................................................68 BUDGET SUMMARIES Budget Year Comparison Summary-All Funds ..................................................................82 Revenues and Expenditures-All Funds ...............................................................................83 Revenues and Expenditures by Type-Across All Funds .....................................................85 Revenue History by Fund ....................................................................................................87 Expenditure History by Fund ..............................................................................................94 Summary of Fund Balances and Unrestricted Net Assets .................................................100 Summary of Positions and Personnel Changes .................................................................104 Summary/History of Staffing by Function Graph .............................................................105 Summary of Staffing by Full-Time Equivalents ...............................................................106 CAPITAL PLANNING AND DEBT Capital Improvement Plan (CIP) .......................................................................................110 Debt Guidelines, Summary of Debt Issuance and Outstanding Debt ...............................118
5 2/23
134
Draft
FUNDS AND DEPARTMENTAL BUDGETS General Fund Fund Summary ..................................................................................................................123 Revenue Summary ............................................................................................................124 Expenditure Summary by Department ..............................................................................125 Expenditures by Type-All Departments ............................................................................126 General Government Expenditures Corporate Department Summary ..................................................................................................127 Department Expenditures ............................................................................................130 Building and Zoning Department Summary ..................................................................................................137 Department Expenditures ............................................................................................140 Community Development Department Summary ..................................................................................................145 Department Expenditures ............................................................................................148 Economic Development Department Summary ..................................................................................................150 Department Expenditures ............................................................................................156 Community Relations Department Summary ..................................................................................................160 Department Expenditures ............................................................................................161 Finance Department Summary ..................................................................................................167 Department Expenditures ............................................................................................169 Information Technology Department Summary ..................................................................................................174 Department Expenditures ............................................................................................176 Police Department Summary ..................................................................................................180 Department Expenditures ............................................................................................185 Public Works Department Summary ..................................................................................................191 Department Expenditures ............................................................................................197 Motor Fuel Tax Fund Organization Summary ............................................................................................................212 Fund Summary ........................................................................................................................214 Tax Increment Financing Fund Organization Summary ............................................................................................................215 Fund Summary ........................................................................................................................216 Debt Service Fund Organization Summary ............................................................................................................217 Fund Summary ........................................................................................................................219
6 2/23
135
Draft
Capital Improvement Fund Organization Summary ............................................................................................................221 Fund Summary ........................................................................................................................223 Water and Sewer Fund Organization Summary ............................................................................................................224 Fund Summary ........................................................................................................................229 Revenue Summary ..................................................................................................................230 Expense Summary ...................................................................................................................231 Water and Sewer Capital Fund Organization Summary ............................................................................................................241 Fund Summary ........................................................................................................................243 Garbage Collection Fund Organization Summary ............................................................................................................244 Fund Summary ........................................................................................................................245 Vehicle Fund Organization Summary ............................................................................................................246 Fund Summary ........................................................................................................................247 Pensions Police Officers’ Pension Fund Organization Summary ......................................................................................................248 Fund Summary ..................................................................................................................249 APPENDIX Budget Adoption Ordinance .................................................................................................... NA Employee Compensation Disclosure .......................................................................................250 Statistical Data……………………………………………………………………………….253 Assessed Value and Estimated Actual Value of Taxable Property ...................................254 Property Tax Rates – Per $100 of Assessed Valuation .....................................................255 Principal Property Taxpayers ............................................................................................256 Property Tax Levies and Collections ................................................................................257 Direct and Overlapping Sales Tax Rates ...........................................................................258 Demographic and Economic Information .........................................................................259 Principal Employers ..........................................................................................................260 Full-Time Equivalent Positions………………………………………………………….261 Operating Indicators ..........................................................................................................262 Capital Asset Statistics ......................................................................................................263 Acronyms ................................................................................................................................264 Glossary ...................................................................................................................................267
7 2/23
136
Draft
February 16, 2018 Village Residents Village President and Village Board of Trustees Village Administrator Staff is pleased to present the Fiscal Year 2019 Village of Oswego Annual Budget. The Annual Budget serves as the spending authority for the fiscal year beginning on May 1, 2018 and ending April 30, 2019. The Village operates under the Municipal Budget Act as defined under Illinois Compiled Statutes. The Budget estimates both revenues and expenditures/expenses for the fiscal year providing the legal level of control at the Fund level. A budgetary system of monitoring and control has been established to ensure accountability and budgetary compliance. The Fiscal Year 2019 Annual Budget was created in accordance with the Village’s Mission Statement; It is our mission to responsibly grow our community and maintain the public’s trust. We do this through the innovative and collaborative delivery of public services that meet the community’s quality of life expectations.
The budgets of all Funds and departments are based on the goals and objectives outlined in the Village Strategic Plan. The Strategic Plan is the driving force for development of the budgets along with Citizen’s requests and Village Board initiatives. Budget Factors/Assumptions/Planning Many different factors and assumptions are discussed during the course of creating the annual Budget. Every department head must use the knowledge they possess and a look to the future in crafting their respective budget. They also must look to accomplishing the objectives and goals of the Village Strategic Plan and any short term initiatives gleaned from the Village Board. The challenge for all of us is identifying funding to allow for all of these objectives and goals to be included in the annual budgets. Some of the many factors and assumptions used in developing the annual budgets are listed here; Factors;
Revenues must exceed expenditures in the General Fund Use only available funding for capital infrastructure improvements Maintain/improve current service levels with sufficient staffing levels Improve economic development and residential growth within the Village Financial sustainability and planning for the future Emphasis on becoming more efficient and economical in providing Village
services Assumptions used throughout the budget process were;
• Local economic activity and the global economy • Expanding local growth in residential housing, economic development and
population increases within the Village and surrounding municipalities • Existing revenue sources and the Village Board’s willingness to look at new
sources of revenue • State of Illinois financial problems and concerns of reductions in state shared
revenues • Long term capital planning funding for Village infrastructure
Keeping expenditures within the revenue streams on an annual basis puts an even greater emphasis on estimating revenues for the budget. The rebounding local economic activity, renewed growth/interest in residential building tempered by the uneasiness with State shared revenues has kept conservative revenue estimates for the Budget. Department budget requests were reduced to keep revenues exceeding expenditures in operating Funds. The various revenue sources were derived based on historical trend data kept on specific sources of revenue, current year to date receipts and knowledge on the current/future economic environment. Expenditure budgets are compiled from worksheets submitted from department heads based on historical patterns, adjustments for new programs and annual line item adjustments. Local Economy/Development The local economy definitely played a part in establishing the Fiscal Year 2019 Budget as sales tax revenues have been virtually at the same level the past three fiscal years. Building of new residential homes and commercial buildings has not increased but continues at the same pace of about 60 new homes per year. Building related revenues are budgeted at approximately 33% of the revenue received in FY 2015. The Village lowered the building fees charged to developers in 2017 to spur construction but has yet to see substantial results. However, better days are ahead. Several development projects in 2017 have the village hopeful for a strengthening local economy for the year ahead; including the Redevelopment agreement for a $64 million mixed use residential/commercial/public parking deck project located in the downtown, a craft brewery opening in April, 2018 in the downtown, the restarting of several dormant residential developments, a new apartment complex in the planning approval phase and several new business openings including Longhorn Steakhouse, O’Reilly Auto Parts Store and Burlington Coat Factory. Current Fiscal Year Accomplishments The Village Board and Village staff accomplished much over this fiscal year achieving many of the goals set out in the 2017 Strategic Plan. A brief list of fiscal year 2018 accomplishments includes;
Issued General Obligation Refunding Bonds in the amount of $5.0 million to refund the General Obligation Bonds, Series 2009 realizing a Net Present Value Savings of $262,000.
Environmental Phase I engineering was completed for the Wolfs Crossing Road improvements. This two lane rural roadway will be reconstructed to a 4 or 5 lane fully improved roadway.
$1.1 million in roadway improvements were completed during the fiscal year. Completed phase 1-Financials implementation of the Enterprise Resource Planning System
and began phases 2, 3 and 4 implementations. Redevelopment Agreement approved for a $64 million mixed use
residential/commercial/public parking deck development in the downtown. Launched the GoOswego Regional Positioning Plan marketing the Village as a destination
place. Village Board completed efforts to connect with the community by reaching out to the public
through Community Conversations (meetings around the Village).
The completion of all these listed items and many more accomplishments during the year show the resolve of the Village Board in getting things done for the betterment of the Community. Challenges and Issues Revenues are the number one challenge for the Village. The majority of revenue sources for operations are received from some type of tax revenue. 72% of the Village General Fund revenue is distributed through the State of Illinois supporting all the services provided to the residents. The State of Illinois continues into a third year with no realistic plan to get Illinois’ finances to a positive outlook. The State’s financial position has put a burden on local governments and all governmental entities. Changes to State sales tax revenues, pension reform, workers compensation reform, property tax freezes, state shared revenue distribution formulas and may other ideas are on the table for consideration every year in the State Legislature. These potential changes to the Village revenue sources are worrisome and affects the revenue budget from showing any growth year over year. Any reduction in the distribution of these state
9 2/23
138
Draft
shared revenues would have a serious consequence to current Village operations and subsequent year’s operations. Without these shared revenues, the Village would have to implement more local taxes, increase the property tax levy (if the State doesn’t pass a property tax freeze) and/or reduce expenditures and reduce capital improvements. The Village completed the update to the Village Comprehensive Plan in the summer of 2015 which details a number of exciting and promising opportunities to make the Village a popular destination place. The challenge is finding the means to move forward with these visions and making them a reality. The balance of planning for these projects with financing them will be a great achievement and may require some public private partnerships to see them through. Future Village infrastructure improvements outlined in the Capital Improvement Plan (CIP) is another huge challenge for the Village. The costs of future capital projects will require the Village to determine the best way to pay for them without putting too much of a burden on the local taxpayers. Responding to this challenge, the Village Board increased the local sales tax rate by three quarters of a percent effective January 1, 2016 and implemented a 4 cent per gallon Local Motor Fuel Tax in October, 2017 to generate revenue to use towards capital infrastructure improvements. $13.2 million in infrastructure improvements and capital replacements is included in the FY 2019 Budget. The Village does have some significant high cost projects identified for years 5 through 20 in the CIP which will need funding. Downtown development projects will require the Village to use the next two to three years of designated capital improvement funding for infrastructure improvements related to the developments. Long term discussions continue on an annual basis to determine how to plan/fund for all of the projects. Future development within the Village will be expected to contribute towards the completion of some of the capital improvements. Residential growth slowed over the past two fiscal years but has shown stronger signs recently. There are a number of builders interested in properties within the Village. Anticipation of new growth is welcomed as it should increase the revenue streams but at the same time places additional burden on existing services and staffing. The Village will determine when staffing should be increased by comparing the costs of outsourcing services to the private sector with the costs of providing the service by the Village. Sharing services with neighboring communities is a focus for the Village of Montgomery, United City of Yorkville and the Village of Oswego. A shared Purchasing Manager was hired in FY 2017 and a shared Facility Manager is expected to be hired in FY 2018. The new employees are employed by the Village of Oswego with half of the total costs of the positions reimbursed by the United City of Yorkville. Priorities for this year in preparing the Budget were to:
maintain and improve the current service levels and programs for the residents; budget capital infrastructure improvements up to the amount of available funding; assess the information technology for the Village; implement the new Enterprise Resource Planning System; and find efficiencies in existing operations.
Financial Reporting and Long Term Planning The Village President and Board of Trustees together with the Village Administrator have always encouraged and insisted upon complying with the highest standards of excellence in planning and conducting the financial operations of the Village. The audited Comprehensive Annual Financial Report has received fifteen (15) consecutive Certificates of Achievement for Excellence in Financial Reporting from the Government Finance Officers Association (GFOA). The “Residents Annual Financial Report” for the year ending April 30, 2017 received the GFOA Award for Outstanding Achievement in Popular Annual Financial Reporting for second consecutive year. In addition, the Village received the GFOA’s Distinguished Budget Award for the fourteen (14) straight years for the Fiscal Year 2018 Annual Budget. The Fiscal Year 2019 Annual Budget complies with the high standards established by this program and will be submitted to the GFOA Award Program.
10 2/23
139
Draft
The Finance Department creates a Five-Year Financial Forecast based on the latest fiscal year Budget. This year’s Forecast will be discussed with the Village Board and staff in June, 2018 to determine the sustainability of Village operations. Looking out five years provides the opportunity to adjust and refocus the prioritization of established goals and objectives. Issues regarding service levels for operations, capital improvements and community needs are identified and reviewed focusing on funding availability. The Financial Forecast will be available for review on the Village website www.oswegoil.org as soon as it is completed. The Capital Improvement Plan (CIP) is updated and adopted annually with the Village Budget. The CIP provides the long term view of expenditures associated with upcoming village improvements to roadways, vehicles/equipment, water/sewer infrastructure and other major Village projects. Funding is always of special focus to determine the projects which are approved for the first five years of the Plan as well as significant costly projects identified beyond the first five years. The complete CIP is available on the Village website; www.oswegoil.org . Downtown economic development projects had a major effect on the use of capital funding for FY 2019. The determination was made to reallocate funding from the Annual Road Program to the downtown development improvements. The downtown area has the worst road conditions in town, while the remaining Village roadways are in good condition and will be able to endure the two year delay. The reallocation of funding does impact the Village’s long term planning process due to other projects being pushed back to subsequent years. The Strategic Plan has three financial initiatives which all impact long term planning and future budgets. All of the financial reporting, financial forecasting and capital planning had an effect preparing the current year and subsequent year’s budgets. The desire to maintain expenditures within the revenue streams becomes a balancing issue for the Village Board and Village Staff as approved capital projects reduce the amount of funding available for improving and expanding general department operating budgets. Acknowledgments The preparation of the Fiscal Year 2019 Annual Budget could not have been accomplished without the efficient and dedicated services of the Village Administrator, Village Department Heads and the Finance Department staff. I would like to express my sincere appreciation to the Village President and Village Trustees and the Village Administrator who encourage and insist upon the highest standards of excellence in planning and conducting the financial operations of the Village. Please do not hesitate to contact me if you have any questions on the Village Budget or any of the financial reports we prepare. Respectfully submitted,
Highlights of the Fiscal Year 2019 Village Budget Fiscal Year 2019 Budget Overview The Budget has projected total revenues of $38.5 million compared to total expenditures of $47 million. $12 million is included in the expenditures of the Capital Improvement Fund for the construction of the new police headquarters (funded from bond proceeds) and other improvements causing the total expenditures to exceed the total revenues. Revenues The following table shows the Revenues for all Funds. Total revenues for all funds are 11% greater than the Fiscal Year 2018 budget amount and 5% greater than the Fiscal Year 2018 projected amounts. The Water & Sewer Capital Fund and Vehicle Fund have the largest area of increases in revenue due to increased transfer amounts from other Funds.
Comparing Fiscal Year 2018 Budget amounts with Fiscal Year 2017 Projected amounts;
Tax Increment Financing Fund revenue is 82% higher as more tax increment is expected. Capital Improvement Fund revenue is 5% greater because of the Local Motor Fuel Tax
implemented in October, 2017. Water & Sewer Fund revenue is 16% greater because of the increases in usage rates and
corresponding receipts from billing. Water & Sewer Capital Fund revenue is up $1.3 million from the transfer of money from
the Water & Sewer Fund. Vehicle Fund revenue has increased as more vehicle replacements are budgeted and
increased transfers from other Funds. Police Pension Fund revenue is 39% less than FY 2018 projected totals. Strong
investment returns in FY 2018 are the reason for the Fiscal Year 2019 Budget being less than current year projections. We do not budget for the market value changes with the investments due to the variability year to year causing the projection to be greater than budget.
The following chart shows the Village’s total revenues for all Funds classified by type of revenue for Fiscal Year 2019. For FY 2019, Taxes are the largest revenue source accounting for 55% of total revenues. Tax revenues are comprised of state shared taxes, locally imposed taxes and property taxes. Charges for Services are the second largest revenue source accounting for 25% of the total revenues. The
FUNDFY 2017
ACTUALFY 2018
BUDGETFY 2018
PROJECTEDFY 2019
BUDGET
General 17,011,166 17,697,406 17,098,543 17,907,814 5% 1%
Motor Fuel Tax 890,607 853,300 855,358 855,758 0% 0%
TOTAL REVENUES 68,496,163 34,613,922 36,542,072 38,510,292 5% 11%
REVENUES - ALL FUNDSFY 2019 Budget
vs FY 2018 Projected Budget
12 2/23
141
Draft
Village’s enterprise funds account for 93% of the total Charges for Services revenues. Tax revenues and Charges for Services revenues combined account for 80% of the entire Village’s revenues.
The majority of the Village’s revenue sources are elastic revenues which are dependent on the economy and will increase with growth in the local and national economy. Property tax revenue is the one major revenue source which is not elastic and controlled by the Village Board. The Village Board determines the annual amount of property tax levied on property located within the Village. The Village Board has the option to increase the annual property tax levy to alleviate any future revenue shortfalls. Expenditures The Fiscal Year 2019 budget has total expenditures of $47 million compared to FY 2018 projected expenditures of $53.6 million. The decrease in expenditures is due to the lower expenditure budget for the police headquarters facility construction included in the Capital Improvement Fund.
Comparing Fiscal Year 2019 Budget amounts with Fiscal Year 2018 Projected amounts;
Motor Fuel Tax Fund budget decreased 64% or $825,000 for annual roadway improvements.
Taxes 55%
Charges for Services 25%
Licenses and Permits
1%
Grants/ Intergovernmental
3%
Fines and Forfeitures
0%
Franchise Fees 2%
Donations/ Contributions
2%
Transfers From Other Funds
12% Interest 1%
Bond Proceeds 0%
Miscellaneous 0%
FUNDFY 2017
ACTUALFY 2018
BUDGETFY 2018
PROJECTEDFY 2019
BUDGET
General 16,077,013 17,655,562 17,219,785 17,871,481 4% 1%
Motor Fuel Tax 874,260 1,162,500 934,210 337,500 -64% -71%
TOTAL EXPENDITURES 36,083,679 58,885,229 53,561,174 47,097,357 -12% -20%
EXPENDITURES - ALL FUNDSFY 2019 Budget
vs FY 2018 Projected Budget
13 2/23
142
Draft
TIF Fund expenditures are budgeted to increase due to the public infrastructure improvements beginning for two development projects.
Capital Improvement Fund budget decreased $11 million due to the police headquarters facility construction being completed.
Water & Sewer Capital Fund has increased $2.2 million due to more projects being included in the budget.
Vehicle Fund expenses have increased because of more vehicle and equipment replacements in the budget.
The following chart details the various categories for expenditures across all funds. The Village is a service provider and as expected Personnel Services combined with Insurance and Benefits account for 44% of total expenditures excluding the one-time Capital Outlay costs. Capital Outlay at 28% is the largest area of expenditure for FY 2019.
The Fiscal Year 2019 Budget includes increases/decreases to numerous line item accounts. In some cases, new line items not previously budgeted have been added or some line items have been combined with existing line items to provide better transparency with expenditures. Some major changes are listed here: General Fund
Information Technology budget up $25,000 for increases in professional services and contractual services.
Police department budget increase of $181,000 for personnel cost increases, IT Services for new CAD software and increased costs for dispatching services.
Increase in Public Works for landscaping services and reductions in Tree purchases and sidewalk repair.
MFT Fund Reduction in public improvements budget of $600,000.
TIF Fund $1.4 million increase in public infrastructure improvements
Water and Sewer Fund $113,000 decrease for engineering services. These expenses moved to Water & Sewer
Capital Fund $41,000 increase for well maintenance $87,000 decrease in debt service payments
Personnel Services 22%
Insurance and Benefits
12%
Professional Services
8%
Contractual Services
9%
Communication 1%
Professional Development
0%
Operating Supplies 1%
Capital Outlay 28%
Transfers 12%
Debt Service 9%
14 2/23
143
Draft
Individual Funds General Fund The General Fund is the largest fund of the Village accounting for all of the services provided for the residents. Police protection, public works services (street maintenance, forestry, snow plowing), building and code enforcement, economic development, planning and zoning, engineering, legal services, and general administration are accounted for in this fund. General Fund expenditures account for 38% of the total Village expenditures budget for Fiscal Year 2019. General Fund Revenues Most of the major revenues that the Village receives are allocated to this Fund. Some of the more significant revenues include the Village’s sales tax, home rule sale tax, income tax, property taxes levied to fund pensions, local food & beverage tax and utility tax revenues. The General Fund revenue budget is $17.9 million which is $0.8 million greater than the projected Fiscal Year 2018 revenue total. A number of revenue sources have increased more than those revenue sources decreasing allowing total revenues to increase above FY 2018 projected amounts. The Village Board approved a 1% Local Food & Beverage tax effective October 1, 2017 to generate additional revenue to support operations. The chart which follows shows three (3) revenue sources comprise 64% of all General Fund revenues. These three sources are sales tax, income tax and home rule sales tax.
Taxes, which account for 89% of General Fund revenues, are budgeted to increase $0.8 million compared to the Fiscal Year 2018 projected amount but are only $0.2 million greater than the FY 2018 Budget. Sales tax and income tax revenues are the two largest sources of tax revenues accounting for 39% and 20% respectively. Revenues collected by the State of Illinois and distributed to the Village account for 81% of the total tax revenues received. General Fund Expenditures The General Fund accounts for all of the expenditures for the operating organizations including corporate administration, building and zoning, community development, public works, community relations, economic development, finance, information technology and police protection. General Fund expenditures for Fiscal Year 2019 total $17.9 million compared to Fiscal Year 2018 projected expenditures of $17.2 million, an increase of $0.7 million. Expenditures are up in all departments except Corporate, Community Relations and the transfer to debt service has also decreased.
Property tax 8%
Sales tax 34%
Home rule sales tax 12%
Income tax 18%
Local Food & Beverage Tax 2%
Telecommunications 3%
Utility tax 6%
Use tax 5%
Charges for services 3%
Permits 3%
Fines & Forfeits 1% Franchise Fees
3% All other sources 2%
15 2/23
144
Draft
General Fund expenditures budgeted for Fiscal Year 2019 by category are detailed in the next chart. As expected with a governmental entity whose primary function is to provide services, personnel related costs are the largest expense. Personnel costs combined with the employer insurance and benefit costs total 70% of the total expenditures.
Professional services and Communication expenditures have increased budget amounts while Operating supplies and Transfers have the largest decreases in budget. The Motor Fuel Tax Fund is used to account for the State of Illinois motor fuel tax distributions which are restricted for specific uses. The Village uses the entire amount received to pay a portion of the debt service on roadway improvements paid for from debt issuances and the balance to pay for the Village’s annual roadway improvement program. The FY 2019 budget includes $0.1 million for the annual road program. The MFT Fund has revenues exceeding expenditures by $500,000 which will be saved for upcoming projects in the next two fiscal years. The Tax Increment Financing Fund is used to account for all the revenues and expenditures associated with the redevelopment within the established Downtown Tax Increment Financing District. The District was created in September, 2016 and redevelopment for one site is in progress with a signed Redevelopment Agreement and other sites are in discussions. The Fiscal Year 2019 budget includes $40,000 in estimated revenues and expenditures of $1.5 million for downtown infrastructure improvements on two development sites. The General Fund has loaned the TIF Fund $2,000,000 to support the expenditures. Future tax increment is intended to pay back the loan. The Debt Service Fund is used to account for the principal, interest and paying agent fees for general obligation debt issued by the Village. General Sales tax revenues and Motor Fuel tax revenues have been pledged to finance the annual debt service costs. If the pledged revenues are insufficient in any given year, then the Village is required to extend the tax levy for the respective debt issuance to insure the debt is paid. The total outstanding principal and interest at April 30, 2018 is $56.5 million. The Village has four (4) separate debt issuances outstanding which are paid out of the Debt Service Fund. Expenditures in the Debt Service Fund for Fiscal Year 2019 total $2.8 million. The reader may refer to the Financial Policies section of this document for a more detailed discussion of the Village’s outstanding debt. Capital Improvement Fund is used to account for bond proceeds, grant proceeds and development fee revenue used for the construction of municipal facilities, roads and other infrastructure improvements. Beginning in FY 2017, all general capital outlay expenditures are recorded in this Fund. $8.9 million is included in the budget for ten separate projects. Revenues of $3.9 million plus remaining bond proceeds will support all the expenditures.
Personnel costs 47%
Insurance/benefits 23%
Professional services 6%
Contractual Services 13%
Communication 2%
Professional development
1% Operating supplies 2%
Transfers 6%
16 2/23
145
Draft
Enterprise Operations The Village’s enterprise operations consist of the Water and Sewer Fund, Water & Sewer Capital Fund and Garbage Collection Fund. These three funds are accounted for as though each fund is a separate business entity. Each fund has the ability to support the funds’ expenditures by changing the rates and fees charged for providing the services of each fund. Please reference these funds in each fund’s respective section for further analysis and information regarding each Fund. Water and Sewer Fund revenues are dependent on water usage and the associated water rate calculated by the Village. A water rate study was completed in FY 2018 and the Village Board authorized rate increases annually for the next five years. The current water rate is projected to generate $5.0 million in water service charges and the sewer rate is projected to generate $ 1.3 million in Fiscal Year 2019 based on normal usage. The new water rate increases will support operations, debt service and capital improvements for the next five to seven years. Future water & sewer costs will include replacement costs (rehabilitation of existing facilities and infrastructure), as well as system expansion and a sustainable water source. Revenues are estimated to increase 26% compared to the Fiscal Year 2018 projected amount due to the rate increases. Expenses have decreased 5% compared to the Fiscal Year 2018 projected totals because of reductions in most of the expenditure categories. The Water and Sewer Fund pledges water and sewer revenues to pay the debt service for five outstanding Bond issuances and one Illinois Environmental Protection Agency loan. The total Fiscal Year 2019 debt service is $1.5 million. 24% of the estimated water and sewer revenue budget will be used to pay the debt service in Fiscal Year 2019. The total outstanding principal and interest at April 30, 2018 is $11.3 million. The reader may refer to the Financial Policies section of this document for further discussion on the Fund’s debt. Water & Sewer Capital Fund Expenses of $2.5 million exceed revenues of $0.1 million. Expenses include five improvement projects supported from reserve balances and a $1.3 million transfer from the Water & Sewer Fund. Garbage Collection Fund The Village contracts with a licensed waste hauler for the removal of trash from residents homes. The contract price is passed onto the residents who are billed bi-monthly for the service. Total revenues for Fiscal Year 2019 are $2.5 million compared to total expenses of $2.5 million. The Fund reserve balance is at 20% of expenses providing a sufficient reserve should any unexpected circumstances occur. Internal Service Fund Internal Service Funds account for the financing of goods and services provided by one department to other departments. User charges are determined and paid by the user departments to support the expenses of the Fund. Vehicle Fund This Fund was created in FY 2017 to account for all the vehicular and motorized equipment purchases to provide for a centralization of these expenses and determine an annual funding source for future purchases. The FY 2019 Budget has $0.3 million in expenses and $0.3 million in total operating transfers from the Capital Improvement Fund and Water & Sewer Fund to support the expenses. Subsequent year’s revenue will be from charges to the respective departments using the vehicles and equipment based on the annual depreciation of the respective vehicles and equipment. Police Pension Fund The Village maintains one trust fund mandated by law for the Police Officers’ pensions (other employees are covered by the Illinois Municipal Retirement Fund). The Village will contribute $1.4 million to the pension fund in Fiscal Year 2019 based on the actuarial report as of the fiscal year ending April 30, 2017. Fiscal Year 2019 revenues of $2.3 million exceed expenditures of $1.0 million. Expenditures have
17 2/23
146
Draft
increased because of annual pension increases mandated by Illinois State Law and two retirements in FY 2018. The Fund will have an estimated reserve balance at April 30, 2019 of $30.3 million or a ratio of 30:1 for paying pension benefits. The following pages provide a look at the Village’s goals/objectives, community attributes/demographics, budget policies/procedures and the financial data supporting the summary numbers provided in the preceding pages. All of this information should allow the reader to gain a good understanding of the Village and its financial operations.
18 2/23
147
Draft
Village of Oswego Long Term Goals and Objectives A Strategic Plan for the years 2017-2020 was adopted by the Village Board during Fiscal Year 2017 which involved the services of an outside consultant, employees and members of the community. The Strategic Plan provides direction for staff on what needs to be accomplished by 2020. The Strategic Plan has five strategic priorities or Long Term Goals. Under each goal is a collaboration of objectives to review in order to obtain success in reaching the long term goal.
Financial Sustainability
Pensions, diversification of revenues, sustainable revenue sources, high reliance on sales tax, Springfield issues, fee structures, financing for large capital (mega) projects
Infrastructure Maintenance and Expansion
Underground—streets, sewer, water, storm sewer, mass transit, facilities, streetscape, capital equipment-rolling stock, appropriate/timely expansion, adequate funding
Community Engagement
Greater involvement/caring, regional positioning, bond with new community, conversation—not dialogue, welcoming and engaging all groups and segments (marginalized), customer service/problem solving practices
Each long term objective is further broken down into a number of strategic initiatives which can be found in the following pages. The individual department budgets are prepared in direct correlation with the underlying initiatives associated with each Long Term Goal and the associated strategic initiatives.
19 2/23
148
Draft
VILLAGE OF OSWEGO, ILLINOIS STRATEGIC PLAN
January 2017 CENTER FOR GOVERNMENTAL STUDIES NORTHERN ILLINOIS UNIVERSITY DEKALB, ILLINOIS 60115
20 2/23
149
Draft
Janua Villag100 POswe RE: 20 Dear V On beprese The pmeasand se I also Christ Yours
Craig SenioPresid
ary 31, 2017
e of Oswego Parkers Mill ego, IL 60543
017-2020 Stra
Village Presid
ehalf of the Cnt this 2017-
plan reflects thurable resultsenior staff.
want to thantina Burns for
s truly,
R. Rapp r Associate dent, Craig Ra
ategic Plan- V
dent Johnson,
enter for Gov2020 Strateg
he organizatis. I appreciate
nk Village Admr their assista
app LLC
Village of Osw
,
vernmental Stic Plan and Su
on’s commitme the dedicat
ministrator Dance and supp
wego
tudies at Norummary Repo
ment to strated effort put
aniel Di Santoport during th
thern Illinois ort to The Vill
egic planningforth by you
o and Assistanhe process.
University, I lage of Osweg
g, and to deliv, the Board o
nt Village Adm
am pleased tgo.
vering of Trustees,
ministrator
o
21 2/23
150
Draft
Executive Summary The Village of Oswego engaged in a strategic planning process over three sessions on November 29, December 20, 2016, and January 6, 2017. The sessions yielded a draft strategic plan for the three-year period 2017-2020. The strategic plan consists of five strategic priorities, which are the highest priority issues for the next three years; a series of desired outcomes, which provide a vision of success, key outcome indicators, which will be monitored to determine success; and a set of performance targets, which define the successful outcome. The Board and senior staff engaged in two major efforts to examine their operations, and the needs and expectations of their customers. The first, an environmental scan, conducted by staff, examined the current conditions of Village operations and the external influences affecting those operations. The second was a strategic planning retreat held over two meetings—November 29 and December 20, 2016. On November 29, the leadership team began the process of developing the strategic plan. The group reviewed the environmental scan, and examined the organization’s strengths, weaknesses, opportunities and threats (SWOT analysis). They identified the major challenges facing the Village. On December 20, based upon the challenges facing the community, the group adopted a set of five strategic priorities. They then developed a set of desired outcomes, key indicators and performance targets for each priority, which established the desired performance for the next three years. On January 6, the senior management team met and developed a set of strategic initiatives. The initiatives are the projects and programs that will be necessary to achieve the outcomes identified. The Village Board reviewed the revised plan at its January 17 Committee of the Whole Meeting, providing final input. The Strategic Plan was adopted at the February 7 Regular Village Board Meeting. The strategic priorities, key outcome indicators, targets and initiatives are summarized on the following page.
22 2/23
151
Draft
Village of Oswego - Strategic Plan 2017-2020 Vision, Mission and Values
Vision Oswego will continue to be a friendly, caring, and forward-thinking community that provides a high quality of life based upon sustainable growth and a respect for our rich heritage and environment Mission It is our mission to responsibly grow our community and maintain the public’s trust. We do this through the innovative and collaborative delivery of public services that meet the community’s quality of life expectations. Values Integrity: We are honest, ethical and we honor our commitments. Accountability: We take responsibility for our actions, and are transparent in the fulfilment of our public duties Innovative: We value creative thinking and problem solving in our service to the public Pride in work performed: We value a commitment to excellence and pride in the performance of our work Community: We believe in contributing to something greater than ourselves
23 2/23
152
Draft
Village of Oswego - Strategic Plan Summary 2017-2020
Strategic Priority
Desired Outcome
Key Outcome
Indicator (KOI’s) Target
Strategic Initiatives
Financial Sustainability
FINANCE
Meet our fund balance policy in General Fund
Fiscal year fund balance-General Fund
Revenues exceed expenditures in the General Fund
a) Conduct analyses-megaprojects b) Create a revenue strategy c) Analyze programs for cost-effectiveness *focus on public engagement
Reduced reliance on sales tax
Revenue sources Sales tax reduced by __% of total revenue
Clarity on mega projects
Financial analyses Funding options identified for megaprojects by ___
Infrastructure Maintenance and Expansion
OPERATIONS
Sustainable water source
-Analyses -Project schedules
Sustainable water source connected in 2026
a) Water source decision process b) Water plan implementation c) Master plan –Wolf’s Crossing d) Funding strategy-Wolf’s Crossing e) Funding strategy-CIP f) Phase I- Metra study g) Metra lobbying strategy
Safe and efficient Wolf’s Crossing
-Analyses -Milestones, plan
Secure funding -$14M for Section 1 by 2020
Metra service to Oswego
CMAP plan project schedule
Oswego is a high priority project by 2018
Safe and efficient infrastructure
Maintenance plan CIP funding in place to meet current needs
Community Engagement
CUSTOMER
Recognized as a regional destination
RPP implementation schedule
- __% increase in online visits - _% increase in H/MT rev
a) Complete and Implement Regional Positioning Plan b) Implement tourism plan c) Develop marketing plan-Village services d) Create internal service response to citizen feedback e) Conduct community survey f) Marketing and promotion program for community events *focus on metrics
Positive public perception of services
Village survey, citizen feedback
__% increase in public satisfaction with services
Well-attended events that enhance connectedness
-Attendance -Community survey results
-__% increase in attendance /yr. -__% report feeling connected
Effective Growth and Development
GROWTH
Expanded downtown Redevelopment Agreements
- =/>Two ground-breakings by July 2019 in TIF District - _% increase in TIF
a) 59 S. Adams St. project plan b) Old Village Hall Block plan c) TIF District marketing plan d) Residential development strategy e) Economic development strategic plan
Growth in residential units
-Existing & new developments
=/> 100 new residential units under permit/year
Expand commercial investment
-Building permits -EAV
New commercial investment of $___/ year
Productive and Engaged Workforce
WORKFORCE
Staff sized to meet growing community’s needs
Workload indicators Develop a long-term projection for service delivery and staffing
a) ERP implementation- establish best practices-operating processes b) Shared services initiative c) Create leadership development program d) Conduct employee survey e) Connect strategic plan to evaluation system
Highly qualified workforce
Internal hiring rate 50% or > of non-entry level positions filled from
hEmpowered employees
Opinions/employee feedback
__% or > report feeling empowered, supported
Accountable organization
-Results achieved, bonuses, surveys
--% goals achieved
* Some targets are blank intentionally, to enable development of baseline measures
24 2/23
153
Draft
Village of Oswego Strategic Planning Process Strategic planning is a process that helps leaders examine the current state of the organization, determine a future course, establish priorities, and define a set of actions to achieve desired outcomes. The process followed by the Village of Oswego was designed to answer four key questions: (1) Where are we now? (2) Where are we going? (3) How will we get there? and (4) What will we do? Environmental Scan—Assessing the Current Environment To begin the strategic planning process, the senior staff conducted an environmental scan, which is a review of elements in the external and internal environments that impact performance. Included in the scan was a detailed review and summary of finance, operations, staffing, facilities and equipment. The scan revealed the most difficult challenges facing the Village overall, as well as in each of the departments. The scan was presented to the Village Board, and used as foundation and background for the strategic planning retreat. Strategic Plan Development—Reviewing the Environment, Setting Priorities On November 29, 2016, the leadership team—the Board of Trustees and senior staff—held the first of two meetings to develop a strategic plan. As part of the exploration of “Where are we now?” the group was challenged to define the current organizational culture and its value proposition—understanding that an organization’s culture, and the value proposition it puts forth provide the foundation for the way in which services are delivered and strategic direction is set. The group engaged in an extended discussion regarding the value proposition and its relationship to the culture. While there were a variety of different perceptions regarding the value proposition, it was generally believed that customer intimacy reflects much of the current approach, however, operational excellence is important and will continue to be important for operational stability, therefore it should be the primary value proposition, with customer intimacy as a secondary focus. The team then conducted a brief review of their Mission, Vision and Values statements. The team felt that each needed slight adjustments to reflect current reality, and they worked on new ideas for each. They brainstormed key concepts, which were used to create draft statements. The proposed statements, along with the originals, are listed below: Mission Statement (2012-2017 Strategic Plan): The Village of Oswego provides a vibrant, sustainable community, rich in heritage, prosperity and genuine partnership, for the benefit and enjoyment of present and future generations.
25 2/23
154
Draft
Brainstormed Mission Statement concepts: Partnership, collaboration, responsibly grow the community, preserving heritage, enhancing qualities of life, growing together, being innovative, building confidence, creative, imaginative, public trust Mission Statement (draft): It is our mission to responsibly grow our community, and maintain the public’s trust. We do this through the innovative and collaborative delivery of public services that meet the community’s quality of life expectations. Vision Statement (2012-2017 Strategic Plan): Governance and Municipal Services Elected officials and staff partner effectively to guide and serve our community Prospering Economy Innovative industrial, professional and commercial growth advances and sustains our economic
vitality Community Enrichment Quality development and use of public and private space, culture and entertainment make
Oswego a sought-after destination Environmental Sensibility Plans, decisions and practices are environmentally conscious and honor the natural environment Culture of Partnership People eagerly participate in community life and enjoy creating a Village that works for all Strategic Infrastructure Highly effective public facilities and modes of transportation keep pace with community needs Brainstormed Vision Statement concepts: Enlightened, friendly, engaged, thriving, diverse, successful, collaboration, responsible, sustainable, safe, caring people, respectful, curious, forward-thinking, tradition, heritage, vibrant, stewardship, playful, neighborly, optimistic, connected Vision Statement (draft): “We envision Oswego to be a friendly, caring, and forward-thinking community that provides a high quality of life based upon sustainable growth and a respect for our rich heritage.” Values (2012-2017 Strategic Plan): In Oswego, we: Demonstrate integrity, respect and goodwill Focus on the well-being of the whole community Are open-minded and listen well to the ideas, beliefs and opinions of others Trust that the intentions of others are good Are accountable, transparent and fiscally responsible Serve with dedication and unwavering commitment
engaged, pride in work, passion, community-commitment to something greater than ourselves,
results-oriented, loyalty, public service
Values (draft):
Integrity
We are honest, ethical and we honor our commitments.
Accountability
We take responsibility for our actions, and are transparent in the fulfillment of our public duties
Innovative
We value creative problem-solving and original thinking in our service to the public
Pride in work performed
We value a commitment to excellence and pride in the performance of our work
Community
We believe in contributing to something greater than ourselves
SWOT Analysis Following the mission, vision and values discussion, the group assessed the Village’s operating environment. This was done via a SWOT (Strengths, Weaknesses, Opportunities, and Threats) analysis—a process that examines the organization’s internal strengths and weaknesses, as well as the opportunities and threats in the external environment. To facilitate this, a SWOT questionnaire was distributed to all participants in advance of the planning session. The results of the questionnaire revealed the most frequently mentioned characteristics in each area: STRENGTHS Collaboration (internally/externally), Leadership (unified Board/strong management),
Crossing, natural resources—environmental conservation, Fox River, demographics THREATS Taxes, Springfield issues, transportation (lack of), growth-stagnation, water The group engaged in an exercise using the summarized SWOT data. They compared strengths with opportunities and weaknesses with threats, to determine which opportunities would
27 2/23
156
Draft
maximize strengths, and which weaknesses would be exacerbated by the threats. This crystalized the current challenges and opportunities facing the community. The results are listed below: STRENGTHS-OPPORTUNITIES (Make good things happen) Forward thinking-culture Leadership Financial stability Collaboration Infrastructure Natural resources WEAKNESSES-THREATS (Keep bad things from happening)
Staffing stretched too thin/growth stagnation—serving future growth, planning for growth
A discussion ensued regarding the two lists. A broad set of issues and challenges facing the Village emerged: ISSUES/CHALLENGES
Growth and development Infrastructure – building and paying for it Natural resources Staffing Communications—risk taking Recruitment Springfield/State Tax burden Demographic changes—challenges of diversity—embracing and welcoming Engagement-community Revenue/financial sustainability
The group agreed that to successfully address these challenges, they would need to focus and prioritize their efforts. From that discussion, a set of six Strategic Priorities emerged: STRATEGIC PRIORITIES
1. Financial Sustainability
2. Infrastructure—Maintenance and Expansion
28 2/23
157
Draft
3. Community Engagement
4. Effective Growth and Development
5. Productive and Engaged Workforce
Defining the Strategic Priorities To clarify the meaning of each priority in the context of The Village of Oswego, the group identified key concepts for each. These will be used to develop final definitions. Financial Sustainability Pensions, diversification of revenues, sustainable revenue sources, high reliance on sales tax, Springfield issues, fee structures, financing for mega projects
Infrastructure—Maintenance and Expansion Underground—streets, sewer, water, storm sewer, mass transit, facilities, streetscape, capital equipment-rolling stock, appropriate/timely expansion, adequate funding Community Engagement Greater involvement/caring, regional positioning, bond with new community, conversation—not dialogue, welcoming and engaging all groups and segments (marginalized), customer service/problem solving practices Effective Growth and Development Residential development, commercial growth, meets needs, downtown redevelopment, environmentally responsible Productive and Engaged Workforce Recruitment, retention, training, capable of meeting changing needs, succession planning/leadership training, managing outsourced services, appropriate staffing ratios, continuous improvement, competitive compensation Determining Success: Defining the Desired Outcomes, Indicators, Targets On December 20, the group defined a set of desired outcomes for each strategic priority. Once the outcomes were established, Key Outcome Indicators (KOI’s) were identified and Performance Targets were developed. KOI’s are measures that will be tracked to reveal progress toward the desired outcomes. Performance Targets define successful outcomes, expressed in measureable terms. The alignment created between Strategic Priorities, Outcomes, KOI’s, and Targets is important, not only for clarity, but also for maintaining a disciplined focus on the desired results. Implementing the Vision: Developing Strategic Initiatives and Action Plans
29 2/23
158
Draft
To successfully address the strategic priorities and achieve the intended outcomes expressed in the Targets, it is necessary to have a focused set of actions, including detailed implementation steps to guide organizational effort. The Village of Oswego will accomplish this through strategic initiatives developed for each priority. Strategic initiatives are broadly described, but narrowly focused activities that are aligned with the priorities, and targeted to the achievement of outcomes expressed in the Targets.
Strategic Planning Participants The strategic plan was developed with the hard work and dedication of many individuals. The Board, elected officials and senior staff worked collaboratively, defining a direction and a set of outcomes that are important to the Village. The entire group spent time engaged in new ways of thinking to come up with a set of plans that will help the Village successfully measure and achieve the outcomes they defined. Board of Trustees President Gail Johnson Trustees Ryan Kauffman Karin McCarthy Pam Parr Luiz Perez Judy Sollinger Joe West Senior Management Team
Village Administrator Daniel Di Santo Assistant Village Administrator Christina Burns Community Development Director Rod Zenner Community Relations Manager Michele Brown Building and Zoning Manager Jay Hoover Finance Director Mark Horton
GIS/IT Coordinator Joe Renzetti Police Chief Jeff Burgner Public Works Director/PE Jennifer Hughes Village Clerk Tina Touchette Economic Development Director Corinna Cole
Discussion on progress of the 2017-2020 Strategic Plan
BOARD/COMMISSION REVIEW:
N/A
ACTION PREVIOUSLY TAKEN:
Date of Action Meeting Type Action Taken July 18, 2017 Village Board
Meeting Semi-annual Strategic Plan Update
Feb. 7, 2017 Village Board Meeting
Adoption of a Resolution Adoption the 2017-2020 Mission, Vision, Values and Strategic Plan
December 20, 2016
Special VB Meeting Strategic Planning Workshop
October 16, 2016
Committee of the Whole
Priority Setting Refresh Workshop
June 23, 2015 Committee of the Whole
Priority Setting Workshop
DEPARTMENT: Administration
SUBMITTED BY: Christina Burns, Assistant Village Administrator
FISCAL IMPACT:
N/A
BACKGROUND:
The Village Board has conducted several priority setting workshops, culminating in the adoption of a Strategic Plan in February 2017. The first workshop was completed in June 2015, with an updated discussion in October 2016. These priorities were ranked (see attached document) and set the stage for the Strategic Plan process the Board embarked on in December 2016.
31 2/23
160
Draft
Strategic Plan Update 1/16/2018 2 | P a g e
The strategic plan that establishes priorities for 2017 through 2020. The final document defines five strategic priorities:
Financial Stability Infrastructure Maintenance and Expansion Community Engagement Effective Growth and Development Productive and Engaged Workforce
Each priority includes a range of desired outcomes, key outcome indicators, targets and strategic initiatives. The Strategic Plan Summary, as well as the Vision, Mission and Values, is attached for reference. Based on these priorities, staff developed proposed steps and timelines in order to make progress toward each strategic priority. These steps were compiled into a master spreadsheet that is periodically reviewed and updated by staff. This discussion continues our regular semi-annual update to the Board on progress on the strategic initiatives.
DISCUSSION:
Nearly one year into the strategic plan, staff has made significant progress on a number of objectives and is setting the stage for success in many other areas. With this update, staff took a comprehensive review of the tasks laid out with the adoption of the strategic plan. Over the course of the year, we have had new staff come on board and continue to respond to changes in our environment. As a result, we fully reviewed each strategic initiative, revising as appropriate. Those initiatives were updated in our master tracking spreadsheet, which includes 170 tasks in support of the plan. 103 tasks were originally due as of January 15, 2017. Of those, 61 are completed. The remaining tasks are revised, pending, ongoing or in progress. The breakdown by goal by status is as follows:
The status of each strategic priority, and key tasks completed or upcoming is outlined below Of all tasks, 62 are completed, 7 are in progress, 4 are new, 45 are not yet started, 18 are ongoing, and 29 have been revised and not yet completed. Financial Sustainability Addressing the Village’s financial sustainability was a key task in 2017. The Village made significant progress in reducing reliance on sales tax by implementing a food and beverage tax
32 2/23
161
Draft
Strategic Plan Update 1/16/2018 3 | P a g e
and a gas tax. The Board adopted these revenues because they were shared by non-residents and there is little community appetite to increase property taxes. The additional revenues will also help the Village meet its financial obligations, particular related to “mega-projects” and other necessary capital improvements in the future. Target status:
Revenues exceed expenditures in General Fund: Achieved for FY18; budget in progress for FY19
Sales tax maintained at 35% of total revenue: Projected to be 35% of total revenue. Funding options identified for megaprojects by 2020: Project ongoing.
Strategic Initiatives: Conduct analysis of megaprojects: Analysis under way; on target for 2020. Create a revenue strategy: New revenues adopted in 2017. COMPLETE Analyze programs for cost-effectiveness: Delayed due to other priorities. On track for
completion in 2018. Infrastructure Maintenance and Expansion The Strategic Plan focuses on ensuring ongoing maintenance of the Village’s infrastructure as well as planning for three key “megaprojects”: a new water source, Wolf’s Crossing and Metra. Target Status:
Sustainable water source connected by 2026. Further Lake Michigan analysis under way. Project remains on target for 2026.
Wolf’s Crossing: Secure $14 million in funding for Section 1 of Wolf’s Crossing by 2020. Phase 1 engineering for the entire project is wrapping up this winter, which is the first step for eligibility in project funding. On target for date, however funding goal may shift based on project cost and available resources.
Metra: Metra expansion to Oswego is included as a high priority project by 2018. Timeline may be delayed as staff waits for Metra’s feasibility study. Lobbying continues for inclusion into next CMAP planning document.
CIP funding in place to meet current needs: Staff annually reviews and updates the CIP to prioritize projects. Updates to be discussed and updated in conjunction with the FY2019 budget.
Strategic Initiatives: Water source decision process: Additional analysis under way. Target date for final
decision is the end of 2018. Water plan implementation: Will follow source decision. Master plan- Wolf’s Crossing: Phase 1 engineering will set the foundation for a project
master plan. Current engineering set for completion this winter. Funding strategy-Wolf’s Crossing: To follow Phase 1 engineering and project plan. Phase I-Metra Study: Currently under way. Timeline is under Metra’s authority. Metra Lobbying strategy: Delayed until Phase 1 study has progressed further.
Community Engagement Since the inception of the Strategic Plan, the Village transitioned to a new staffing model to integrate Community Relations and Economic Development. This resulted in a re-boot of
33 2/23
162
Draft
Strategic Plan Update 1/16/2018 4 | P a g e
community engagement efforts and discussion of fresh ideas to achieve this strategic initiative. This transition period also strained staff resources, resulting in some reprioritizing of community engagement initiatives. We were successful in launching the Regional Positioning Plan, and are currently planning for the Phase 2 launch. The Village continued its tradition of strong community events, even expanding Christmas Walk in 2017.
The integration of Community Relations and Economic Development has brought new perspectives to this strategic priority. Staff is exploring different strategic initiatives to better meet the outcome of Community Engagement. While staff has drafted some proposed changes to this strategic initiative (attached), we believe the plan will benefit from the input of the new Community Engagement Coordinator for events coming on shortly. A full proposed update of this initiative will be presented in the July 2018 Strategic Plan update.
Target Status:
X% increase in online visits: Will begin tracking this metric with Comprehensive Communication Plan.
X% increase in Hotel Motel revenue: May be modified based on tourism plan approach to include broader tourism metrics than hotel stays.
2% increase in public satisfaction with services: Community survey to be completed in 2018 and 2020.
X% increase in attendance per year: 2017 was intended to set a baseline: Staff recommends eliminating this goal because of logistic and cost constraints in measuring attendance in favor of new metrics that target clearer success factors, such as financial sustainability and overall perception of events.
X% report feeling connected: Based on 2018 Community Survey set for this summer. Strategic Initiatives (current)
Complete and Implement Regional Positioning Plan: Completed; launching phase 2. Implement Tourism Plan: Discussions under way with Aurora Area CVB to determine
best course of action for Oswego’s tourism effort. Develop marketing plan for Village services: Delayed due to new Community
Engagement Coordinator onboarding. Targeted to begin in 2018. Create internal service response to citizen feedback: To be incorporated in Munis’s Tyler
Incident Management system. Conductive community Survey: Budgeted for summer 2018. Marketing and promotion programs for community events: In progress; delayed due to
staff transition. Effective Growth and Development This strategic priority is the one in which the Village has made the most significant progress, though plenty of work remains. Enhancing downtown has been a key priority for the Village Board, which tremendous results over the last year.
34 2/23
163
Draft
Strategic Plan Update 1/16/2018 5 | P a g e
Target Status:
=/>Two ground breakings by July 2019 in TIF District: On pace to achieve with 59 S. Adams and development interest in old Village Hall block.
X% increase in TIF increment: Staff is still defining this target, however with projects slated to begin construction, growth in the TIF increment will naturally follow.
New commercial investment of $X/year: Current investment is focused on downtown, however Economic Development is expanding its efforts in economic sectors.
=/>100 new residential units under permit/year: 2017 did not hit the target, however with several multi-family projects in discussion, staff anticipated continued residential growth in the community over the next several years, with the goal of achieving an average of 100 residential units under permit per year.
Strategic Initiatives: 59 S. Adams project plan: Redevelopment agreement approved on schedule;
development to begin this year. Old Village Hall Block Plan: Staff recently received an engineering analysis for
necessary improvements on the block; currently working with interested developers. TIF District marketing plan: Residential development strategy: Staff is regularly reviewing fees, talking with
developers about potential impediments and pro-actively contacting developers to build interest in Oswego.
Economic development strategic plan: Timeline modified due to staffing changes. On course for completion this year.
Productive and Engaged Workforce Achieving the other strategic priorities is made possible by fostering a positive work environment that gets the most of its employees, ensuring they have the skills and resources necessary to serve the community. Target Status:
Develop a long-term projection for service delivery and staffing: Continued work with shared service ideas, as well as preparing for upcoming retirements is under way.
50% or > of non-entry-level positions filled from within: The Village is not currently on target, however we will be launching a leadership development program in the next year in order to encourage skill development and facilitate succession planning.
Strategic Initiatives: ERP implementation – establish best practices/operating process: Implementation on
schedule with appropriate analysis and documentation taking place with each module. Shared services initiatives: Regular meetings ongoing; planning for Facilities Manager
shared position beginning in Spring 2018. Create leadership development program: Planning currently under way, with program
launching in summer 2018. Conduct employee survey: Annual survey completed in August.
35 2/23
164
Draft
Strategic Plan Update 1/16/2018 6 | P a g e
Connect strategic plan to evaluation system: Goals included in FY18 performance
planning; set for review with FY18 performance review cycle. RECOMMENDATION:
Presentation and discussion of Strategic Plan progress and feedback from Village Board, as well as follow up on other discussion items from previous priority setting workshops and requested follow up items.
ATTACHMENTS:
Village of Oswego Strategic Plan Summary 2017-2020 and Mission, Vision and Values
Community Engagement draft Strategic Plan Update
2016 Priority Setting Workshop rankings
“Whatever happened to” follow up items
36 2/23
165
Draft
Village Profile
Historical Background The first permanent settlers came to the area in 1833. At the time, Waubonsee, principal war chief of the Potowatomi Indians, still lived nearby on the banks of the Fox River. In honor of the Chief, a creek that winds through the Village, an area high school and the area’s community college all share the name Waubonsee. In 1835, two businessmen platted Oswego and called the town Hudson, but the name was changed in 1837 when a post office was established. The new name, Oswego, taken from a town in the state of New York, is a Mohawk Indian word for “mouth of the stream” and refers to the Waubonsee Creek flowing into the Fox River. In 1845, the four-year-old Kendall County government was moved to Oswego, but was moved back to Yorkville in 1864 based on the desire of a more central location for the county seat. Oswego was formally incorporated as a village in 1852.
The Village first developed and prospered as an agricultural community and as a stopover point for stagecoach travelers on the Chicago-Galena Road (U.S. 34) and the Chicago-Ottawa Trail (Illinois Route 71). A dam was constructed at the crossing of the Fox River at this location and river power was used to operate a sawmill, a grain mill, brewery, creamery and other commercial activities in the Village for the first one hundred years of its existence. In 1950, the Village began benefitting from large industrial companies locating within Oswego Township. Caterpillar Tractor Company, Western Electric Company and other industries were locating in the Village of Montgomery and City of Aurora just outside the northwest border of the Village. This industrial growth stimulated residential growth within and outside of Village limits as workers were needed for the industrial plants. The unincorporated community of Boulder Hill, adjacent to the Village of Oswego to the North, was developed and is the largest unincorporated planned community in the State with a population of approximately 11,025. A small portion of this subdivision is located within the corporate limits of Oswego.
The Village of Oswego’s population was 1,220 residents as of the 1950 Census. Population increases over each of the next four decades increased the Village’s population to 3,876 residents by 1990; 13,326 by the year 2000; the 2010 Official Census put the Village’s population at 30,355. The 2016 Special Census certified the population at 33,078. The incorporated land area of the Village is approximately 14.5 square miles.
Community Profile The Village of Oswego is governed by a Village President and six Trustees elected at large to overlapping four year terms. The appointed Village Administrator is responsible for the day-to-day administration of the Village and its 110 full time employees. The first collective bargaining agreement in the Village was agreed to in FY 2010 for the Police patrol officers.
The Village Hall building opened May 2, 2008 and was constructed for $12.8 million. The building, with 30,000 square feet of finished space and 15,000 square feet of unfinished space will provide the Village with a facility that has the potential to serve as the Village Hall for well over 50 years. All
37 2/23
166
Draft
departments are housed in the Village Hall, with the exception of the Police Department and Public Works Labor force which have their own facilities.
The Police Department of the Village is located on Route 34 across the street from the Fox Bend golf course. The facility was built in 1991 and is approximately 23,000 square feet. A new Police Headquarters building is under construction with an anticipated completion of October, 2018. The 70,000 square foot building is being funded from a $30 million Bond Issuance.
The Public Works department is located in the Public Works facility in the Stonehill industrial park. The facility opened in December 2002, is 22,000 square feet and was constructed for $2.8 million. The facility is expandable to meet future growth demands and has additional vacant, Village owned land surrounding it.
The Village owns and operates a water supply system and a wastewater delivery system. The Village’s system consists of eight deep wells and six water towers that serve as storage facilities. The towers have capacities in excess of 4.5 million gallons. The Village, in conjunction with its engineering firm, plans for the increase in the systems size on a continual basis. The system currently serves approximately 11,300 water customers. Average daily consumption is approximately 2.3 million gallons. Fox Metro Water Reclamation District treats all wastewater that the Village’s wastewater delivery system transports to them. The Village has state-of-the-art equipment installed at its eight existing well sites for removing the radium (a naturally occurring radioactive particle found in ground water).
The Village of Oswego is served by the 7th largest public community school district in the State; Community Unit School District 308.
Public Education - School District 308 Type of School No. of Schools Student to teacher ratio Enrollment Early Learning Center 1 489 Elementary (K-5) 13 19 7,466 Junior High (6-8) 5 19 4,373 High School 2 20 5,445 East View Academy /GOAL 1 133 Transition Center 1 30 Outplaced 81 Total Number of Schools 23 18,017 Total Teachers
1,296
Total Employees 2,255
Waubonsee Community College District 516 serves the Village of Oswego for post secondary education. The main campus is north of the Village in Sugar Grove and there is a satellite campus just north of the Village in Aurora and to the southwest in the City of Plano. There are also three nearby four-year institutions which include Aurora University, North Central College in Naperville and Northern Illinois University in DeKalb.
38 2/23
167
Draft
The Oswegoland Park District operates park and recreational facilities in and around the Villages corporate limits. The District’s area is approximately 36 square miles and is over 993 acres. The largest amenity, Fox Bend Golf Course, (located within Village limits), covers 14 acres and is a championship sized golf course consistently rated in the top public courses in the Chicagoland area.
Recreational Facilities 60 parks 25 half court basketball courts 9 greenways 4 full court basketball courts 33 picnic areas 1 18 hole disc golf course 29 picnic shelters 160 acre 18 hole golf course 33 playgrounds 20 miles of biking and hiking trails 10 ball fields 993 acres of natural areas 11 tennis courts 1 aquatic park 9 sand volleyball courts 1 swimming pools and splash pad 2 skate parks 19 fishing areas
The Oswego Public Library District has served the Village since 1964. The Library District has two libraries serving village residents. The Library provided service to 63,000 patrons and had over 1,000,000 in circulated items. The Library is part of the Prairie Area Library System (PALS) which enables users to utilize facilities of other member libraries.
The Oswego Fire Protection District provides fire protection to Oswego’s residents. The fire district has 60 sworn firefighters/paramedics on the streets. It provides fire protection and emergency medical services to an area over 60 square miles with over 40,000 residents. The district has four fire stations and anticipates building a fifth station in the southwest portion of the District as population increases.
Oswego is a growing community, the largest municipality in Kendall County, continuing to attract new residents to enjoy the abundance of activities and services readily available. Residents enjoy the small country charm of a small rural town while having the opportunity to experience big city life when
desired. Oswego is a great place to be a resident, visit, garner employment or attend community recreational events.
Location The Village of Oswego is located approximately 50 miles southwest of the Chicago Loop in the northeast section of Kendall County at the border of the three “collar” counties: Will, Kane and DuPage. This four county area is recognized as one of the most rapidly growing regions in Illinois and the Midwest. The Village is located within a short distance of the City of Aurora and the Village of Naperville, the two largest municipalities in the metropolitan area outside the City of
39 2/23
168
Draft
Chicago. The Village of Montgomery is immediately north and adjacent to the Village of Oswego. The county seat of Kendall County, the City of Yorkville, is five miles southwest of the Village. It is strategically located at the southern end of the Fox River Valley As part of the eight-county Chicago metropolitan area, Oswego benefits from the area’s highly developed transportation network. A toll way interchange at Orchard Road and I-88 (the East-West Tollway) and the improvement and extension of Orchard road to U.S. 34 in Oswego provided an important new connection to the growing western part of the Village. Major highways, which serve the Village, include U.S. 34 (Ogden Avenue); U.S. 30; and Illinois routes 71, 25 and 31. Other north-south routes near the Village include Illinois 59 to the east and Illinois 47 to the west. Access to the nation’s interstate highway system is provided by I-88 (10 miles north of the Village), I-55 (10 miles east), and I-80 (18 miles south). O’Hare International Airport and Midway Airport are 33 and 36 miles northeast of the Village, respectively. Private and corporate aircraft are based in Aurora Airport and DuPage Airport, which are each about 35 minutes from the Village. Commuter rail service is available at Aurora’s Transportation Center northeast of the Village.
Offering a pro-business atmosphere, business incentives, and a well-educated and skilled labor workforce, Oswego is fast becoming an employment hub for manufacturing, engineering, and companies in every sector of the economy. The area is poised for growth and well suited for business success.
40 2/23
169
Draft
VILLAGE OF OSWEGO ORGANIZATIONAL CHART
Citizens of Oswego
Village President and Board of Trustees
Committees Village Clerk Village Administrator
Community Development
Director
Building and Zoning Manager
Finance Director
Asst. Village Administrator/
Human Resource Director
InformationTechnology
Public Works Director
Economic Development
Director
Police Chief Village Attorney
The Village President and Board of Trustees are the only elected positions
41 2/23
170
Draft
CORPORATE ORGANIZATIONAL CHART
Village Board(Elected)
Village Administrator
Assistant Village Administrator/Human
Resources Director
H.R. Generalist Information Technology Manager Purchasing Manager
Exec. Asst. to the Village Administrator
Village Clerk
Deputy Clerk
42 2/23
171
Draft
BUUILDING AAND ZONIN
Buildi
Bu
Plu
Co
Bu
A
NG ORGANI
ing and ZoManager
Chief BuildiInspector
uilding Inspe
umbing Insp
ode EnforcemOfficer
uilding & ZoAssistant
AdministratAssistant
IZATIONAL
oning
ing r
ector
pector
ment
oningt
ivet
L CHART
43 2/23
172
Draft
COMMUNITY DEVELOPMENT ORGANIZATIONAL CHART
Community Development Director
Staff Planner Chief Infrastructure Inspector
Building & Zoning Assistant
44 2/23
173
Draft
COMMUNITY RELATIONS ORGANIZATIONAL CHART
Economic Development Director
Community Engagement Coordinator-Marketing
Community Engagement Coordinator-Special
Events
45 2/23
174
Draft
ECONOMIC DEVELOPMENT ORGANIZATIONAL CHART
Economic Development
Director
46 2/23
175
Draft
FINANCE ORGANIZATIONAL CHART
Finance Director
Assistant Finance
Director
Staff Accountant
Finance Assistant/Accounts
Payable
Utility Billing
Coordinator
Administrative
Assistant
47 2/23
176
Draft
INFORMATION TECHNOLOGY ORGANIZATIONAL CHART
Information Technology Manager
48 2/23
177
Draft
POLICE ORGANIZATIONAL CHART
Chief of Police
Deputy Chief of Field Operations
Commander
Night Patrol
A Team Sergeant
A Team Officers (6)
B Team Sergeant
B Team Officers (6)
Rotating Sergeant
Day Patrol
A Team Sergeant
A Team Officers (5)
B Team Sergeant
B Team Officers (5)
Rotating Sergeant
CSOs (8) Cadet (1)
Deputy Chief of Support Services
Records Supervisor
Day Records Clerks (2)
Afternoon Records Clerks
(2)
Night Records Clerks (2)
Records Clerks Part-time (1)
Detective Sergeant
Day Detectives (3)
Night Detectives (2)
Evidence Custodian (1)
Cooperative Police Assistance Team
Officer (1)
Criminal Intellegence Team
Officer (1)
Drug Enforcement Administration
Officer (1)
Special Assignments Sergeant
Traffic Officers (3)
School Resource Officer (2)
Administrative
Assistant
Executive Assistant Accreditation Manager
49 2/23
178
Draft
Public Works Organization Chart
Public Works Director
Assistant Public Works Director-
Admin
Administrative Assistant
Administrative Assistant (PT)
Operations
Superintendent
Grounds Operations Supervisor
Grounds Technicians
Grounds Seasonal
Field Operations Supervisor
Field Operations Technicians
Shop Operations
Superintendent
Fleet Mechanic
Assistant Public Works Director-
Utilities
Facility Operations Supervisor
Utility Tecnicians
Facilities Manager
50 2/23
179
Draft
Fund Structure and Basis of Accounting and Budgeting
For accounting purposes a state or local government is not treated as a single, integral entity. Rather, a government is often viewed instead as a collection of smaller, separate entities known as funds. Funds used by a government are traditionally classified into one of seven fund types. In addition, governmental financial reporting for state and local governments now require the classification of individual funds as either “Major” or “Nonmajor.” The Village defines Major Funds as those that are equal to or greater than 10% of total expenditures for the fiscal year. The impact of this distinction is that the financial activity of nonmajor funds is reported in specific instances in the audited financial statements in a consolidated format while major funds are reported separately. Generally, the General Fund, Debt Service Fund and Water & Sewer Fund are considered “Major” Funds and all of the other funds are considered “Nonmajor” Funds (See Glossary for definition of these terms). It is useful to provide an overview of the Village’s fund structure since the budget is prepared, organized and presented on a fund basis. The following fund types and each fund budgeted for by the Village which falls into that fund type classification, are further described: 1. General Fund: The General Fund (a Governmental Fund) is by far the largest Fund of the Village and accounts for most expenditures traditionally associated with government, including police protection, road and bridge (street improvements), building and zoning, community development, economic development, community relations, finance, Information Technology and general administration. 2. Special Revenue Funds: Special Revenue Funds are used to account for revenues derived from specific taxes or other earmarked revenue sources which, often due to legal requirements, are designated to finance particular functions or activities of government and which therefore cannot be diverted to other uses. The Village has two Special Revenue Funds:
Motor Fuel Tax Fund: This Fund is used to account for the operation of street maintenance programs and capital projects as authorized by the Illinois Department of Transportation utilizing the Village’s per capita share of gasoline taxes collected by the State of Illinois. Tax Increment Financing Fund (TIF): This Fund is used to account for all the revenue and expenditures associated in the TIF District including development and infrastructure improvements. Financing is provided from incremental real estate taxes from the project area.
3. Debt Service Fund: The Debt Service Fund is used to account for the payment of interest, principal and paying agent fees on general obligation bonds. Sales tax and motor fuel tax revenues are currently pledged to make the annual debt service payments on the outstanding bond issuances. 4. Capital Improvement Fund: The Capital Improvement Fund accounts for the acquisition and construction of major capital facilities and other capital improvements financed through the issuance of debt and operating revenues.
51 2/23
180
Draft
5. Enterprise Funds: Enterprise Funds are classified as Proprietary Funds. Proprietary funds are used to account for a government’s business-type activities (activities which receive a significant portion of their funding through user charges and fees). The operations of Enterprise Funds are accounted for similar to those found in the private sector, where the determination of net income is necessary or useful to sound financial administration. Enterprise Funds established by the Village include:
Water & Sewer Fund: This Fund accounts for the revenues and expenses related to the provision of water services to residents and businesses. This Fund also accounts for the revenues and expenses related to the transportation and repairs to the Village’s sanitary sewer and storm sewer systems. All activities necessary to provide such services including administration, operations, maintenance, financing and related debt service, and billing and collection are included in this Fund.
Water & Sewer Capital Fund: This Fund accounts for the revenues and expenses associated with annual capital infrastructure improvements for the water and sewer system. Growth related revenues and water and sewer usage fees provide the needed revenue. Garbage Collection Fund: This Fund accounts for the revenues and expenses related to the collection and disposal of garbage, recycling and yard waste. Billing is completed in conjunction with the Water & Sewer Fund billing process. No administration, cash receipting, billing charges or customer service costs are expensed within this Fund.
5. Internal Service Fund: Internal Service Funds are also classified as Proprietary Funds and are used by state and local governments to account for the financing of goods and services provided by one department to another department, and to other governments on a cost reimbursement basis. Internal Service Funds established by the Village include:
Vehicle Fund: This Fund was created in Fiscal Year 2017 to account for the purchase of vehicular equipment used by the Village departments. Operating transfers from the General Fund and Water & Sewer Fund will provide the revenue to purchase vehicle replacements. In subsequent fiscal years, various departments will be charged based on the annual depreciation of the department’s respective vehicles and equipment within the fleet.
6. Trust and Agency Funds: Trust and agency funds are classified as Fiduciary Funds and are used when a government holds or manages financial resources in an agent or fiduciary capacity. The Village has only one Trust Fund:
Police Officers’ Pension Fund: This fund is used to account for the accumulation of resources to pay pension costs. Monies are contributed by police members at rates fixed by state statutes and by the Village through an annual contribution from the corporate property tax levy and general operating revenues.
Non-Budgeted Funds
The Village also has three special revenue Funds which we do not prepare budgets for as these
52 2/23
181
Draft
Funds account for specific revenues to be used for specific purposes and two agency Funds which account for monies held on behalf of others. These three special revenue Funds are not budgeted as the revenue streams are not predictable and expenditures are not known until the actual time of spending.
Special Revenue Funds Public Works Escrow Fund This Fund accounts for developer contributions received through original subdivision agreements or permit fees received as homes are built within the subdivision. The monies on hand are dedicated to roadway infrastructure improvements to roadways which need expansion because of the increased traffic created by the subdivision. The Fund has approximately $558,000 in deposits/developer contributions to be used for specific purposes.
Economic Development Fund
This Fund accounts for the economic development grant received from the State of Illinois to be used to provide low interest loans to assist new business startups and job creation for people who have low to moderate incomes. Payments made on existing loans replenish the available amount for subsequent loans. The Fund currently has three loans outstanding and an available balance of $164,000. Public Service Fund This Fund accounts for donations/contributions received from numerous sources and must be used for an intended purpose. The revenues are restricted by State Statutes or dedicated to fund the specific event the money was received for. The Fund has 34 sets of revenue and expense accounts for the different events and specific purpose items.
Agency Funds
These two Funds are not budgeted as the transactions within these Funds are not known until the actual time of the activity.
Agency Fund
This Fund accounts for land/cash and transition fees collected from developers for other governmental agencies.
Subdivision Escrow Fund
This Fund accounts for developer deposits received through the development and planning stages. Village staff time and engineering costs are charged against the deposits and billed to developers if the deposits are not sufficient to cover all the costs.
Basis of Accounting and Basis of Budgeting
The modified accrual basis of accounting is used for all governmental fund types (General Fund, Special Revenue Funds, Capital Project Funds and the Debt Service Fund) and agency funds (the Village currently does not budget for any agency funds). Under the modified accrual basis of accounting, revenues are recognized when they are both measurable and available. Measurable
53 2/23
182
Draft
means the amount of the transaction can be determined and available means collectible within the current period or soon enough thereafter to pay liabilities of the current period. Property taxes are recognized when they become both measurable and available in the period that the tax is intended to finance. Expenditures generally are recorded when a fund liability is incurred. However, debt service expenditures are recorded only when payment is due. Those revenues susceptible to accrual are property taxes, motor fuel taxes, franchise fees, licenses, interest revenue, court fines and charges for services. Sales taxes and telecommunication taxes owed to the state at year end on behalf of the Village are also recognized as revenue. Other fines and permit revenue are not susceptible to accrual because generally they are not measurable until cash is received by the Village. The accrual basis of accounting is utilized by proprietary fund types including enterprise funds, internal service funds, and pension trust fund types. Under this method, revenues and additions are recorded when earned and expenses and deductions are recorded when a liability is incurred. Both the modified accrual basis of accounting and the accrual basis of accounting are consistent with generally accepted accounting principles (GAAP). Basis of Budgeting The budget for the Village is prepared on a basis consistent with GAAP as described above except for the following major exceptions described and identified below as the budgetary basis: 1. Capital outlay within the proprietary fund types are capitalized and recorded as assets on a
GAAP basis, but expensed on the budgetary basis. In addition, depreciation expense is not shown on the budgetary basis for the proprietary fund types since capital outlay is expensed and not depreciated. The budgetary basis provides a more accurate description of the actual expenditures made during the year for the proprietary fund-types. The capitalization threshold for infrastructure (land, building and land improvements) is $25,000. The threshold for vehicles, machinery and equipment is $10,000.
2. Bond proceeds in Enterprise funds are shown as revenues on the budgetary basis, and assets
on a GAAP basis. Likewise, principal payments are shown as expenditures on a budgetary basis but reflected as a decrease in long-term debt payable on a GAAP basis. Under GAAP, bond proceeds for proprietary funds would be shown as an asset and offset with long-term debt payable.
3. Unrealized gains and losses on investments are treated as adjustments to revenue under the GAAP basis whereas under the basis of budgeting these amounts are not recognized and are excluded from revenue.
54 2/23
183
Draft
Governmental FundsMajor Fund
Non-Major Fund
Budget CorporateBuilding &
ZoningCommunity Development
Public Works
Community Relations
Economic Development
FinanceInformationTechnology
Police
General Fund yes yes X X X X X X X X XSpecial Revenue Funds Motor Fuel Tax Fund yes yes X X Tax Increment Financing Fund yes yes X X X X X X Public Works Escrow Fund yes no X X Economic Development Fund yes no X X X Public Service Fund yes no X X XDebt Service Fund yes yes XCapital Improvement Fund yes yes X XEnterprise FundsWater & Sewer Fund yes yes X XWater & Sewer Capital Fund yes yes X XGarbage Collection Fund yes yes XInternal Service FundVehicle Fund yes yes X X X X X XFiduciary FundsPension Trust Fund Police Pension Fund yes yes X XAgency Funds Agency Fund yes no X X Subdivision Escrow Fund yes no X X
Department Involvment
FUND /DEPARTMENT STRUCTURE
55 2/23
184
Draft
Financial Management Policies
Fund Balance and Cash Reserve Policies
The Village of Oswego has adopted a Fund Balance Policy for governmental fund types and established the following Unrestricted Net Assets balances and/or cash reserve balances for other fund types. The purpose of these policies is to enhance long-term financial planning and mitigate the risks associated with changes in revenues due to economic and local market conditions. These policies also aim to assist in the allocation of sufficient monies for the purchase of capital equipment, construction of capital improvements, and unanticipated expenditures that may occur. Unassigned/Unrestricted reserve balances will be utilized for emergency expenditures, annual budget shortfalls or other approved capital projects. All of the balances refer to the amounts available as of the end of the fiscal year, April 30. The Finance Department monitors these reserve levels and informs the Village Administrator of any significant changes that occur and the potential effect on funding future operations. Fund Balance Policy for Reporting of Governmental Funds Statement of Purpose
The purpose of this policy is to establish fund balance classifications that establish a hierarchy based on the extent to which the Village of Oswego (Village) must observe constraints imposed upon use of the resources that are reported by the governmental funds. More detailed fund balance financial reporting and the increased disclosures will aid the user of the financial statements in understanding the availability of resources.
The fund balance will be composed of three primary categories: 1) Nonspendable Fund Balance, 2) Restricted Fund Balance and 3) Unrestricted Fund Balance.
Definitions Governmental Funds – are used to account for all or most of the Village’s general activities, including the collection and disbursement of earmarked monies (special revenue funds), the acquisition or construction of general capital assets (capital projects funds) and the servicing of general long-term debt (debt service funds). The General Fund is used to account for all activities of the Village not accounted for in some other fund.
Fund Balance – the difference between assets and liabilities in a Governmental Fund.
Nonspendable Fund Balance – the portion of a Governmental Fund’s net assets that are not available to be spent, either short-term or long-term, in either form or through legal restrictions (e.g., inventories, prepaid items, land held for resale and endowments).
Restricted Fund Balance - the portion of a Governmental Fund’s net assets that are subject to external enforceable legal restrictions (e.g., grantor, contributors and property tax levies).
56 2/23
185
Draft
Unrestricted Fund Balance is made up of three components:
Committed Fund Balance - the portion of a Governmental Fund’s net assets with self-imposed constraints or limitations that have been placed at the highest level of decision making.
Assigned Fund Balance - the portion of a Governmental Fund’s net assets to denote an intended use of resources
Unassigned Fund Balance - available expendable financial resources in a governmental fund that are not the object of tentative management plans (i.e. assignments).
Fund Balance Philosophy It is the Village’s philosophy to support long-term financial strategies, where fiscal sustainability is its first priority, while also building funds for future growth. It is essential to maintain adequate levels of fund balance to mitigate current and future risks (e.g., revenue shortfalls and unanticipated expenditures) and to ensure stable tax rates. Fund balance levels are also a crucial consideration in long-term financial planning.
Scope This policy establishes the hierarchy of fund balance and provides for the minimum amount of fund balance each governmental fund should maintain. Credit rating agencies carefully monitor levels of fund balance and unassigned fund balance in the general fund to evaluate the Village’s continued creditworthiness.
Minimum Unrestricted Fund Balance Levels
This Policy applies to the Village’s governmental funds as follows:
A. General Fund - The General Fund is a major fund and the general operating fund of the Village. It is used to account for most expenditures traditionally associated with government including police protection, road and bridge (street improvements), building and zoning, community development, economic development, community relations, finance, and general administration and all other financial resources except those that are accounted for in another fund.
Spendable fund balance will be classified as follows:
a. Restricted – A portion of the fund balance will be restricted based on the amount of assets at fiscal yearend which have external limitations on their use.
b. Committed – A portion of the fund balance may be committed through formal action of the Village Board of Trustees either through a resolution or ordinance.
c. Assigned – This assigned fund balance will be maintained at a minimum level of 30% of annual budgeted expenditures to ensure long term fiscal sustainability.
d. Unassigned – The unassigned fund balance is the amount which could be utilized for funding of one time projects or expenditures.
57 2/23
186
Draft
B. Special Revenue Funds - Special revenue funds are used to account for and report the proceeds of specific revenue sources that are legally restricted to expenditure for specified purposes other than debt service or capital projects. These funds fund balances will be considered restricted, committed, or assigned depending on the intended source/use of the funds.
C. Debt Service Fund - This fund is a major fund and was established to account for financial resources that are restricted, committed, or assigned to expenditure for principal and interest on the Village’s outstanding debt issuances. This fund’s fund balance will be considered restricted, committed, or assigned depending on the intended source/use of the funds.
D. Capital Projects Fund – This fund is a non-major fund established to account for and report financial resources that are restricted, committed, or assigned to expenditure for capital outlays including the acquisition or construction of capital facilities and other capital assets, excluding those types of capital related outflows financed by proprietary funds. This fund’s fund balance will be considered restricted, committed, or assigned depending on the intended source/use of the funds.
Flow Assumptions Some projects (funds) are funded by a variety of resources, including both restricted and unrestricted (committed, assigned and unassigned). When restricted funds exist, those funds are used first, then unrestricted. For unrestricted funds, committed funds are used first, then assigned, then unassigned.
Authority
A. Committed Fund Balance – A self-imposed constraint on spending the fund balance must be approved by ordinance or resolution of the Village Board of Trustees. Any modifications or removal of the self-imposed constraint must use the same action used to commit the fund balance. Formal action to commit fund balance must occur before the end of the fiscal year. The dollar amount of the commitment can be determined after year end.
B. Assigned Fund Balance – A self-imposed constraint on spending the fund balance based on the Village’s intent to use fund balance for a specific purpose. The authority for imposing the amount of assigned fund balance at the end of the fiscal year is delegated to the Village President and Board of Trustees.
The following are guidelines for establishing and retaining fund balance and cash reserves for the Village’s operating funds. General Fund The Village will strive to maintain a minimum assigned fund balance of 30% of the estimated subsequent year’s annual operating expenditures. In addition, the Village will also strive to maintain a minimum cash reserve balance equal to 25% of the estimated subsequent year’s annual operating expenditures.
58 2/23
187
Draft
Motor Fuel Tax Fund The Village will strive to maintain a minimum assigned fund balance equal to 50% of the estimated subsequent year’s annual expenditures. This level is necessary to provide for the payment of expenditures related to the Village’s annual road program, which is paid for almost entirely during the first six months of the fiscal year. Tax Increment Financing Fund The Village will strive to maintain a cash reserve level to timely meet all expenditures incurred during the fiscal year. Debt Service Fund The Village will strive to maintain a cash reserve level in the Debt Service Fund sufficient to timely meet all principal and interest payments for the following fiscal year based on the bond ordinance requirements for pledged revenues and bond coverage requirements. Water & Sewer Fund The Village will strive to maintain an unrestricted net assets balance equal to 30% of the estimated subsequent year’s annual operating expenditures. The Village will also maintain an additional reserve sufficient to meet all principal and interest payments for the following fiscal year based on the bond ordinance requirements for pledged revenues and bond coverage requirements. Annual surplus reserves will be transferred to the Water & Sewer Capital Fund to support capital improvements for the water and sewer systems. Water & Sewer Capital Fund The Village shall plan for future capital improvements to be paid from cash reserves by maintaining a reserve level based on the capital improvements scheduled for the next five subsequent years. Vehicle Fund The Village shall plan for future vehicular equipment replacements to be paid from cash reserves by maintaining a reserve level based on the accumulated depreciation of the current fleet and the scheduled year of replacement. Garbage Collection Fund The Village will strive to maintain an unrestricted net assets balance equal to 25% of the estimated subsequent year’s annual operating expenditures. This level will provide for three months of operating expenses.
Revenue and Expenditure Policies
Revenue The Village desires to maintain a diversified and stable revenue base to reduce the impacts of fluctuations in any one revenue source. The revenue mix combines elastic and inelastic revenue sources to minimize the effects of an economic downturn. The Village also incorporates the following principles related to revenues as it furthers its financial planning and fulfills its fiscal responsibilities:
59 2/23
188
Draft
Through the Village’s economic development program, the Village will strive to strengthen its revenue base.
Through the annual financial planning process, the Village will project each revenue source for at least the next five years and will update this planning document annually.
The Village will maintain a revenue monitoring system to assist in trend analysis and revenue forecasting.
The Village follows a “cost of service” approach which results in user fees, rates and customer charges being sufficient to cover appropriate costs. These fees and rates will be evaluated annually.
The Village will set fees and user charges for each enterprise fund, such as the Water & Sewer Fund at levels that fully support the total direct and indirect cost of the activity. Indirect costs include the cost of annual depreciation of capital assets.
The Village will use all out of the ordinary or one time revenues received as surplus revenue for the respective fiscal year to build up reserve balances or earmark for special projects.
The Village will use all revenues received for special events, special purpose donations/contributions and State Statute regulated revenues for only their intended purposes.
Expenditure All disbursements will adhere to the Village Purchasing Policy and be subsequently approved by the Village Board through the bi-weekly Bills List. The Village Budget serves as the annual appropriation or spending authority. All expenditures in Funds which are not part of the annual budget process are still subject to the Village Purchasing Policy and appear on the bi-weekly Bills List approved by the Village Board. The Village will consistently budget the minimum level of expenditures which will provide
for the public well-being and safety of the residents and businesses of the community. Expenditures will be within the confines of generated revenue. Reserve balances will be
used to fund operating expenditures only for the short-term duration of one to two years. Through the financial planning process, the Village will forecast expenditures for each of the
next five years and will update this forecast annually, taking into account anticipated increases in operating expenditures, significant changes in operating and staffing needs, and future capital projects and improvements that have been identified as needed for the community.
Capital Planning will be completed annually to prioritize and select those projects which will be funded in upcoming budgets. The Vehicle Replacement Policy and scoring system will be used to determine vehicle and large equipment replacements to be included in annual budgets. All capital outlay will be subject to available funding.
Budgeting, Accounting, Auditing and Reporting Policies
The Village will establish and maintain a high standard of accounting practices in
conformance with Generally Accepted Accounting Principals (GAAP) for governmental entities as promulgated by the Governmental Accounting Standards Board (GASB).
The accounting system will maintain records on a basis consistent with accepted standards for local government accounting (according to GASB).
60 2/23
189
Draft
Where possible, the reporting system will also provide monthly information on the total cost of specific services by type of expenditure and by Fund.
An independent firm of certified public accountants will perform an annual financial and compliance audit of the Village’s financial statements according to Generally Accepted Auditing Standards (GAAS) and will publicly issue an opinion which will be incorporated in the Comprehensive Annual Financial Report.
The Village will annually seek the GFOA Certificate of Achievement for Excellence in Financial Reporting Award and the GFOA Distinguished Budget Award.
The Village will promote full disclosures in its annual financial statements and its bond presentations.
The Village will comply with all financial reporting requirements including all annual reports to be filed with the State and all annual debt disclosures filed with the respective agencies.
Cash Management / Investment Policies
An investment policy has been adopted by the Village Board. The investment policy
provides guidelines for the prudent investment of the temporary idle cash and outlines the policies for maximizing the efficiency of the cash management system. The ultimate goal is to enhance the economic status of the Village while protecting its pooled cash.
The cash management system is designed to accurately monitor and forecast expenditures and revenues, thus enabling the Village to invest funds to the fullest extent possible. The Village attempts to match funds to projected disbursements.
In order to maximize interest earnings, the Village commingles the cash of all funds excluding the Police Officers’ Pension Fund. Interest revenue derived from commingled cash is allocated to the participating funds monthly based on the relative cash balance of each fund.
Criteria for selecting investments and the order of priority are:
o Safety. Safety of principal is the foremost objective of the investment program. Investments of the Village shall be undertaken in a manner that seeks to insure the preservation of capital in the portfolio.
o Liquidity. The investment portfolio shall remain sufficiently liquid to meet all
operating requirements that may be reasonably anticipated. This is accomplished by structuring the portfolio so that securities mature concurrent with cash needs to meet anticipated demands. Furthermore, since all possible cash demands cannot be anticipated, the portfolio should consist largely of securities with active secondary markets.
o Return on Investment. Return on investment is of tertiary concern when compared to the safety and liquidity objectives described above. The investment portfolio shall be designed with the objective of attaining a market rate of return throughout economic cycles, taking into account the investment risk constraints and liquidity needs. Investments are limited to very low risk securities in anticipation of earning a fair return relative to the risk being assumed.
61 2/23
190
Draft
Budget Process and Budget Structure
Budget Process The budget process for the Village of Oswego involves the citizens, the Village President and Village Board, Village Administrator, Department Heads, supervisors, and many others throughout the organization. Each person plays a critical role in the development of the budget for the upcoming year. Although much of the time and effort in preparing the budget takes place during the months of October through April, the development, implementation, monitoring and review of the Village’s budget is part of a comprehensive process that occurs throughout the entire year. The Village has adopted the Budget Act as defined in Chapter 65, Section 5/8-2-9 of the State of Illinois Compiled Statutes. The Act requires the adoption of the Budget prior to the beginning of the fiscal year for which it pertains and provides the spending authority for the fiscal year. The goal of the Village Administrator and Budget Officer is to present the Village Board with a balanced operating budget for review and adoption.
A balanced budget is a budget in which revenues meet or exceed expenditures and cash reserves or unrestricted-unassigned fund balance or unrestricted net assets is not considered a revenue source.
The Village will occasionally drawdown cash reserves or fund balance to return the reserves to desired levels as stated in the Village’s policy on Fund Balances found in the Financial Policies section of this document. Fund balance reserves were not used to balance budgets in any Fund for Fiscal Year 2019. However, intentional drawdowns of fund reserves will occur in five Funds which have total expenditures exceeding total revenues or one time expenditures; the TIF Fund, the Capital Improvement Fund, the Water & Sewer Capital Fund and Garbage Collection Fund. The TIF Fund will add $10,000 to the deficit Fund Balance if the estimated expenditures are realized. The Capital Improvement Fund will drawdown reserves by $7,900,000 due the construction costs of the Police Headquarters facility and other infrastructure improvements. The Water & Sewer Capital Fund is using reserves in the amount of $1,200,000 to complete scheduled water and sewer system improvements. The Garbage Collection Fund will drawdown reserves by $7,700 if the revenues and expenses are as budgeted. All other Funds are presented with balanced budgets. The Village’s annual budget is prepared for the fiscal year which begins on May 1 and ends on April 30. During the first three months of the fiscal year, the Finance Department begins the year-long process of monitoring the Village’s revenues and expenditures and discussing and resolving any significant variances with each Department. The Village’s current budgetary control is at the fund level and a budget is adopted for the following Funds.
General Fund Motor Fuel Tax Fund Tax Increment Financing Fund
Debt Service Fund Capital Improvement Fund
62 2/23
191
Draft
Water & Sewer Fund Water & Sewer Capital Fund Vehicle Fund
Garbage Collection Fund Police Officers’ Pension Fund
Total expenditures may not exceed the total amount approved for each Fund unless a budget amendment is approved by the Village Board. Budget Preparation The fiscal year financial calendar is completed in June/July of each year. The financial calendar shows the scheduled dates for the preparation of the Capital Improvement Plan (CIP), annual Village property tax levy and the Annual Village Budget and Financial Plan. The CIP begins in July with the departments updating of the CIP listed projects and the addition of new projects for the next five years. Large dollar projects beyond five years are also included in the CIP for discussion and planning. The Public Works department completes a Street Analysis annually to determine the amount of roadway improvements to be undertaken for each budget year. The analysis provides the amount to be budgeted in the Motor Fuel Tax Fund for public improvements and is included in the CIP. The CIP is reviewed with the Village Board and approved capital projects are included within the respective Fiscal Year Village Budget. The CIP is adopted with the annual budget. The budgeted capital projects will have an impact on the revenue available for the operating budgets of respective departments as lower amounts will be available for normal operating expenditures. Preparation of the annual budget begins in September of each year. The Village Board is solicited for any ideas for the Budget and budget worksheets are made available to each department head containing the current year budget, year-end projections and prior fiscal year actual data. The Village Administrator and Budget Officer provide broad directives regarding the development of each Department’s budget. Each department then prepares a budget for each line item under that Department’s scope of responsibility. Budgets were required to be completed and submitted to the Budget Officer by December 18, 2017. The preliminary Request Budget was compiled by the Finance Department for review by the Village Administrator and Budget staff and also distributed to the Village Board for their review. Included in the Request Budget are revenue projections for each Fund which are used for controlling requested expenditures. Meetings with individual department heads were held to review their respective portion of the Request Budget the week of January 9-12, 2018. Any changes to the departments’ budgets were made and copy of the Draft Budget was prepared and distributed to the Village Board on February 9, 2018. The Draft Budget was also made available for public viewing on the Village website as of February 16, 2018. The Draft Budget was reviewed and discussed at the Budget Workshop meeting held on March 3, 2018 which was open to the public. A formal Public Hearing on the budget was held on April 3, 2018, where the public was invited to comment on any issues concerning the budget for the upcoming year. Any final changes to the budget, as a result of the public hearing, were processed and a formal budget adoption ordinance was approved at the Village Board meeting on April 24, 2018 providing the legal authority to spend public funds starting May 1st.
63 2/23
192
Draft
Amending the Budget If necessary, the annual budget may be amended by the Village Board during the year, increasing or decreasing total revenues or expenditures for a particular fund. These budget amendments are usually necessary if anticipated expenditures are expected to exceed the total amount budgeted at the fund level due to changing priorities or unexpected occurrences. Budget transfers within a fund between line item accounts may be authorized by the Finance Director at any time.
Long-Term Financial Planning Monthly financial reports and quarterly financial reports are prepared for the Village Board and department heads as well as made available for public viewing. These reports provide the basis for the identification of any immediate trends which may need to be addressed regarding revenues and expenditures. The reports also provide transparency into Village finances throughout the year. A Financial Plan is prepared after the Fiscal Year Draft Budget is adopted. The Financial Plan projects revenues and expenditures for the next five fiscal years based on the adopted Budget. The Five Year Financial Plan is presented and discussed with the Village Board to identify revenue and expenditure trends. This allows the Village Board and Village Staff to proactively plan for any potential concerns arising in subsequent fiscal years. The Village Comprehensive Plan was updated and presented to the Village Board in the summer of 2015. The plan provides the basis for directing growth in a controlled, manageable, and sustainable manner. All of these reports can be found on the Village website at www.oswegoil.org.
Fiscal Year 2019 Financial Calendar Capital Improvement Plan, Tax Levy and Annual Budget
Calendar Year 2017 Scheduled (subject to change) Wednesday, September 13 Capital Improvement Plan (CIP) kickoff meeting with staff Tuesday, September 19 Solicit Village Board ideas for Fiscal Year 2019 Budget Wednesday, October 4 Fiscal Year 2019 Budget kickoff meeting with staff Tuesday, October 17 Committee of the Whole Meeting Auditors present Fiscal Year 2017 Village Audit 2017 tax levy discussion Wednesday, October 18 Capital Improvement description forms submitted to finance Tuesday, November 7 Adopt Calendar Year 2017 Tax Levy Review Capital Improvement Plan Projects Monday, December 18 Department Budget worksheets must be completed
64 2/23
193
Draft
Calendar Year 2018
Tuesday, January 9 Request Budget distributed via email to Village Board January 9-12 Meetings with department heads on budget requests Tuesday, February 5 Final meeting with Village Administrator on budget requests
Friday, February 9 Draft budget delivered to Village President/Trustees Saturday, March 3 Budget workshop –overview and departmental budget review Tuesday, March 6 Committee of the Whole Fiscal Year 2019 Budget review (if necessary) Tuesday, April 3 Public Hearing on Fiscal Year 2019 Budget Tuesday, April 17 Approve Ordinance Adopting Fiscal Year 2019 Budget Adopt Capital Improvement Plan
65 2/23
194
Draft
Major Revenue Sources The Village of Oswego has eight major revenue sources which account for over 75% of the total Village revenues for all funds, excluding operating transfers and bond proceeds. These revenue sources are described individually in the following pages. These revenues are estimated annually using historical trend data, current economic activity and local knowledge regarding each revenue source. State shared sales tax revenue is the largest single source of revenue for the Village. Sales tax revenue has been relatively flat since FY 2016 with the Village receiving just over $6.0 million annually. FY 2018 projected and the FY 2019 Budget amounts are the same amount of $6.1 million. The slower growth in new residents coupled with less nonresidents shopping in the village appears to be the cause of slower growth in sales tax revenue. Water & Sewer usage revenues account for the second largest source of Village revenues. Population increases allowed for increases in this revenue source through FY 2013. Since FY 2013, revenue has decreased 2% on average each year. The Village completed a water rate study in FY 2018 which led to the Village Board adopting rate increases annually for the next five years to support operations and capital improvements. The Fiscal Year 2019 budget estimates this revenue at $6.3 million which is a $1.3 million increase from the FY 2018 projected amount. The Home Rule sales tax revenue is the third largest revenue source for the Village. The Village implemented a 0.50% home rule sale tax rate in July, 2010 and increased the rate to 1.25% effective January 1, 2016. This revenue source mirrors the State shared sales tax revenue and is collected by the State and remitted to the Village. The FY 2019 budget is $5.2 million with $3.1 million allocated for capital improvements. Income tax revenue is the fourth major revenue source for the Village. This tax is distributed on a per capita basis from the State of Illinois. The Village received approximately $235,000 less in FY 2017 and FY 2018 as the State of Illinois corrected a formula distribution error for prior year’s distributions. The FY 2019 budget of $3.2 million is a 6% increase due to legislative changes in the distribution of this revenue, estimated stronger corporate profits and a stronger economy. Garbage Collection revenue is the fifth largest generator of revenue. This revenue is used to pay the disposal costs of garbage collection contracted with a third party. The Village bills the residents and collects the revenue through the water and sewer usage billing process. The Fiscal Year 2019 Budget estimates the revenue at $2.5 million. Property tax revenue is the sixth largest source of revenue for the Village and does not fluctuate due to the overall performance of the local and state economy. The Village annually determines how much in property tax revenue will be received from the property owners by levying a total dollar amount each December. The revenue is used to pay for the pension costs of the Police Officer’s Pension Fund and the Illinois Municipal Retirement Fund (all non-police employees) with any remaining funds used for general operations. For Fiscal Year 2019, all but
66 2/23
195
Draft
$500 of the tax levy will be used to pay the Village contribution to the Police Officer’s Pension system. $1.3 million was levied and is expected to be received in FY 2019. Utility tax revenue is the seventh largest revenue source for the Village. The Village taxes the use of three utilities: natural gas, electricity, and telecommunications. Telecommunications tax revenues have declined annually over the past four fiscal years and are budgeted to decrease to $0.5 million for Fiscal Year 2019. Gas and electric utility taxes are expected to stay at the FY 2018 amount of $1.0 million. Motor Fuel Tax revenues are another major source of revenue for the Village. This revenue is dedicated to paying the costs of roadway infrastructure repairs completed within the Village. The revenue is distributed to the Village from the State of Illinois tax on gasoline and petroleum products on a per capita basis. The revenue increased to $885,000 in FY 2017 due to the certified special census completed in 2016. The Village expects to receive $850,000 in FY 2019. This amount is the same amount projected to be received in FY 2018.
Sales tax revenue received by the Village is directly related to the dollar value of sales made within the Village limits. Sales in four categories account for 72% of the sales tax revenue received by the Village. General Merchandise, Auto/filling stations, Drinking & Eating Places and Drugs & Misc. Retail business types are where the majority of the overall sales occur in the Village. Sales tax revenue has remained at the same levels the past four years. The FY 2019 budget is only 1% greater than the previous year suggesting continued slow growth in this revenue source.
The Village of Oswego receives from the State of Illinois, 16% of the 6.25% State sales tax on general merchandise (1% of gross sales). In addition, the Village also receives 100% of the 1.25% State sales tax on food and qualifying drugs (also 1% of gross sales). The tax money that the Village receives is based on actual sales made within the Village corporate limits. Kendall county has also implemented an additional sales tax rate of 1.0% on sales within the Village. The general sales tax rate for the Village is 6.25%. Adding the county tax rate and local tax rates bring the overall sales tax rate to 9.5%.
Fiscal YearSales TaxRevenue
Sales Tax Revenue By Type of Business (Calendar Year)2017 (3rd Qtr)201620152014
Water and sewer usage charges represent 98% of all Water and Sewer Fund revenue. Water customers are billed bi-monthly for water and sewer services used at the current rate of $3.83 for every 100 cubic feet of water used ($5.12 per 1,000 gallons) and $1.28 per 100 cubic feet of water used ($1.71 per 1,000 gallons) for sanitary sewer maintenance. A monthly access fee of $3.17 per month is also included on the bill. The Village's water system consists of eight wells, six water towers and the distribution system. The water rate set by the Village must be sufficient to cover all operating and capital costs for maintaining the entire waterworks system.
Water and sewer usage fees account for 98% of all the revenues received to be used for maintaining and operating the water and sewer system. The Village increased water rates with the November, 2017 billing. Rates increases were approved for the next five years. The rate increases will insure the rate structure is sufficient to support the operating, capital, and debt service costs of this enterprise system. The FY 2019 budget is increasing 26% due to the rate increase in November, 2017 and another increase in May, 2018.
Fiscal YearCharges for
Service%
Change
$500,000
$1,500,000
$2,500,000
$3,500,000
$4,500,000
$5,500,000
$6,500,000
* Projected
Charges for Service Revenue
69 2/23
198
Draft
General Fund/Capital Improvement Fund Local "Home Rule" Sales Tax Revenue
Total 1,937,089 100% 1,979,624 100% 5,009,807 100% 3,672,018 100%
Fiscal Year
Sale TaxRevenue
%Change
The Village of Oswego, pursuant to its home rule powers, implemented a 0.50% local home rule sales tax effective July 1, 2010. Communities over 25,000 are considered to be "home rule" by the State of Illinois and thus have the option of levying such a tax without voter approval. This tax is applicable to all sales except qualifying food and drugs not prepared for immediate consumption and titled vehicles. This sales tax applies to approximately 65% of all sales made within the Village. As of January 1, 2016, the Village increased the home rule sales tax rate 0.75%, bringing the total HR sales tax rate to 1.25%. The additional revenue will support the annual road program, building of a new police facility and other capital improvements and will be recorded in the Capital Improvement Fund.
This revenue source will trend similarly to the general sales tax revenue. Home Rule Sales tax revenue is budgeted to increase $100,000. The table below is presented to distinguish the sources of local home rule sales tax revenue received by the Village. The information is presented by calendar year, rather than fiscal year, since it is only provided by the Illinois Department of Revenue. The two largest categories generating Home Rule Sales tax revenues are "General Merchandise" and "Drinking & Eating places" for the past four years.
Home Rule Sales Tax Revenue By Type of Business (Calendar Year)2014 2015 20172016
The Village's share of income tax revenue peaked in FY 2016 at $3.2 million. FY 2017 and FY 2018 have been subject to the State of Illinois changes to the distribution formulas. FY 2019 revenues are increasing 6.4% due to the latest legislative changes, anticipated stronger corporate profits and a stronger economy. The State Legislature annually considers bills which would be a detriment to local municipalities with this revenue source. As one of the largest revenue sources for the Village, any changes would have a substantial negative impact on sustaining Village services.
The State of Illinois currently has an income tax rate of 3.95% for individuals, trusts and estates and 7.0% for corporations. Of the total net income tax collections received by the State, 1/6th is set aside into the Local Government Distributive Fund (LGDF). The LGDF receipts are then distributed to municipalities and counties based on their population as a percentage of the State's official census population. There are no restrictions on the types of expenditures that a municipality may fund with their share of income tax revenues. On average, 10% of all income tax revenue received by the State is from corporations and 90% is from individuals, trusts and estates. This is a very elastic revenue source that fluctuates significantly based on the performance of the national and state economy.
Analysis and TrendsThe Village pays the vendor based on the number of accounts being serviced by the Village. Revenue has increased over the years due to the population growth of the Village. The revenue was also increasing due to annual rate increases but a new negotiated contract begining in FY 2013 resulted in lower costs for the service. In FY 2017, the contract was extended at rates lower than the current contract for FY 2017 and annual increases will be the lesser of 2% or the February to February CPI. The contract expires on April 30, 2022.
Disposal Fees
Fiscal YearCharges for
Service%
Change
Disposal fee service charges represent 99% of all Garbage Collection Fund revenue. The Village contracts with a third party for refuse collection and bills residents for the service through the Village utility bill. Residents are billed bi-monthly but payments to the vendor are remitted monthly based on the current months active number of accounts. The Village must keep one to two months of vendor payments in reserve within the Fund. Rates are set per the contracted party and passed on to the residents. The revenue received should equal what is paid to the contractor.
$500,000
$700,000
$900,000
$1,100,000
$1,300,000
$1,500,000
$1,700,000
$1,900,000
$2,100,000
$2,300,000
$2,500,000
* Projected
Charges for Service Revenue
72 2/23
201
Draft
General Fund Property Tax Revenue
Description
Analysis and Trends
General UseFiscal Year General Use Police Pension IMRF Pension % of Total
The Village levies a property tax based on the assessed valuation of each property within Village limits for funding pension costs. Property values are assessed by the Township Assessor on a quadrennial basis. The value of the property is equalized by the state and further equalized at 33% of the property value. The equalized value is then divided by $100 and multiplied by the Village taxrate. Property taxes are collected one year in arrears. For example, the taxes levied at the end of December 2017 for calendar year2017 will be collected between June 2018 and January 2019 and finance the Village's FY 2019. The levy on the tax bill includes the taxes levied to fund: General Use, the Village (IMRF) and Police Pensions. All property tax collections are recorded as revenue in the General Fund when received. The taxes levied for the Police Pension are expensed in the General Fund and recorded as Employer contributions in the Police Pension Fund.
The majority of the property tax levy is used to support the Village contribution to the Police Pension Fund as the bar chart above shows. The Village Board desires to keep the tax levy as low as possible using other revenue streams to support Village operations and contributions to the pension funds. The annual tax levy has increased over the last three years as the Village Board has tried to keep the tax rate the same to capture new growth occurring within the Village.
The Village taxes the use of three utilities: natural gas, electricity, and telecommunications. The rates for each tax are: $0.045 cents per therm for natural gas for those users subject to the gas use tax, a 3% of gross charges for natural gas, a 6.0% of gross charges for telecommunications, and a tiered kilowatt-hour use rate for electricity roughly equivalent to 3.0% of gross charges. Payments for the taxes on natural gas and electricity are remitted directly to the Village every month by the utility companies; Nicor for natural gas and Exelon, the parent company of ComEd for electricity. Telecommunications companies pay all taxes to the State of Illinois and the State remits the appropriate amounts to the Village on a monthly basis.
Utility tax revenues continue the downward trend in total revenues. Telecommunication revenues collected by the State of Illinois and distributed to municipalities has seen a 33% decline over the last four years. Natural gas usage and electric usage willfluctuate from year to year based on the price of the commodity and on individual usage. Low oil prices has allowed for the low rates for consumers for these commodities. This revenue source is 55% less than what is was in FY 2012. The Village has the ability to increase the rates on electric and natural gas usage to increase this revenue stream. However, any increase may be offset by the continuing decline in the Telecommunications tax.
The Village receives monthly distributions from the State of Illinois for Motor Fuel Tax (MFT) revenues. The revenues are derived from a State-imposed 19 cent per gallon tax on gasoline and a 21.5 cent per gallon tax on diesel fuel. A portion of this tax revenue is allocated to all municipalities in the State based on their total population as a percentage of the total municipal state population. Municipalities may use this revenue only for road maintenance and improvements authorized by the Illinois Department of Transportation (IDOT) and are subject to an annual audit by IDOT.
This revenue source is one of the state shared revenues distributed on a per capita basis. The Village population increases have allowed the Village to receive a greater share of this revenue as noted in FY 2017 with the certification of the 2016 special census halfway through the fiscal year. FY 2018 revenues are forecasted to be similar to FY 2017 with minimal growth for FY 2019. Lower overall consumption and the State of Illinois holding the distributions equivalent to the current year distributions are contributing to the lack of growth in this revenue source.
Fiscal Year
Total MFT Allotment
% Change
$720,000
$740,000
$760,000
$780,000
$800,000
$820,000
$840,000
$860,000
$880,000
$900,000
* Projected
75 2/23
204
Draft
Year Population1990 3,8762000 13,3262005 19,9562008 29,0122010 30,3552016* 33,078*special census
EAV2008 897,802,932 7.47%
2009 933,315,018 3.96%
2010 889,906,116 -4.65%
2011 836,708,892 -5.98%
2012 779,490,106 -6.84%
2013 744,930,605 -4.43%
2014 746,521,305 0.21%
2015 782,841,868 4.87%
2016 831,033,315 6.16%
2017 est. 876,658,533 5.49%
2017 EAV by Property TypeFarm 1,588,306 Residential 746,044,564 Commercial 121,571,703 Industrial 7,426,267 State Railroad 27,693
876,658,533
The Village of Oswego's total EAV is comprised of five different property types. However, over 85% of the EAV comes from residential properties.
TRENDS
Levy Year
Village of Oswego population has grown to exceed 33,000 residents. The greatest growth and development expansion for Oswego took place between 2000 and 2008 when the Village's population increased by over 117%. The 2016 partialspecial census certified the population at 33,078. Oswego's population is expected to continue to grow reaching an estimated 40,000 by the year 2030.
The Village of Oswego's total Equalized Assessed Valuation (EAV) on property increased at an average rate of 15.8% between 2000 and 2009 before annually declining since 2010 because of the housing downturn and mortgage crisis. The EAV has been increasing since 2014 at an average annual rate of 4%.
The Village's property tax collection consists of taxes levied for general corporate use, municipal employee's pensions, and police officers pensions. Collections for levy year 2007, 2008 and 2009 increased above the previous year due to increases in the levies to pay for rising pensions and operating costs. The 2010 levy increased marginally as the Village Board held the line on tax increases. The 2011 levy was reduced to compensate for the decreasing property assessments and the Village Board desire to keep the tax rate from increasing. Beginning with the 2016 levy, the Village Board has decided to keep the tax rate the same to capture new growth within the Village.
The Village of Oswego property tax rate has fluctuated slightly based on the EAV increases or decreases over the last 10 levy years. The tax rate had risen since 2008 to the 2014 rate of $16.34 cents per $100 of a property's EAV before dropping 5% in 2015. The Village Board has kept the tax rate the same the past three levy years to capture the new growth occuring in the Village.
The Road and Bridge costs per resident peaked in FY 2016 because of additional roadway improvements completed that fiscal year . Costs per resident decreased in 2017 because of removing all capital outlay costs from this departments budget. The trend is for continued increases in operating costs to sustain all the currentservices provided to residents. **starting in FY 2017, costs associated with capital expenditures are accounted for in the Capital Improvement Fund or the Vehicle Fund, whichever is applicable.
Road and Bridge Service Costs
Police Protection Service Costs
The Village's population was certified at 29,012 in 2010 causing the per resident costs to decline in FY 2010 to a low of $250 per resident. Since 2010, per resident costs have steadily increased due to rising pension costs and increases in operating costs over the time period. Operating costs are estimated to continue increasing with a sizeable jump in FY 2019 as the new police headquarters building is occupied in October, 2018. **starting in FY 2017, costs associated with capital expenditures are accounted for in the Capital Improvement Fund or the Vehicle Fund, whichever is applicable.
Elastic revenues are very responsive to changes in the economy. The general fund revenues considered to be elastic include: sales and use taxes, municipal utility taxes, licenses and permits, interest on investments and income taxes. The property tax is an example of a non-elastic revenue. During strong economic conditions, elastic tax revenues will parallel business growth providing increases in existing revenue sources. A balance between elastic and inelastic revenues alleviates the effects of economic growth or decline. During inflation, itis desirable to have a high percentage of elastic revenues because inflation increases the revenue received, keeping pace with the higher prices that the Village must pay for goods and services. If the percentage of elastic revenues declines during inflation, the Village receives less revenue, but the Village becomes more vulnerable because inflation pushes up the price of services.
As the graph indicates, the Village's general fund sources of operating revenue are mainly elastic in nature. The percentage of elastic revenues peaked in FY 2012 at 85% of general operating revenues. The addition of the new Food & Beverage tax in FY 2018 has increased the percentage to above 80%. The Village will be able to sustain current operations much easier if more non elastic revenue sources are implemented to weather any economic downturns.
The graph shows operating expenditures for the general fund per Village of Oswego resident. Changes in expenditures per resident fluctuate as expenditures and population changes. If the population remains constant and expenditures continue to increase the cost per resident will increase indicating the need for greater operating revenues to sustain operations. If expenditures remain constant and population increases, the cost per resident will decline which could suggest the current level of expenditures will not be sufficient to provide the same level of services to the residents.
General Fund operating expenditures have trended higher over the past ten years. The 2019 cost per resident is estimated to increase to $477 based on the fiscal year budget. The population growth has slowed but costs to provide the same level of services to the residents continues to increase. If revenue does not increase to support the expenditure growth, either program eliminations or more efficient operations will need to be implemented by the Village.
$403 $378 $392$418
$449$483 $489
$441$477
General Fund Operating Expenditures per Resident
80 2/23
209
Draft
744930605
Indicator Description
Trend Analysis
The graph shows both the operating revenue and expenditures for the general fund per Village of Oswego resident. As the cost of the Village’s population increases, it is expected the cost of services will need to increase proportionately. Decreasing per resident revenues may indicate the Village may not be able to maintain existing service levels unless new revenue sources are identified. Changes in expenditures per resident fluctuate as expenditures and population changes. If the population remains constant and expenditures continue to increase the cost per resident will increase indicating the need for greater operating revenues to sustain operations. If expenditures remain constant and population increases, the cost per resident will decline which could suggest the current level of expenditures will not be sufficient to provide the same level of services to the residents.
As illustrated above, the Village's General Fund operating revenue per resident has continued to trend higher exceeding operating expenditures annually. This allows the Village to provide all the current services to the residents even as costs continue to increase.
$417 $4
56 $492
$496 $523 $5
47
$522
$514
$517
$541
$403
$378
$392 $4
18
$449
$483
$489
$441 $4
77 $506
Comparison of General Fund Revenue & Expenditures per Resident
TOTAL REVENUES 68,496,163 34,613,922 36,542,072 38,510,292 5% 11%
FY 2019 Budget vs FY 2018
Projected Budget
REVENUES - ALL FUNDS
FUND HIGHLIGHTSRevenues
General Fund revenues have increased 1% compared to the FY 2018 budget due to less sales tax rebates paid, increased Income tax revenues, implementation of a Food & Beverage tax and increased gaming revenue.
Motor Fuel Tax revenues are the same as last year as little growth is projected in this revenue.
TIF Fund revenues increased as tax increment will be greater due to the increased assessments.
Debt Service is lower because of the 2017 refinancing and less debt outstanding.
The Capital Improvement Fund revenue is greater due to the new Local MFT tax implemented in FY 2018.
Water & Sewer Fund revenues are up due to the rate increases effective 11/1/17 and 5/1/18.
The Water & Sewer Capital Fund revenue increased due to the transfer from the Water & Sewer Fund in FY 2019.
The Vehicle Fund revenue increased because of transfers from other Funds to support the expenses budgeted.
Police Pension revenue increased slightly from anticipated investment income.
83 2/23
212
Draft
FUND
FY 2017ACTUAL
FY 2018BUDGET
FY 2018PROJECTED
FY 2019BUDGET
General 16,077,014 17,655,562 17,219,785 17,868,481 4% 1%
Motor Fuel Tax 874,260 1,162,500 934,210 402,500 -57% -65%
Beginning Restricted Fund Balance 692,430 906,115 922,462 922,462 843,610 Revenues 892,689 890,607 853,300 855,358 855,758 Expenditures 679,004 874,260 1,162,500 934,210 402,500 Change in Fund Balance 213,685 16,347 (309,200) (78,852) 453,258 Ending Restricted Fund Balance 906,115 922,462 613,262 843,610 1,296,868
Summary of Fund Balances and Unrestricted Net Assets
Fiscal Year
Fund Balance/ Net AssetsThe Village has adopted a Fund Balance Policy for Governmental Fund types and Unrestricted Net Assets
balances for other Fund types. The policy can be found in the Budget Overview section of this Budget. The policies establish guidelines for desired balances to be maintained within the respective Funds. Fund Balances or Net Asset balances are a good indicator of the financial strength of the local government. The following
schedule details the estimated Fund/Net Asset balances at the end of Fiscal Year 2019.
The General Fund Ending Fund Balance is projected to increase $36,334 from the Fiscal Year Ending 2018 projected Fund Balance. The increase is due to the the increase in revenue from the newly implemented Food & Beverage tax in October, 2017.
The Ending Restricted Fund Balance increase is due to the FY 2019 decrease in the annual road program expenditures. The Fund will increase reserves to pay for anticipated downtown development infrastructure improvements in FY 2020 and FY 2021.
100 2/23
229
Draft
Actual Actual Budget Projected BudgetFUND FY 2016 FY 2017 FY 2018 FY 2018 FY 2019
Fiscal Year
TAX INCREMENT FINANCING
Beginning Restricted Fund Balance - - (1,608,191) (1,608,191) (1,744,103) Revenues - 1,336 40,500 22,259 40,500 Expenditures - 1,609,527 350,500 158,171 1,495,107 Change in Fund Balance - (1,608,191) (310,000) (135,912) (1,454,607) Other Financing Sources/(Uses) - - - - 1,444,608 Ending Restricted Fund Balance - (1,608,191) (1,918,191) (1,744,103) (1,754,102)
DEBT SERVICE
Beginning Restricted Fund Balance 63,494 65,965 68,041 68,041 72,413 Revenues 1,774,573 2,390,082 2,923,316 2,922,216 2,825,200 Expenditures 1,772,101 2,388,006 2,922,844 2,917,844 2,824,550 Change in Fund Balance 2,471 2,076 472 4,372 650 Other Financing Sources/(Uses) - - - - - Ending Restricted Fund Balance 65,965 68,041 68,513 72,413 73,063
CAPITAL IMPROVEMENT FUND
Beginning Fund Balance 257,558 799,452 30,163,626 30,163,626 9,944,832 Revenues 886,931 3,381,557 2,930,000 3,747,500 3,953,000 Expenditures 345,037 4,844,943 25,104,800 22,694,094 8,912,000 Change in Fund Balance 541,894 (1,463,386) (22,174,800) (18,946,594) (4,959,000) Other Financing Sources/(Uses) - 30,827,560 (1,972,200) (1,272,200) (2,906,542) Ending Fund Balance 799,452 30,163,626 6,016,626 9,944,832 2,079,290
The Ending Fund Balance is decreasing due to the project completion for the $30 million Police Headquarters building. The implementation of the new Local Motor Fuel Tax in October 2017 will provide more funding for this Fund annually.
The Tax Increment Financing Fund was established during FY 2017. The Ending Fund Balance deficit will increase $10,000 compared to the FY 2018 projected ending fund balance if all the planned expenditures are realized.
The Ending Restricted Fund Balance has increased due to interest earnings on reserve balances. Any additional surplus will be used to reduce an upcoming interest bond payment.
101 2/23
230
Draft
Actual Actual Budget Projected BudgetFUND FY 2016 FY 2017 FY 2018 FY 2018 FY 2019
Fiscal Year
WATER & SEWER
Unrestricted Net Assets 8,619,387 237,950 1,616,486 1,616,486 1,849,771 Revenues 5,823,419 5,285,653 5,174,200 5,499,570 6,389,120 Expenses 4,738,797 4,854,123 5,168,523 5,231,285 4,977,169 Change in Unrestricted Net Assets 1,084,622 431,530 5,677 268,285 1,411,951 Other Financing Sources/(Uses) (9,466,059) 947,006 (35,000) (35,000) (1,300,000) Unrestricted Net Assets 237,950 1,616,486 1,587,163 1,849,771 1,961,722
WATER & SEWER CAPITAL
Unrestricted Net Assets - 5,646,483 5,499,147 5,499,147 5,250,640 Revenues 423,922 145,257 160,000 135,000 130,000 Expenses 705,145 78,268 1,250,000 383,507 2,446,350 Change in Unrestricted Net Assets (281,223) 66,989 (1,090,000) (248,507) (2,316,350) Other Financing Sources/(Uses) 5,927,706 (214,325) - - 1,074,235 Unrestricted Net Assets 5,646,483 5,499,147 4,409,147 5,250,640 4,008,525
GARBAGE
Unrestricted Net Assets 521,714 513,437 505,490 505,490 498,084 Revenues 2,407,632 2,338,531 2,501,700 2,401,400 2,473,400 Expenses 2,415,909 2,346,478 2,450,000 2,408,806 2,481,070 Change in Unrestricted Net Assets (8,276) (7,947) 51,700 (7,406) (7,670) Unrestricted Net Assets 513,437 505,490 557,190 498,084 490,414
Unrestricted Net Assets increased because of the usage rate increases beginning in November, 2017. The rate increases will provide the additional funding for operations and capital infrastructure.
Unrestricted Net Assets decreased because of capital projects scheduled for completion in Fiscal Year 2019 to be paid from reserve balances.
Unrestricted Net Assets decreased due to increased rates paid to the third party contractor.
102 2/23
231
Draft
Actual Actual Budget Projected BudgetFUND FY 2016 FY 2017 FY 2018 FY 2018 FY 2019
Fiscal Year
VEHICLE FUND
Unrestricted Net Assets -$ - 37,508 37,508 75,125 Revenues -$ 18,688 5,400 35,000 40,000 Expenses -$ 713,680 85,000 82,383 330,500Change in Unrestricted Net Assets -$ (694,992) (79,600) (47,383) (290,500) Other Financing Sources/(Uses) -$ 732,500 85,000 85,000 330,500Unrestricted Net Assets -$ 37,508 42,908 75,125 115,125
POLICE PENSION
Net Assets held in Trust 21,245,031 22,553,626 26,176,298 26,176,298 29,091,976 Additions 1,907,128 4,338,596 2,243,100 3,740,226 2,265,000 Deductions 598,532 715,923 728,300 824,548 989,323 Change in Net Assets 1,308,596 3,622,672 1,514,800 2,915,678 1,275,677 Net Assets held in Trust 22,553,626 26,176,298 27,691,098 29,091,976 30,367,653
Unrestricted Net Assets increased from the sales of replaced vehicles. Transfers from the respective user Fund will cover the espenses.
Net Assets held in Trust for pension benefits will increase each year as the actuarially required contribution is far greater than the annual pension payments. It will be a number of years before the pension payments for additional retirees catch up with the annual contribution.
103 2/23
232
Draft
Summary of Positions and Personnel Changes Personnel Changes and Compensation The Fiscal Year 2019 Budget includes the expenditures for 110 full time and 17 part time positions. Included in the Budget are total personnel cost increases of 4% or $380,000 compared to the Fiscal Year 2018 Budget. Employer insurance and benefit costs have decreased slightly. Personnel cost increases are due to normal wage growth. Insurance and benefits has decreased due new employees choosing lower cost health insurance options. Village employees are compensated based on individual contracts/agreements approved by the Village Board, the Village Compensation Policy or the contents of a Collective Bargaining Agreement. The Village Administrator and Police Chief have individual contracts with the Village Board which expire April 30, 2019. Non-union employees are covered by the Village Compensation Policy. The Compensation Policy established a three percent merit increase pool and a one percent bonus pool. Merit adjustments are allocated based on three criteria; performance, overall achievement of goals and tasks and the appropriate level of pay within the range considering performance. The budget for Fiscal Year 2019 includes 4% pay increases for these employees. Actual increases will be based on performance evaluations and the bonus programs. The first collective bargaining agreement was approved by the Village Board in March, 2010 for the village police patrol officers. The Metropolitan Alliance of Police (MAP) represents the 37 police patrol officers. A new agreement was approved in January, 2015. The agreement awarded patrol officers a six step pay plan with step increases ranging from 6.44% to 8.67% received on the employee anniversary date if not at the highest step. As of April 30, 2018, there are 25 officers who have reached the top of the step plan. The agreement also outlined annual cost of living increases for the contract years 2013-2018 as 2.5% for the first 4 years and 2.9% for the final year of the contract. The agreement expires April 30, 2018. The Village has an agreement with the Police Sergeants employed in the Village Police Department. These employees, (eight positions), are not members of the MAP union which represents the police patrol officers. The Agreement is effective May 1, 2013 and expires April 30, 2018. The Agreement states all Sergeants promoted before January 1, 2010 will maintain a base salary which is 15% above the highest paid patrol officer’s base salary. Sergeants promoted after January 1, 2010 have a 3 step plan consisting of base pay at a rate of 10% greater than the highest paid patrol officer for the 1st year, 12.5% greater for the 2nd year and 15% greater for the 3rd year. The Village also has a collective bargaining agreement with the Public Works employees who are represented by the International Union of Operating Engineers, Local 150 Public Employees. Their second agreement was approved in January 2016. This agreement is effective May 1, 2015 and expires April 30, 2018. A total of 18 employees are represented by the union. Employees were placed into a 10 step wage program with progression through the steps on an employee’s anniversary date and May 1 increases to the steps of 2.5% in 2015, 2.5% in 2016 and 2.75% in 2017. The following table and chart show the latest five year history of staffing levels for the Village. Total staffing measured in FTE’s has increased by 7 over the five year period. This amount is comprised of 4 full-time positions and 3 additional part-time employees.
104 2/23
233
Draft
Village of Oswego
0.00
10.00
20.00
30.00
40.00
50.00
60.00
70.00
Police Protection General Government Public Works
Five-Year History of Staffing by Function
Actual FY 2015 Actual FY 2016 Actual FY 2017 Projected FY 2018 Budget FY 2019
55%24%
21%
Summary of Staffing by Function2018
Police Protection General Government
Public Works
56%26%
18%
Summary of Staffing by Function2015
Police Protection General Government
Public Works
105 2/23
234
Draft
Actual Actual Actual Budget Projected BudgetFY 2015 FY 2016 FY 2017 FY 2018 FY 2018 FY 2019
Total Staff by FT Equivalents 113.05 116.05 118.05 119.00 118.50 119.00Total Employees 122.00 123.00 125.00 127.00 125.50 127.00
109 2/23
238
Draft
Village of Oswego Capital Improvement Program (CIP)
Fiscal Years 2019-2023 The Village adopted the CIP Plan for Fiscal Years 2019-2038 in April, 2018. The CIP is updated annually and discussed in conjunction with the Annual Village Budget. A summary of the first five years of the CIP are included within the Village Budget since the Fiscal Year 2019 capital projects have been included in the Budget. The goal of the CIP is to assist the Village Board and Staff in the long term financial planning of capital improvements. The Strategic Plan adopted by the Village in February, 2017 provides guidance and prioritizing capital improvements for the next three years. There are a number of high cost projects listed in the Strategic Plan which require staff to work on;
Infrastructure for roadways and water/sewer lines Defining an alternate water source and associated costs Construction of a new Police Headquarters Facility Bringing METRA (train service) to the Village Researching funding alternatives for widening Wolf’s Crossing Road
Background The population of Oswego increased from 13,000 residents in calendar year 2000 to over 33,000 residents in calendar year 2016. With the increased population came numerous new subdivisions, commercial development and a host of public infrastructure improvements. With the new development came miles of new roadways, curb and gutter, water mains, sewer mains, storm sewers, street lighting, traffic signals, wells and water towers, street signage and landscaping. The Village is responsible for the maintenance and future replacement of this entire new infrastructure. Long term planning discussions allow the Village to appropriately schedule and secure the funding needed to ensure the Village infrastructure is maintained at acceptable levels for the residents now and in the future. Capital Planning The Capital Planning process is a financial tool used to plan for future infrastructure replacement. By identifying the future costs and year of replacement for the respective project/infrastructure improvement, action can be taken to determine the sources of funding to use to pay for the capital item. Accumulating the money over time or using debt financing are a couple of possible funding options. The end product of this planning is formally known as a Capital Improvement Plan/Program (CIP).
Capital Improvement Plan (Program), or CIP, is a short-range plan, usually four to ten years, which identifies capital projects and equipment purchases, provides a planning schedule and funding options for the plan. Capital Improvement/Project- a capital improvement is a substantial, nonrecurring expenditure for a physical improvement with a useful life greater than one year. Repairs and maintenance expenditures are generally not considered as capital improvements unless the repair extends the useful life or productive capacity of the asset. Capital improvements/projects included in the CIP have a cost equal to or greater than $25,000. Vehicle replacements are included in the CIP for long term planning purposes.
The completed CIP is available for viewing on the Village of Oswego website at www.oswegoil.org. Funding for capital improvements is supported from the annual Motor Fuel tax revenue, Roadway capital
110 2/23
239
Draft
improvemimprovemuser fees bmajority oreplacemeinfrastruct Fiscal YeThe CIP hstaff will bdeterminineliminatedhave been Funding fImprovemimprovemWater & Slisted by c
Category
FACILIT
OTHER
VEHICLWATER IMPROV
PUBLIC
ROADW
ANNUAL
Facilities facility acOctober, 2The local 19 years.
I
ment fees/Devments to our wbilled to custoof the public ient beyond teture replacem
ear 2019-2023has listed expbe reviewing ng the need fd if no fundinn approved an
for the projectment Fund andments are accoSewer Capitacategory and
TIES
ES/EQUIPME& SEWER
VEMENTS
IMPROVEME
WAY IMPROVE
L ROAD PRO
expenditures ccounts for $82018. The Visales tax reve
VEHICEQUIP
3%
WATER &SEWER
IMPROVEME18%
PUBLIC IMPROVEMEN
(TIF)11%
ROAIMPRO
veloper contribwater distributomers. The Cinfrastructuren years from
ment will be d
3 CIP enditures ovethe listed cap
for the projectng can be founnd included in
ts is providedd the Water &ounted for in tal Fund or the by year for F
ENT
ENTS (TIF)
EMENTS
OGRAM
TOTAL
are 61% of th8 million of thllage issued denue will be u
OTHE3%
CLES/MENT%
&
ENTS
NTS
ADWAY VEMENTS3%
butions and ltion and sanitCIP has an exe within the Vtoday. A co
due for comple
er the next fivpital projects t and identifynd to pay for n the Fiscal Y
d from the Ge& Sewer Capithe Motor Fu Vehicle Funiscal Year 20
FY 2019
$8,000,00
$410,00
$440,50
$2,416,35
$1,444,60
$392,00
$75,00
L $13,178,45
he capital prohe total costs.debt of $27 mused to pay th
ER
ANNUPRO
ocal sales taxtary sewage c
xtended time hVillage is less oncern for the etion at the sa
ve years in excto determine ing funding sthe project. A
Year 2019 Bud
neral Fund, Mtal Fund. Th
uel Tax Fund,d. The follow
019-2023.
FY 2020
00 $
00 $10,00
00 $266,97
50 $3,103,35
07 $2,383,00
00 $954,00
00 $200,00
57 $6,917,32
ojects for Fisc The new fac
million in FY 2he annual deb
AL ROAD OGRAM
1%
x revenues recollection syst
horizon out tothan ten yearVillage is the
ame time at a
cess of $96 mpriorities, det
sources. ProjeAll of the listedget.
Motor Fuel Tahe expenditurTIF Fund, Ca
wing table sho
FY 2021
0 $
0 $10,00
0 $394,56
0 $10,707,90
0 $1,360,00
0 $707,00
0 $600,00
0 $13,779,46
cal Year 2019cility is antici2017 to provibt service on t
FAC
ceived by the tems are geneo twenty yearsrs old and wile fact that a lahigh cost.
million. The Vtermine projeects may be ded Fiscal Yea
ax Fund, TIF res for all the apital Improvows the capita
1 FY 202
$0
00 $410,0
69 $292,8
00 $12,894,2
00 $225,0
00 $13,072,0
00 $2,000,0
69 $28,894,0
9. The new poipated to be code the fundin
the debt issuan
CILITIES61%
Village. Caperally funded s because thel require arge amount o
Village Boardect timing, deferred or evar 2019 projec
Fund, Capitacapital
vement Fund,al improveme
2 FY 202
$0
000 $335,
862 $462,
200 $24,687,
000 $638,
000 $5,189,
000 $2,000,
062 $33,312,
olice headquaompleted in
ng for the projnces over the
pital from
of the
d and
vencts
al
the ents
23
$0
,000
,780
,600
,000
,000
,000
,380
arters
ject. e next
111 2/23
240
Draft
Water & Sewer Improvements total $2.4 million with the meter replacement program getting underway at a cost in year one of $1.7 million. Downtown development public improvements are budgeted at $1.4 million in two blocks of the TIF District. Vehicles/equipment average an annual cost of $400,000 over the first five years of the CIP. The Village vehicle policy and grading system are used to determine the year of replacement for each vehicle and piece of equipment. Even though an item’s grading score warrants the item for replacement, many vehicles and equipment are not replaced until sometime after the scheduled replacement year. For Fiscal Year 2019, $440,500 is budgeted including $110,000 for new Mobile Data Terminals for the police department fleet, $27,000 for a Building & Zoning pickup truck replacement, $136,000 for police vehicles and a police smart trailer and $150,000 for a Public Works vehicle replacement. Fiscal Year 2019 Budget The Fiscal Year 2019 budget includes a total of $13.2 million in capital improvements. The capital projects are budgeted in the Motor Fuel Tax Fund, TIF Fund, Capital Improvement Fund, Water/Sewer Capital Fund and the Vehicle Fund. All of these expenditures are being supported from operating revenues or reserve balances of the respective Fund. Transfers from the Capital Improvement Fund and Water & Sewer Fund are budgeted to support the Vehicle Fund expenditures. Motor Fuel Tax Fund The annual capital expenditures charged to this Fund are for the Annual Road Program. The Village has less than $0.1 million in the FY 2019 Budget for road infrastructure improvements. The roads are selected based on the Public Works departments rating condition of the streets, street usage and other local agency factors. TIF Fund $1.4 million is budgeted for two downtown development blocks residing in the TIF District. These improvements are needed for roadways, utility relocations and construction of a parking lot. This is the first year of a multiyear project. Capital Improvement Fund $8.9 million in capital improvement projects is included in the Fiscal Year 2019 Budget. Ten projects are being started or completed during the fiscal year.
Roadway Improvements- $400,000 included for two separate IDOT projects (Village share for State Route 34 Roadway Improvement and the Treasure Road intersection improvement). The Village share of a traffic signal installation being paid jointly with a neighboring Village is budgeted at $150,000. The Wolf Road-section 1 (phase 2&3 planning) is included at $150,000.
Police Facility- $8 million is included in the budget. The new building is to be completed in October, 2018.
Police department vehicle mobile computer replacements budgeted at $110,000. Replacement Network switch and new computer desktops are budgeted at $.02 million.
Enterprise Information Planning System- $150,000 is budgeted for the purchase of the ERP system modules, implementation training and implementation project oversight. The ERP system includes new financial software with integrated modules for accounting, cash receipting, payroll, human resources, payables, permitting, reporting, budget, customer service, utility billing, accounts receivable billing, etc. Modules will also include integrated adjudication
112 2/23
241
Draft
software, ticketing software, work management software and this system will be accessible and used by all departments.
The purchase and installation of video monitoring cameras for Village Hall are also included in the budget ($35.000).
Water and Sewer Capital Fund $2,416,350 is included in the Budget for this Fund. Five projects account for the budget amount in Fiscal Year 2019.
Sanitary Sewer Lining Program-$80,000 to continue the annual sewer lining program.
Water meter & remote reader replacement program- $1,725,750 is budgeted to begin this program. Total cost of the program is estimated to be $5.0 million over a five year period.
Booster station replacements ($130,000) and engineering for lift station generators ($75,000) are included in the budget.
Future Water Source- $405,600 for analysis of an alternative water source for the Village.
Vehicle Fund $330,500 is included in the budget to replace five vehicles and a smart trailer.
Police- two police interceptors and one Pickup truck $136,460
Building & zoning pickup truck - $ 27,040 Public works- Large Ford dump truck w plow- $150,000 Police purchasing one Smart Trailer $ 17,000
Impact of Capital Improvements on Operating Costs Most capital improvement projects are non-recurring in nature and are considered a one-time outlay. However, some projects do add to future operating costs. Some capital improvements are considered recurring because dollars are spent annually on that type of improvement. Of all the projects listed previously, three improvements are considered as recurring by the Village. The Annual Road Program, Sewer Sanitary Lining program and Vehicle replacements budgeted in the Motor Fuel Tax Fund, Capital Improvement Fund, Water & Sewer Capital Fund or Vehicle Fund are the only recurring expenditures. The Annual Road Program plan is spending less than $100,000 in FY 2019 and saving the remaining funding to pay for roadway improvements in FY 2020 and FY 2021. The program saves the Village thousands in reconstruction costs as the cost to resurface a road is $14/square foot compared to $80/square foot to reconstruct the road. The Sanitary Sewer Lining program spends $80,000 to $125,000 annually on relining the existing sanitary sewer system rather than replace the existing lines through major construction. This saves the Village thousands in contracted construction costs and liability insurance claims for sewerage backups in homes. The vehicle replacement expenditures effectively reduce the maintenance and repair costs which would occur if the vehicles were kept in the fleet for longer time periods. The vehicle maintenance budgets are not increasing above the FY 2018 budget amounts. The replacements also provide a positive effect on the environment because of the more efficient vehicles being purchased and a positive morale boost to the employees. The other listed items are all significant nonrecurring expenditures. Motor Fuel Tax Fund The Annual Road Program is supported from State Shared revenue received from the State imposed fuel
113 2/23
242
Draft
tax ($850,000) which is restricted in use to only allowable expenditures per IDOT. If the Village did not use this money for road rehabilitation, it would be used to offset operating costs for snow removal and the cold patching of pot-hole repairs and other general street maintenance costs. $75,000 will be used to repair alleys within the Village downtown area and the balance saved for road improvements in the next two fiscal years. TIF Fund Development infrastructure improvements in the TIF Fund are supported from dollars in other Village Funds. This impacts the operating budgets of those other Funds. Over the next two fiscal years, the dollars annually allocated for the Annual Road Program will be used to complete the improvements budgeted in the TIF Fund. The TIF Fund will pay back the Other Funds in future years. Capital Improvement Fund The $8.9 million in capital improvement projects included in the Fiscal Year 2019 Budget are all non-recurring expenditures. If we break the projects into categories of State of Illinois projects, Maintenance projects, Roadway improvements and Facility projects, the impacts on operations can be identified. Maintenance projects account for four of the listed projects.
Police department computer replacements. A total of $225,000 in non-recurring budgeted costs. The replacement of a network switch and individual computers/laptops will not occur again until four years after installation. These projects will have little impact on operating costs as the funding was set aside over the past four years to pay for the replacements.
Police vehicle mobile computer replacement and connectivity project will cost $110,000. This is a one-time non-recurring cost and should last 3 to 5 years. Funds will be set aside each year for the future replacement of these systems.
Village Hall surveillance camera system. This is a one-time purchase and installation cost of $35,000. There will be an increase for the annual operating expense for the monitoring service.
Roadway Improvement projects account for four items.
The installation of traffic signals at an intersection bordering a neighboring community will cost $150,000. This will be a one-time cost but add future operating costs to the budget.
The final share of an IDOT project for Route 34 road improvements is $71,000. Future maintenance costs will have to be budgeted upon final completion.
The Village share of intersection improvements for another IDOT road improvement project is $21,000. This may add some future operating costs to the budget.
Wolfs Crossing Road Improvements- section one, phase 2&3 engineering is budgeted at $150,000. This is part of a large improvement project which will be funded from grants and bond proceeds. The payback for the bond issue will ultimately take away funds from operations for the term of the debt issuance.
Facility projects include the Police Facility construction and the Enterprise Information Management System.
The new Police Facility to be constructed is a non-recurring item which will have a significant increase in operating costs above the current police facility and will also require additional staffing to operate the new facility. The total costs are not accurately measurable at this time but based on initial perceptions the increase in annual operating costs could be in the range of $100,000 to $200,000 including new personnel.
The Enterprise Information Management system is also a one-time non-recurring expenditure which will have an increase to the cost of operations. $150,000 is budgeted for implementation costs in FY 2019. The annual maintenance fee after the initial installation and implementation
114 2/23
243
Draft
will be $202,000 for support and system upgrades. The efficiencies gained from the new system should more than offset the increase in annual costs.
Water and Sewer Capital Fund Three of the four projects totaling $2,336,350 are non-recurring projects included in the Budget.
Water Meter & Remote Reader Replacement- The budget includes $1,725,750 for the first full year of a five year system upgrade. The obsolescence of current equipment is forcing the replacement of the approximately 11,000 water meters and remote meter readers. Estimated total project cost of over $5.0 million.
Booster station replacements ($130,000) and engineering for lift station generators ($75,000) are included in the budget. Both of these items are one-time costs which are necessary to prevent larger costs or repairs to the water system. These expenses do take away money which would have been used on other expenses or saved for future expenses.
Future Water Source - $405,600 is budgeted for costs associated with studies, consultants and engineering to determine the most optimal choice for the Village to pursue in providing a sustainable water source for the residents. As part of a larger project, these costs do not impact current operations but in the end will add additional costs to future budgets for operations once the water source is chosen and used.
All of the above projects are being funded through accumulated reserves, sales tax revenue and annual operating transfers from the respective Funds.
115 2/23
244
Draft
Captital Improvement 5-Yr Plan by Fund FY 2019 FY 2020 FY 2021 FY 2022 FY 2023
Capital Improvement FundFacilitiesPolice Headquarters 8,000,000 - - - -
Facilities Total 8,000,000 - - - - OtherDowntown Holiday Lights - 10,000 10,000 10,000 10,000 ERP System 150,000 - - - - Network Switch (New PD Facility) 145,000 - - - - Planimetric Capture - - - - 125,000 Village Facility Surveillance Camera System 35,000 - - - - Computer Replacements 80,000 - - 200,000 - Server Refresh - - - 200,000 - Network Switches - - - - 200,000
Other Total 410,000 10,000 10,000 410,000 335,000 VehiclesSquad CAR MDT UpgradeMil 110,000 - - - 110,000
Vehicles Total 110,000 - - - 110,000 Roadway ImprovementsBridge Repair (3) - Barnaby, Old Post, & Pearce's Ford - - - - 18,000 Traffic Signal at Galena/S. Concord 150,000 - - - - US Route 34 Village Share of IDOT Rd Construction 71,000 - - - - Village's Share of IDOT Improvements - US 30 at Intersection with Treasure Road 21,000 - - - - Wolf's Crossing- Section 1 - Phase 2 & 3 150,000 954,000 324,000 12,874,000 - Wolf's Crossing- Section 2 - Phase 2 & 3 - - 383,000 198,000 5,171,000 Annual Road Program (CI) - - - 1,400,000 1,400,000
Roadway Improvements Total 392,000 954,000 707,000 14,472,000 6,589,000 Capital Improvement Fund Total 8,912,000 964,000 717,000 14,882,000 7,034,000
Motor Fuel Tax Roadway ImprovementsAnnual Road Program (MFT) 75,000 200,000 600,000 600,000 600,000
Roadway Improvements Total 75,000 200,000 600,000 600,000 600,000 Motor Fuel Tax Total 75,000 200,000 600,000 600,000 600,000
Public Improvements Total 1,444,607 2,383,000 1,360,000 225,000 638,000
116 2/23
245
Draft
Captital Improvement 5-Yr Plan by Fund FY 2019 FY 2020 FY 2021 FY 2022 FY 2023Tax Increment Financing Fund Total 1,444,607 2,383,000 1,360,000 225,000 638,000
Vehicles Total 330,500 266,970 394,569 292,862 352,780 Vehicle Fund Total 330,500 266,970 394,569 292,862 352,780
Water & Sewer Capital FundPublic WorksBooster Station #2 Repairs 130,000 - - - - Generators 75,000 - - - - Generators Wells 3 & 4 - - 450,000 - - New Main - Minkler Road Watermain - - - - 375,000 New Main - Wolf Road Watermain - 695,000 5,096,500 - - Transmission Lines from Plant to Towers - - 2,000,000 9,000,000 9,000,000 Water Meter & Reader Replacement 1,725,750 1,256,750 1,256,750 1,246,750 - Water Tower - Fox Chase - - - 750,000 - Water Tower - Hunt Club - 1,000,000 - - - Water Tower - Village Center - - - - 625,000 Water Towers - Cleaning - - - - 45,000 Water Treatment Facility - New 5 MGD - - 1,767,450 1,767,450 14,512,600 Water Treatment Facility - Preliminary Engineering & Land Acquisition 405,600 21,600 7,200 - - Sanitary Sewer Lining Program 80,000 80,000 80,000 80,000 80,000 Lead Service Line Replacement Program - 50,000 50,000 50,000 50,000
Public Works Total 2,416,350 3,103,350 10,707,900 12,894,200 24,687,600 Water & Sewer Capital Fund Total 2,416,350 3,103,350 10,707,900 12,894,200 24,687,600
Grand Total 13,178,457 6,917,320 13,779,469 28,894,062 33,312,380
117 2/23
246
Draft
Debt Guidelines, Summary of Debt Issuances and Outstanding Debt
Village of Oswego’s Debt Restrictions and Requirements Debt restrictions in the State of Illinois differ for home rule municipalities and non-home-rule municipalities. The Village of Oswego is a home rule municipality. All municipalities in the State of Illinois with a population greater than 25,000 are automatically granted home rule status unless this designation is removed by the voters through a referendum. Municipalities with a population under 25,000 may achieve home rule status if approved by the voters through a referendum.
Currently, there are no substantive legal restrictions or limits imposed by the State of Illinois on the amount of debt that a home rule municipality can incur. However, non-home-rule municipalities are limited in the amount of debt they can incur to 8.625% of the community’s equalized assessed valuation. Home rule municipalities are also not required to submit a referenda question to the voters regarding the issuance of debt whereas non-home-rule municipalities under most circumstances may not issue debt unless a referendum has been approved by the voters which authorizes the issuance of said debt. Debt Guidelines The Village adheres to the following guidelines regarding the issuance of debt: The Village will limit short and long-term borrowing to capital improvements or projects
which carry a benefit that exceeds five years (5 years) and cannot be financed from current revenues.
When the Village finances capital projects by issuing bonds, it will pay back the bonds within a period not to exceed the useful life of the project.
The Village will limit the amount of outstanding general obligation debt of the Village to a maximum of 5% of the equalized assessed valuation of the Village.
When issuing debt, the Village will strive to maintain a level annual debt service repayment schedule to maintain a stable debt service tax rate from year to year. When possible, debt issues will be re-paid using alternate revenue sources.
The Village will comply with all annual debt disclosures and file them with the respective agencies.
Although the Village of Oswego is not restricted to the amount of debt that it may incur, there always exists the possibility that the State may impose such a restriction in the future. The Village’s estimated taxable equalized assessed valuation for the 2017 levy year is $876,658,533. Using the current debt limit restriction for non-home-rule municipalities, 8.625% of the Village’s EAV would yield a maximum debt limit amount of $75,611,798. As of May 1, 2018, the Village had principal outstanding of $46,900,000 which would be applicable to the limit if such a limit were imposed upon all municipalities in the State, including home rule municipalities. As of May 1, 2018, the Village’s debt to EAV ratio calculates to 5.35% using the 2017 taxable equalized assessed valuation.
118 2/23
247
DraftThe Villa
33,078 wfor issuancompareddebt issu2014 andthe 2011to be repproperty service re Summar
C
OODD$fube
COODD20th
$0
$200
$400
$600
$800
$1,000
$1,200
$1,400
$1,600
age’s currenwhich resultsnces suppord to the issu
uances descrd the 2016 de, the 2012, a
paid from watax levies i
equirements
ry of Curren
Corporate PurpOriginal Issue Original Issue Date of MaturiDescription: B1,755,000 of uel tax reveneing retired b
Corporate PurpOriginal Issue Original Issue Date of MaturiDescription: B004. Finanche Water & S
nt bond ratins in a gross drted by pledguances supporibed below,ebt issuancea portion of ater & sewef the pledge.
nt Debt Issu
pose RefundinAmount: $4,Date: Auity: De
Bonds issued Corporate Pu
nues, sales taxby the Debt Se
pose RefundinAmount: $2,Date: Ocity: De
Bonds issued cing is being pewer Fund.
Water/ se
ng is Aa2. Tdebt per capiged Sales ta
orted by wate, a portion oes are to be r
the 2013, aer revenues. ed revenue s
ues as of Ma
ng Bond Seri055,000
ugust 15, 2009ecember 15, 2
to refund $2urpose Bond x revenues aervice Fund (
ng Bond Seri325,000
ctober 11, 201ecember 30, 2
to refund $2provided from
F
Tota
ewer reven
The official Uita as of Mayaxes and Moer & sewer rof the 2011,repaid from sportion of t All of the d
sources were
ay 1, 2018
ies of 2011 Outs
9 Outs029
2,300,000 of Series 2004B
and water and$1,440,000) a
ies of 2012 Outs
12 Outs019 2,430,000 of m water and s
Fiscal Year E
al Debt P
nues Sal
U.S. Censusy 1, 2018 ofotor Fuel Tarevenues of $ a portion osales and MFhe 2014 anddebt issuance not suffici
standing Princstanding Inter
Corporate PuB. Financingd sewer revenand the Water
standing Princstanding Inter
Corporate Pusewer revenue
End
Per Capit
les & MFT
s population f $1,418. Thax (MFT) re$285. Of thof the 2013, FT revenues
d the 2017 dces would beient to cover
cipal: $2,540rest: $ 365
urpose Bond g is being pronues. The or & Sewer Fu
cipal: $ 720rest: $ 32
urpose Refunes. The debt
ta
revenues
for the villahe debt per cvenues is $1
he six outstana portion o
s and a portidebt issuancee supported r the annual
0,000 5,525
Series 2004Aovided from moutstanding dund ($1,100,0
0,000 2,550
nding Bond Sis being retir
age is capita1,133 ndingof the on of
es are from
l debt
A andmotor
debt is 00).
Series red by
119 2/23
248
Draft
Corporate Purpose Refunding Bond Series of 2013 Original Issue Amount: $8,595,000 Outstanding Principal: $8,375,000 Original Issue Date: May 17, 2013 Outstanding Interest: $1,583,200 Date of Maturity: December 15, 2027 Description: Bonds issued to refund $3,350,000 of Corporate Purpose Bond Series 2006A, $1,725,000 of Corporate Purpose Bond Series 2007A and $2,950,000 of Corporate Purpose Bond Series 2007B. Financing is being provided from motor fuel tax revenues, sales tax revenues and water and sewer revenues. The outstanding debt is being retired by the Debt Service Fund ($6,590,000) and the Water & Sewer Fund ($1,785,000).
Corporate Purpose Refunding Bond Series of 2014 Original Issue Amount: $4,040,000 Outstanding Principal: $3,090,000 Original Issue Date: November 20, 2014 Outstanding Interest: $ 172,800 Date of Maturity: December 15, 2027 Description: Bonds issued to refund $1,725,000 of Corporate Purpose Bond Series 2006A, $395,000 of Corporate Purpose Bond Series 2006B, $675,000 of Corporate Purpose Bond Series 2007A and $1,170,000 of Corporate Purpose Bond Series 2007B. Financing is being provided from motor fuel tax revenues, sales tax revenues and water and sewer revenues. The outstanding debt is being retired by the Debt Service Fund ($2,345,000) and the Water & Sewer Fund ($745,000).
Corporate Purpose Bond Series of 2016 Original Issue Amount: $27,105,000 Outstanding Principal: $27,105,000 Original Issue Date: June 8, 2016 Outstanding Interest: $17,454,350 Date of Maturity: December 15, 2037 Description: Bonds issued to pay for the land acquisition and construction of a new Police Headquarters Facility. Financing is being provided from sales tax revenues. The outstanding debt is being retired by the Debt Service Fund.
Corporate Purpose Bond Series of 2017 Original Issue Amount: $5,070,000 Outstanding Principal: $5,070,000 Original Issue Date: July 25, 2017 Outstanding Interest: $1,259,600 Date of Maturity: December 15, 2029 Description: Bonds issued to refund $5,295,000 General Obligation Bonds, Series 2009. The Financing is being provided from water revenues. The outstanding debt is being retired by the Water & Sewer Fund.
Summary of Current Loans as of May 1, 2018
IEPA Low Interest Loan
Original Loan Amount: $1,346,766 Outstanding Principal: $ 553,608 Loan Date: January 15, 2005 Outstanding Interest: $ 53,297 Date of Maturity: January 15, 2025 Description: Loan acquired to provide for the installation of radium removal equipment at well sites. The loan is being paid from water and sewer revenues from the Water and Sewer Fund.
Principal and interest payments are paid out of the Village’s Debt Service Fund for debt supported by pledged sales tax and MFT tax revenues. The Water & Sewer Fund pays out the principal and interest for debt supported by water and sewer revenues. Of the $4,262,125 in Bond principal and interest payments to be made in FY 2019, $2,823,300 will be paid from general sales tax and motor fuel tax revenue and $1,438,825 will be paid from water and sewer revenues.
120 2/23
249
Draft
The Water and Sewer Fund is also responsible for repaying the IEPA loan. The principle and interest to be paid in FY 2019 totals $86,701. Impact of Debt Issuances All of the information on the current outstanding debt issuances shows the Village is committed to paying the debt service through 2037. The Fiscal Year debt service due of $4.3 million declines annually through 2037. The general sales taxes, motor fuel taxes and water revenues used to pay down the debt would be utilized to expand existing programs, create new programs, increase roadway maintenance and save for designated capital improvements if the Village did not have the outstanding debt service payments. The following chart shows the total principal and interest outstanding at the end of each fiscal year. The IEPA Loans are not included in this chart. The Village abates the tax levies for all of these debt issuances each year.
Principal Original Outstanding as Principal Interest Total
Debt Issuance Name Issue of May 1, 2018 Due FY 2019 Due FY 2019 Due FY 20192011 (Refunding Bonds 2004A & B) 4,055,000 2,540,000 325,000 87,275 412,2752012 (Refunding Bonds 2004) 2,325,000 5,070,000 355,000 21,600 376,6002013 (Refunding Bonds 2006A, 2007A & B) 8,595,000 8,375,000 55,000 250,050 305,0502014 (Refunding Bonds 2006A&B, 2007A&B 4,040,000 3,090,000 1,165,000 92,700 1,257,7002016 General Obligation Bonds 27,105,000 27,105,000 200,000 1,221,750 1,421,7502017 General Obligation Refunding Bonds 5,070,000 5,070,000 330,000 158,750 488,750Total Debt Service 51,190,000 51,250,000 2,430,000 1,832,125 4,262,125
2004 IEPA Loan #17-1445 1,346,766 553,608 73,316 13,384.82 86,700.68 Total Debt and Loans 52,536,766 51,803,608 2,503,316 1,845,510 4,348,826
Summary of Debt Outstanding and Fiscal Year 2019 Debt Service Requirements
$0
$10,000,000
$20,000,000
$30,000,000
$40,000,000
$50,000,000
$60,000,000
$70,000,000
$80,000,000
Total Future Debt Service
Interest Principal
Fiscal Year Ending
121 2/23
250
Draft
If the pledged revenues are not sufficient to meet the annual debt service, the debt issuances if left on the property tax rolls would create the tax rates indicated in the following chart. The Tax rates reflect the Village’s desire to maintain a level debt service structure to avoid large variations year over year. The fiscal year tax rate is calculated based on the 2017 EAV.
TOTAL EXPENDITURES 16,077,013 17,655,562 17,219,785 17,868,481 4% 1%
GENERAL FUND (100)
FY 2019 Budget vs FY 2018
Projected Budget
0
1,000,000
2,000,000
3,000,000
4,000,000
5,000,000
6,000,000
7,000,000
8,000,000
9,000,000General Fund Expenditures
FY 2017ACTUAL
FY 2018BUDGET
FY 2018PROJECTED
FY 2019BUDGET
126 2/23
255
Draft
Corporate The Corporate department is the general administrative hub of the Village. Village Board, Administration, Village Clerk and Human Resources expenditures are all found within this department.
Actual Actual Actual Budget Projected Budget
FY 2015 FY 2016 FY 2017 FY 2018 FY 2018 FY 2019
Corporate Village Administrator 1.00 1.00 1.00 1.00 1.00 1.00
Total 6.75 6.75 7.75 7.50 7.50 7.50 Administration The Village Administrator is responsible for all the day-to-day administration of the Village. The Village Administrator supervises members of the management team and coordinates efforts to implement the policy direction of the Village Board. The Village Clerk’s Office is the official keeper of the records for the Village that includes but is not limited to intergovernmental agreements, Village project files, ordinances, resolutions, minutes of Board meetings and all other legal documentation in regards to the actions of the Village of Oswego. Records retention, storage and destruction are functions of the Village Clerk. The Clerk is also appointed as the Local Election Official and the Freedom of Information Act (FOIA) and Open Meetings Act (OMA) officer for the Village. The Assistant Village Administrator/Human Resource Director is responsible for the personnel management of the Village and oversees special projects at the direction of the Village Administrator, including shared service initiatives. The Assistant Village Administrator oversees the Human Resources Generalist, IT/GIS Manager and Purchasing Manager. The Human Resource Department maintains a centralized personnel program that assists departments with recruiting, risk management, training and supervising the Village workforce while complying with local, state and federal laws. The Department coordinates the Village’s insurance programs and all employee benefit programs.
127 2/23
256
Draft
Fiscal Year 2019 Budget Total department budget expenditures decreased 1% from FY 2018 budgeted amounts due to the transfer of building maintenance funds to Public Works. The FY 2019 Budget is 11% greater than FY 2018 projected amounts due to lower than budgeted expenditures in legal services and building maintenance.
Personnel costs are increasing 4% over budget due to annual wage increases and potential merit bonus payments.
Professional services increased 9% from the FY 2018 budget due to the second bi-annual community survey planned for summer of 2019, as well as increased funding for staff development in line with the Village’s Strategic Plan.
Contractual services decreased 58% with the transfer of building maintenance funds for Village Hall moved to the Public Works budget.
Communication costs increased 57% from the FY 2018 budget due to a significant codification project coming in FY 2019 with the adoption of a unified development ordinance (UDO).
Challenges/Issues Implementation of the 2017 Strategic Plan continues to be a major focus. While the Village Administrator will have a role moving all Strategic Priorities forward, the Administration Staff will particularly focus in two areas: Efficient Growth and Development and a Productive and Engaged Workforce.
• Effective Growth and Development: Progress continues in targeting downtown development opportunities. Major achievements in FY 2018 included approving a redevelopment agreement for 59 S. Adams. Moving into FY 2019, the focus will shift to stewarding that project forward and working to develop other key downtown sites.
• Creating a Productive and Engaged Workforce: Major initiatives for FY 2019 include the continued implementation of the Munis ERP system. The set up in a multi-phase, multi-year process that requires significant staff time but will result in better access to more current information across the Village. In FY 2019, we also plan to launch a leadership development program in conjunction with our neighboring communities of Montgomery and Yorkville.
Fiscal Year 2018 Accomplishments The Village completed several significant projects in FY 2018. The Village Board approved a redevelopment agreement for 59 S. Adams, which will bring $64 million of investment in the downtown to include residential and commercial properties, as well as two structured parking facilities. This project kicks off continued aggressive redevelopment focus in the downtown TIF area. The Village continues to lead and participate in shared service initiatives. Regular meetings with the Village of Montgomery and the United City of Yorkville have resulted in several shared service opportunities, including expanding shared staffing to include a Facilities Manager hired in FY 2018.
128 2/23
257
Draft
Strategic Plan Goals and Objectives Village Administrator
• Support economic development efforts, especially downtown redevelopment and residential growth in the community.
• Continue to advocate for Metra extension to Oswego, including developing a lobbying strategy and working with CMAP to list the project as a high priority project.
Village Clerk • The Village Clerk’s office will be involved in the implementation of the permitting and
licensing portion of the ERP system, providing a more efficient tool for managing these processes.
Assistant Village Administrator/Human Resources Director • Continue Shared Service Initiatives • Establish Leadership Development Program to support employee skill development • Work with departments to create service improvement goals
Performance Measures –TO BE UPDATED Calendar Year Human Resources 2012 2013 2014 2015 2016 Staff Turnover 12 12 10 11 12 Number of insurance claims 36 18 20 37 28 Total claim dollars paid as of Jan. 1 for CY claims
$35,967 $4,258 $158,941 $99,026 $83,040
*Data based on calendar year
Clerk’s Department FY 2012
FY 2013
FY 2014
FY FY FY
2015 2016 2017
Number of new business licenses 56 C/56
H 49 C/53
H 51 C/24
H (C-Commercial H- Home)
Number of business license renewals
553 C/276
H
560 C/273
H
455 C/295
H
Number of business licenses processed (new and renewals)
574 C 589 C 586 C * * * 305 H 310 H 314 H Number of Ordinances 94 82 34 113 84 71 Number of Resolutions 55 59 22 60 81 94 Number of FOIA requests processed 238 259 166 337 289 218 Raffle licenses processed 19 25 12 18 14 12 Liquor licenses processed 49 56 55 61 64 58 Pawnbroker license processed 2 Tobacco licenses processed 29 28 28 23 23 25 Video Gaming licenses processed 6 8 8
**See number above. Number of new and renewal business licenses are now tracked separately.
543020 Maintenance, Building 66,351 80,000 65,000 - (65,000) (80,000) All expenditures related to Village Hall grounds, building exterior/interior repairs and mechanical equipment, including cleaning contract
Total Operating Supplies 3,336 5,590 4,600 3,600 (1,000) (1,990)
TOTAL CORPORATE 1,251,665 1,434,042 1,286,845 1,425,880 139,035 (8,423)
136 2/23
265
Draft
Building and Zoning The function of the Building and Zoning Department is to foster healthy living conditions, to ensure building code compliance and to preserve the Village’s existing housing/commercial stock through the administration and implementation of all adopted Village ordinances. The Building and Zoning Department Mission Statement: The purpose and function of the Building and Zoning Department is to increase public safety, health and welfare within the built environment, in both new construction and renovation; to secure the safety of life and property from hazards incidental to the design, erection, repair and occupancy of buildings. This is achieved through plan review, proper inspection practices, as well as education and enforcement of codes and standards. We strive to preserve the appearance and property value of existing structures through efficient code enforcement; all with the highest level of customer service attainable. We believe the residents of Oswego and builders alike are entitled to professional,
efficient and accurate guidance from trained professionals in the areas of construction and maintenance of any and all property within the Village.
We are committed to provide the highest level of professional, ethical and customer-oriented services to our residents and fellow professionals in a courteous and timely manner.
We willingly participate in a program of continuing education and testing in order to keep our staff informed of the latest techniques and requirements within the building trades industry, national building and fire codes as well as customer service.
The Building and Zoning Department serves a vital role in the community and wants to provide that service in the most expeditious and courteous manner possible. Staffing has remained at the same levels since FY 2014 excluding the part time intern position.
Actual Actual Actual Budget Projected Budget FY 2015 FY 2016 FY 2017 FY 2018 FY 2018 FY 2019
The Department presides over three divisions: Inspection Services, Administrative Services, and Code Compliance. Staffing has remained constant over the past few years. The purpose of the Inspection Services operation of the department is to secure the expressed intent of the building code and to ensure public health and safety insofar as they are affected by building construction. This is achieved by completing “plan reviews” (plans and specifications conform to the requirements of the building code) and “field inspections” (construction conforms to the plans and specifications). The Code Compliance Division is responsible for ensuring compliance with property standards and adopted Village Ordinances zoning violations. Common issues include distressed property complaints, waste disposal violations, inoperable vehicles, tall grass, signage, and others. Code Compliance helps maintain a high-quality community environment. We strive to achieve those standards through education and enforcement of code, and by responding timely to complaints and communicating the resolution. The Administrative function of the Department is responsible for the development and implementation of processes and procedures, building permit entry and billing, customer service, inspection scheduling, code enforcement coordination, contractor registration and other administrative tasks. Fiscal Year 2019 Budget Total department budget is up 3% ($18,653) compared to the FY 2018 Budget.
Personnel Services are up 5% ($21,538) due to normal wage increases. Professional Services have decreased 24% ($5,000) due to a reduction in
engineering fees. Communication costs are down 2% ($125) due to decreases in printing costs. Professional Development decreased 2% ($125) due to a reduction in dues
expenditures. Operating Supplies has decreased 22% ($2,500) due to reductions in code
book purchases and fuel costs.
Challenges/Issues The department has been operating with limited staff for completing all the requirements of Village Ordinances and the building code. Immediate needs within the department are more computerization of incoming data from field inspections. Scanning and electronic document management for permits will be necessary. As future growth occurs, staffing levels may need to be reviewed and more efficient operations put in place to keep up with the increase in demand for services. Revenue sources will also need to be analyzed to compensate for the potential number of employees hired and the operating costs which may be incurred. Increased home starts may stretch the department to the limits in spring and summer months. Additional clerical staff will be required when home starts exceed 150/yr. and normal annual permit volume remains constant or increases. Fiscal Year 2018 Accomplishments Increased cross departmental and inter-jurisdictional communication and cooperation.
138 2/23
267
Draft
Established relationships and cooperation with external organizations including but not limited to: other municipalities, chamber of commerce, contractors, business owners, and residents.
Compliance rates for code enforcement activity were improved again over FY 18. Change of Occupancy permit process has been re-evaluated as part of the Software
evaluation process. Staff training and continuing education increased: newly hired staff is being trained to
obtain certifications. Maintained International Code Council 100% ICC certified department status. Increased safety updates and training were provided in the Department. Utilized returning interns to effectively manage code enforcement assistance as well
as front service counter hours and service without increases in overtime. Building Permits Calendar Year
2012 2013 2014 2015 2016 2017 Single family 112 131 103 53 54 27 Two family units 0 0 0 0 0 4 Multi-family units 0 83 10 0 0 10 Senior Housing Units 3 18 77 19 2 0 Total 115 232 190 72 72 41
Percentage Split Single Family 97% 57% 54% 74% 74% 65.% Multi 3% 43% 46% 26% 26% 35%
Strategic Plan Goals and Objectives Implement new software to provide the highest level of customer service through
efficient and accurate communication Expand service through Web-Portal to allow 24-7 submission of many permits
documents and services. Ongoing work with developers and contractors and Village staff to identify and
define all areas of the building process which may be expedited and accelerated. Continue education through seminars and ICC certification testing. Participate in International Code Council (ICC) Safety Awareness Week. Cross train department employees to reduce exposure of limited staff numbers. Enhance Building & Zoning information on the Village website. Prepare to update and amend Village codes to a newer version of the ICC code Eliminate outdated codes/ ordinances when possible.
Total Communication 7,898 7,789 6,980 7,664 684 (125)
142 2/23
271
Draft
GENERAL FUND (100)BUILDING AND ZONING (1002500)
FY 2017ACTUAL
FY 2018 BUDGET
FY 2018PROJECTED
FY 2019BUDGET
FY 2019 Budget vs FY 2018
Projected Budget
Professional Development
558000 Travel and Training 5,474 7,200 7,200 7,200 - - ICC and NFPA sponsored certifications/seminars for inspectors, organizational and customer service seminars for office staff
558015 Dues 565 725 725 600 (125) (125) National Fire Protection Association(NFPA)International Code Council(ICC)South Suburban Building Officials Association (SSBOA)Suburban Building Officials (SBOC)Illinois Plumbing Inspectors Association (IPIA)
Total Professional Development 6,039 7,925 7,925 7,800 (125) (125)
Operating Supplies
564000 Books and Publications 1,003 2,000 2,000 1,000 (1,000) (1,000) 2015 International Building Code2002 National Fire Code, ASTM Standards
562600 Gasoline 2,909 5,500 4,000 4,000 - (1,500) Fuel for five (5) Village owned vehicles
Total Operating Supplies 8,354 11,500 10,000 9,000 (1,000) (2,500)
TOTAL BUILDING AND ZONING 686,780 732,679 723,400 751,332 27,932 18,653
144 2/23
273
Draft
Community Development The Community Development Department is responsible for the administration of the development review process, including project management and current/ long-range planning. The department provides guidance to property owners, developers, citizens and other units of government on planning and other zoning related issues. Community Development prepares background reports and recommendations for the Planning and Zoning Commission and the Village Board. It also maintains and revises the Comprehensive Plan and Zoning Ordinance and prepares maps and other graphic materials for the Village, other agencies, and the general public. The Community Development Department provides staff liaisons to the Planning and Zoning Commission, the Historic Preservation Commission, ECO Commission and other committees as needed. The department assists and coordinates downtown redevelopment related projects and performs special projects. There are no changes to staffing in the department.
Fiscal Year 2019 Budget The department budget has maintained a 0% increase compared to the FY 2018 Budget.
Personnel Services are up 2% ($4,137) due to salary increases. Insurance/benefits have increased 6% ($6,917) due to health insurance
cost increases. Professional services are down 38% ($5,000) due to eliminating the
miscellaneous professional services. Contractual services are down 24% ($6,190) due to a decrease in
general insurance. Communication costs are down 6% ($278) due to reductions in
telephone expenses. Professional development costs have increased 4% ($200) due to
increased dues. Operating supplies has decreased 5% ($500) due to lower expected
fuel costs.
Actual Actual Actual Budget Projected Budget FY 2015 FY 2016 FY 2017 FY 2018 FY 2018 FY 2019
Community Development Community Development Director 1.00 1.00 1.00 1.00 1.00 1.00 Project Coordinator 1.00 1.00 1.00 Building & Zoning Assistant 1.00 1.00 1.00 1.00 1.00 1.00 Staff Planner 1.00 1.00 1.00 1.00 1.00 1.00 GIS/IT Coordinator 1.00 1.00 - - - - Chief Infrastructure Inspector 1.00 1.00 1.00 1.00 1.00 1.00
Total 6.00 6.00 5.00 4.00 4.00 4.00
145 2/23
274
Draft
Challenges/Issues Fiscal Year 2018 was a challenging and productive one for the Community Development Department. Staffing vacancies required the department to re-prioritize activities to focus on current development and economic development projects. The year saw an increase in the number of requests submitted to the department. Even with staffing vacancies, Community Development improved the average amount of time it takes for projects to receive, review and approval action by the Village Board. The department also worked with other staff members and consultants on the implementation strategy of the Comprehensive Plan and TIF District. In the upcoming year, with the vacant positions being filled, staff will be able to continue its efforts towards current development, economic development, and the additional tasks as assigned by the Strategic Plan. Staff will also have to work around the incorporation of the new ERP system which will take time from the Department’s core responsibilities to allow for training in the new software system. Fiscal Year 2018 Accomplishments
Completed several phases of the Downtown TIF District including processing entitlements and the redevelopment agreement for The Reserve at Hudson Crossing Project and the entitlements for the 63 W. Washington development.
Maintained and updated the Zoning Map and Street Maps. Completed downtown parking analysis Revised the fee structure to align with market expectations. Continual surveying of neighboring communities fee structures. Promoted vacant and incomplete residential developments to the building
community.
Strategic Planning Goals and Objectives Achieve a minimum of two ground breakings by 2019 within the TIF District Maintain the database of residential developments. Continue to engage the
building community regarding residential development. Reach out and assist developers to encourage completion of existing projects and
take advantage of available opportunities. Continue to analyses the fee structure to keep it aligned with market trends. Develop zoning updates to encourage development in the downtown area. Initiate usage of the ERP system to facilitate efficient use of resources.
Total Printing Expense 1,035 1,100 950 1,077 127 (23)
554000 Advertising, Bids and Records 1,055 700 700 700 - - Posting of legal notices, requests for proposals, etc.
561015 Postage 355 500 800 500 (300) -
553000 Telephone Expense 2,891 2,750 2,500 2,495 (5) (255) Telephone service and cell phone service
Total Communication 5,336 5,050 4,950 4,772 (178) (278)
Professional Development
558000 Travel and Training 1,544 3,500 3,500 3,500 - -
ICSC ConferenceZoning and land use related seminars/conferences, GIS/Computer training, organizational, customer service and self-improvement related seminars/training, AICP study and test preparation fee
151 2/23
280
Draft
GENERAL FUND (100)
COMMUNITY DEVELOPMENT (1003000)
FY 2017ACTUAL
FY 2018 BUDGET
FY 2018PROJECTED
FY 2019BUDGET
FY 2019 Budget vs FY 2018
Projected Budget
558015 Dues 1,145 1,100 1,100 1,300 200 200 American Planning Association(APA)American Institute of Certified Planners(AICP)
Total Professional Development 2,689 4,600 4,600 4,800 200 200
561030 Operating SuppliesSupplies for inspections of public improvements 573 4,500 1,000 4,500 3,500 -
Total Operating Supplies 3,628 9,500 5,500 9,000 3,500 (500)
TOTAL COMMUNITY DEVELOPMENT 413,657 474,586 469,687 474,622 4,935 36
152 2/23
281
Draft
Economic Development The Economic Development Director is charged with taking a strategic approach to supporting economic expansion and new development within the Village of Oswego. Stated goals include: creating and maintaining a robust Business Expansion and Retention effort; site selection assistance for new businesses; promoting specific properties and the Oswego brand globally; and creating a business-friendly environment. The Director takes an efficient and innovative approach to achieving these goals, by relying on new “out of the box” methods and community collaborations to streamline efforts and maximize impact. Moreover, the department wishes to deliver superior results and accountability and will implement performance metrics to benchmark success The Economic Development director is also responsible for the implementation of the following initiatives included in the 2017 Strategic Plan:
59 S. Adams St. project plan Old Village Hall Block plan TIF District marketing plan Economic Development Strategic Plan
The staffing levels in this department remained unchanged with only the one authorized full time position. However, the Economic Development director now oversees the Community Relations department to ensure a strategic and cohesive approach towards communications, tourism, marketing, business attraction and retention.
Actual Actual Actual Budget Projected Budget Economic Development FY 2015 FY 2016 FY 2017 FY 2018 FY 2018 FY 2019
Economic Development Director 1.00 1.00 1.00 1.00 1.00 1.00 Total 1.00 1.00 1.00 1.00 1.00 1.00
Fiscal Year 2018 Budget Total department budget is decreasing slightly ($103) compared to the 2018 Budget.
Personnel Services is increasing 6% ($6,180) due to wage increases. Insurance & Benefits is decreasing 6% ($1,288) because of lower health insurance costs. Professional Services decreased 1% ($600) due to lower anticipated consulting/appraisal
costs. Contractual Services is decreasing 8% ($379) because of lower general insurance costs. Communication is decreasing 20% ($1,786) from lower advertising costs. Professional Development is decreasing 19% ($2,230) lower dues costs. Operating Supplies is remaining at the $750 budget.
153 2/23
282
Draft
Economic Metrics Fiscal (FY) or Calendar (CY) Year
2017 2018 2019 est. TIF Annual Increment - FY $0 $19,259 $39,000 Annual Sales Tax Proceeds- FY $6,041,568 $6,100,000 $6,161,000 Annual Food & Beverage Tax Proceeds - FY $0 $420,000 $700,000 Number of Business Licenses Issued- CY 825 tbd na
Commercial Vacancy Rates
o Commercial corridor vacancy rates: o Office vacancy rate: o Industrial vacancy rate:
Challenges/Issues The ED director is in the process of creating an Economic Development Strategic Plan. Focus areas include:
Downtown Oswego: The revitalization of the downtown is critical with significant focus on inviting development on 59 S. Adams St. property and Old Village hall blocks
Industrial properties: This area of the market is booming nationwide. Oswego’s industrial vacancy rate is approximately 1%. Oswego must develop a strategy towards this sector that accounts for the relatively high cost of spec-built new industrial properties
Commercial Corridors: The Rt 34 and Orchard Rd corridors are critical to Oswego’s tax base. Separate strategies may be appropriate for the various commercial areas, depending on their respective needs and challenges
Workforce Development: While traditionally the purview of educational institutions,
Oswego’s workforce development strategy will rely on capitalizing on strategic partnerships and preparing for long term opportunities and employment trends. A Workforce Development strategy must also be nuanced to account for a variety of populations in Oswego
Business attraction and retention: Underpinning each of the sector/area-specific strategies should be a robust approach to attracting and retaining Oswego-based business.
Fiscal Year 2018 Accomplishments The Village of Oswego made significant strides towards realizing goals spelled out in its 2016 Strategic Plan. Longhorn Steakhouse opened in August to an overwhelming positive response. Steve Buresh’s Cheesecake Store is set to open in February 2018 in the Orchard Junction shopping center.
154 2/23
283
Draft
Downtown development efforts are progressing. On December, 11th, 2017, the Village Board voted to approve a Redevelopment Agreement with Shodeen LLC to bring a $64 million, two-building, mixed use development to 59 S. Adams Street. Simultaneously, the Oswego Brewing Company is building out its new location on 59 S Main Street. The Village also continues to partner with interested developers on the 113 Main Street, the site of the old Village Hall and Community Development Buildings. Overall, Oswego’s retail market has a current vacancy rate of 6.2%. This number is anticipated to increase to some extent due to the significant changes in the retail market, particularly as retailers consolidate locations or file for bankruptcy. The industrial and flex space vacancy rate stood at an extremely low .6%. Staff expects continued fluctuation in the commercial corridor retail sector, significant growth downtown, and modest growth in new home starts in FY 2019.
558015 Dues 3,249 3,300 3,300 870 (2,430) (2,430) IEDC, IEDA,ICSC
Total Professional Development 10,101 11,600 10,100 9,370 (730) (2,230)
Operating Supplies
564000 Books and Publications 10 500 500 500 - -
561005 Office Supplies 1,372 250 250 250 - -
Total Operating Supplies 1,382 750 750 750 - -
Capital Outlay
565015 Computer Software 6,000 - - - -
Total Capital Outlay 6,000 - - - - -
TOTAL ECONOMIC DEVELOPMENT 99,992 206,752 203,750 206,649 2,899 (103)
159 2/23
288
Draft
Community Relations In 2017, the Community Relations Department was restructured to better align with the Village’s strategic objectives. The department was moved under the Economic Development Director. The positions within the department were restructured to include two Community Engagement Coordinators, one with a focus on marketing and communications and the other on special events and business outreach and retention. The Community Engagement Coordinators oversee external Village communications and marketing efforts, including the continuation of 2016-2017 regional positioning branding initiative of “Go Oswego”. The Department also acts as the planner and coordinator of a variety of community events, publications, promotional materials, press releases, website and other written communications for the Village. The Coordinators work on tourism initiatives to attract visitors to the community through overnight stays, attractions, dining, and shopping. Finally, the Community Relations Department provides a staff liaison to the Cultural Arts Commission. The Village’s decided to join the Aurora Area Convention/Visitors Bureau (AACVB) to seek better results in overall tourism and advertising of Village events. The agreement requires the Village to allocate 90% of the Village’s annual Hotel Motel Tax revenue. Two new programs are slated to begin in FY 2019; the creation of a public art program and an annual revitalization of the downtown Christmas Decorations. The Village is also intending to transition to a new way of funding special events. Currently, Wine on the Fox is a self-sustaining event, which draws funds and deposits profits in a segregated account. The Village intends to follow that model with Christmas Walk and several of its other special events. Within two years, the Village should not need to rely on the general fund to purchase goods and services related to most special events. The policies surrounding this initiative will be discussed and approved by the Village Board. The staffing levels have remained constant since 2013 when the part time visitors’ bureau position and part time grant writer position were combined to a full time position.
Actual Actual Actual Budget Projected Budget
Community Relations FY 2014 FY 2015 FY 2016 FY 2017 FY 2017 FY 2018 Community Engagement Coordinator- Marketing 1.0 1.0 1.0 1.0 1.0 1.0 Community Engagement Coordinator- Events and Business Outreach 1.0 1.0 1.0 1.0 1.0 1.0
Total 2.0 2.0 2.0 2.0 2.0 2.0
160 2/23
289
Draft
Fiscal Year 2019 Budget Total department budget decreased by 3% because of a reduction in personnel and benefit costs associated with the hiring of two new employees.
Personnel services decreased by 2% ($2,320) due to the restructuring of the department
Insurance & Benefits decreased 37% ($17,172) due to reductions in health insurance costs.
Professional Services increased 10% ($11,400) due to additional costs to join the AACVB.
Contractual services decreased 2% ($633) because of a reduction in costs associated with the Village newsletter.
Communication decreased 9% ($3,010) due to a reduction in printing costs. Professional Development increased 80% ($2,000) because of increased
training and dues for staff. Operating Supplies increased 19% ($280) for miscellaneous costs.
Challenges/Issues It will be a challenge to establish a segregated fund and associated practices to foster financially sustainable events. Furthermore, the Department will need to balance the “Go Oswego” brand campaign, with a new Business Retention and Expansion program, and changes to the way the Village manages tourism. Fiscal Year FY 2017 Accomplishments
The Village completed its regional positioning exercise and debuted the new “Go Oswego” brand with its own website and logo
The Village held a very successful, financially neutral Christmas Walk event with near record turn out
Held major events in Oswego; Wine on the Fox, Oswego Beats & Eats, Oswego Literary Festival, Christmas Walk and Tree Lighting .
Strategic Planning Goals and Objectives Community Engagement
1. Recognized as a regional destination 2. Positive public perception of services 3. Well-attended events that enhance connectedness
a) Complete and Implement Regional Positioning Plan b) Implement tourism plan c) Develop marketing plan-Village services d) Create internal service response to citizen feedback e) Conduct community survey f) Marketing and promotion program for community events
Total Communication 21,982 34,037 24,127 31,027 6,900 (3,010)
165 2/23
294
Draft
GENERAL FUND (100)
COMMUNITY RELATIONS (1002000)FY 2017
ACTUALFY 2018
BUDGETFY 2018
PROJECTEDFY 2019
BUDGET
FY 2019 Budget vs FY 2018
Projected Budget
Professional Development
558000 Travel and Training 321 1,500 1,500 2,500 1,000 1,000
558015 Dues 225 1,000 1,000 2,000 1,000 1,000
Total Professional Development 546 2,500 2,500 4,500 2,000 2,000
Operating Supplies
561005 Office Supplies 679 1,000 1,000 1,000 - -
561065 Miscellaneous - - - 280 280 280
565005 Furniture - 500 - 500 500 -
Total Operating Supplies 679 1,500 1,000 1,780 780 280
TOTAL COMMUNITY RELATIONS 336,934 368,488 296,744 359,033 50,289 -21,455
166 2/23
295
Draft
Finance The Finance Department is responsible for the proper accounting, budgeting/financial reporting of all Village Funds, establishment/monitoring of internal controls, preparation/coordination of the annual budget, long term financial forecast and capital planning processes. The department is responsible for the annual audit of Village financial data, preparing annual tax levies; cash receipt collections, payroll, accounts payable, accounts receivable and billing, utility billing and collection and reception duties for incoming calls and visitors to Village Hall. Cash/investment of Village Funds, providing guidance for all types of Debt issuances and overall financial oversight are duties of the department. Full time staff consists of six positions and has not changed since Fiscal Year 2011.
Fiscal Year 2019 Budget
Total department budget is up 3% ($16,605) compared to FY 2018 budget because of increased staff development costs.
Personnel Services have increased 4% ($11,708) due to annual wage increases. Insurance & Benefits have increased 1% ($975) due to the increased employment
taxes. Professional Services has increased 3% ($2,152) due to increased investment
safekeeping costs. Contractual services decreased 8% ($2,272) due to a decrease in general insurance. Communications increased less than 1% ($17). Professional development increased 46% ($4,025) to further staff development. Operating supplies did not change from the current budget amount.
Challenges/Issues The implementation of the new ERP System has staff falling behind with the daily work tasks and new projects initiated by other departments. Staff has and will be challenged to keep up with the normal calendar year activities within the department during the year and learning the new software system. Staff has completed phase 1 of the ERP implementation but will be involved in phases 2, 3, 4 and 5 during the fiscal year. Generally, staff is losing two weeks a month with ERP training. Fiscal year 2020 cannot come soon enough as the ERP should be totally implemented by then.
Actual Actual Actual Budget Projected Budget FY 2015 FY 2016 FY 2017 FY 2018 FY 2018 FY 2019
Completed all required financial reporting including the Annual Audit, Annual Budget, Treasurers Report, State Comptrollers Report, Actuarial Reports for Pensions, Municipal Compliance Report for Police Pension, Annual Residents Financial Report
Completed and went live on schedule with phase 1 Financials of the ERP system. Began implementation of phase 2, 3 and 4.
Updated the Capital Improvement Plan and presented to the Village Board for discussion Presented Financial Forecast to Village Board and subsequently two new revenue sources
were approved and implemented generating additional revenue for the Village. Assisted Administration with Development Agreements within the TIF District.
Strategic Plan Goals and Objectives Complete all State required financial reporting and file with respective agencies on time Implement the new Enterprise Information System across all Village departments. Train
end users and create more efficient operations Research new revenue sources for the Village Review all department programs to prepare cost/benefit analysis of each program.
Total Operating Supplies 2,094 1,500 1,500 1,500 - -
TOTAL FINANCE 512,537 527,756 539,650 544,361 4,711 16,605
173 2/23
302
Draft
Information Technology The Information Technology Department mission is to identify, implement and support applications and systems that enhance service delivery, enable employee productivity and to provide leadership in the management and distribution of information by working in partnership with other departments and other entities to utilize technology to further the Village’s goals. To meet its mission, the IT department provides the following services to village departments and offices:
Offering innovative solutions which enable departments to better accomplish their goals in providing quality services to our citizens.
Providing technical assistance and advice to the Village Administrator and Department Heads on all Information Technology concerns.
Operating and maintaining a fiscally sound and reliable communications infrastructure while providing an exceedingly high level of service and support.
Facilitating interdepartmental involvement in Information Technology decisions. Providing Village employees with the best available, most cost effective technology and
procedures relating to the field of Information Technology. Continuously research new technologies in order to keep improving Information Technology
Systems and Processes. Geographic Information Systems (GIS) development and support, and Electronic Document Management System (EDMS) support.
Within the IT Department is the Geographic Information Systems (GIS) division. The GIS division helps village staff manage new development and changes in our infrastructure and natural environment. The goal of the GIS division is to broaden perception and incorporate a geographic perspective into existing workflows and business practices. Through the use of GIS technologies we strive to:
Improve citizens' access to government Effectively manage assets and resources Ensure quality and effective decision making Improve data accuracy Automate workflows, improve production, and increase efficiency
Full time staffing included one full time position and a part time intern. The part time intern position has been eliminated due to the outsourcing of the IT support.
Actual Actual Actual Budget Projected Budget FY 2015 FY 2016 FY 2017 FY 2018 FY 2018 FY 2019
Information Technology IT Manager - - 1.00 1.00 1.00 1.00 Intern - - - 0.25 - -
Total - - 1.00 1.25 1.00 1.00
174 2/23
303
Draft
Fiscal Year 2019 Budget The total budget for Fiscal Year 2019 has increased 3% ($25,037) compared to the FY 2018 budget. Professional services and Communication are the two areas of budget increases.
Personnel services have decreased 2% ($1,520) because of the decrease in part time wages. Insurance and benefits is up 1% ($387) due to increases in health insurance costs. Professional services increased 19% ($30,000) due the ERP implementation. Contractual services decreased 1% ($3,930) due to efficiencies gained in software licensing
costs. Communication costs have increased 5% ($100) for telephone costs. Operating supplies have remained at the budget amount of $8,250.
Challenges/Issues The major challenge in this department is the ability to get everything done with only one person. The IT Manager took on the role of project manager for the implementation of the Enterprise Information Management System in Fiscal Year 2017. The Village decided to outsource the daily IT maintenance and IT projects to a contracted firm to allow the IT Manager to focus on the ERP project. The IT Manager will still oversee the contracted firm and major IT activities. Fiscal Year 2018 Major Accomplishments
Implemented Phase 1 – Finance module, of the new Enterprise Information Management System
Updated Server Hardware to new Virtual Appliance, Dell/EMC VxRail. Completed new GIS web map for the Village – gis.oswegoil.org Upgraded the Village Boardroom/Executive conference room Audio/Video hardware and
equipment to the latest in A/V specifications. Workstation/Laptop refresh for Village Hall and Public Works Migrated the Village to Office 365 to provide all employees with 24/7 access to all Village
email and resources Instituted a Single Sign-On application for Village staff to provide a more secure environment
for accessing software. Implemented a Mobile Device Management solution for the management of corporate mobile
devices. Updated and created numerous mapping systems utilized by Village departments
Strategic Plan Goals and Objectives
Creating a private network of the Police Department Squad cars Upgrade/refresh Police Department squad car MDT’s Continued implementation of Enterprise Information Management System assisting all
departments in migrating existing data, setting up system and new processes Implementation of new networking equipment for the new Police Department facility. Review non-automated workflow processes throughout Village departments to determine the
Total Operating Supplies 3,264 8,250 4,200 8,250 4,050 -
TOTAL INFORMATION TECHNOLOGY 402,953 835,883 829,749 860,920 31,171 25,037
179 2/23
308
Draft
Police The primary functions of the Oswego Police Department are the preservation of public peace and order, the prevention and detection of crime, the apprehension of offenders, and the protection of people and property. The Department must uphold the Constitution of the United States, the Constitution of the State of Illinois, as well as enforce the laws of the State of Illinois and the ordinances of the Village of Oswego.
The Oswego Police Department Mission Statement:
The Oswego Police Department is committed to enhancing the quality of life by ensuring the safety of the community through the protection of life, liberty and property. We will continue to foster cooperation by building diverse partnerships and serving the community with integrity, professionalism and compassion.
To this end, the Oswego Police Department shall: Preserve the public peace, prevent crime, detect and arrest offenders against the criminal laws and ordinances effective within the Village, suppress riots, mobs and insurrections, disperse unlawful or dangerous assemblages, protect the rights of all and preserve order at all elections and assemblages. Administer and enforce laws and ordinances to regulate, direct, control and restrict the movement of vehicular and pedestrian traffic and the use of streets by vehicles and persons, and to adhere to rules and regulations which shall facilitate the lawful goals of the department. Remove all nuisances in public places, inspect and observe all places of public amusement or assemblage and all places of business within the Village limits which require any State, County or Municipal permit/license. Provide for the attendance of Police Officers or civilian employees in court as necessary for the prosecution and trial of person(s) charged with crimes and other violations of the law, and cooperate fully with the law enforcement and prosecuting authorities of Federal, State, County and Municipal Governments. Attain and retain maximum efficiency and effectiveness by creating policies and procedures designed to protect and serve the Village of Oswego and to satisfy the aforesaid goals. The Oswego Police Department is comprised of two divisions: Field Operations and Support Services. Each division has their own responsibilities; however, some tasks require divisions to combine efforts in order to maximize effectiveness. An example of this would be the Support Services personnel providing crime and crash data analysis to the Field Operations for resource allocation. The Field Operations Division has several duties that are completed on a daily basis. Some of these duties include: Calls for service, criminal complaints, traffic safety, preliminary
180 2/23
309
Draft
investigations, neighborhood watch, preventative patrols in residential/business areas and protect life & property within the Village of Oswego. The Patrol Division operates 24-hours a day, 7 days a week with two 12-hour shifts. The Support Services Division is comprised of three different units within this Division. These units are Records, Investigations and Special Assignments (Traffic Officers and School Resource Officers). In addition to these specialty units, the Support Services Division is responsible for personnel management, training, records, data retrieval, building and vehicle maintenance, budget control, scheduling and Uniform Crime Reporting. The Investigations Unit has several duties, some of which are completed on a daily basis, while others are over an extended period of time. Some of these duties include: Follow-up to criminal police reports, conduct more complex investigations, gather intelligence information on criminal activity, proactive computer investigations, evidence and property control, crime scene unit, school liaisons, juvenile services, neighborhood watch, crime prevention and narcotics. The Records Unit is maintained in compliance with the State of Illinois and United States Department of Justice. The Special Assignment Unit has several duties, some of which are completed on a daily basis, while others are covered over an extended period of time. Some of these duties include: Follow up to accident reports or school related incidents, traffic enforcement, educational speaking, juvenile services and proactive enforcement efforts to address certain high frequency crash locations. Staffing levels within the Police Department remained the same from FY17 to FY18. Total staffing is currently at 65 employees.
Actual Actual Actual Budget Projected Budget FY 2015 FY 2016 FY 2017 FY 2018 FY 2018 FY 2019
Police Department Total 63.00 64.00 65.00 65.00 65.00 65.00 Sworn Personnel 49.00 49.00 49.00 49.00 49.00 49.00
181 2/23
310
Draft
Fiscal Year 2019 Budget Total Department budget is up 2% ($181,475);
Personnel services are up 2% ($101,308). There was an 8% ($24,719) decrease in the Overtime budget.
Insurance/benefits increased 3% ($88,921) due to increases in health insurance costs.
Professional services are up 39% ($28,810). This increase is due primarily to the purchase of new CAD software for the in-squad laptops. $4,000 has also been earmarked in Crime Prevention or the Grand Opening event at the new Police Headquarters.
Contractual services are down 15% ($66,839) due to Building Maintenance costs moving to the Public Works budget. There was a 13% ($4,450) decrease in the Vehicle Maintenance line item due to the implantation of most squad repairs being facilitated through Public Works Fleet Maintenance. There was also a 30% ($5,420) reduction in the Police Equipment Maintenance line item.
Communications are up 18% ($39,562) due to an increase the KenCom Dispatch Center annual user fee.
Professional development decreased 3% ($2,172) due to a decrease in training costs.
Operating supplies are down 5% ($8,115) due a decrease in the fuel budget.
FY 2018 Major Accomplishments The Department continued to maintain crime enforcement and prevention
while seeing a slight decrease in Part 1 and 2 crimes.
Part 1 Crimes Part 2 Crimes 2016 414 460 2017 391 423 Difference 23(Down 5%) 37 (Down 8%)
The new Police Headquarters is currently under construction and is set for
completion in October of 2018. As of January 2018 the project is approximately 35-40% complete and tracking on budget.
During the late spring months, the Department saw an increase in gang related shootings in the Village as well as neighboring communities. The Department worked closely with our law enforcement partners to increase efforts to reduce gang related shootings in the Village. The Village saw no additional gang related shootings in 2017 beyond the one incident that occurred in the spring.
Strategic Plan Goals and Objectives Strategic Plan – Productive & Engaged Workforce
The Department has determined that staffing levels are a priority for operational effectiveness. Efforts to mitigate employee retention issues, upcoming retirements and
182 2/23
311
Draft
forecasted Village growth will become a focal point of the Department leadership team moving forward.
The Department will develop a Crisis Intervention Team (CIT) over the next fiscal year. This program will assist our staff in properly identifying individuals in our community that are need of crisis intervention. It will also provide our staff with the training to improve our initial response and create a follow up piece to assist in getting citizens at risk the help they need to not be in crisis.
Strategic Plan – Community Engagement
The police department continues to strive to provide quality police services by creating a positive public perception of our organization. This is accomplished through numerous community engagement opportunities that the Department generates on a daily basis. Through ongoing training and community feedback, our membership builds community trust using the knowledge they obtain from working in a professional organization.
Strategic Plan – Infrastructure Maintenance and Expansion Staff will continue to work towards completing the new Police Headquarters. As the
move in date arrives, staff will be challenged with the transition from the old facility to the new one. This will require great coordination by all Departments in the Village to ensure a successful outcome. The hiring of a Facilities Manager will assist in this movement as well as managing this new facility.
Comparisons In an effort to provide a benchmark for expenditures, we surveyed communities with a similar population size and created the following table for FY 2018. We then took the overall budget and divided it by the population and the result is a cost per capita. As you can see in this comparison, we provide law enforcement services at a lower cost per capita than the average rate. We also supplied an average as well. Each community supplied us with the personnel, total budget and population.
FULLTIME PERSONNEL INCLUDES SWORN AND CIVILIAN PERSONNEL FOR THE PD
City / Village Total Budget Population Cost Per Capita
183 2/23
312
Draft
Police Department Statistics The Department has provided the projected statistics for fiscal year 2018 and included actual statistics fiscal years 2016 and 2017 for comparison. The reason for this table is so one can relate and identify with the Department’s changes in service demands.
TOTAL POLICE DEPARTMENT 9,143,683 9,522,133 9,405,954 9,704,058 298,104 181,925 5,335,428 4,368,630 9,704,058
190 2/23
319
Draft
Public Works The Public Works department is responsible for the maintenance, repair and replacement of the Village’s roadway system (137 center lane miles). Activities related to streets include the following: street patching; concrete sidewalk repair; curb and gutter replacement; pavement marking; street sign replacement and maintenance; streetlights (2,149) and traffic signal maintenance and repairs; street sweeping; and snow and ice control operations. The department annually inspects and maintains village bridges, manages landscapes, performs tree trimming and replacement, performs brush chipping, storm sewer maintenance, the annual leaf removal program, oversees contractual mowing of all Village owned properties, including rights-of-way, and mosquito spraying. The Village has 4 certified arborists who manage all the tree removal and tree maintenance. The Public Works department staffing levels remain at 24.5 FTE’s. The part time Administrative Assistant position was vacant the majority of FY 2018. The hiring of the replacement for the Administrative Assistant three months prior to the incumbents retiring used up some of the cost savings. The FTE’s of the department are allocated to the Public Works and the Water and Sewer Fund based upon work assignments.
Fiscal Year 2019 Budget The total department budget has increased 14% over the FY 2018 budget.
Personnel services increased 20% ($104,252) due to wage increases and an adjustment in allocation of salaries between the Water & Sewer fund and the General Fund.
Insurance/benefits increased 38% ($74,879) due to premium increases and an adjustment in allocation of benefits between the Water & Sewer fund and the General Fund.
Professional Services increased 24% ($4,260) due to reallocation of funding for The Conservation Foundation and the Environmentally Conscious Oswegoans Commission from the Community Development Department.
Contractual services increased14% ($157,143) due to modifications as noted below:
Actual Actual Actual Budget Projected Budget FY 2015 FY 2016 FY 2017 FY 2018 FY 2018 FY 2019
Public Works Department Public Works Director 1.00 1.00 1.00 1.00 1.00 1.00 Utility Services Director 1.00 1.00 1.00 1.00 - - Public Works Assistant Director 1.00 1.00 1.00 1.00 2.00 2.00 Administrative Assistant 1.50 1.00 1.00 1.50 1.00 1.50 Facilities Manager - - - 1.00 1.00 1.00 Operations Superintendent 2.00 2.00 2.00 2.00 2.00 2.00 Operations Supervisor 3.00 3.00 3.00 3.00 3.00 3.00 Technicians I 6.50 9.00 9.00 9.00 6.00 6.00 Technicians II 5.00 4.00 4.00 4.00 7.00 7.00 Seasonal 1.00 1.00 1.00 1.00
Total 21.00 22.00 23.00 24.50 24.00 24.50
191 2/23
320
Draft
o Snow removal expense is anticipated to decrease 9% ($20,672). The reduction reflects a reduction in salt costs offset by an increase in contractual snow removal.
o Landscaping costs increase by 41% ($36,750) as the contract will be bid in FY 19. New areas include mowing and basin maintenance upon activation of the Estates of Fox Chase SSA.
o Building maintenance increases 908% ($154,400) as maintenance for the Village Hall ($80,000) and police station ($67,900) are reallocated to the Public Works department.
o Equipment Maintenance decreases 74% ($37,000) while Vehicle Maintenance $40,000 is split into a separate line item.
o Maintenance, Streets/Storm Sewer decreases 11% ($13,000) as we realize a savings between the budget and the award for contractual street sweeping.
o Maintenance, Garage increases 58% ($3,500) for purchase of a compressor air dryer and a two-post auto lift.
Communication decreases 22% ($5,336) due to a reduction in telephone expense.
Professional development increases 5% ($550) for training programs for staff. Operating supplies decreased 20% ($45,500) due to the reduction in tree
purchases and other one-time purchases. Challenges/Issues The Village’s 20-year Capital Improvement Plan identifies large investments necessary to maintain and enhance our existing infrastructure. This plan demonstrates that funding will remain an issue. The department continues to investigate new technologies, improve upon existing ones, and evaluate services to meet these challenges. We are partnering with neighboring communities to realize efficiencies through shared equipment and personnel as well as joint contracts. Increased routine maintenance as infrastructure expands and ages will be difficult with the current available man hours of existing staff. We have substantially completed removal of trees infected by the Emerald Ash Borer. Replacement trees are currently on a three-year backlog based upon funding levels. Fiscal Year 2018 Major Accomplishments
The Kane-Kendall Council of Mayors Transportation approved STP funding for Federal Fiscal Year 2016-2020. Oswego will receive $2.5 million towards the widening of Wolfs Crossing Segment 1 between Harvey Road and Eola Road. The total cost to widen the road from US 34 to Eola Road is $50.6 million. KKCOM programmed the funds to be available starting in FFY18. The Village completed Phase I engineering for this project in FY 2018. Completion of this study is a prerequisite for receiving any federal funds.
The Illinois Department of Transportation continued construction to widen US 34 at the Village’s western border from Orchard Road west to IL 47 in Yorkville. IDOT anticipates completing the project in late 2018.
192 2/23
321
Draft
The Village received the prestigious Arbor Day Foundation’s “Tree City USA” award for the 23rd year in recognition of its commitment to the environment by recognizing that trees are a valued part of our infrastructure. The Arbor Day Foundation confers this award upon communities that undertake activities that promote education; partnerships; planning and management; and tree planting and maintenance.
In addition to the MFT Road project, the Village spent $1.07 million to resurface and reconstruct roads. We removed the concrete pavement and replaced it with bituminous pavement within the eastern half of the Ogden Falls subdivision. We also installed the pavement surface course in two abandoned subdivisions to spur development: Estates of Fox Chase and the Seasons of Southbury. We also reconstructed Etsinger Road.
The Village collaborated with The Conservation Foundation to update the butterfly gardens at the Village Hall.
The Public Works Department implemented phase 1 of the Enterprise Resource Planning project.
The Village partnered with the developer of Ashcroft Place Unit 3 to reconstruct Woolley Road adjacent to the new police station.
Provided vehicle maintenance services for and worked collaboratively with the Village of Montgomery on snow response.
Strategic Plan Goals and Objectives for 2019
1. Safe and efficient Wolfs Crossing – Initiate Phase 2 and 3 engineering for Wolfs Crossing while continuing to seek funding.
2. Metra service to Oswego – Continue to monitor Metra’s progress on the Phase I engineering study.
3. Safe and efficient infrastructure 4. Meet with surrounding communities and utilize services that can be shared between
communities. 5. Coordinate future road projects with Kendall County including Collins Road. 6. Complete annual street resurfacing program. 7. Implement the Enterprise Resource Planning project. 8. Monitor IDOT’s US 34 reconstruction project. Advocate Village and resident interests to
IDOT. Provide public information updates. 9. Provide technical assistance for the construction of the new police headquarters. 10. Provide technical assistance for TIF projects.
Total Insurance and Benefits 143,261 195,187 170,010 270,066 100,056 74,879
Professional Services
533005 Engineering Service 17,440 16,000 16,000 16,000 - - Consulting Engineer for Village construction projects
533030 Miscellaneous Professional Service 1,130 2,000 2,000 3,260 1,260 1,260 Drug Screens & OSHA TestingEnvironment Commission $1,000Conservation Foundation Membership $3,000
Total Professional Services 18,570 18,000 18,000 19,260 1,260 1,260
FY 2019 Budget vs FY 2018
Projected Budget
198 2/23
327
Draft
GENERAL FUND (100)
PUBLIC WORKS (1006000)
FY 2017ACTUAL
FY 2018 BUDGET
FY 2018PROJECTED
FY 2019BUDGET
FY 2019 Budget vs FY 2018
Projected Budget
Contractual Services
53-6500 General Insurance 75,978 82,867 82,000 83,172 1,172 305
542100 Disposal Service 4,897 10,000 10,000 5,000 (5,000) (5,000)
550005 Mosquito Control Expense 103,511 113,500 113,500 110,620 (2,880) (2,880) Continued spraying of the Village with additional spraying due to West Nile virus concerns
544200 Rental Expense 141 5,000 5,000 5,000 - - Rental of equipment for roadway work and street lighting
543020 Maintenance, Building 17,952 17,000 17,000 171,402 - -
Public Works $23,500
Police Facility $67,902Village Hall $80,000
543025 Maintenance, Equipment 55,500 49,700 49,700 12,688 (37,012) (37,012) Maintenance of various equipment such as plows, spreaders, mowers
543080 Maintenance, Streets/Storm Sewer 8,934 124,000 124,000 110,950 (13,050) (13,050) NPDES annual costs and annual reportingCold patching of Village streetsSmall curb workDigging and replacing storm sewer inlets
543015 Maintenance, Bridges 485 5,000 5,000 5,000 - - Upkeep and maintenance of Village bridges
543070 Maintenance, Street Lights 44,976 65,000 65,000 65,000 - - Rewiring of street lights, bulbs, fuses, etc. and repairing fallen poles by Village or outside contractors.
543055 Maintenance, Safety Equipment 3,915 2,500 2,500 2,500 - - Safety equipment purchase, i.e. hard hats, safety glasses
Purchase of safety signs for all Village buildings as required by law, supplies for sign machine and sign room, supplies for school zone signage and PD requested signage
543035 Maintenance, Garage 2,501 6,000 6,000 9,500 3,500 3,500 Upkeep of the Public Works Facility garage
562205 Street Lighting Expense 131,668 104,100 104,100 104,700 600 600 Electricity costs for all Village street lights
Total Contractual Services 928,725 1,108,867 1,108,000 1,266,010 3,608 2,741
201 2/23
330
Draft
GENERAL FUND (100)
PUBLIC WORKS (1006000)
FY 2017ACTUAL
FY 2018 BUDGET
FY 2018PROJECTED
FY 2019BUDGET
FY 2019 Budget vs FY 2018
Projected Budget
Communication
555000 Printing ExpenseMulti-Function Copier Lease 1,969 1,680 1,680 1,680 - - Notification printing of any Village project - 1,000 1,000 1,000 - - Miscellaneous 208 - - - - -
Total Printing Expense 2,177 2,680 2,680 2,680 - -
554000 Advertising, Bids and Records 1,289 1,000 1,000 1,000 - - Advertising and bid awards for roadway or infrastructure projects
561015 Postage 135 1,000 1,000 1,000 - -
553000 Telephone Expense 5,571 17,600 17,600 12,264 (5,336) (5,336) Cell Phone and telephone usage for the department
561055 Radios, Communication EquipmentReplacement of two-way radios/ cell phones 6,625 800 800 800 - - Mobile radio replacement 491 1,000 1,000 1,000 - -
Total Radios, Communication Equipment 7,116 1,800 1,800 1,800 - -
Total Communication 16,287 24,080 24,080 18,744 (5,336) (5,336)
202 2/23
331
Draft
GENERAL FUND (100)
PUBLIC WORKS (1006000)
FY 2017ACTUAL
FY 2018 BUDGET
FY 2018PROJECTED
FY 2019BUDGET
FY 2019 Budget vs FY 2018
Projected Budget
Professional Development
558000 Travel & Training 7,274 7,500 7,500 8,500 1,000 1,000
558005 Reimbursement-meal - - - 100 100 100
55-6567 Meeting Expense 57 500 500 - (500) (500)
558015 Dues 2,245 2,800 2,800 2,850 50 50 American Public Works AssociationAmerican Society of Civil EngineersAssociation of State Foodplain ManagersIllinois Arborist AssociationIllinois Municipal Signage AsssociationIllinois Department of Agriculture (Pest Control)
Total Professional Development 9,576 10,800 10,800 11,350 550 550
Operating Supplies
564000 Books & Publication 154 200 200 200 - -
562600 Gasoline 15,574 21,000 21,000 21,000 - - Fuel purchase for Public Works vehicles
543020 Maintenance, Building - - - - - 171,402 171,402
Public Works $23,500
Police Facility $67,902Village Hall $80,000
543025 Maintenance, Equipment - - - 2,000 10,688 - 12,688 Maintenance of various equipment such as plows, spreaders, mowers
543080 Maintenance, Streets/Storm Sewer - - 110,950 - - - 110,950 NPDES annual costs and annual reportingCold patching of Village streetsSmall curb workDigging and replacing storm sewer inlets
543015 Maintenance, Bridges - - 5,000 - - - 5,000 Upkeep and maintenance of Village bridges
543070 Maintenance, Street Lights - - 65,000 - - - 65,000 Rewiring of street lights, bulbs, fuses, etc. and repairing fallen poles by Village or outside contractors.
543055 Maintenance, Safety Equipment 2,500 - - - - - 2,500 Safety equipment purchase, i.e. hard hats, safety glasses
Purchase of safety signs for all Village buildings as required by law, supplies for sign machine and sign room, supplies for school zone signage and PD requested signage
543035 Maintenance, Garage - - - - 9,500 - 9,500 Upkeep of the Public Works Facility garage
558015 Dues 1,000 400 50 1,300 - 100 2,850 American Public Works AssociationAmerican Society of Civil EngineersAssociation of State Foodplain ManagersIllinois Arborist AssociationIllinois Municipal Signage AsssociationIllinois Department of Agriculture (Pest Control)
Total Professional Development 8,300 400 50 2,300 - 300 11,350
Operating Supplies
564000 Books & Publication 200 - - - - - 200
562600 Gasoline - - - - 21,000 - 21,000 Fuel purchase for Public Works vehicles
561005 Office Supplies 2,500 - - - - - 2,500
561065 Miscellaneous 7,500 - - - - - 7,500
210 2/23
339
Draft
GENERAL FUND (100)
PUBLIC WORKS (1006000)
Administration 1006010
Engineering 1006020
Road & Bridge
1006030Forestry 1006040
Fleet 1006050
Facilities 1006060
Total Expenditures
FY 2019 Budget
Expenditures by Division
561070 Maintenance, Supplies 3,100 - - - - - 3,100 Various small parts required for vehicles or equipment; road paint
561025 Tool Expense - - 700 1,000 5,000 300 7,000 Tools for Public Works vehicles; various department tools
542410 Tree Purchase - - - 100,000 - - 100,000 EAB tree replacement50/50 tree replacement program
Total Operating Supplies 13,300 - 26,700 112,000 26,000 300 178,300
TOTAL PUBLIC WORKS 469,709 44,040 885,653 497,429 162,012 346,332 2,405,175
211 2/23
340
Draft
Motor Fuel Tax Fund The Motor Fuel Tax Fund (MFT) accounts for motor fuel tax revenues received from the State of Illinois and expenditures related to the Village’s annual road rehabilitation and construction program. Village streets are selected for resurfacing or major rehabilitation based on analysis conducted by the Village Department of Public Works. The annual program is awarded to an outside contractor based on the bid results received. Village oversight is provided by the Director of Public Works and the Village contracted engineering firm. Motor Fuel Tax Funds are disbursed to the Village from the Illinois Department of Transportation on a per capita basis. Motor Fuel Taxes are derived from a tax on the privilege of operating motor vehicles upon public highways based on the consumption of motor fuel. Use of Motor Fuel Tax Funds is restricted to direct expenses associated with, but not limited to, street improvements and maintenance, storm sewers and bicycle parking facilities, paths, signs and markings based upon the appropriate Illinois State Statutes. Motor Fuel Tax operations include: micro-surfacing, concrete curb and gutter replacement, street rebuilding and improvements. Fiscal Year 2019 Budget
State shared motor fuel tax allotments are estimated at $851,758 $75,000 budgeted for repairs to complete the selected roadway
improvements $262,500 transfer to the Debt Service fund Estimated Restricted Fund Balance at April 30, 2019 is $1,361,868
Challenges/Issues IMS Infrastructure Management Services inspected the Village’s road system in 2014. On average, the road system is in “Very Good” condition. This rating is influenced by the miles of roads installed in the past ten years. More than 54% of the road area in the Village is “Very Good” or better. Of concern is the 9% of the pavement area that is currently rated at “Fair” or “Poor”. These roads will require work sooner rather than later. The 2014 study found that by 2019, the average road condition would decrease from an engineering assessment rating of 80 to 71 if no work was done. More importantly, the percentage of road area rated “Fair” or “Poor” (rating of 60 to 40) would increase to 18%. For the purposes of discussion, roads in these two categories were referred to as “approaching reconstruction.” Roads with a score of 69 today would reach a score of 40 within 10 years. The score of 40 is important, as this is the score at which resurfacing is no longer viable. The road would need to be reconstructed. The cost to resurface a road was $14/square foot compared to $80/square foot to reconstruct the road. The cost of roadway improvement expenditures will far exceed the annual amount of revenue the Village receives from the motor fuel tax. In July 2015, the Village Board approved a 0.75 percentage-point increase in the home rule sales tax. Approximately
212 2/23
341
Draft
$1.4 million of the revenue from this increase will supplement MFT Funds to create an annual road program valued at $2 million. In FY 19, a portion of the sales tax revenue will be used for non-road capital improvements. Fiscal Year 2018 Major Accomplishments The Village spent $900,000 of MFT Funds to resurface 3.54 miles of streets in the Village. Roads included: Judith Circle; Angela Circle; Weisbrook Drive from Douglas Road to Fifth Street; Windcrest Drive; Orchard Avenue from Boulder Hill Pass to Windcrest Drive; Ashcroft Lane from Arboretum Way to Amherst Circle.; Templeton Drive; Plank Drive; Stonehill Drive from Woolley Road to Theodore Drive; Forest Avenue; Hickory Street from Forest Avenue to East Benton Street; East Benton Street from Hickory Street to Monroe Street; Wilson Place from Madison Street to East Benton Street; and Monroe Street from Forest Avenue to Wilson Place. FY 2019 Expenditure descriptions: The Village will repair roads and alleys using $75,000 of MFT Funds. The balance of the FY19 allotment will be used in FY20 for the reconstruction of South Harrison Street north of Washington Street; South Adams Street between Washington Street and Waubonsie Creek; and West Jackson Street between South Harrison Street and the Illinois Railnet railroad tracks. Strategic Plan Outcome
Safe and efficient infrastructure
213 2/23
342
Draft
MOTOR FUEL TAX FUND (200)
FY 2017ACTUAL
FY 2018BUDGET
FY 2018PROJECTED
FY 2019BUDGET
Beginning Fund Balance 906,115 922,462 922,462 843,610 -9% -9%
Other Financing Sources/(Uses)Transfer to Debt Service Fund (262,500) (262,500) (262,500) (262,500) 0% 0%Transfer to TIF Fund - - - (65,000) 100% 100%Total Other Financing Sources (Uses) (262,500) (262,500) (262,500) (327,500) 25% 25%
Change in Fund Balance 16,347 (309,200) (78,852) 453,258 -675% -247%
Ending Fund Balance 922,462 613,262 843,610 1,296,868 54% 111%
FY 2019 Budget vs FY 2018
Projected Budget
-
100,000
200,000
300,000
400,000
500,000
600,000
700,000
800,000
900,000
1,000,000
Motor Fuel Tax Fund Expenditures
FY 2017ACTUAL
FY 2018BUDGET
FY 2018PROJECTED
FY 2019BUDGET
214 2/23
343
Draft
Tax Increment Financing (TIF) Fund The TIF Fund accounts for revenues and expenditures associated with the redevelopment activities within the Downtown TIF District established in September, 2016. Fiscal Year 2019 Budget
Revenues total $40,500 Total expenditures of $1,495,107 Transfers from other Funds $1,444,608 Estimated ending Fund Balance of $1,754,102
Challenges/Issues The TIF District creates many challenges as it was just established and will be two years old in September, 2018. Discussions are under way on three potential development sites. The Village owns all three sites and will use the properties to entice development. The TIF Fund received a loan from the General Fund to support expenditures including legal fees, consultant fees and a land purchase. Major Accomplishments
Approved Redevelopment Agreement for block 11 within the District.
The Reserve at Hudson Crossing is a $64 million residential and commercial development, including 245 luxury rental units in two buildings, 506 total parking spaces, including 447 public parking spaces in two-story decks that will be owned by the Village and 12,000 square feet of commercial space on Washington for restaurants and retail
Continued discussions with two other interested parties for the other two locations owned by the Village
Requested quotes for infrastructure improvements to development blocks 4 & 5
FY 2019 Expenditure descriptions:
Block 11 public improvements of $1,224,607 for design and construction of a 20 space parking lot, trash compactor, alley and utility improvements
Block 4 & 5 improvements of $220,000 for infrastructure design Strategic Plan Outcome
Expanded downtown Expand commercial investment
215 2/23
344
Draft
TAX INCREMENT FINANCING FUND (250)
FY 2017ACTUAL
FY 2018BUDGET
FY 2018PROJECTED
FY 2019BUDGET
Beginning Fund Balance - (1,608,191) (1,608,191) (1,744,103) 8% 8%
Other Financing Sources/(Uses) Transfer from General Fund - - - - 0% 0% Transfer from MFT Fund - - - 65,000 100% 100% Transfer from Capital Improvement Fund - - - 1,153,843 100% 100% Transfer from Water & Sewer Capital Fund - - - 225,765 100% 100%Total Other Financing Sources/(Uses) - - - 1,444,608 100% 100%
Change in Fund Balance (1,608,191) (310,000) (135,912) (9,999) -93% -97%
Ending Fund Balance (1,608,191) (1,918,191) (1,744,103) (1,754,102) 1% -9%
FY 2019 Budget vs FY 2018
Projected Budget
216 2/23
345
Draft
The Debt Service Fund is used to account for the principal, interest payments and paying agent fees for general obligation debt issued by the Village. Pledged Sales tax and Motor Fuel tax revenues transferred from the General Fund, Motor Fuel Tax Fund and Capital Improvement Fund are used to finance the annual payment requirements. Principal payments are due in December for each issue and interest payments are made twice a year in June and December. The Finance department oversees all the transactions within this Fund and assures the debt payments are made on time. Fiscal Year 2019 Budget
This fund has revenues exceeding expenditures by $650 $2,824,550 will be spent on paying debt service $72,979 estimated ending Restricted Fund Balance
Challenges/Issues All of the debt service is supported from general sales tax and motor fuel tax revenues which are received from the State of Illinois. Any substantial economic downturn or legislative change in the distribution of these tax revenues would have a negative effect on the Village’s ability to make the annual debt service payments. The Village does have the ability to stop annually abating the property tax levies for each debt issuance if revenues do decrease below the annual debt service requirements. Debt Issues As of April 30, 2018, the Village has total gross outstanding debt of $56,505,650 of which $37,480,000 is principal. Additional descriptions of each bond issue are provided in the Financial Policy Section of the budget. The five outstanding debt issuances accounted for in this Fund are as follows:
Corporate Purpose 2011 Refunding Bonds
Original Issue Amount: $2,300,000 Outstanding Principal: $1,440,000 Date of Maturity: December 15, 2024 Outstanding Interest: $ 207,700
Corporate Purpose 2013 Refunding Bonds Original Issue Amount: $6,770,000 Outstanding Principal: $6,590,000 Date of Maturity: December 15, 2027 Outstanding Interest: $1,230,700
Corporate Purpose 2014 Refunding Bonds Original Issue Amount: $2,955,000 Outstanding Principal: $2,345,000 Date of Maturity: December 15, 2027 Outstanding Interest: $ 132,900
Corporate Purpose Bond Series of 2016 Original Issue Amount: $27,105,000 Outstanding Principal: $27,105,000 Date of Maturity: December 15, 2039 Outstanding Interest: $17,454,350
Debt Service Fund
217 2/23
346
Draft
When issuing debt, the Village adheres to the following guidelines: √ The Village will limit short and long-term borrowing to capital improvements or projects
which carry a benefit that exceeds five years (5 years) and cannot be financed from current revenues
√ When the Village finances capital projects by issuing bonds, it will pay back the bonds
within a period not to exceed the useful life of the project √ The Village will limit the amount of outstanding general obligation debt of the Village to
a maximum of 5% of the equalized assessed valuation of the Village. As of May 1, 2018, 5% of the equalized assessed valuation was approximately $43,582,927. Outstanding principal of $37,480,000 is under the limit.
√ The Village will strive to maintain a level annual debt service repayment schedule to
maintain a stable debt service tax rate from year to year. √ The Village will comply with all annual debt disclosures and file them with the respective
agencies
218 2/23
347
Draft
DEBT SERVICE FUND (400)
FY 2017ACTUAL
FY 2018 BUDGET
FY 2018PROJECTED
FY 2019BUDGET
Beginning Fund Balance 65,965 68,040 68,040 72,412 6% 6%
REVENUESTransfer In - General Fund 2,126,525 2,660,516 2,659,566 1,139,900 -57% -57%Transfer In - MFT Fund 262,500 262,500 262,500 262,500 0% 0%Transfer In- Capital Impr. Fund - - - 1,422,650 100% 100%Interest 1,057 300 150 150 0% -50%TOTAL REVENUE 2,390,082 2,923,316 2,922,216 2,825,200 -3% -3%
Change in Fund Balance 2,076 472 4,372 650 -85% 38%
Ending Fund Balance 68,040 68,512 72,412 73,062 1% 7%
FY 2019 Budget vs FY 2018
Projected Budget
-
200,000
400,000
600,000
800,000
1,000,000
1,200,000
1,400,000
1,600,000
1,800,000
Debt Service Fund Expenditures
FY 2017ACTUAL
FY 2018PROJECTED
FY 2018BUDGET
FY 2019BUDGET
219 2/23
348
Draft
DEBT SERVICE FUND (400)
FY 2017ACTUAL
FY 2018BUDGET
FY 2018PROJECTED
FY 2019BUDGET
Professional Services
52-8220 Registrar/Paying Agent Fees 2,981 2,200 2,200 1,250 (950) (950) Total Professional Services 2,981 2,200 2,200 1,250 (950) (950)
Debt Service
59-8200 Debt Principal2006A - Village Hall & Town Center 500,000 525,000 525,000 - (525,000) (525,000) 2009 - Douglas Rd 320,000 285,000 280,000 - (280,000) (285,000) 2011 - Refunding 2004A 180,000 180,000 180,000 180,000 - - 2013-Refunding Bond 45,000 45,000 45,000 45,000 - - 2014-Refunding Bond 295,000 300,000 300,000 860,000 560,000 560,000 2016-Police Headquarters - - - 200,000 200,000 200,000
Total Debt Principal 1,340,000 1,335,000 1,330,000 1,285,000 (45,000) (50,000)
59-8201 Bond Payments - Interest2006A - Village Hall & Town Center 44,075 22,575 22,575 - (22,575) (22,575) 2009 - Douglas Rd 25,269 12,469 12,469 - (12,469) (12,469) 2011 - Refunding 2004A 60,300 54,900 54,900 49,500 (5,400) (5,400) 2013-Refunding Bond 198,500 197,600 197,600 196,700 (900) (900) 2014-Refunding Bond 82,250 76,350 76,350 70,350 (6,000) (6,000) 2016-Police Headquarters 634,631 1,221,750 1,221,750 1,221,750 - -
Total Bond Payments - Interest 1,045,025 1,585,644 1,585,644 1,538,300 (47,344) (47,344)
Total Debt Service 2,385,025 2,920,644 2,915,644 2,823,300 (92,344) (97,344)
TOTAL DEBT SERVICE FUND 2,388,006 2,922,844 2,917,844 2,824,550 (93,294) (98,294)
FY 2019 Budget vs FY 2018
Projected Budget
220 2/23
349
Draft
Capital Improvement Fund The Capital Improvement Fund is used to account for all major capital projects undertaken by the Village. These projects are generally completed over more than one fiscal year and in most instances are funded from accumulated reserves, grant revenue or General Obligation Debt Issuances. All of these projects are contracted out with general oversight provided by Village staff. Fiscal Year 2019 Budget Revenues total $3,953,000 Expenditure budget of $8,912,000. $8 million for the new Police Headquarters Transfers out to other Funds total $2,906,542. There are 10 projects for FY 2019 including completion of construction of the
new Police Headquarters. Challenges/Issues Funding for FY 2019 capital improvements is from the 2016 Bond Issuance to pay for the new police headquarters and the 0.75% Home Rule Sales Tax instituted January 1, 2016. Funding for all the identified capital improvements is always challenging as revenues are not sufficient to complete them all. Annually, through the updating of the Capital Improvement Plan, projects are selected based on available funding. Current revenues will be used to pay the annual debt service on the 2016 Bond Issuance for the new police headquarters through December, 2037 and on downtown development infrastructure improvements for the next three fiscal years. Major Accomplishments
Continued support of IDOT’s US 34 reconstruction project Commenced construction of the new Police Headquarters Reconstructed Woolley Road at the new Police Headquarters Replaced the shingles on the salt dome roof Purchased, installed, and began implementation of enterprise resource
planning software Completed the Wolf's Crossing Phase I (environmental) engineering
FY 2019 Expenditure descriptions: Village share of new traffic signal at South Concord Drive and Galena
Road ($150,000) – partner with the Village of Montgomery Village Hall and Public Works Facility security camera system ($35,000) Computer upgrades for the Police Facility ($225,000) – network switch
and system upgrades Village share of IDOT’s US 30 reconstruction project ($21,000) – Harvey
Road and Treasure Drive Village share of IDOT’s US 34 reconstruction project ($71,000) Police Headquarters ($8,000,000) – complete construction
221 2/23
350
Draft
Continued implementation of enterprise resource planning software ($150,000)
Installation of new MDT’s in police fleet ($110,000) Wolf's Crossing Rd ($150,000) –Phase 2 and 3 (design and right-of-way
acquisition) engineering
Strategic Plan Outcome Safe and efficient infrastructure Safe and efficient Wolfs Crossing
222 2/23
351
Draft
CAPITAL IMPROVEMENT FUND (300)
FY 2017ACTUAL
FY 2018 BUDGET
FY 2018PROJECTED
FY 2019BUDGET
Beginning Fund Balance 799,452 30,163,626 30,163,626 9,944,832 -67% -67%
Other Financing Source/UseTransfer In - Escrow 973,583 - - - 0% 0%Transfer to General Fund - (700,000) - - 0% 0%Transfer to Vehicle Fund - (50,000) (50,000) (330,500) 561% 561%Transfer to Debt Service Fund (1,134,631) (1,222,200) (1,222,200) (1,422,200) 16% 16%Transfer to TIF Fund - - - (1,153,842) 100% 100%
Bond Proceeds (net of issuance) 30,988,608 - - - 0% 0%TOTAL 30,827,560 (1,972,200) (1,272,200) (2,906,542) 128% 47%
Ending Fund Balance 30,163,626 6,016,626 9,944,832 2,079,290 -79% -65%
Revenues Over/Under Expenditures
FY 2019 Budget vs FY 2018
Projected Budget
223 2/23
352
Draft
Water and Sewer Fund The Water and Sewer Fund is managed by the Public Works Director with the assistance of the Utility Services Director. The water system includes eight wells, six water towers, the radium removal systems, 180 miles of water main, 2,800 fire hydrants and several thousand feet of water service lines. The system has 11,700 water meters installed providing the basis for billing customers which generates the revenues for this Fund. The sewer system consists of 628,132 feet (119 miles) of sanitary sewer lines 15” and smaller and six lift stations. The Public Works department is responsible for completing all the maintenance and repairs to the water and sewer systems. The Public Works department staffing levels are increasing by one full time position with the anticipated hiring of the new Facilities Manager. This position is part of a cost sharing agreement with one of the surrounding communities. The labor force remains at the same levels as previous years.
Actual Actual Actual Budget Projected Budget
FY 2015 FY 2016 FY 2017 FY 2018 FY 2018 FY 2019 Public Works Department
Public Works Director 1.00 1.00 1.00 1.00 1.00 1.00 Utility Services Director 1.00 1.00 1.00 1.00 - - Public Works Assistant Director 1.00 1.00 1.00 1.00 2.00 2.00 Administrative Assistant 1.50 1.00 1.00 1.50 1.00 1.50 Facilities Manager - - - 1.00 1.00 1.00 Operations Superintendent 2.00 2.00 2.00 2.00 2.00 2.00 Operations Supervisor 3.00 3.00 3.00 3.00 3.00 3.00 Technicians I 6.50 9.00 9.00 9.00 6.00 6.00 Technicians II 5.00 4.00 4.00 4.00 7.00 7.00 Seasonal 1.00 1.00 1.00 1.00
Total 21.00 22.00 23.00 24.50 24.00 24.50
Fiscal Year 2019 Budget Total revenues of $6.4 million Total expenses of $5.0 million Transfer to Water & Sewer Capital Fund of $1.3 million Ending Unrestricted Net Assets Balance of $1.9 million
Revenues Budgeted total revenues are estimated to increase 23% over fiscal year 2018
The largest component of water revenue is user charges which are estimated to increase by 25% due an increase in volume sold and due to rate increases approved September 5, 2017.
Grant revenue from the treasury rebate received on the 2009 bond issue ended in December 2017.
Interest earnings are estimated to increase 47% ($8,000) because of increased rates.
224 2/23
353
Draft
Donations/contributions are estimated to increase 70% ($7,600) from increased employee insurance contributions.
Expenses Total operating expenses decrease by 4% compared to the FY 2018 Budget.
Personnel services decreased 5% ($55,935) due to an adjustment in allocation of salaries between the Water & Sewer fund and the General Fund.
Insurance/benefits decreased 7% ($30,687) due to an adjustment in allocation of benefits between the Water & Sewer fund and the General Fund.
Professional services decreased 51% ($108,509) as the one-time expense to study system improvements to support a new water treatment plant was not completed and has been moved to the Water & Sewer Capital Fund.
Contractual services increased 4% ($62,822) o General Insurance decreased ($4,720) due to reductions in
premiums. o Water Analysis increased ($13,012) to conduct additional sampling
as mandated by IEPA. o Building Maintenance increases ($3,900) as building cleaning will
now be paid from this account. o Well Maintenance increases of ($41,130) to purchase surge
suppressors’ and uninterruptable power supplies. Well #9 will be pulled and inspected. Well #10 was pulled and inspected in FY18.
Communication expenses increased 24% ($15,610) due to increase in the cellular service plan.
Professional development is increasing 1%. Operating supplies increased 20% ($12,488) due to planned purchases of
water meter supplies. Debt service payments decreased 5% ($87,302) due to the defeasance of
the 2006 Bond Issuance and less interest being paid on outstanding balances.
Challenges/Issues The primary source of revenue for this Fund is related to Charges for Services issued in the form of bills to customers. Water and sewer usage charges received are 98% of the total revenues. Total operating revenues support operating expenses and some capital improvements to existing system components. The Village receives its water from a deep aquifer which the Illinois State Water Service estimates has approximately 20-40 years of supply at the current usage rates. The Village is studying alternative water sources to find a sustainable, cost effective alternative to groundwater. Fiscal Year 2018 Major Accomplishments
The Village conducted a feasibility study for obtaining Lake Michigan water through the DuPage Water Commission.
Initiated evaluation of potential sites for the water treatment plant.
225 2/23
354
Draft
Completed annual rehab/relining program of old manholes and deteriorating sanitary lines in Village to reduce inflow and infiltration of storm water into the sanitary sewers.
Monitored IDOT’s US 34 reconstruction projects. Protected and adjusted Village facilities as necessary.
Continued the annual leak detection and well meter testing programs to reduce real losses.
Continued a 4-year valve exercising program. Implemented a proactive maintenance program for the Village’s wells. Completed the
pulling and maintenance of the Well #9 pump. Repaired the Well 4 manifold on the WRT system. Completed a water and sewer rate study. Based upon this study, the Village Board
approved rate increases for the next five years to provide for both operations and some capital improvements.
Strategic Planning Objectives for Fiscal Year 2019
Safe and efficient infrastructure - Rehab/relining program of old manholes and deteriorating sanitary lines continues within the Village to reduce inflow and infiltration of storm water into the sanitary sewers.
Monitor IDOT’s US 34 roadway reconstruction project. Protect and adjust Village facilities as necessary.
Sustainable water source – Select the preferred water source and begin preliminary engineering regarding system requirements.
Safe and efficient infrastructure – Commence replacement of outdated water meters throughout the Village.
Water System Wells 8 8 8 8 8 Water Towers 5 5 5 5 5 # of Accounts 11,083 11,177 11,204 11,300 11,300 Population Served 32,902 33,995 3,078 33800 34,414 Wells out of service (total hours) 4,200 1,000 1,000 1,500 1,000 Media change outs 2 1 4 1 1 Total B-boxes 11,071 11,083 1,081 1,303 11,303 B-box Inspected 1,054 1,362 1,663 1,800 1,800 B-box Repaired 73 53 168 200 125 Percentage B-box Repaired 1% 1% 1% 1% 1%
226 2/23
355
Draft
Actual Actual Actual Projected Budgeted Performance Indicator FY 2015 FY 2016 FY 2017 FY 2018 FY 2019 Total Meters 11,091 11,185 11,204 11,700 11,700 Meter/reader repaired 140 109 75 75 266 Percentage Meter/reader repaired 1% 1% 1% 1% 2% Customer Meter Readings 66,556 45,194 67,167 67,167 70,528 Final reads 1,356 1,280 1,033 1,396 3,244
Well Readings (in hours) 5,840 5,480 5,480 5,480
5,480
Shutoff (letter/shutoffs) 843 394 1,154 1,300 1,300 Service Calls from Property Owner
198 103 312 300
300
Miles of water main 162 167 172 180 180 Water leaks in main line 12 7 12 15 15
Leaks / mile of main
0.07 0.07 0.08 0.07
0.07
Water leaks in service line 12 9 26 20 18 Water valves repaired or replaced 4 2 6 25 4 Total fire hydrants 2,272 2,285 2,772 2,800 2,800 Hydrants flushed 4,574 4,589 4,200 4,200 4,650
Percentage flushed 201% 201% 151% 150% 202% Hydrants repaired or
replaced 14 36 13 25
4
Percentage repaired 1% 1% 2% 1% 0.1%
Sanitary System # of Accounts 10,759 10,820 10,846 10,900 10,950 Shutoff for Fox Metro (letter/shutoffs)
368 177 291 291
265
Service Calls from Property Owner
40 36 25 30
30
Billed Water Accounts on a Bi-Monthly Basis for the Last Four Fiscal Years
FY 2015 FY 2016 FY 2017 FY 2018
May 11,013 11,083 10,900 11,186
July 11,025 11,068 10,890 11,193
September 11,145 11,123 10,970 11,215
November 11,164 11,120 10,915 11,204
January 11,193 11,117 10,995 11,233
March 10,973 11,184 11,125 11,000
227 2/23
356
Draft
Water Pumpage by Month for Last Four Fiscal Years
FY 2015 FY 2016 FY 2017 FY 2018
May 80,119,000 72,035,000 75,755,000 70,647,000
June 83,336,000 72,181,000 83,512,000 84,221,000
July 88,172,000 79,457,000 83,066,000 86,314,000
August 83,872,000 89,103,000 83,482,000 83,224,000
September 79,469,000 77,146,000 74,998,000 85,155,000
October 73,765,000 69,747,000 70,424,000 73,642,000
November 70,537,000 63,146,000 60,109,000 63,234,000
December 68,263,000 64,379,000 63,850,000 66,646,000
January 69,256,000 65,434,000 61,686,000 68,000,000
February 63,003,000 61,452,000 56,300,000 62,000,000
Change in Unrestricted Net Assets 431,530 5,677 268,285 1,411,951 426% 24771%
Other Financing Source/UseUnrestricted Net Assets 965,181 - - - 0% 0%Transfer to Water & Sewer Capital 214,325 - - (1,300,000) 100% 100%Transfer to Vehicle Fund (232,500) (35,000) (35,000) - -100% -100%Total Other Financing Source/Use 947,006 (35,000) (35,000) (1,300,000) 3614% 3614%
Ending Unrestricted Net Assets 1,616,486 1,587,163 1,849,771 1,961,721 6% 24%
543020 Maintenance; Building 29,444 28,800 28,800 32,700 3,900 3,900 Maintenance and security system fees on well houses and lift stations, and PW cleaning service
543025 Maintenance; Equipment 19,416 39,500 39,500 49,500 10,000 10,000 Maintenance and repair to public works vehicles or equipment
543055 Maintenance; Safety Equipment 4,547 2,000 2,000 2,000 - - Safety equipment for the chlorine rooms at the Village wells
234 2/23
363
Draft
WATER AND SEWER FUND (500)
OPERATIONS AND MAINTENANCE (5006070)
FY 2017ACTUAL
FY 2018 BUDGET
FY 2018PROJECTED
FY 2019BUDGET
FY 2019 Budget vs FY 2018
Projected Budget
543035 Maintenance; Garage 99 1,000 1,000 1,000 - - Maintenance at the Public Works Facility garage
543110 Maintenance; Wells 203,487 291,200 291,200 332,330 41,130 41,130 Maintenance and chemicals for wells 3, 4, 6, 7, 8, 9, 10 and 11
543060 Maintenance; Sewer Main 66,667 66,400 66,400 66,400 - - Maintenance on all Village sewer lines including lift stations and televising lines
543100 Maintenance; Water Meters 33,947 14,000 14,000 14,000 - -
Maintenance on any water meter in the Village
543105 Maintenance; Water Tower 1,839 5,000 5,000 5,000 - - Maintenance on the Village water towers andsupplies, such as light bulbs and cathodic protection
543095 Maintenance; Water Main 82,257 100,600 100,600 99,600 (1,000) (1,000) Maintenance on all Village water mains including all necessary parts
235 2/23
364
Draft
WATER AND SEWER FUND (500)
OPERATIONS AND MAINTENANCE (5006070)
FY 2017ACTUAL
FY 2018 BUDGET
FY 2018PROJECTED
FY 2019BUDGET
FY 2019 Budget vs FY 2018
Projected Budget
543030 Maintenance; Fire Hydrants 8,353 13,000 13,000 13,000 - - Purchase of new fire hydrants and maintenance of existing hydrants
543115 Maintenance; Radium Removal 402,382 400,000 400,000 400,000 - - Operation of the radium removal equipment
Total Contractual Services 1,391,955 1,548,395 1,551,953 1,611,217 59,264 62,822
Communication
555000 Printing Expense 12,905 15,100 15,100 20,100 5,000 5,000 Outsourcing the printing of utility bills
554000 Advertising, Bids and Records 96 500 1,100 500 (600) -
Advertising and bid award documents for water or sewer projects
553000 Telephone Expense 22,984 15,000 20,000 25,610 5,610 10,610 All telecommunication expenses that include auto dialers for the SCADA system, lift stations, and cell phones
Total Communication 67,650 65,600 66,200 81,210 15,010 15,610
Professional Development
558000 Travel and Training 4,412 4,700 4,700 4,700 - - Continuing education classes, local and out-of-state for water operators and staff
558015 Dues 1,221 10,700 10,700 10,860 160 160 American Water Works AssociationIllinois Rural Water AssociationKane County WaterNational Safety CouncilFox River Water Source
Total Professional Development 5,633 15,400 15,400 15,560 160 160
580100 Revolving Loan-Principal(1997 & 2004 IEPA loans) 61,261 71,517 71,517 73,316 1,799 1,799 580200 Revolving Loan-Interest(1997 & 2004 IEPA loans) 17,319 15,184 15,184 13,365 (1,819) (1,819) 580135 2011 Bond Payment - Principal 130,000 130,000 130,000 145,000 15,000 15,000 580110 2012 Bond Payment - Principal 330,000 340,000 340,000 355,000 15,000 15,000 580115 2013 Bond Payment - Principal 10,000 10,000 10,000 10,000 - - 580120 2014 Bond Payment - Principal 165,000 170,000 170,000 305,000 135,000 135,000 580145 2017 Bond Payment- Principal - - - 330,000 330,000 330,000 580125 2006B Bond Payment - Principal 125,000 125,000 125,000 - (125,000) (125,000) 580140 2009 Bond Payment - Principal 300,000 310,000 310,000 - (310,000) (310,000) 580235 2011 Bond Payment - Interest 44,113 41,675 41,675 37,775 (3,900) (3,900) 580210 2012 Bond Payment - Interest 38,400 31,800 31,800 21,600 (10,200) (10,200) 580215 2013 Bond Payment - Interest 53,675 53,550 53,550 53,350 (200) (200) 580220 2014 Bond Payment - Interest 27,813 25,750 25,750 22,350 (3,400) (3,400) 580245 2017 Bond Payment- Interest - - - 158,750 158,750 158,750 580225 2006B Bond Payment - Interest 8,633 5,313 5,313 - (5,313) (5,313) 580240 2009 Bond Payment - Interest 290,519 283,019 283,019 - (283,019) (283,019)
Total Debt Service 1,601,733 1,612,808 1,612,808 1,525,506 (87,302) (87,302)
TOTAL WATER AND SEWER FUND 4,854,123 5,168,523 5,231,285 4,977,169 (254,116) (191,354)
240 2/23
369
Draft
Water and Sewer Capital Fund The Water and Sewer Fund is managed by the Public Works Director with the assistance of the Assistant Director of Public Works – Utilities. The water system includes eight wells, six water towers, the radium removal systems, 180 miles of water main, 2,800 fire hydrants and several thousand feet of water service lines. The system has 11,289 water meters installed providing the basis for billing customers that generates the revenues for this Fund. The sewer system consists of 628,132 feet (119 miles) of sanitary sewer lines 15” and smaller and seven lift stations. Fiscal Year 2019 Budget
Total revenues of $130,000 Transfer from the Water & Sewer Fund of $1,300,000 Transfers to the Tax Increment Financing Fund of $226,000 Total expenses of $2,446,350 Ending Unrestricted Net Assets Balance of $4.0 million
Challenges/Issues The Village is refining a long-term capital improvement plan to identify system needs to maintain the system in an operating condition in accordance with all regulatory requirements. The plan will identify system costs and will drive the discussion of funding options. Current funding mechanisms are insufficient to meet the future capital improvement needs. The Village completed a utility rate study in FY 2018. Based upon this study, the Village Board approved rate increases for the next five years to provide funding for capital improvements. Major Accomplishments
Lined Crofton Road sanitary sewers. Demolished the obsolete and abandoned Kendall Point Water Tower. Washed all water towers to remove dirt and mold from the outside of the
towers. Selected a vendor and began installation of the new water meter system.
FY 2019 Expenditure descriptions: Water Meter Replacement Program $1,725,750 is budgeted to continue the meter/remote reader replacement program. This year’s program is the second of a five year program. The total program cost is estimated to be $5.6 million. Sanitary Sewer Lining Program The budget includes $80,000 to continue the annual sewer-lining program. The program is completed by the Fox Valley Metropolitan Sanitary District contractor because of an Intergovernmental Agreement the Village has with the Sanitary District. The program will eliminate tree root blockages and infiltration problems in the system.
241 2/23
370
Draft
Lift Station Engineering Investigate and engineer the installation of emergency generators at six sanitary lift stations. Installing generators at these sites will allow all facilities to operate under emergency conditions. The cost of engineering is $75,000. Booster Station Repairs The 2017 inspection of Booster Station 2 in the Kendall Point Subdivision identified required repairs to ensure this station will work. The budget includes $130,000 for replacement of the inoperable Variable Frequency Drive (VFD) and other minor repairs. The VFD allows the pump to adjust the volume of water based upon demand, thereby allowing a consistent pressure in the system. Without the VFD, the pump will either be in an on-or-off condition. Future Water Source Included in the budget is $405,000 to be used for either costs associated with proceeding with the initial planning for a future water plant or joining the DuPage Water Commission for the supply of water to the Village. Strategic Plan Outcome
Safe and efficient infrastructure Sustainable water source
242 2/23
371
Draft
WATER & SEWER CAPITAL FUND (510)
FY 2017ACTUAL
FY 2018 BUDGET
FY 2018PROJECTED
FY 2019BUDGET
Beginning Net Assets 5,646,483 5,499,147 5,499,147 5,250,640 -5% -5%
REVENUESCharges for Service
Meter Tap on Fees 123,200 110,000 75,000 80,000 7% -27%MXU Fees 29,787 30,000 25,000 25,000 0% -17%
Total Charges for Service 152,987 140,000 100,000 105,000 5% -25%
Other Financing Sources/(Uses)Transfer to TIF Fund - - - (225,765) 100% 100%Transfer to Vehicle Fund - - - - 0% 0%Transfer From Water & Sewer Fund (214,325) - - 1,300,000 100% 100%
TOTAL OTHER FINANCING SOURCES/(USES) (214,325) - - 1,074,235 100% 100%
Ending Net Assets 5,499,147 4,409,147 5,250,640 4,008,525 -24% -9%
Revenues Over/Under Expenses
FY 2019 Budget vs FY 2018
Projected Budget
243 2/23
372
Draft
Garbage Collection Fund Garbage, recycling and yard waste collection in residential areas are funded through the Garbage Collection Fund. Collection is accomplished by contract with a waste hauling contractor. The Village has a flat-rate garbage pick-up program that allows for almost unlimited amounts of refuse and recyclables to be picked up each week. Use of a cart for recycling is required by customers and each household is supplied with a 65 gallon cart. In FY 2017, the Village negotiated a five year extension of the current contract. Fiscal Year 2018 rates are $19.58 per month for regular residential service and $15.67 per month for senior citizen residential. Rates increase each May 1 based on the February to February CPI increase or the lessor of 2%. These services are billed bi-monthly. Residents pay $1.00 per sticker for yard waste stickers. The current garbage contract expires on April 30, 2022. Fiscal Year 2019 Budget
Total expenditures exceed revenues by $7,670 Estimated reserve balance of $490,413 at April 30, 2019
Challenges/Issues The short and long term goals are to provide the residents with the garbage, recycling and yard waste collection service they prefer at the lowest cost available. The Village conducted a survey of residents in 2011 and 2012 to determine the scope of services to be put out to bid. The contractual cost of the collection service is passed through to the residents. The Village provides the administrative costs and billing costs of the program utilizing village staff with none of these costs allocated to this Fund. Garbage Collection Accounts on a Bi-Monthly Basis for the Last Four Fiscal Years
FY 2014 FY 2015 FY 2016 FY 2017 May 9,845 10,028 10,230 10,545 July 9,835 10,068 10,284 10,564 September 9,896 10,116 10,259 10,577 November 9,929 10,142 10,361 10,591 January 9,951 10,209 10,343 10,596 March 9,929 10,412 10,540 10,602
244 2/23
373
Draft
GARBAGE COLLECTION FUND (520)
FY 2017ACTUAL
FY 2018BUDGET
FY 2018PROJECTED
FY 2019BUDGET
Beginning Net Assets 513,437 505,490 505,490 498,084 -1% -1%
Disposal Service 2,346,478 2,450,000 2,408,806 2,481,070 3% 1%
Waste Stickers and Bins - - - - 0% 0%
TOTAL EXPENSES 2,346,478 2,450,000 2,408,806 2,481,070 3% 1%
(7,947) 51,700 (7,406) (7,670) 4% -115%
Change in Fund Balance (7,947) 51,700 (7,406) (7,670) 4% -115%
Ending Net Assets 505,490 557,190 498,084 490,413 -2% -12%
Revenues Over/Under Expenditures
Total Charges for Services
Charges for Services
TOTAL REVENUE
REVENUES
Interest
FY 2019 Budget vs FY 2018
Projected Budget
245 2/23
374
Draft
Vehicle Fund The Vehicle Fund is used to account for all major equipment and vehicle purchases. Prior to the establishment of this fund in FY 2017, the Village paid for major equipment and vehicle purchases directly from various accounts in the General Fund and Water and Sewer Fund. Centralization of vehicle and equipment purchases allows the Village to simplify tracking of purchases previously made across multiple Funds. Centralization will assist in prioritizing purchases for all departments. Fiscal Year 2019 Budget Vehicle and equipment purchases of $330,500 are included in the budget. The purchases will be benefiting the Police and Public Works departments. Funding will be provided from the Capital Improvement Fund from sales tax revenue collections. Challenges/Issues Vehicles are eligible for replacement in accordance with the Village Vehicle Replacement Policy. The Village has more vehicles eligible for replacement than what can be replaced because of not having a replacement plan in previous years. The Village regularly monitors vehicle condition to determine if efforts to extend the service life of the vehicle are cost-effective. The Fund does not have a dedicated revenue source as yet and one will need to be determined to support the annual replacement of vehicles within the current fleet. FY 2019 Expenditure descriptions: Vehicles
Police o Two sedan interceptors $100,116 o SUV $ 36,344
Public Works o Medium Duty Dump Truck w/ plow $150,000
Building & Zoning o Pick-up truck $ 27,040
Equipment
Police o Message Board/Speed Trailer $ 17,000
Strategic Plan Outcome
Safe and efficient infrastructure
246 2/23
375
Draft
VEHICLE FUND (600)
FY 2017ACTUAL
FY 2018 BUDGET
FY 2018PROJECTED
FY 2019BUDGET
Beginning Net Assets - 37,508 37,508 75,125 100% 100%
Other Financing Source (Use)Transfer from Capital Improvement Fund 500,000 50,000 50,000 330,500 561% 561%Transfer from Water & Sewer Fund 232,500 35,000 35,000 - -100% -100%
Total Other Financing Source/Use 732,500 85,000 85,000 330,500 289% 289%
Change in Fund Balance 37,508 5,400 37,617 40,000 6% 641%
Ending Net Assets 37,508 42,908 75,125 115,125 53% 168%
FY 2019 Budget vs FY 2018
Projected Budget
247 2/23
376
Draft
Police Officers’ Pension Fund The Police Officers’ Pension Fund accounts for revenues and expenditures associated with the provision of retirement, disability and other pension benefits for sworn police personnel through a single-employer pension plan. Benefits provided to sworn police personnel are governed by Illinois State Statutes. The Police Officers’ Pension Board, which consists of two active pension members, one retired member, and two individuals appointed by the Village, is responsible for administering the pension fund, with advice and assistance provided by the Village Treasurer. Fiscal Year 2019 Budget
Total revenues exceed expenditures by $1,275,677 Municipal contribution of $1,400,000 is the same as FY 2018 Expenditures for FY 2019 total $989,323 Estimated Ending Net Assets Balance of $30.4 million
Challenges/Issues The Village is responsible for determining, on an annual basis through an actuarial study, the amount of employer contributions, usually from the property tax levy, that the Village must contribute to the fund in order to provide monies for future pension costs. The annual contribution to be provided by the Village is the amount necessary to provide for the annual requirements of the pension fund plan, and an amount necessary to ensure the accumulation of a reserve equivalent to the fund’s accrued liabilities annualized over the remaining twenty-four year amortization period. The Village Board has committed to contributing more than the required amount to ensure the 100% funding level by the end of the amortization period. The Village is not funding the total annual contribution with property taxes. General operating revenues have provided the additional amounts each year to meet the actuarially required contribution. The Village Board will need to increase property taxes to support the annual contributions in future years as general operating revenues will no longer be available to provide the additional support. The actuarial report, presenting the actuarial position of the Fund as of April 30, 2017, showed that the Police Pension Fund had a funding level of 70.1% and a return on its investment of 8.86%. As of April 30, 2018 the Police Pension Fund had ten retirees collecting monthly pensions. One more member has indicated their retirement in June of Fiscal Year 2019.
248 2/23
377
Draft
POLICE OFFICERS' PENSION FUND (800)
FY 2017ACTUAL
FY 2018BUDGET
FY 2018PROJECTED
FY 2019BUDGET
Beginning Net Assets 22,553,626 26,176,298 26,176,298 29,091,976 11% 11%
STATISTICAL SECTION This part of the annual budget presents detailed information including statistical and supplemental data on the Village of Oswego Revenue Capacity
These schedules contain information to help the reader assess the Village’s most significant local revenues resource, the sales tax.
Demographic and Economic Information
These schedules offer demographic and economic indicators to help the reader understand the environment with which the Village’s financial activities take place.
Operating Information
These schedules contain service and infrastructure data to help the reader understand how the information on the Village’s financial report relates to the services that Village provides and the activities it performs
253 2/23
382
Draft
VILLAGE OF OSWEGO, ILLINOIS
ASSESSED VALUE AND ESTIMATED ACTUAL VALUE OF TAXABLE PROPERTY
Last Ten Levy Years
Total Estimated Estimated Total Taxable EAV Direct Actual Actual
Note: 2016 Levy Year Commercial property includes 5,000 EAV for Will County.Note : Property in the Village is reassessed each year. Property is assessed at 33% of actual value.
* Totals include part-time and seasonal positions. A full-time employee works 2080 hours in a year. (For instance, if an employee is scheduled to work 500 hours a year, their full-time equivalent amount would be 0.25).
VILLAGE OF OSWEGO, ILLINOISFULL-TIME EQUIVALENT EMPLOYEES
AICPA American Institute of Certified Public Accountants APA American Planning Association BOCA Building Officials Code Administrators BVM Burglary to Motor Vehicles CAFR Comprehensive Annual Financial Report or Certificate of Achievement in Financial Reporting CALEA Commission for Accreditation on Law Enforcement
Agencies CIP Capital Improvement Plan C.O.W. or COW Committee of the Whole CSO Community Service Officer DARE Drug Abuse Resistance Education EAB Emerald Ash Borer EAV Equalized Assessed Valuation ECO Environmentally Conscious Oswegoans FICA Social Security and Medicare FTE Full Time Equivalent FTO Field Training Officer GASB Governmental Accounting Standards Board GFOA Government Finance Officers Association GIS Geographic Information System GLTD General Long-term Debt GPS Global Positioning System
264 2/23
393
Draft
GREAT GRANT Gang Resistance Education And Training federal grant HOA Home Owners Association IAMMA Illinois Association of Municipal Management Assistants ICC International Code Council ICMA International City Managers Association ICSC International Council of Shopping Centers IDOT Illinois Department of Transportation IEPA Illinois Environmental Protection Agency ILCMA Illinois City Managers Association IML Illinois Municipal League IMRF Illinois Municipal Retirement Fund IT Information Technology JULIE Joint Utility Locating Information for Excavators LAPP Local Agency Paving Project MFT Motor Fuel Tax MIS Management Information Systems MSI Municipal Software Incorporated NAHRO National Association of Human Rights Workers
Organization NCBI National Coalition Building Institute NEMRT North East Multi-Regional Training NIPC Northeastern Illinois Planning Commission NPDES National Pollution Discharge Elimination System NPELRA National Public Employee Labor Relations Association
265 2/23
394
Draft
OEDC Oswego Economic Development Corporation OSHA Occupational Safety Hazards Act PAAC Police Activities and Athletics Center RFP Request For Proposals SCADA Supervisory Control and Data Acquisition SPO Strategic Plan Objective SRT Special Response Team TIF Tax Increment Financing
266 2/23
395
Draft
GLOSSARY
Abatement: A partial or complete cancellation of a property tax levy imposed by the Village. Account: A term used to identify an individual asset, liability, expenditure control, revenue control or fund balance. Accounting system: The total structure of records and procedures which discover, record, classify, summarize, and report information on the financial position and results of operations of a government or any of its funds, fund types, balanced account groups, or organizational components. Activity: The smallest unit of budgetary accountability and control which encompasses specific and distinguishable lines of work performed by an organizational unit for the purpose of accomplishing a function for which the Village is responsible. Accrual Basis of Accounting: A method of accounting that matches revenues and expenses with the period to which they relate, rather than focusing on actual cash flows. In this method, for example, an asset is depreciated as it is “used up”, and the expense is recognized in periodic increments, rather than assuming the asset holds its value until it is actually disposed of Annexation: The incorporation of land into an existing Village with a resulting change in the boundaries of that Village. Appropriation: an authorization by the Village Board to make expenditures and to incur obligations for a specific purpose Assessed Valuation: A value established for real property for use as a basis in levying property taxes. Audit: Prepared by an independent certified public accountant, the primary objective of an audit is to determine if the Village’s financial statements fairly represent the Village’s financial position and results of operations in conformity with generally accepted accounting principles. Balanced Budget: A balanced budget is a budget in which revenues and reserves meet or exceed expenditures. The Village will sometimes use cash reserves or fund balance to finance a significant capital improvement or capital project. This use of reserve to finance a capital project will convey the impression that the budget is not balanced when in fact the financing of a capital project with cash reserves was the result of good financial planning. Reserves may also be used on a limited basis to fund operations for a fixed amount of time during recessions or local economic downturns. Bond: A form of borrowing that reflects a written promise from the Village to repay a sum of money on a specific date at a specified interest rate. Bonds are used to finance large capital projects.
267 2/23
396
Draft
Bonding: The act of borrowing money to be repaid, including interest, at specified dates. Budget: a financial plan for a specified period of time that matches projected revenues and planned expenditures to municipal services, goals and objectives. The Village of Oswego uses a budget covering one fiscal year, May 1 through April 30th. Budget Amendment: A legal procedure utilized by the Village staff and Village Board to revise the budget. Budget Message: A general discussion of the proposed budget as presented in writing by the budget-making authority to the legislative body. Budget Ordinance: The official enactment, by the Village Board to legally authorize Village staff to obligate and expend resources. Budgetary Control: Control of management of a government or enterprise in accordance with an approved budget for the purpose of keeping expenditures within the limitations of available appropriations and available revenues. Capital Assets: Assets of a long term character which are intended to continue to be held or used with a value typically over $10,000. Examples of capital assets include items such as land, buildings, machinery, vehicles and other equipment. Capital Improvements/Expenditures: Major projects that typically involve the construction of or improvement/repair to buildings, roads, water, sewer, sanitary sewer, and other related infrastructure. Capital Improvement Plan (CIP): A five-year financial plan of proposed capital improvement projects that is adopted annually. Cash Management: The management of cash necessary to pay for government services while investing temporary cash excesses in order to earn interest revenue. Cash Management refers to the activities of forecasting the inflows and outflows of cash, mobilizing cash to improve its availability for investment, establishing and maintaining banking relationships, and investing funds in order to achieve the balance of the highest interest and return, liquidity and minimal risk with these temporary cash balances. Capital Outlay: Any expense that results in the acquisition of capital such as department equipment, office furniture and equipment, or building improvements (interchangeable with the term capital expenditure). Capital Projects: The largely one-time cost for acquisition, construction, improvement, or renovation of land, structures and improvements thereon. The cost must be $25,000 or more in order to be considered a capital project. Vehicle purchases with a cost of $10,000 or more are also considered capital projects.
268 2/23
397
Draft
Census: An official population count of all or part of a municipality by the federal government. An official census count determines the amount of revenues that the Village receives from the State of Illinois for specific state shared revenues. Charges for Services: a revenue category which includes a charge for a specific service. These primarily include water & sewer revenues, employee insurance contributions, and other miscellaneous user fees. Commodities: Items which, after use, are consumed or show material change in, or an appreciable impairment, of their physical condition, and which are generally of limited value and characterized by rapid depreciation. Component Unit: A component unit is a legally separate organization that a primary government must include as part of its financial reporting entity for fair presentation in conformity with GAAP. Comprehensive Plan: An official public document adopted by the local government as a policy guide to decisions about the physical development of the community. It is a general long range physical plan. Cost Allocation: Assignment of cost charges from one department that reimburse another department for services received. Debt Service: Payment of principal and interest on an obligation resulting from the issuance of bonds or notes. Deficit: An excess of expenditures over revenues. Department: An organizational unit responsible for carrying out a major governmental function, such as Police or Public Works. Depreciation: The loss of asset value over time and usage, recorded as an expense under the full accrual method of accounting. Draft Budget: The preliminary budget document distributed to the Village Board and available for inspection by the public. Enterprise Fund: Used to account for operations that are financed and operated in a manner similar to private business enterprises- where the costs of providing goods or services are financed or recovered primarily through user charges. Equalized Assessed Valuation (EAV): A value established for real property for use as a basis in levying property taxes within Kendall County, Illinois. The EAV is calculated by taking the Assessed Valuation multiplied by the Kendall County equalization factor, which changes every year.
269 2/23
398
Draft
Expenditure: The outflow of funds paid or to be paid for an asset or goods and services obtained, regardless of when the expense is actually paid. Fiduciary Funds: Fund used to account for assets held on behalf of outside parties, including other governments, or on behalf of other funds within the government. Fiscal Year: A consecutive 12-month period of time to which the budget applies; the fiscal year for the Village of Oswego is May 1 to April 30. Forecast: The projection of revenues and expenditures usually for a time period that is greater than one year based on clearly defined assumptions and predictions related to future events and activities. Franchise Agreement: An agreement between the Village and a utility setting forth the terms and conditions under which a utility, such as a cable company, may provide a service to residents. A franchise agreement often provides compensation to the Village for the use of the public right-of-way by the utility company. Full-Time Equivalent: The decimal equivalent of a part-time position converted to a full-time base (an employee that works a 40-hour work week is 1.0) Fund: An independent fiscal and accounting entity used to record all financial transactions related to the specific purpose for which the fund was created Fund Balance: The amount of financial resources available for use; the excess of assets over Liabilities. Governmental Accounting Standards Board: An independent organization which has ultimate authority over the establishment of Generally Accepted Accounting Principles (GAAP) for state and local government. GASB members are appointed by the Financial Accounting Foundation (FAF); however the GASB enjoys complete autonomy from the FAF in all technical and standard-setting activities. Generally Accepted Accounting Principles: Uniform minimum standards and guidelines for financial accounting and reporting. They govern the form and content of the financial statements of an entity. GAAP encompass the conventions, rules and procedures necessary to define accepted accounting practice at a particular time. They include not only broad guidelines of general application, but also detailed practices and procedures. GAAP provide a standard by which to measure financial presentations. The primary authoritative body on the application of GAAP to state and local governments is the Governmental Accounting Standards Board (GASB). Governmental Funds: Funds used to account for all or most of a government’s general activities that not accounted for in another fund
270 2/23
399
Draft
Grant: Contribution of cash or other assets from another governmental entity to be used or expended for a specific purpose, activity or facility Interfund Transfers: Monies moved from one fund to another; money is transferred to finance the operations of another fund or to reimburse the fund for expenses Levy: (Verb) to impose taxes, special assessments or service charges for the support of governmental activities, usually based on the assessed value of property. (Noun) The total amount of property taxes imposed by the Village for a specific year. Liability: Debt or other legal obligations arising out of transactions in the past which must be liquidated renewed or refunded at some future date. Liquidity: The amount of cash and easily sold securities a local government has at one time. Major Fund: A classification given to a fund when the fund’s expenditures/expenses is equal to or greater than 10% of the total Governmental Fund or Enterprise Fund total of that category (whichever category the fund belongs to) and 5% of the total Governmental and Enterprise total combined for that category. The General Fund is always classified as a Major Fund. Funds which do not pass this test are considered a Non-major Fund. Modified Accrual Basis of Accounting: an adaptation of the accrual basis of accounting for governmental fund types - revenues and other financing sources are recognized when they become available to finance expenditures of the current period Motor Fuel Tax: The Motor Fuel Tax is a tax on fuel consumption imposed and collected by the State. Distribution of the tax to municipalities is based on the municipality’s certified population. Municipality: A term used to describe a unit of government in Illinois such as a city, Village or town. Municipal Code: a collaboration of Village Board approved ordinances currently in effect Non-major Fund: A classification given to a fund when the fund’s total assets, liabilities, revenues or expenditures/expenses is not equal to or greater than 10% of the total Governmental Fund or Enterprise Fund total of that category (whichever category the fund belongs to) or is not equal to 5% of the total Governmental and Enterprise total combined for that category. Funds which do pass this test are considered Major Funds. Operating Budget: annual appropriation of funds for ongoing program costs Ordinance: a formal legislative enactment by the Village Board that is the full force and effect of law within the Village boundaries
271 2/23
400
Draft
Pension: Future payments made to an eligible employee after that employee has left employment or retired. Pensions for police officers’ are based on the number of years of service working for the Village and the employee’s salary at the time the employee either left employment or retired. Per Capita: Per capita is a term used to describe the amount of something for every resident living within the Village. Performance Indicators: Specific quantitative (can be defined in numerical terms) and qualitative (cannot be counted, use of measures that require descriptive answers) measures of work performed as an objective of the department. Portfolio: A list of investments for a specific fund or group of funds. Private Sector: Businesses owned and operated by private individuals, as opposed to government-owned operations. Public Hearing: An official forum called for the purpose of soliciting input from residents, businesses, and other stakeholders regarding a topic, plan or document. Illinois State law requires municipalities to hold a public hearing on the budget for the coming fiscal year before the budget is approved by the Board. Public Sector: The policies and procedures as conducted by local governments, states and the federal government. Property Tax: A tax based on the assessed value of real property. Proprietary Funds: used to account for activities similar to those found in the private sector, where determination of net income is necessary or useful for sound financial administration Referendum: The submission of a proposed public measure, law or question, which has been submitted by legislature, convention or council, to a vote of the people for ratification or rejection. Request for Proposal: A document used to request specific information from vendors regarding the scope of goods or services they can provide to meet a specific need of the Village as well as their proposed cost of providing those goods or services. Restricted Net Assets: The portion of net assets that is held for a specific purpose. The Village would typically restrict assets for debt service. Reserve: an account used to record that a portion of the fund’s balance is legally restricted for a specific purpose Revenue: amount received for taxes, fees, permits, licenses, interest and intergovernmental sources during the fiscal year
272 2/23
401
Draft
Special Revenue Funds: Funds used to account for revenues derived from specific taxes or other earmarked revenue sources which, by law, are designated to finance particular functions or activities of government and which therefore cannot be diverted to other uses. Sworn: A term used to describe police personnel who are hired by the Police Commission. Tax Rate: The amount of property tax levied or extended for each $100 of assessed valuation. Tax-Increment Financing: A redevelopment tool available for use by municipalities where the Village’s cost of providing assistance with capital improvements, public improvements and development or redevelopment of properties within the legally designated area are funded by the future property tax, sales tax, or other types of revenue that were generated with those capital or development/redevelopment improvements. TIF District: An area of property within the Village legally defined by a municipality that meets all the necessary requirements to be eligible for TIF. Trust and Agency Funds: Funds used to account for assets held by the Village in a trustee capacity or as an agent for individuals, private organizations, other governments, and/or other funds. Unrestricted Net Assets: That portion of net assets that is neither restricted nor invested in capital assets (net of related debt). Unrestricted net assets are typically used as the “fund balance” equivalent for Proprietary Funds User Fees: Payment of a fee or direct receipt of a public service by benefiting from the service for a specific purpose and is, therefore, not available for general appropriation


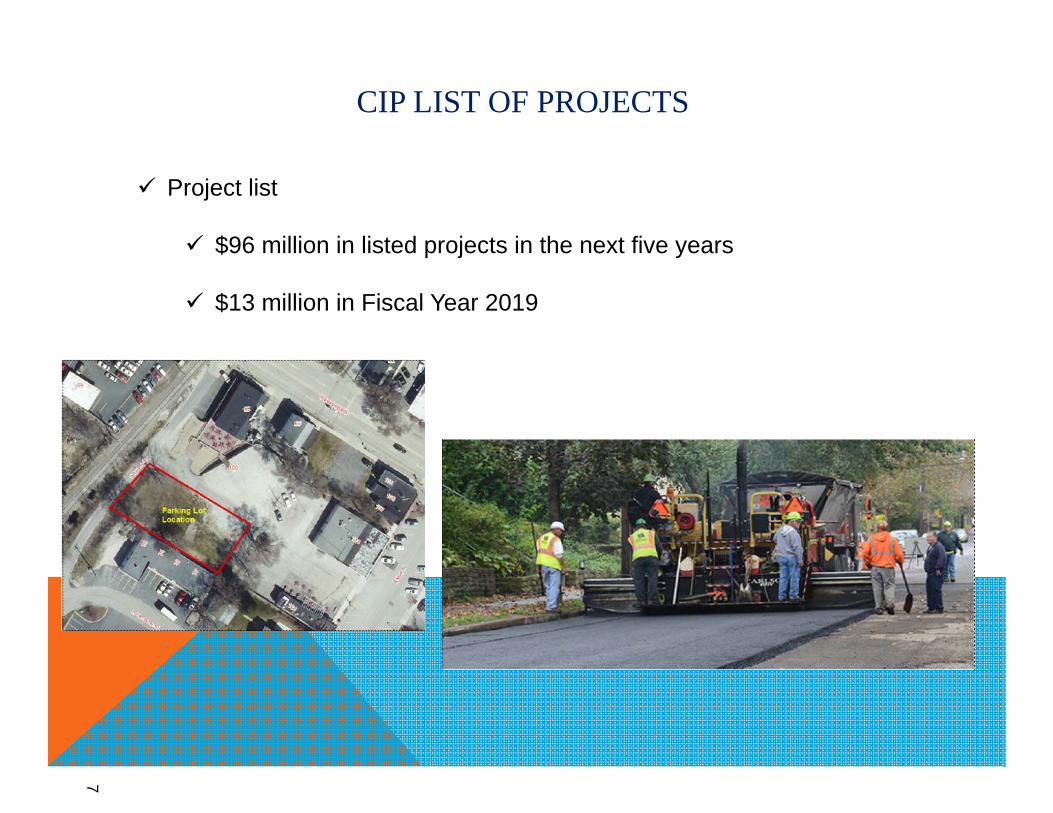


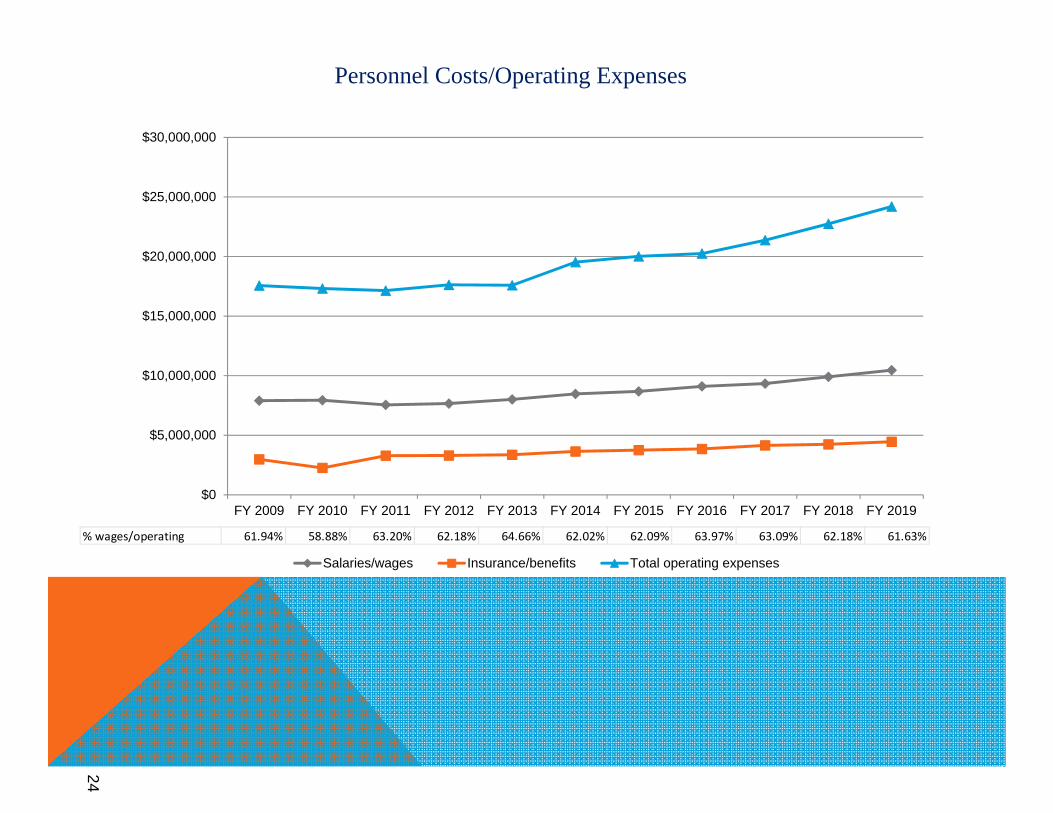


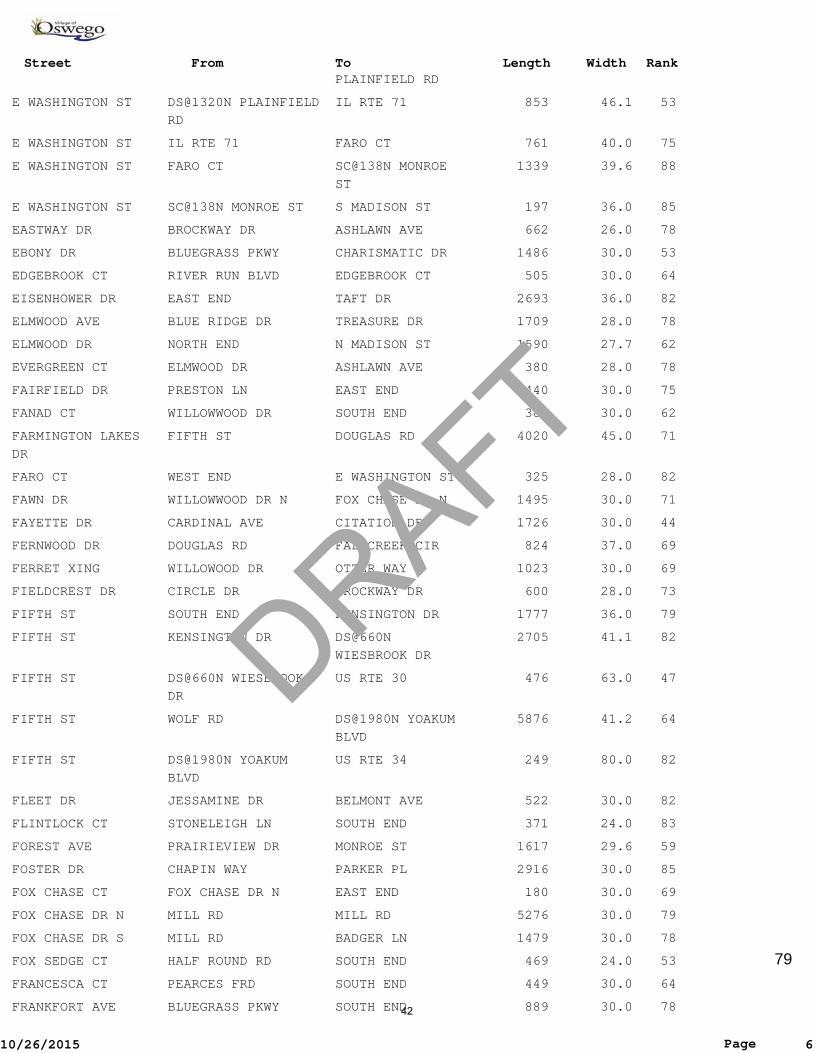


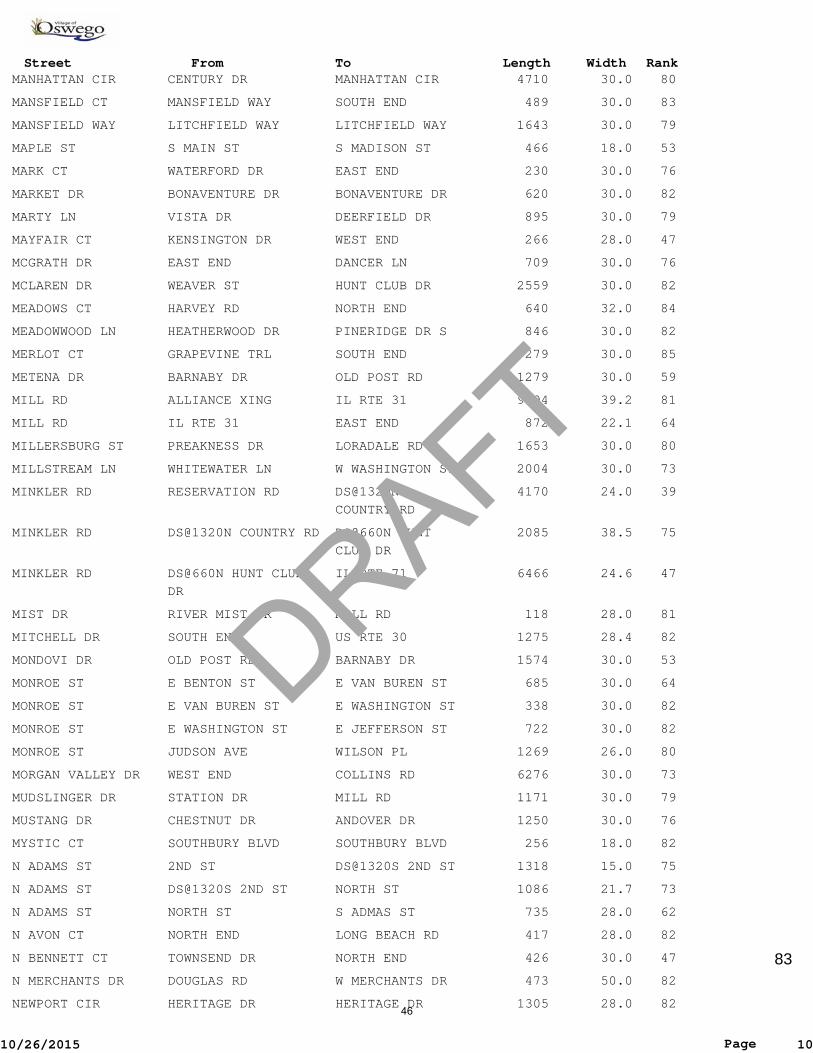


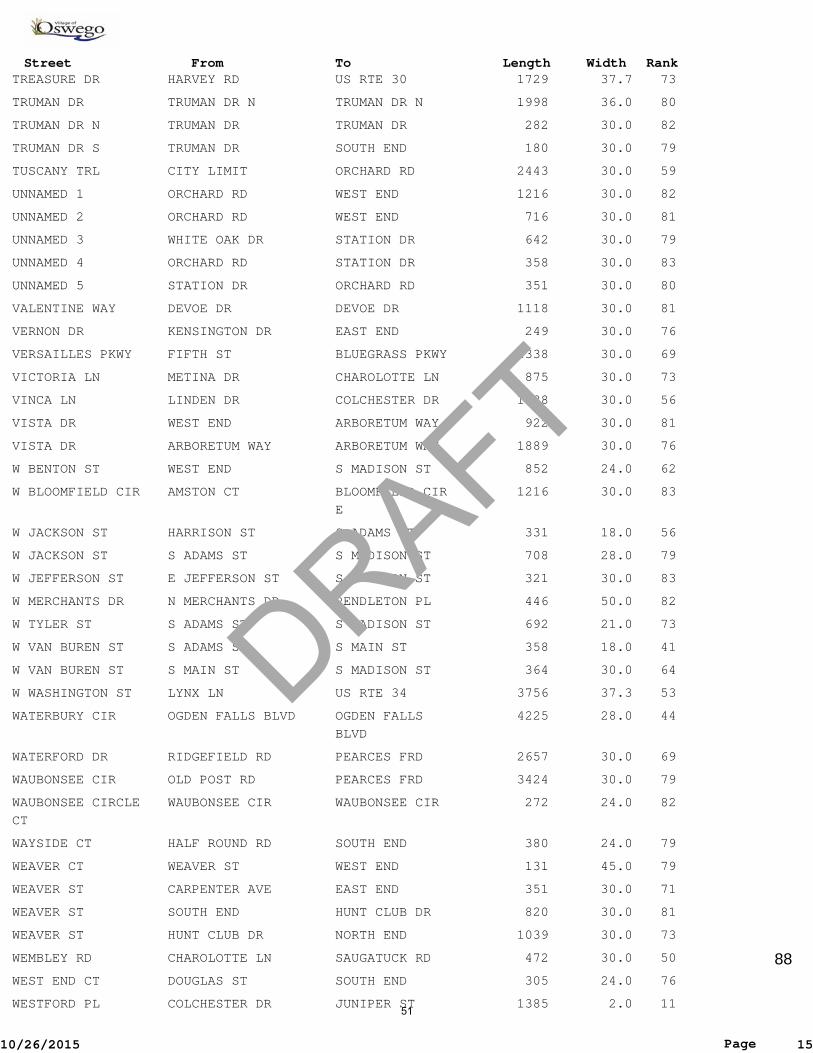

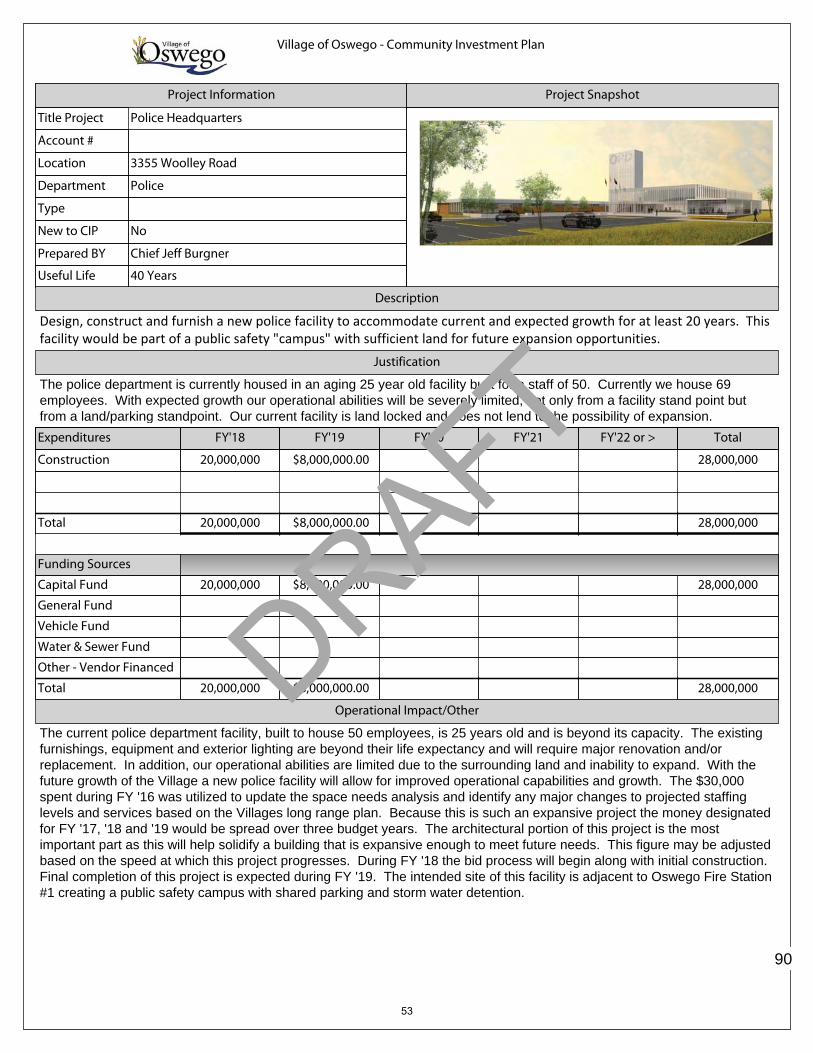


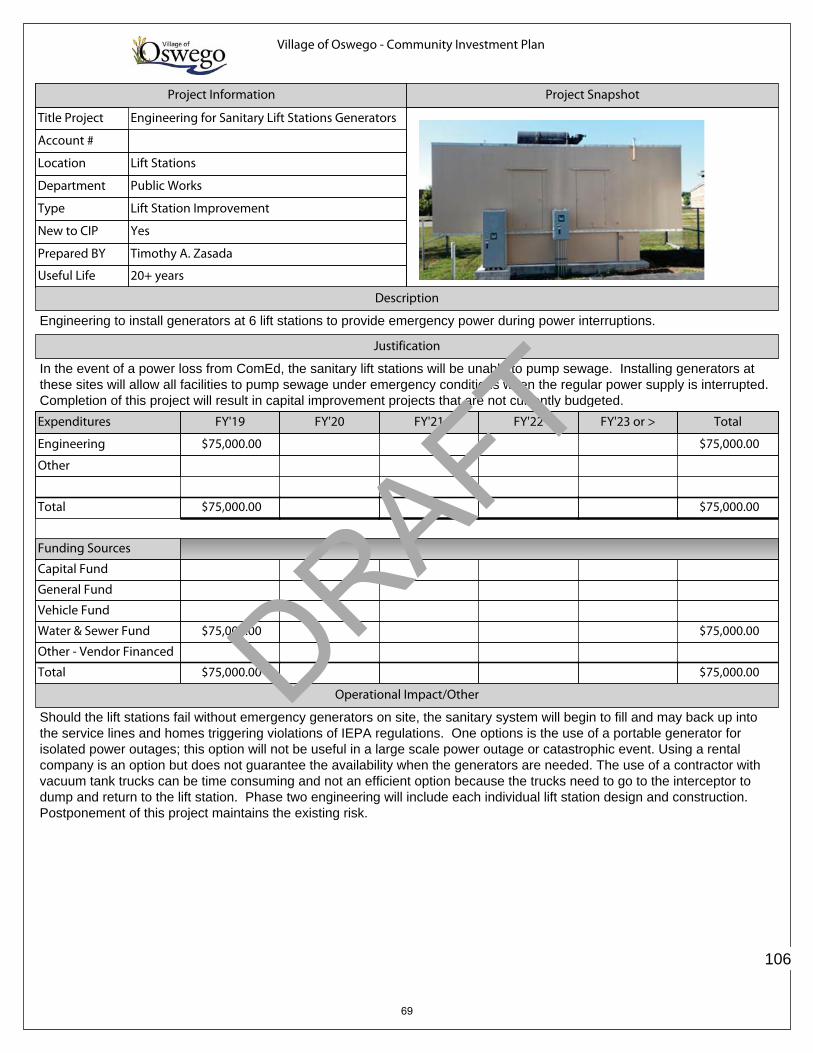


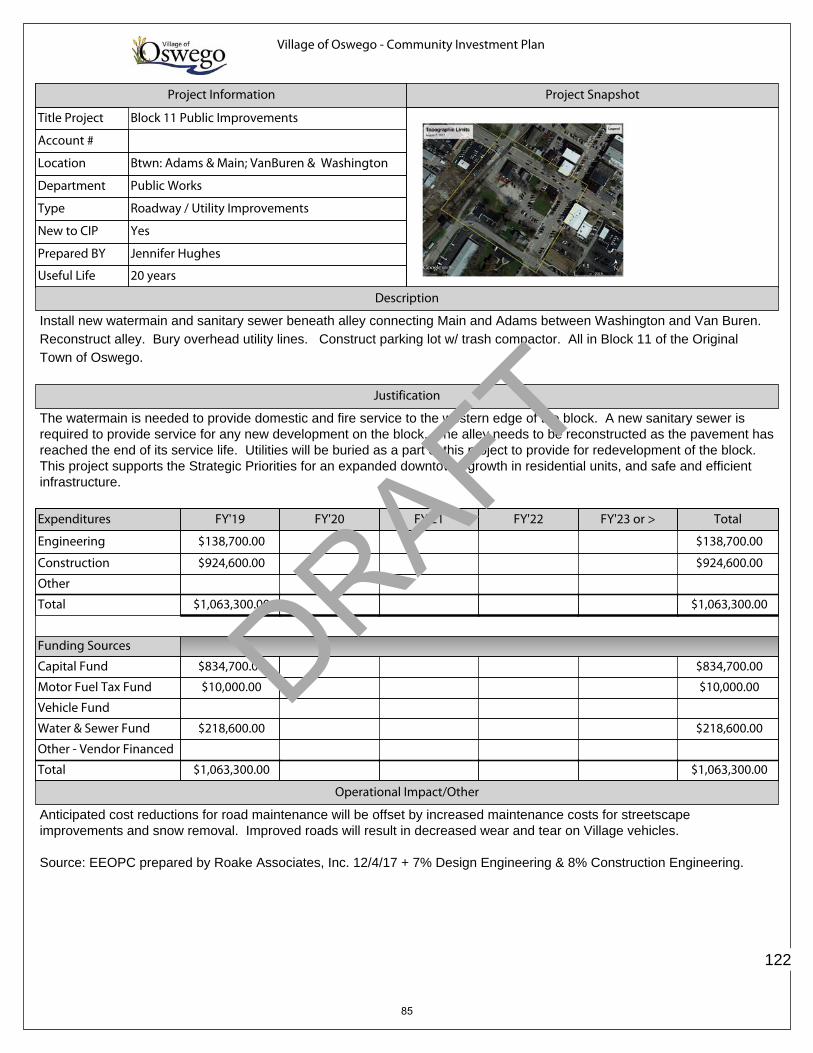


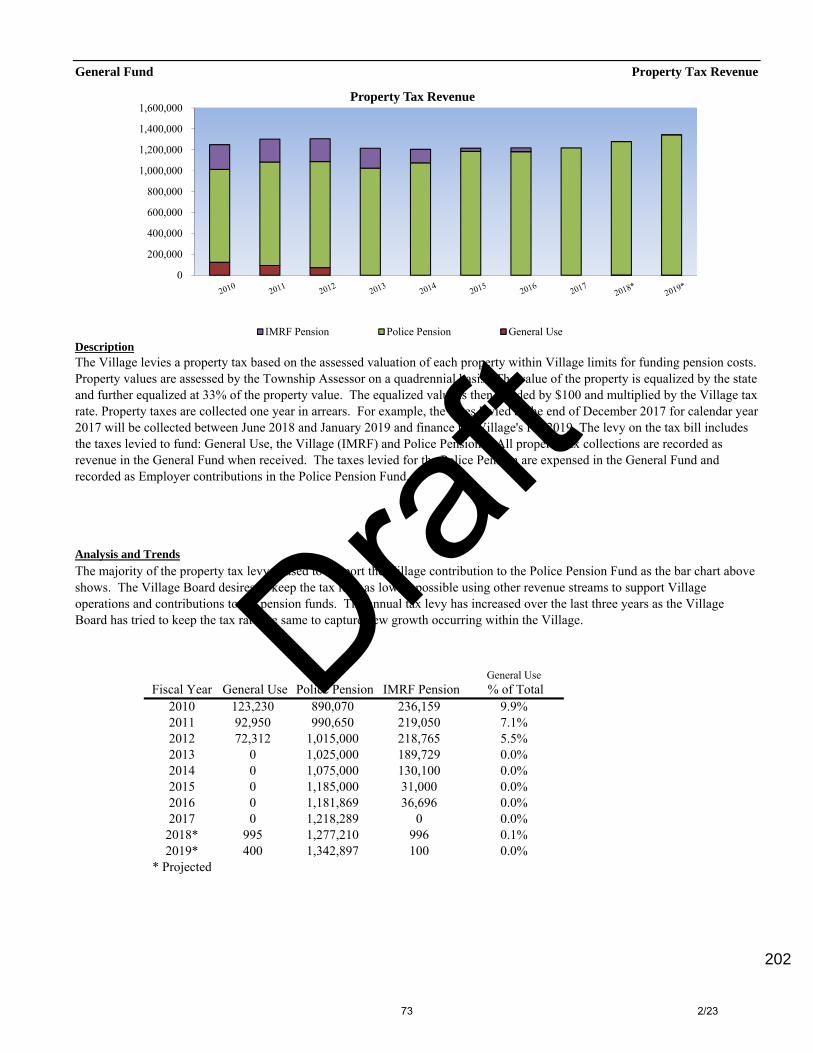


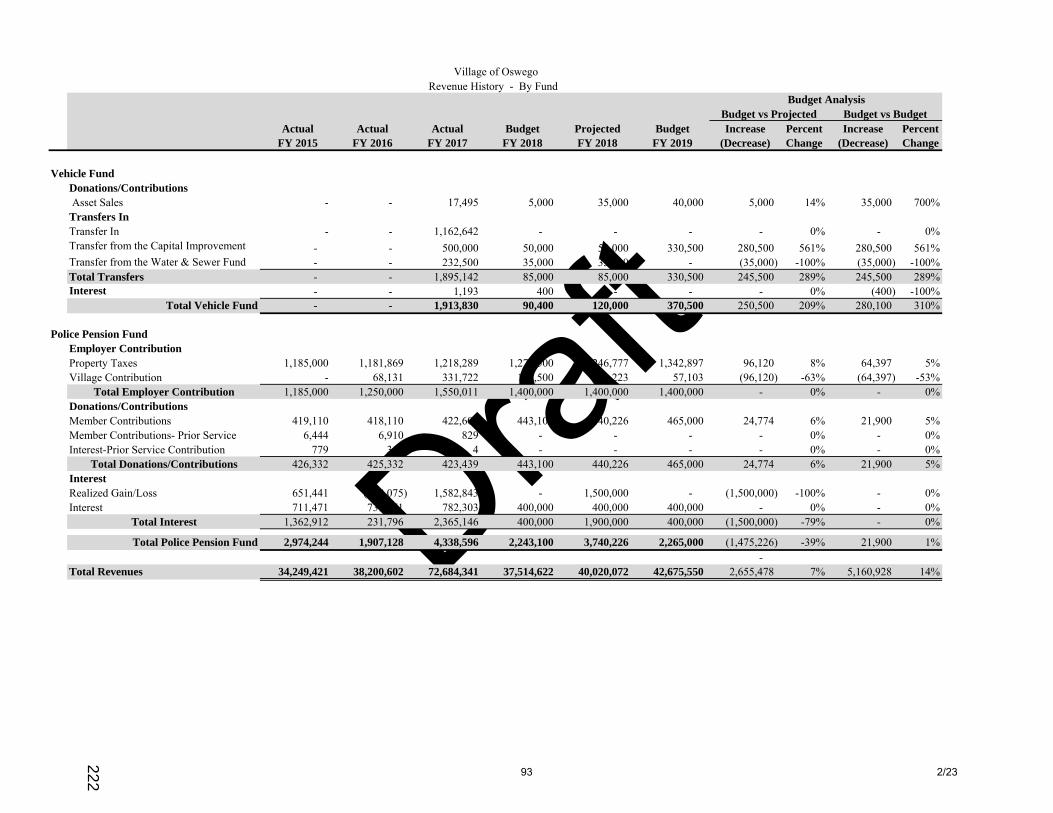
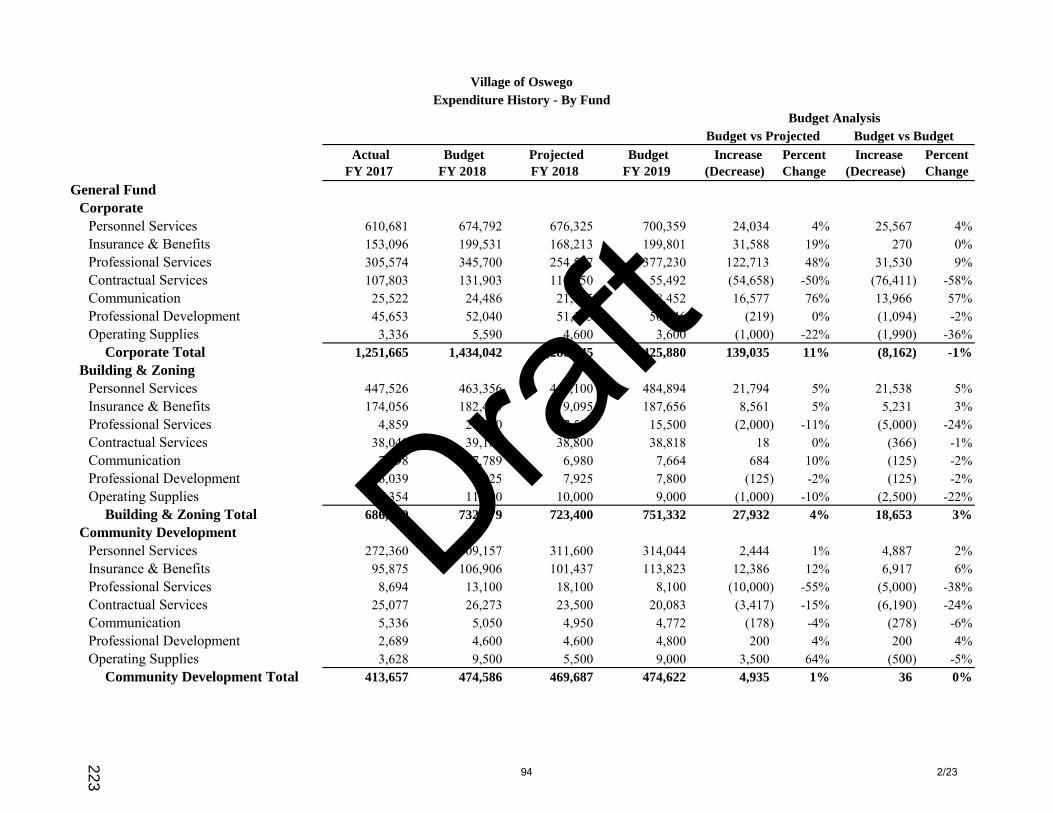


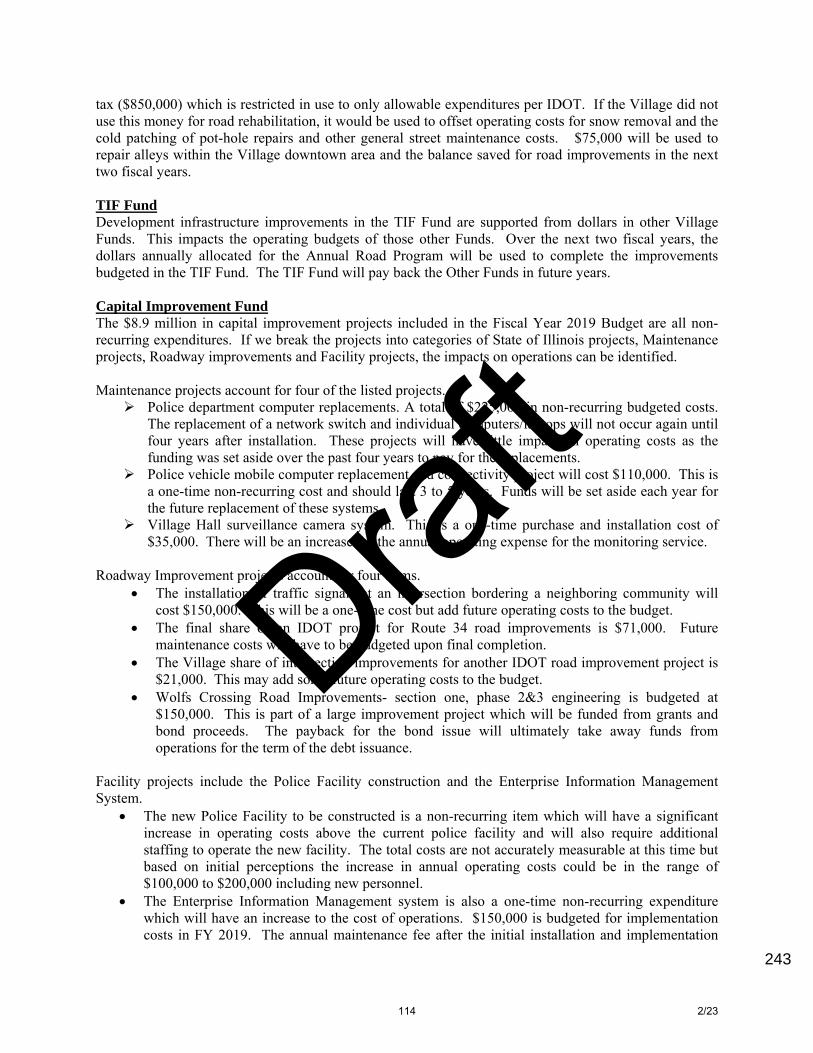


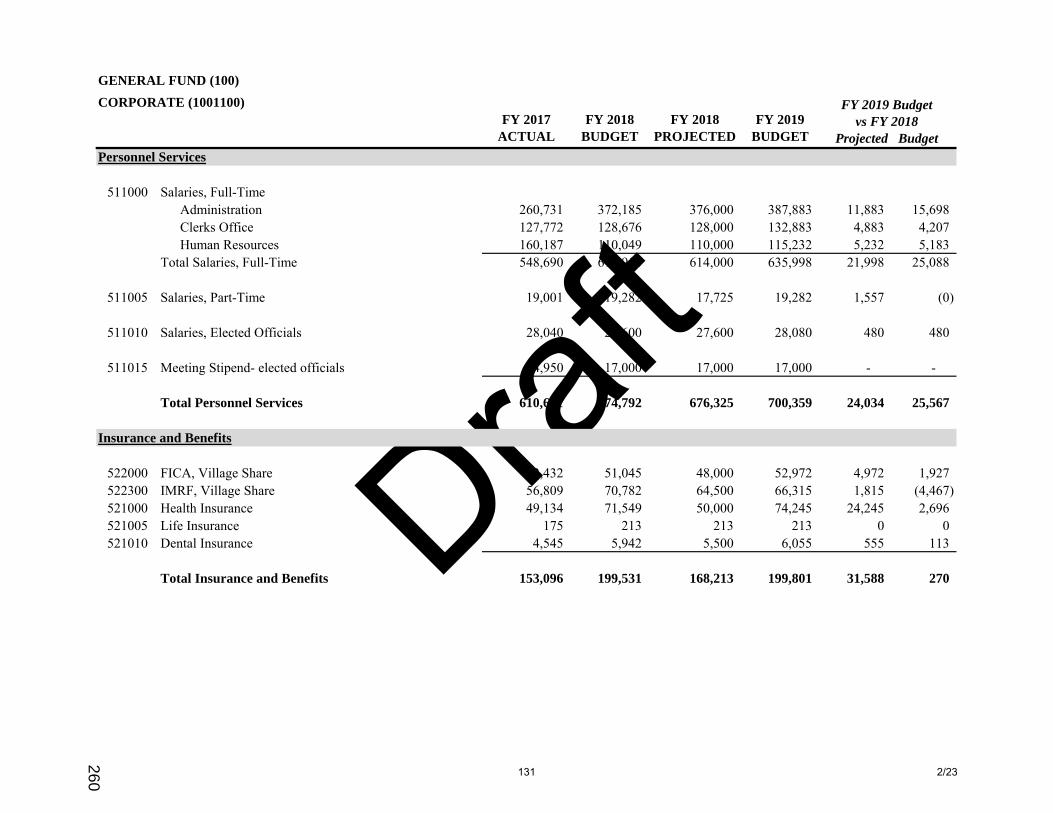

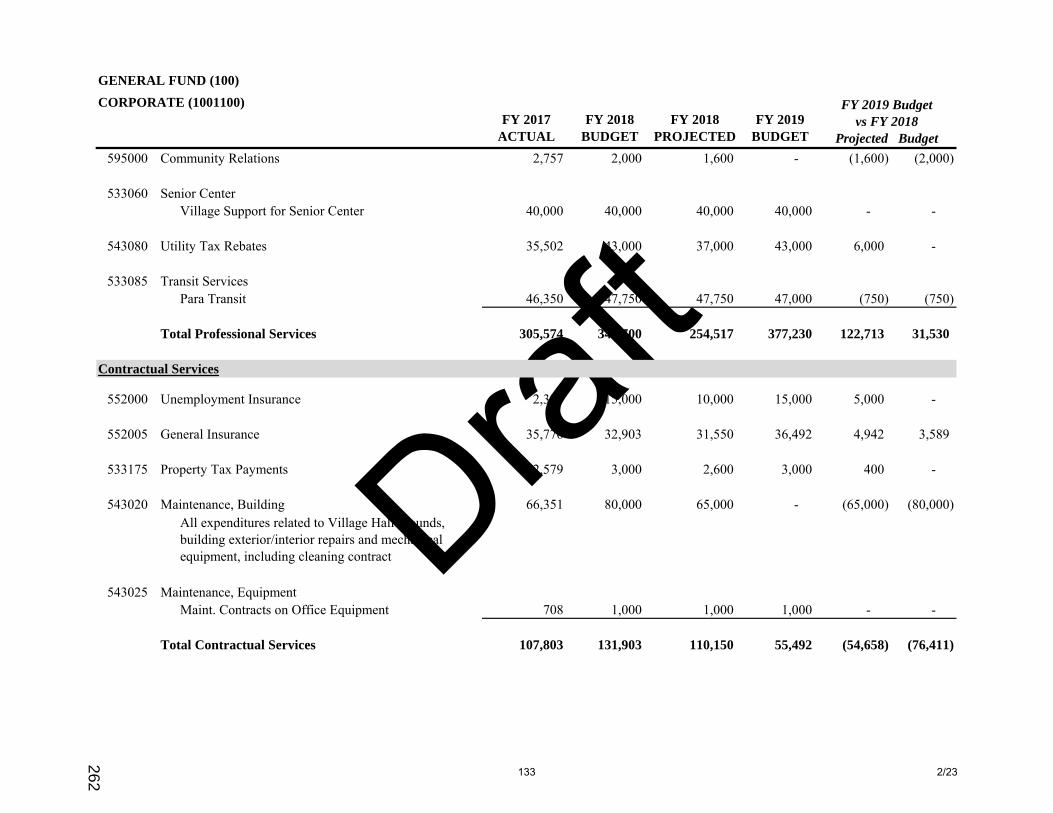


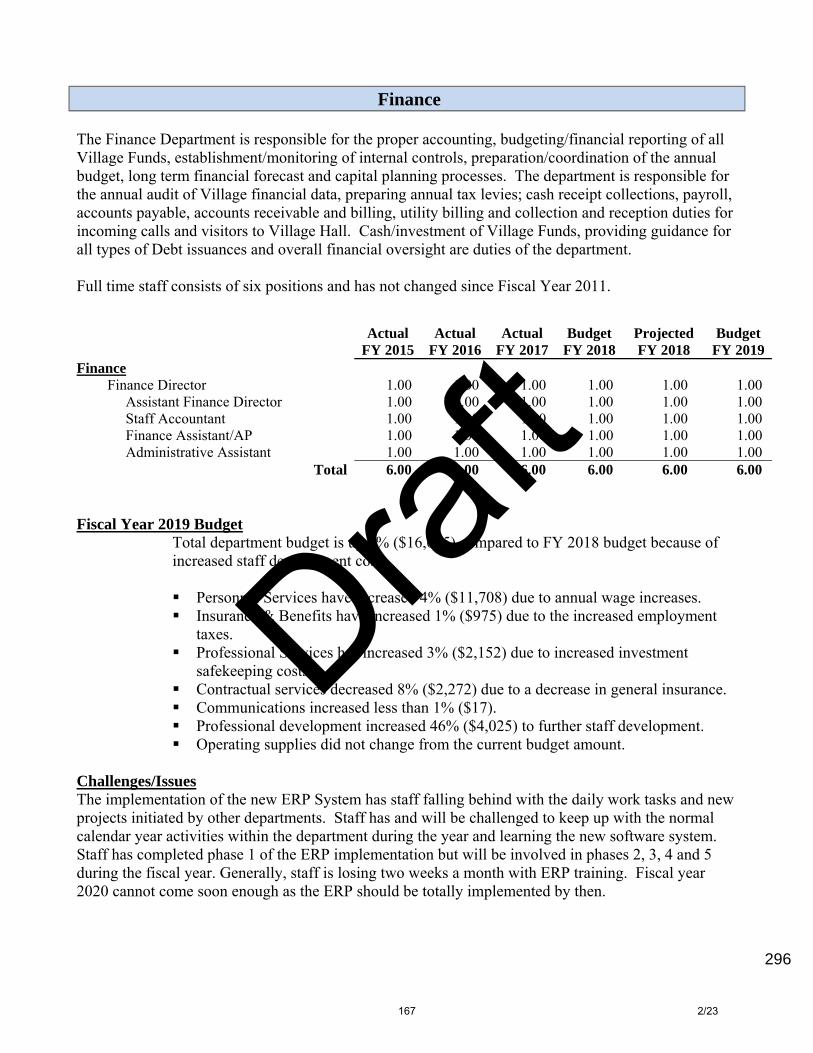


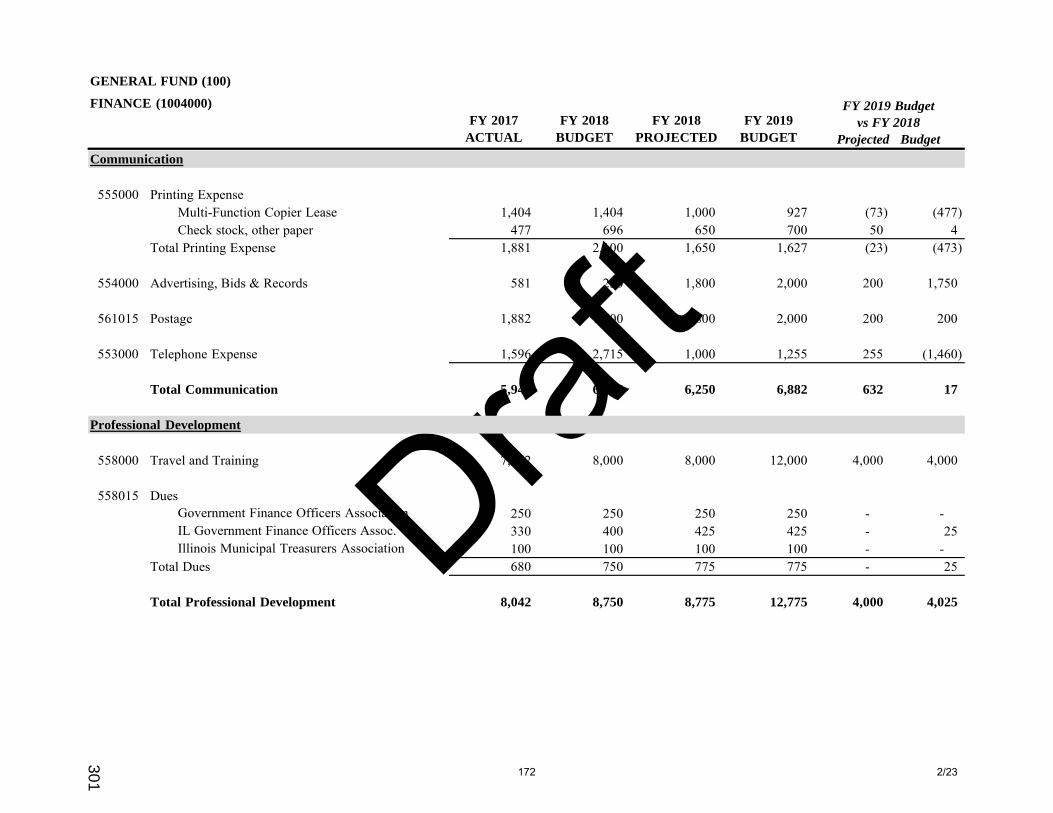


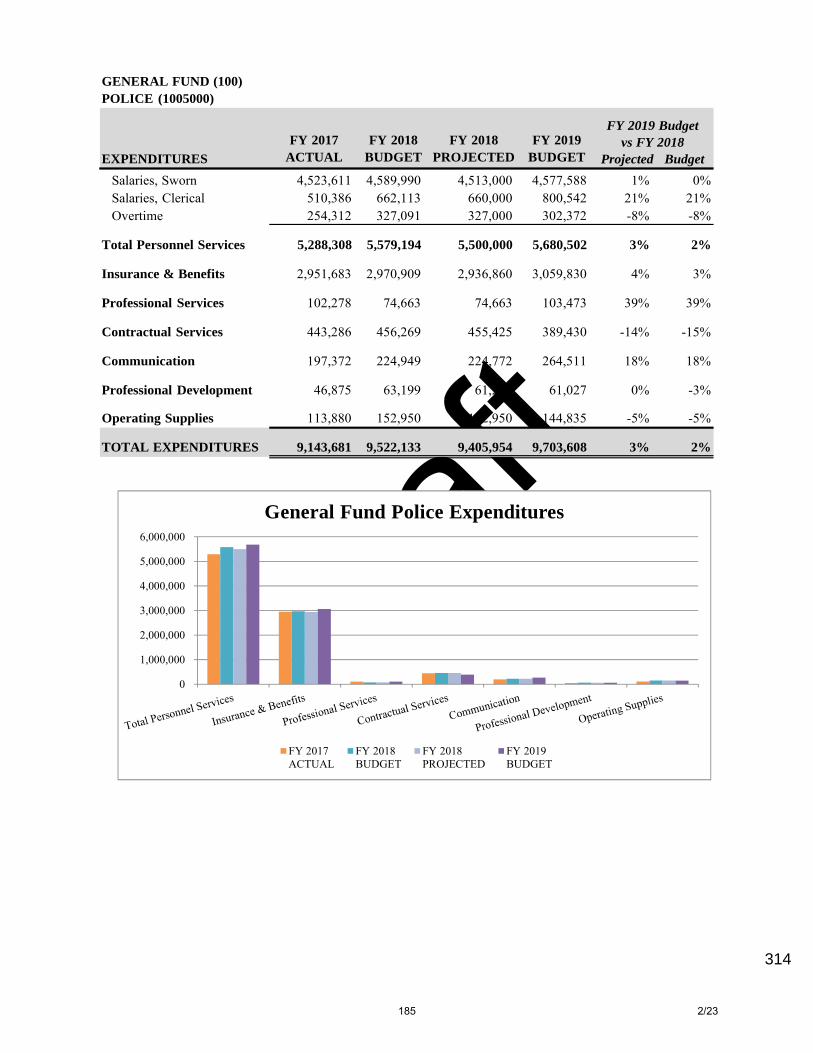


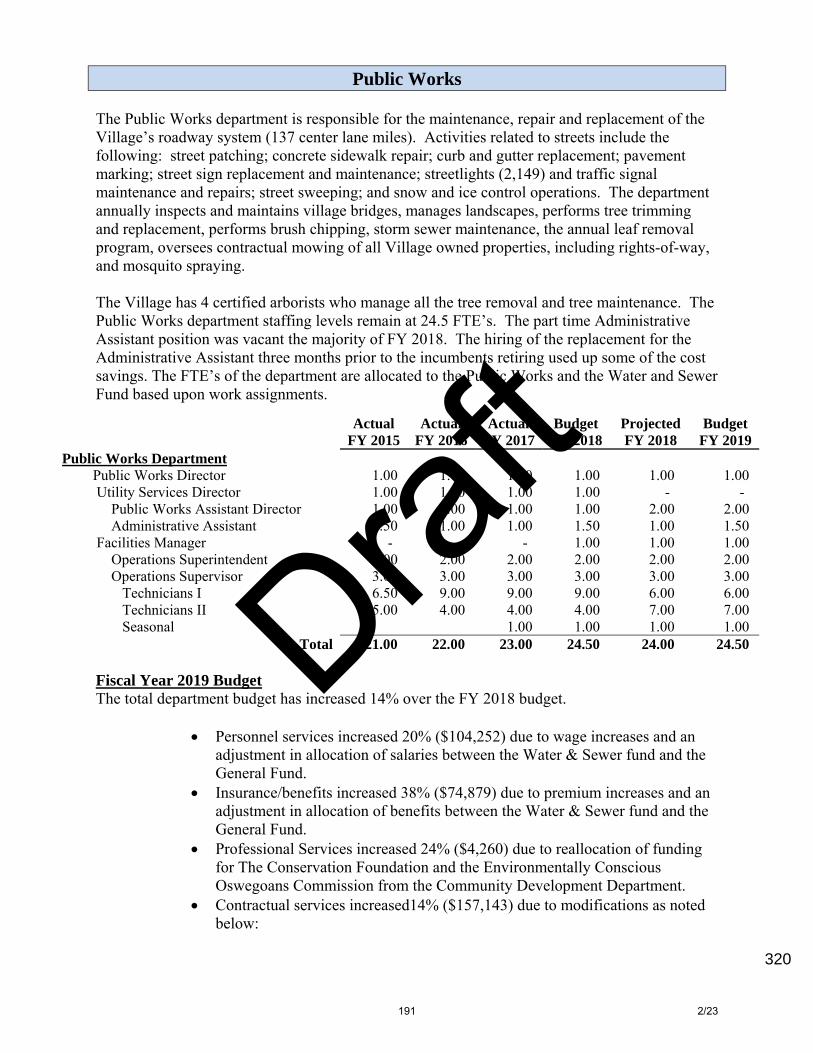


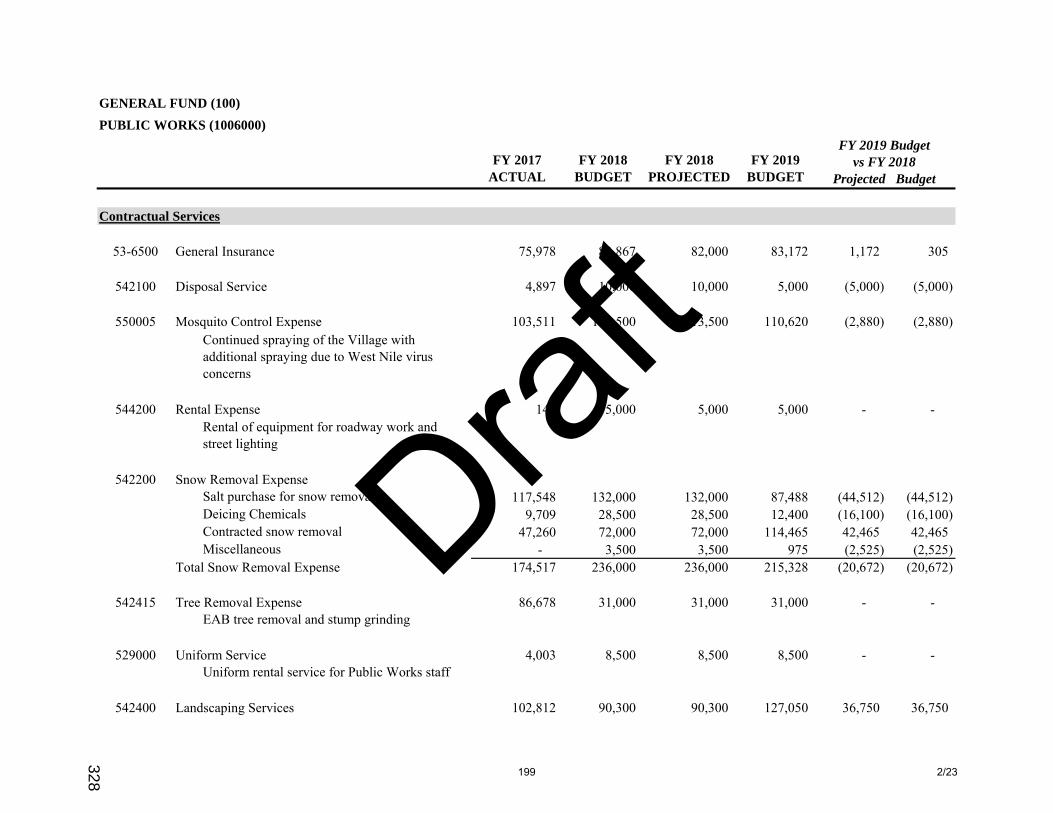


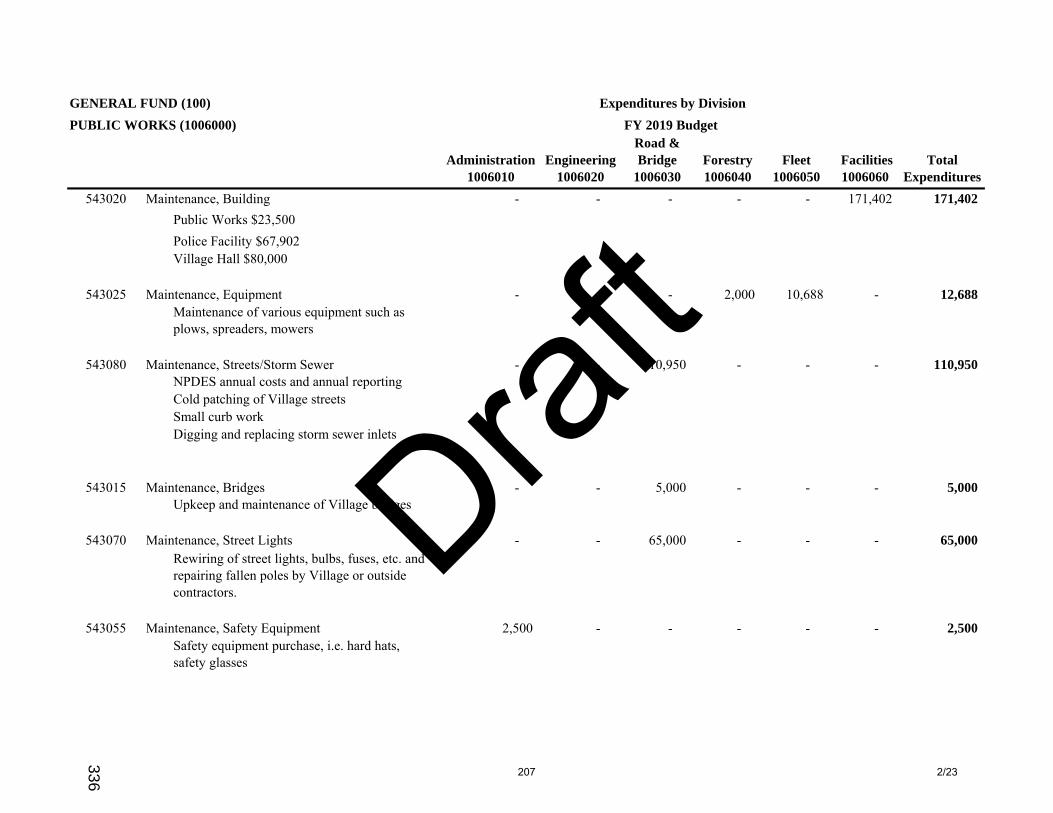


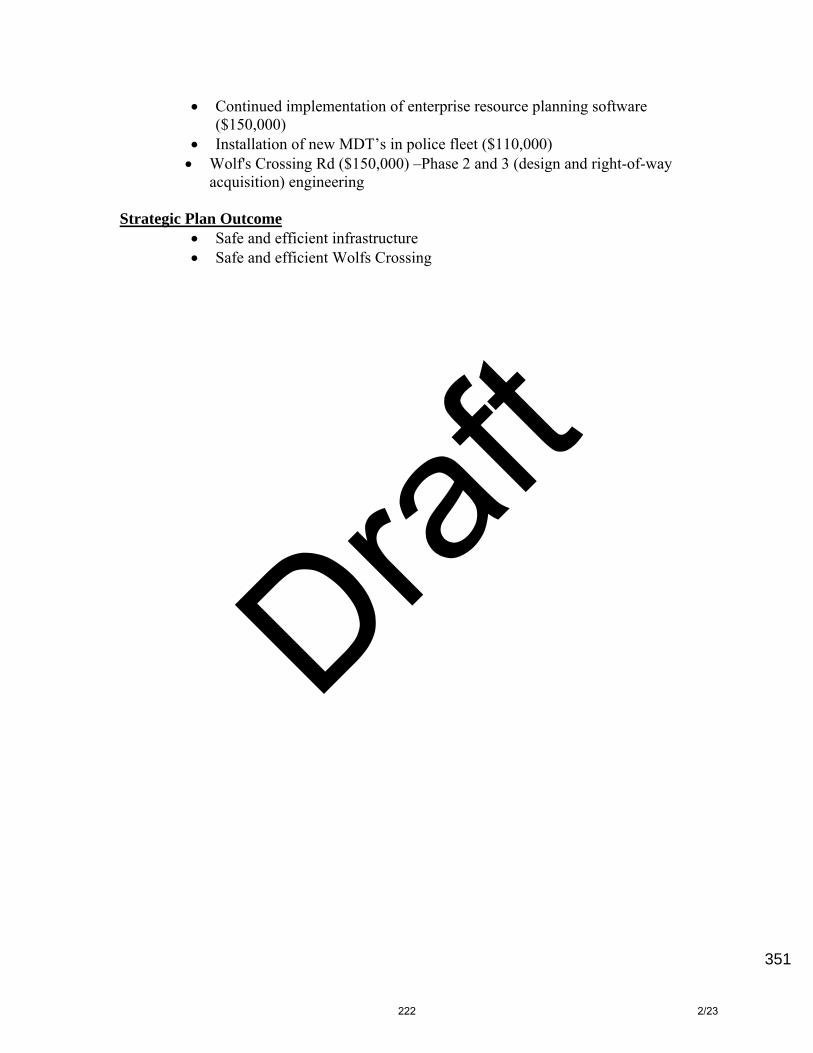


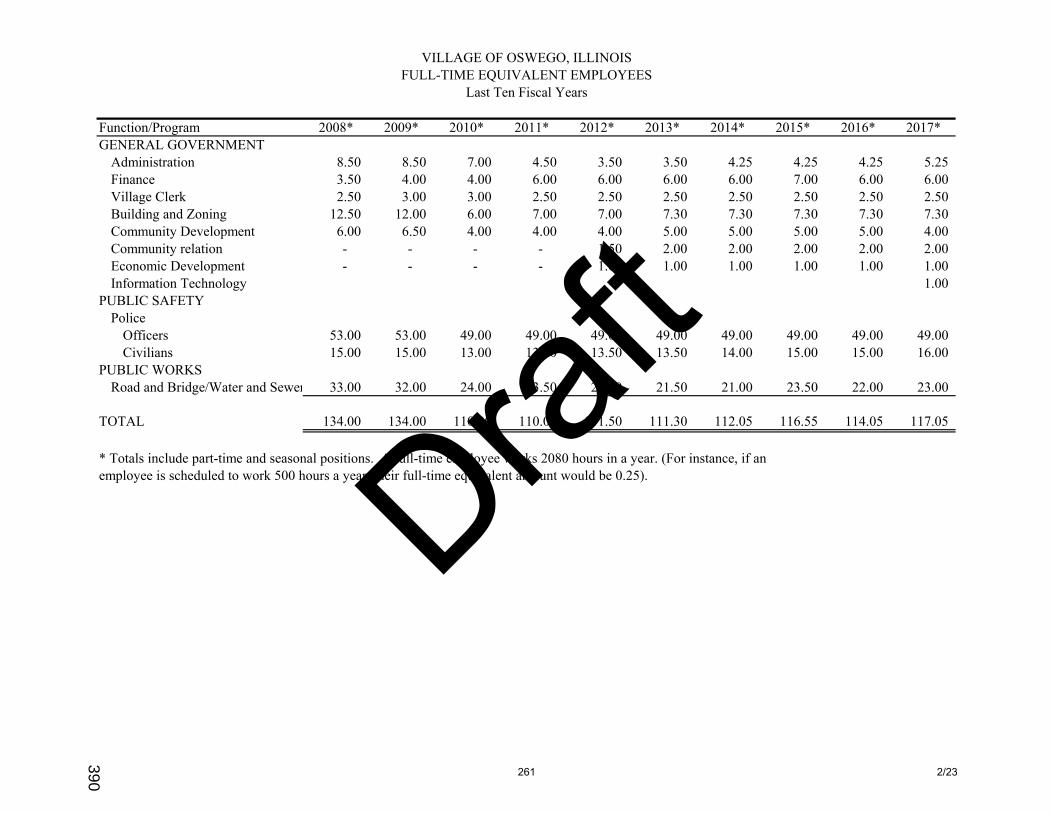


![Large Deviations Theory Lecture notes Master 2 in ...people.irisa.fr/Mathias.Rousset/m2_ldp/ldp.pdf · Touchette [2009]: readable, formal/expository introduction with links to sta-tisticalmechanics.](https://static.documents.pub/doc/80x56/5f1bac0ca648795436651c02/large-deviations-theory-lecture-notes-master-2-in-touchette-2009-readable.jpg)


