28
Parking Standards for New Development Projects Phase 1: Multifamily Residential Right-sizing the City’s Parking Regulations Planning Commission Work Session January 6, 2015
| Date post: | 26-Dec-2015 |
| Category: |
Documents |
| Upload: | georgina-barnett |
| View: | 224 times |
| Download: | 1 times |

Parking Standards for New Development Projects
Phase 1: Multifamily Residential
Right-sizing the City’s Parking Regulations
Planning Commission Work Session
January 6, 2015

PAR
KIN
G S
TAN
DA
RD
S F
OR
N
EW
DEV
ELO
PM
EN
T P
RO
JEC
TS
2
WHY A PARKING STUDY NOW?
• Outdated Zoning Ordinance – 1960’s• Parking reduction requests• Changing demand• Changing demographics – vehicle
ownership• City investment in transit, growth planned
near transit• Expanding transportation options
• Parking construction cost

PAR
KIN
G S
TAN
DA
RD
S F
OR
N
EW
DEV
ELO
PM
EN
T P
RO
JEC
TS
OUTDATED ZONING ORDINANCE - CURRENT STANDARDS & POLICIES IN
NEWER DOCUMENTS
Small Area Plans w/Parking StandardsEisenhower: <1500’ of Metro, Max 1.1/1000sf
>1500’ fr. Metro, Max 1.3/1000sf Braddock: 1.0/unit (3BR+ 1.5/unit)N. PYard: 1.0/unit Landmark: Pre-Transit:1.75/unit, Post-Transit 1.15/unit Beauregard: Pre-Transit:1.75/unit, Post-Transit 1.3/unit
Coordinated Development Districts (CDD)Many recent CDDs include parking standards 3
Existing Regulations in Zoning Ordinance1 BR: 1.3 spaces/unit2 BR: 1.75 spaces/unit3 BR: 2.2 spaces/unit
PAR
KIN
G S
TAN
DA
RD
S F
OR
N
EW
DEV
ELO
PM
EN
T P
RO
JEC
TS
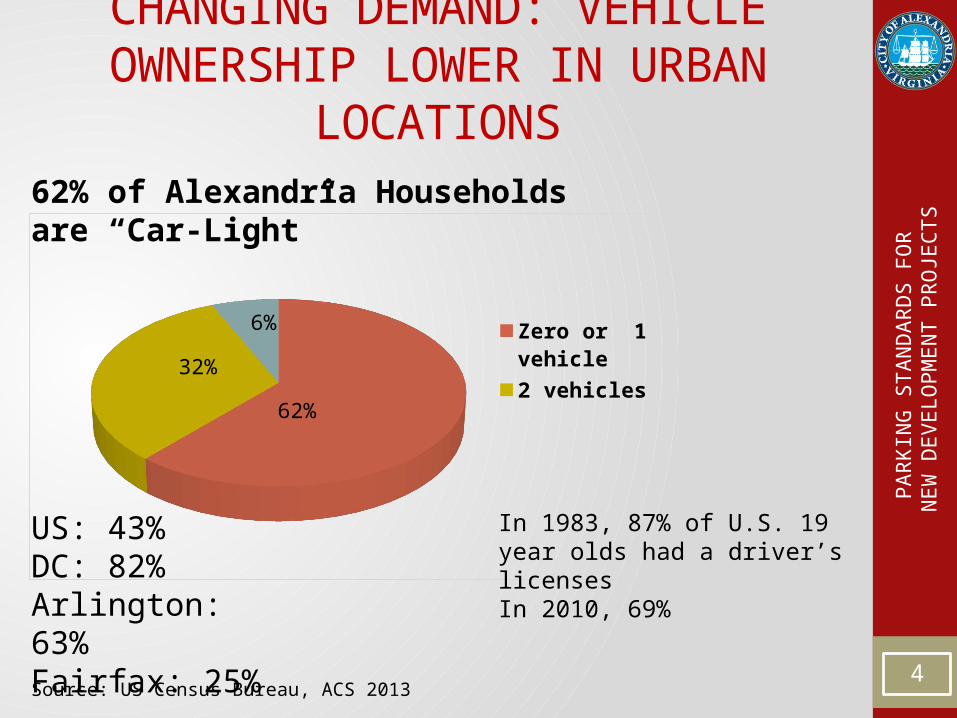
CHANGING DEMAND: VEHICLE OWNERSHIP LOWER IN URBAN
LOCATIONS
4
62% of Alexandria Households are “Car-Light”
62%
32%
6% Zero or 1 vehicle2 vehicles3 or more vehicles
Source: US Census Bureau, ACS 2013
US: 43%DC: 82%Arlington: 63%Fairfax: 25%
In 1983, 87% of U.S. 19 year olds had a driver’s licensesIn 2010, 69%
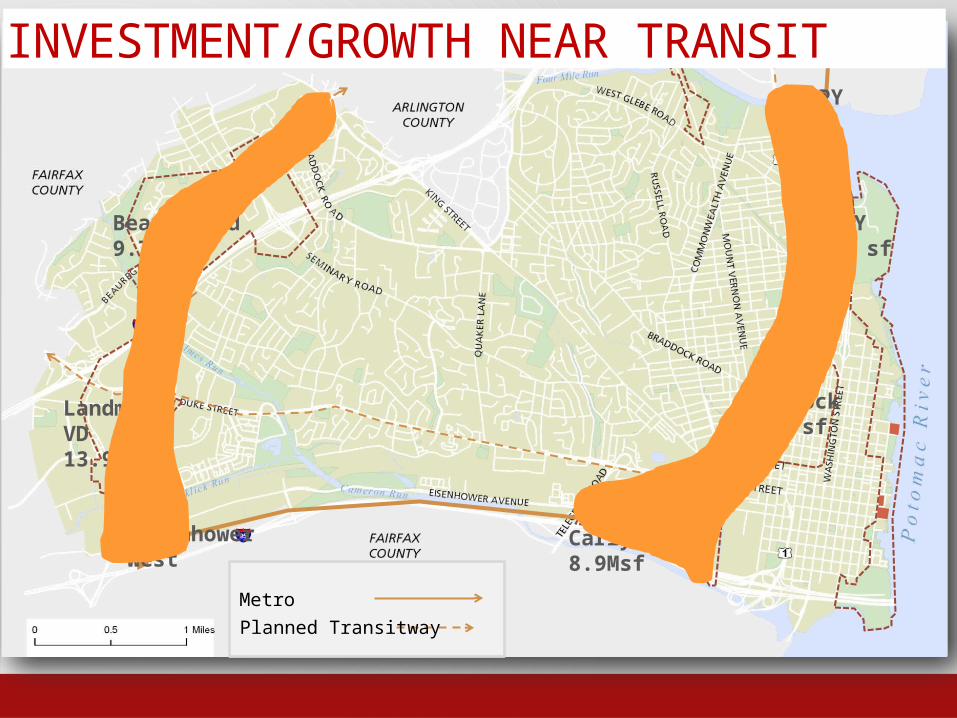
Growth Capacity in Recently Adopted Plans
MetroPlanned Transitway
N. PY7.5M sf
S. PY 3.8M sf
Braddock3.6M sf
Beauregard9.7M sf
Landmark/VD13.9M sf
Carlyle-EE 8.9Msf
INVESTMENT/GROWTH NEAR TRANSIT
Eisenhower West

PAR
KIN
G S
TAN
DA
RD
S F
OR
N
EW
DEV
ELO
PM
EN
T P
RO
JEC
TS
6
CHANGING DEMAND: EXPANDED TRANSPORTATION OPTIONS

PAR
KIN
G S
TAN
DA
RD
S F
OR
N
EW
DEV
ELO
PM
EN
T P
RO
JEC
TS
COSTS OF EXCESS PARKING
Environmental: Increased impervious surface; increased driving as a result of free/available parking, increased greenhouse gases
Opportunity Cost: other community amenities such as open space, enhanced streetscape, public art, affordable housing, amenities for residents, highest quality design and building materials, underground parking
Affordability: Cost of parking construction passed through to future residents in housing cost.
7

PAR
KIN
G S
TAN
DA
RD
S F
OR
N
EW
DEV
ELO
PM
EN
T P
RO
JEC
TS
= 10 Bike Parking Spaces
8
= 1 Micro-unit Apartment
1 Parking Space = 300 sf
WHAT’S IN A PARKING SPACE?
1 underground space = $30,000-50,000
718 unused parking spaces at 8 data collection sites in the City, equates to 210,000 sf., almost 5 acres of vacant parking.
Price tag: $21.5 - $35.9M (at $30k/space)

PAR
KIN
G S
TAN
DA
RD
S F
OR
N
EW
DEV
ELO
PM
EN
T P
RO
JEC
TS
GOALS OF THE STUDY
• Updated zoning ordinance to be reflective of City policies and practices, regional and national trends, and actual demand
• Increased transparency and clarity of development process with consistent application of parking standards
• Efficient use of resources, both city and environmental
• Right-sized parking to provide adequate parking on-site and not create spillover parking in neighborhoods
9
PAR
KIN
G S
TAN
DA
RD
S F
OR
N
EW
DEV
ELO
PM
EN
T P
RO
JEC
TS
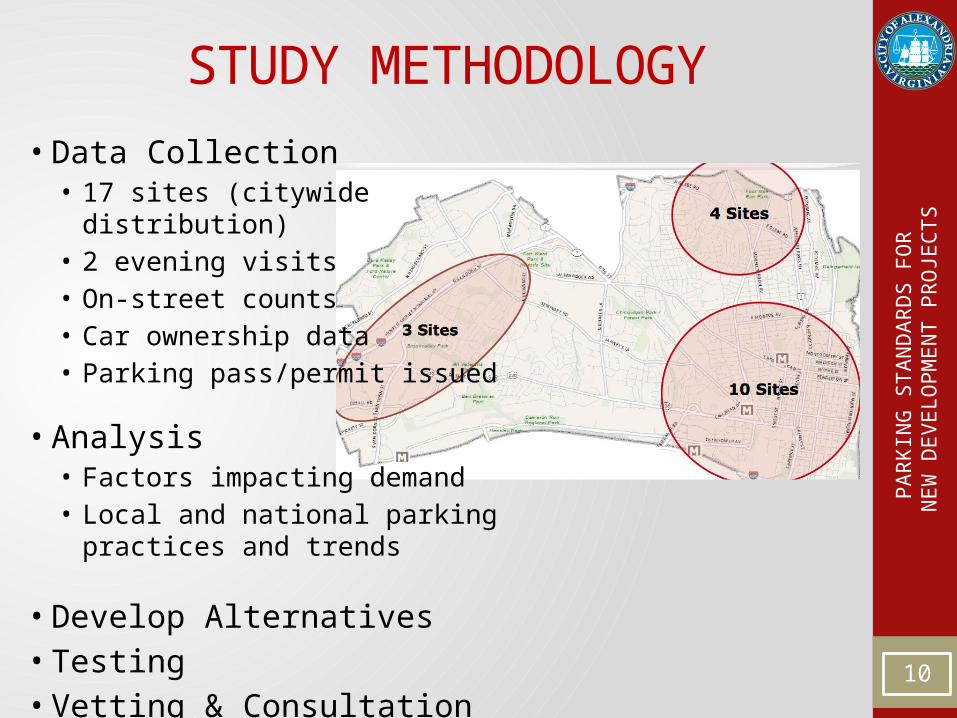
STUDY METHODOLOGY
• Data Collection• 17 sites (citywide distribution)• 2 evening visits• On-street counts• Car ownership data• Parking pass/permit issued
• Analysis• Factors impacting demand• Local and national parking
practices and trends
• Develop Alternatives• Testing • Vetting & Consultation
10

PAR
KIN
G S
TAN
DA
RD
S F
OR
N
EW
DEV
ELO
PM
EN
T P
RO
JEC
TS
DATA ANALYSIS RESULTS:FACTORS AFFECTING PARKING
DEMAND• Factors with a direct impact on parking
utilization• Proximity to Metro• Walkability of the neighborhood• Percentage of studio units• Number of bus routes serving the development
• Other factors• Car ownership• Proximity to neighborhood services• Fee for parking• Number of bedrooms in the development• On-street parking availability
11

PAR
KIN
G S
TAN
DA
RD
S F
OR
N
EW
DEV
ELO
PM
EN
T P
RO
JEC
TS
• Amount of provided parking in the City generally exceeds the amount of parking utilized• About 27% more parking provided at sites within 0.5 mile
of metro• About 10% more provided at sites > 0.5 mile of metro
• Residential projects closer to Metro have a lower parking demand
• Parking demand can be more closely projected based on a per bedroom measure rather than a per unit measure
Conclusion: Develop a standard that responds to site context and the key factors impacting parking demand 12
DATA ANALYSIS FINDINGS

PAR
KIN
G S
TAN
DA
RD
S F
OR
N
EW
DEV
ELO
PM
EN
T P
RO
JEC
TS
DRAFT RECOMMENDATION
13
New Base Parking Ratio dependent on proximity to Metro:
To inform the appropriate final ratio, credits will be applied to the Base Ratio for the following:
• Within ½ mile of BRT Stop: 10%(Credit only available to projects > 0.5 mile from Metro Station)
• Within ¼ mile of 4+ Bus Routes: 5%
• Walkability Index Very High or High: 10% or 5%
• Discretionary Mixed-Use or
Infrastructure Credit: 5%
• More than 20% Studio Units: 5%

PAR
KIN
G S
TAN
DA
RD
S F
OR
N
EW
DEV
ELO
PM
EN
T P
RO
JEC
TS
14
COMPARING EXAMPLE PROJECTS
New Recommendation: 108 spaces 135 spacesCurrent Zoning:153 spaces 153 spaces
Example 1Within 0.5 Mile of Metro Walkshed
Example 2More than 0.5 Mile
from Metro Walkshed0.8 space/bedroom 1.0 space/bedroom
Deductions on the Base Parking Ratio (If Eligible)Within 0.5 mile walkshed of BRT Stop (only available to projects > 0.5 mile from Metro station)
10%
Four or more bus routes stop within 0.25 mile of development entrance
5%
Walkability Index between 90 - 100 10%Walkability Index between 80 - 90 5% x xProject has more than 20% studio units 5% x xAvailable Discretionary Credit for future mixed-use development, infrastructure improvement, and capital improvement above what is required. (Credit is available for projects with Walkability Index < 80).
5%
10% 10%0.72 0.90
Total Credits/Deductions on base parking ratioFinal Parking Ratio
Base Parking Ratio
100 Unit Residential Development (50 1BD units, 50 2BD units)

PAR
KIN
G S
TAN
DA
RD
S F
OR
N
EW
DEV
ELO
PM
EN
T P
RO
JEC
TS
15
DRAFT PARKING RATIOSLOCATION SPECIFIC
0.60 – 0.80 Space/Bd
0.60 – 0.80 Space/Bd
0.65 – 1.0 Space/Bd
0.65 – 1.0 Space/Bd

PAR
KIN
G S
TAN
DA
RD
S F
OR
N
EW
DEV
ELO
PM
EN
T P
RO
JEC
TS
AFFORDABLE HOUSING DRAFT RECOMMENDATION
16
New Base Parking Ratio1.0 per unit, with deductions for affordable units as follows:Units at 60% AMI 25%Units at 50% AMI 35%Units at 30% AMI 50%
As with market rate housing, to inform the appropriate final ratio, credits will be applied for the following:
• Within ½ mile of BRT Stop: 10%(Credit only available to projects > 0.5 mile from Metro Station)
• Within ¼ mile of 4+ Bus Routes: 5%
• Walkability Index Very High or High: 10% or 5%
• Discretionary Mixed-Use or
Infrastructure Credit: 5%
• More than 20% Studio Units: 5%
The lowest parking ratio permitted is 0.25/unit

PAR
KIN
G S
TAN
DA
RD
S F
OR
N
EW
DEV
ELO
PM
EN
T P
RO
JEC
TS
MEETING DATES MEETING
January 27, 2015 City Council Work Session to consider Draft Parking Recommendations
February 12, 2015
Task Force Meeting #5 to consider Draft Recommendations
February 2015 Additional Public Outreach
February 18, 2015
Transportation Commission Public Hearing to consider Draft Parking Recommendations
March 3, 10, and 14, 2015
Planning Commission and City Council Public Hearings to consider Draft Parking Recommendations
17
NEXT STEPS

PAR
KIN
G S
TAN
DA
RD
S F
OR
N
EW
DEV
ELO
PM
EN
T P
RO
JEC
TS
Background Slides
For additional information about the study, visit:www.alexandriava.gov/parkingstudies
or contact Brandi Collins, Project Manager, P&Z, [email protected]
18

PAR
KIN
G S
TAN
DA
RD
S F
OR
N
EW
DEV
ELO
PM
EN
T P
RO
JEC
TS
DRAFT RECOMMENDATION: DETAIL
19
Notes1. Applying credits to the base parking ratio is optional, however it informs the appropriate ratio for the project.2. Walk ScoreTM is used to calculate walkability index.3. Projects will not be required to provide parking for the 3rd and 4th bedrooms but can do so. 4. A project requesting a parking ratio higher than the base will require approval by PC and/or CC
Base Ratios
Available Credits
Within 0.5 mile walkshed of BRT Stop (only available to projects > 0.5 mile from Metro station)
10%
Four or more bus routes stop within 0.25 mile of development entrance 5%Walkability Index between 80 - 90 OR more than 90 5% OR 10%Available Discretionary Credit for future mixed-use development, infrastructure improvement, and capital improvement above what is required. (Credit is available for projects with Walkability Index < 80).
5%
Project has more than 20% studio units 5%
Deductions on the Base Parking Ratio (If Eligible)Market-Rate Housing Recommendation
PAR
KIN
G S
TAN
DA
RD
S F
OR
N
EW
DEV
ELO
PM
EN
T P
RO
JEC
TS
20
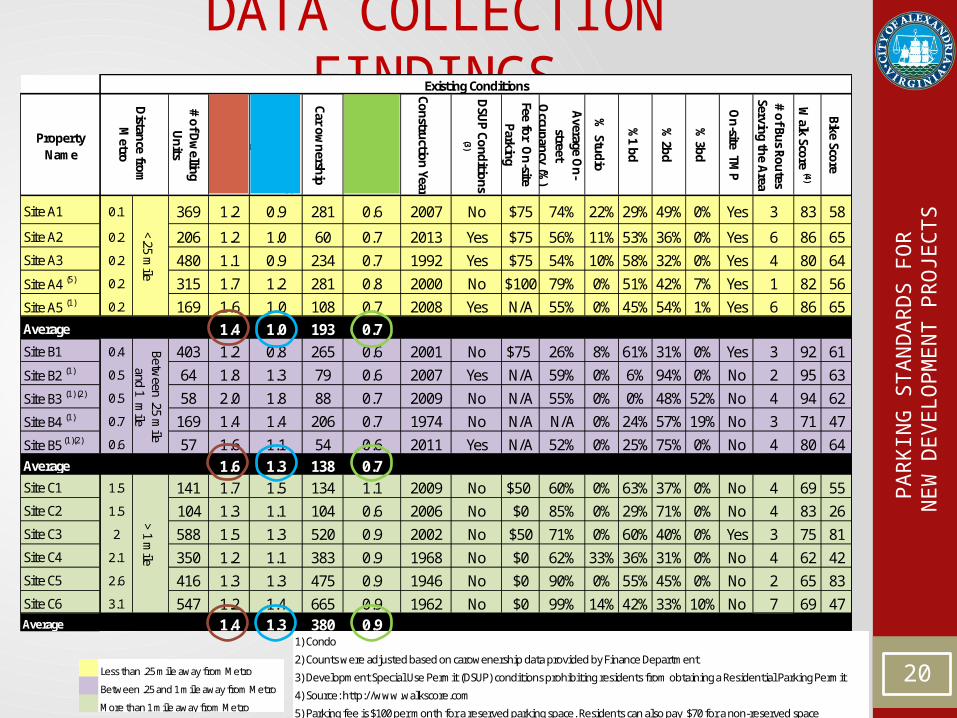
DATA COLLECTION FINDINGS
1) Condo
2) Counts were adjusted based on carowenership data provided by Finance Department
3) Development Special Use Permit (DSUP) conditions prohibiting residents from obtaining a Residential Parking Permit
4) Source: http://www.walkscore.com
5) Parking fee is $100 per month for a reserved parking space. Residents can also pay $70 for a non-reserved space
Less than .25 mile away from Metro
Between .25 and 1 mile away from Metro
More than 1 mile away from Metro
Property Name
# of Dw
elling U
nits
Provided Parking Rati
o
Average Per U
nit D
emand Based
Parking Ratio
Car ownership
Average Per Bedroom
D
emand Rati
o
Construction Year
DSU
P Conditions
(3)
Average O
n-street
Occupancy (%
)
% Studio
%1 bd
% 2bd
% 3bd
On-site TM
P
# of Bus Routes Serving the A
rea
Walk Score (4)
Bike Score
Site A1 0.1 369 1.2 0.9 281 0.6 2007 No $75 74% 22% 29% 49% 0% Yes 3 83 58
Site A2 0.2 206 1.2 1.0 60 0.7 2013 Yes $75 56% 11% 53% 36% 0% Yes 6 86 65Site A3 0.2 480 1.1 0.9 234 0.7 1992 Yes $75 54% 10% 58% 32% 0% Yes 4 80 64
Site A4 (5) 0.2 315 1.7 1.2 281 0.8 2000 No $100 79% 0% 51% 42% 7% Yes 1 82 56
Site A5 (1) 0.2 169 1.6 1.0 108 0.7 2008 Yes N/A 55% 0% 45% 54% 1% Yes 6 86 65Average 1.4 1.0 193 0.7Site B1 0.4 403 1.2 0.8 265 0.6 2001 No $75 26% 8% 61% 31% 0% Yes 3 92 61
Site B2 (1) 0.5 64 1.8 1.3 79 0.6 2007 Yes N/A 59% 0% 6% 94% 0% No 2 95 63
Site B3 (1) (2) 0.5 58 2.0 1.8 88 0.7 2009 No N/A 55% 0% 0% 48% 52% No 4 94 62
Site B4 (1) 0.7 169 1.4 1.4 206 0.7 1974 No N/A N/A 0% 24% 57% 19% No 3 71 47
Site B5 (1)(2) 0.6 57 1.6 1.1 54 0.6 2011 Yes N/A 52% 0% 25% 75% 0% No 4 80 64Average 1.6 1.3 138 0.7Site C1 1.5 141 1.7 1.5 134 1.1 2009 No $50 60% 0% 63% 37% 0% No 4 69 55Site C2 1.5 104 1.3 1.1 104 0.6 2006 No $0 85% 0% 29% 71% 0% No 4 83 26Site C3 2 588 1.5 1.3 520 0.9 2002 No $50 71% 0% 60% 40% 0% Yes 3 75 81Site C4 2.1 350 1.2 1.1 383 0.9 1968 No $0 62% 33% 36% 31% 0% No 4 62 42Site C5 2.6 416 1.3 1.3 475 0.9 1946 No $0 90% 0% 55% 45% 0% No 2 65 83Site C6 3.1 547 1.2 1.4 665 0.9 1962 No $0 99% 14% 42% 33% 10% No 7 69 47Average 1.4 1.3 380 0.9
Fee for On-site
Parking
Existing Conditions
<.25 mile
Between .25 m
ile and 1 m
ile> 1 m
ileD
istance from
Metro

PAR
KIN
G S
TAN
DA
RD
S F
OR
N
EW
DEV
ELO
PM
EN
T P
RO
JEC
TS
TESTING THE RECOMMENDATION
DATA COLLECTION SITES
21
Zoning Ordinance Required
Parking Spaces (#)
Approved DSUP
Spaces (#)
Observed Utilization (#)
Difference btw Recommendation
and Observed Utilization (#)
% Difference btw Recommendation
and Observed Utilization (%)
Difference btw Recommendation
and Observed Utilization (#)
% Difference btw Recommendation
and Observed Utilization (%)
Site A1 561 450 337 103 30% 48 14%Site A2 301 256 206 19 9% -9 -5%Site A3 693 541 415 92 22% 29 7%Site A4 490 532 386 -11 -3% -34 -9%Site A5 263 263 172 38 22% 12 7%Site A6 580 496 339 83 25% 31 9%Site A7 110 115 80 19 24% 7 9%Site A8 117 115 102 -9 -9% -27 -26%
Site B1 294 240 230 67 29% 67 29%Site B2 93 94 63 37 59% 32 51%Site B3 207 236 214 -21 -10% -31 -14%Site B4 168 137 114 64 56% 46 40%Site B5 870 882 741 82 11% 0 0%Site B6 504 411 398 61 15% 15 4%Site B7 625 561 548 55 10% 55 10%Site B8 837 643 772 5 1% -33 -4%Observed data was adjusted per on-street occupancy counts: B4, B7
Observed data was adjusted per car ownership data plus visitor: A7, A8, B8
Observed data was adjusted per number of parking passes issued plus visitor: B3, B5, B6
Sites A4, A5, A8, B1, B8 have 3bedroom units; 2 space/unit cap was applied to those units
Within 0.5 Mile of Metro Station
More than 0.5 Mile from Metro Station
Recommendation Without Applying Credits
Recommendation With Applying CreditsExisting Condition
PAR
KIN
G S
TAN
DA
RD
S F
OR
N
EW
DEV
ELO
PM
EN
T P
RO
JEC
TS
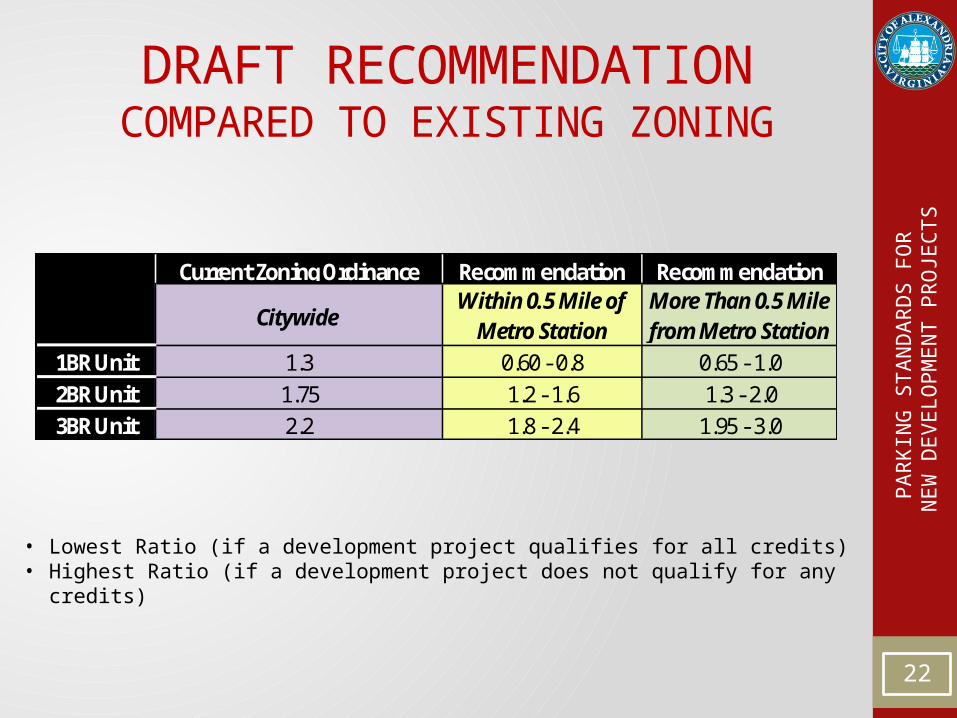
DRAFT RECOMMENDATION COMPARED TO EXISTING ZONING
22
• Lowest Ratio (if a development project qualifies for all credits)• Highest Ratio (if a development project does not qualify for any
credits)
Current Zoning Ordinance Recommendation Recommendation
CitywideWithin 0.5 Mile of
Metro StationMore Than 0.5 Mile from Metro Station
1BR Unit 1.3 0.60 - 0.8 0.65 - 1.02BR Unit 1.75 1.2 - 1.6 1.3 - 2.03BR Unit 2.2 1.8 - 2.4 1.95 - 3.0

PAR
KIN
G S
TAN
DA
RD
S F
OR
N
EW
DEV
ELO
PM
EN
T P
RO
JEC
TS
PARKING REDUCTION REQUESTSApplicants can request a “Special Use Permit for a parking reduction” as part of the DSUP process
Examples of recent Parking Reduction SUPs:
23
Development Project Reduced Parking Ratio Approved
Zoning Ordinance
< 1 Mile from Metro
Braddock Metro Small Area The Belle Pre 1.05/du 1.3/1.75/2.2 The Asher 1.05/du 1.3/1.75/2.2 Braddock Gateway 0.9/du (+15% visitor) 1.3/1.75/2.2 Potomac Yard Small Area
Landbay G 1.3/du 1.3/1.75/2.2 XLandbay L 1.24/du 1.3/1.75/2.2 Other Areas
Harris Teeter 1.3/du 1.3/1.75/2.2 The Calvert 1.35/du 1.3/1.75/2.2 X

PAR
KIN
G S
TAN
DA
RD
S F
OR
N
EW
DEV
ELO
PM
EN
T P
RO
JEC
TS
PARKING REDUCTION REQUESTS
From 2011- 2013• 66 total DSUP Applications• Of these, 14 (21%) applied for parking
reductions, which were approved by City Council• This represents 25% of all residential DSUPs, and
27% of all mixed use residential DSUPs
24

PAR
KIN
G S
TAN
DA
RD
S F
OR
N
EW
DEV
ELO
PM
EN
T P
RO
JEC
TS
ALEXANDRIA DEMOGRAPHIC TRENDS
25
Total Population, Cars, Housing Units
2000 2008-20120
20,000
40,000
60,000
80,000
100,000
120,000
140,000
160,000
Total PopulationTotal # HouseholdsHousing Units# Cars
128,283
140,337
POPULATION9% increase
CARS7% increase
HOUSING UNITS13% increase
Source: US Census Bureau
PAR
KIN
G S
TAN
DA
RD
S F
OR
N
EW
DEV
ELO
PM
EN
T P
RO
JEC
TS
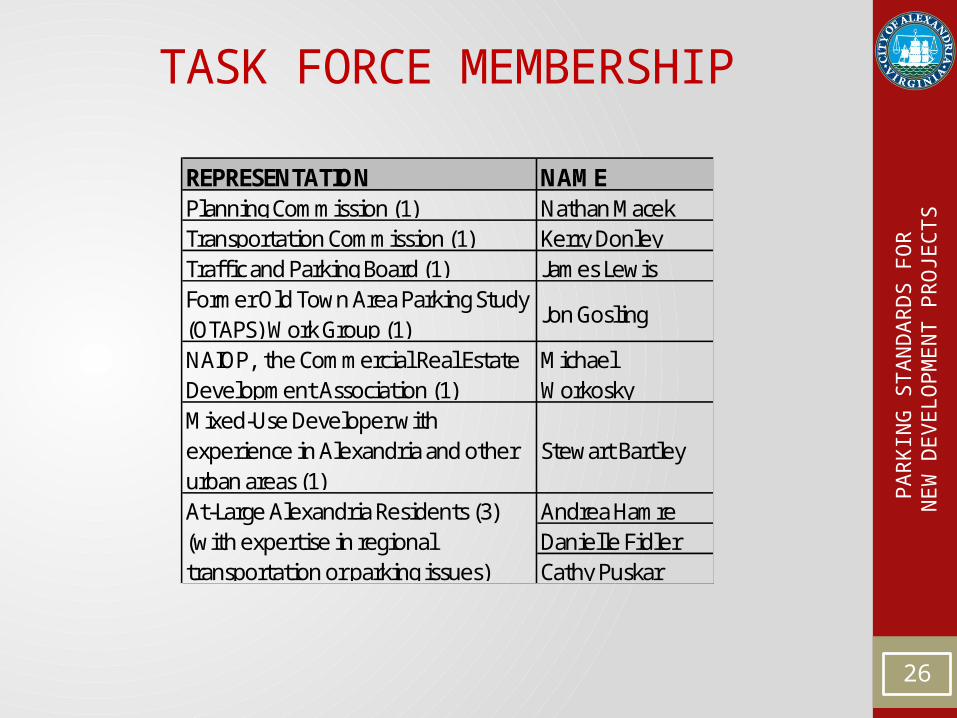
TASK FORCE MEMBERSHIP
26
REPRESENTATION NAMEPlanning Commission (1) Nathan MacekTransportation Commission (1) Kerry DonleyTraffi c and Parking Board (1) James LewisFormer Old Town Area Parking Study (OTAPS) Work Group (1)
Jon Gosling
NAIOP, the Commercial Real Estate Development Association (1)
Michael Workosky
Mixed-Use Developer with experience in Alexandria and other urban areas (1)
Stewart Bartley
Andrea HamreDanielle FidlerCathy Puskar
At-Large Alexandria Residents (3)(with expertise in regional transportation or parking issues)

PAR
KIN
G S
TAN
DA
RD
S F
OR
N
EW
DEV
ELO
PM
EN
T P
RO
JEC
TS
March 31, 2014: Expert Panel on Right-Sizing Parking
April 9, 2014 : TF Public Meeting #1 - Study Overview
May 14, 2014 : TF Public Meeting #2 - Data Collection Results,
Analysis, Key Factors Impacting Demand
June 11, 2014 : TF Public Meeting #3 - Best Practices, Options,
Alternatives
October 7, 2014 : NAIOP Meeting – Initial Recommendations
October 22, 2014 : TF Public Meeting #4 – Initial Recommendations
October 29, 2014 : Federation of Civic Associations update
December 2, 2014 : NAIOP Meeting – Draft Recommendations
December 17, 2014 : Transportation Commission Work Session27
CIVIC ENGAGEMENT TO DATE

PAR
KIN
G S
TAN
DA
RD
S F
OR
N
EW
DEV
ELO
PM
EN
T P
RO
JEC
TS
KING COUNTY PARKING CALCULATOR• A statistical model to estimate parking use based on
building and environmental characteristics The dependent variable: demand-based parking ratios gathered
from the field data
Independent variables:• Average Rent• Units per Residential square feet• Percent of Units Designated Affordable• Average Occupied Bedroom Count• Parking Price as a Fraction of Rent• Gravity measure of Transit Service• Gravity measure of Intensity
• This calculator was developed as a part of King County Metro Transit’s Right Size Parking Project Funding Source: Federal Highway Administration’s Value Pricing
Program Partners Included: Center for Neighborhood Technology, who
constructed the statistical model and developed the website tool, and the Urban Land Institute, Northwest Chapter, who provided community engagement and outreach support throughout the project. 28


