PARKS VOL 21.2 NOVEMBER 2015 PARKS VOL 21.2 NOVEMBER 2015 INTRODUCTION Protected areas are globally considered as a key strategy for conservation of natural environments and species. Among the various types of protected areas, IUCN category II protected areas (e.g. national parks) have the objective to provide access for tourism and recreation. The promotion of tourism helps to raise societal awareness and increases support for biodiversity conservation. Category II, national parks offer numerous recreational settings that attract visitors, and the public use reinforces support for the creation and maintenance of such areas (Eagles & McCool, 2002; Weiler et al., 2013). In addition, visitor use management also creates alternative employment and income for local communities that are adjacent to parks, and is dependent on visitor flows and associated expenditures in the area (Emerton et al., 2006; Neuvonen et al., 2010; Thapa, 2013). Hence, the relationship of parks’ attributes and regional characteristics along with visitation volume are essential for planning and management goals (Puustinen et al., 2009), given the local linkages as well as the need to optimize visitor experiences (Mulholland & Eagles, 2002). Visitor demand and associated park choices have been extensively examined, and correlations with internal park features and related quality have been identified (Manning, 2011). However, external characteristics such as access, accommodations, and available services outside the park have also been noted as factors that influence visitation (Neuvonen et al., 2010; Puustinen et al., 2009). In fact, a site is considered by visitors within the larger context of a destination and is evaluated based on its tourism attractiveness (Formica & Uysal, 2006). The concept has been widely used to classify destinations, and has also been applied within the context of protected areas (Choi, 2012; Deng et al., 2002; Lee et al., 2010). Tourism attractiveness (Gearing et al., 1974) has been utilized to understand visitors’ decision making processes and is dependent on availability of attractions and associated perceived importance (Formica & Uysal, 2006). Moreover, tourism attractiveness has been segmented into two broad categories: primary and secondary attributes. Primary attributes are innate to a destination and are related to its natural beauty and heritage, while secondary attributes are related to tourist infrastructure (Laws, ABSTRACT Understanding the determinant attributes that affect the tourism attractiveness of National Parks is a strategic planning tool for protected areas. This exploratory study assessed the relative importance of various internal and external park characteristics on visitation numbers in Brazil. Data were collected from several sources: 28 park managers, internal park documents, government databases and various websites. The study used correlation and regression analysis. Results demonstrated that tourism attractiveness in the national parks can be predicted through reputation, recreation facilities, attractions in the region and population density. Results show that both internal park attributes and external setting characteristics are considered by visitors. The results have practical utility and can be used to improve investments efficacy among the parks that already receive visitors, as well as serve to evaluate the tourism attractiveness for new parks. Also, findings are useful for the communities and small businesses located in the adjacent areas, since adequate prediction of visitor demand provides support for tourism activities. Key words: Ecotourism, outdoor recreation, tourism attractiveness, national parks, Brazil DETERMINANTS OF TOURISM ATTRACTIVENESS IN THE NATIONAL PARKS OF BRAZIL Ernesto Viveiros de Castro 1 , Thiago Beraldo Souza 2,4 * and Brijesh Thapa 3 * Corresponding author: [email protected]1 Tijuca National Park, Rio de Janeiro, Brazil 2 Chico Mendes Institute for Biodiversity Conservation, Brasília, Brazil 3 Department of Tourism, Recreation & Sport Management, University of Florida, USA 4 School of Natural Resources and Environment, University of Florida, USA PARKS 2015 Vol 21.2 10.2305/IUCN.CH.2014.PARKS-21-2EVDC.en
Transcript
51
parksjournal.com
PARKS VOL 21.2 NOVEMBER 2015
PARKS VOL 21.2 NOVEMBER 2015
INTRODUCTION
Protected areas are globally considered as a key strategy
for conservation of natural environments and species.
Among the various types of protected areas, IUCN
category II protected areas (e.g. national parks) have the
objective to provide access for tourism and recreation.
The promotion of tourism helps to raise societal
awareness and increases support for biodiversity
conservation. Category II, national parks offer numerous
recreational settings that attract visitors, and the public
use reinforces support for the creation and maintenance
of such areas (Eagles & McCool, 2002; Weiler et al.,
2013). In addition, visitor use management also creates
alternative employment and income for local
communities that are adjacent to parks, and is dependent
on visitor flows and associated expenditures in the area
(Emerton et al., 2006; Neuvonen et al., 2010; Thapa,
2013). Hence, the relationship of parks’ attributes and
regional characteristics along with visitation volume are
essential for planning and management goals (Puustinen
et al., 2009), given the local linkages as well as the need
to optimize visitor experiences (Mulholland & Eagles,
2002).
Visitor demand and associated park choices have been
extensively examined, and correlations with internal
park features and related quality have been identified
(Manning, 2011). However, external characteristics such
as access, accommodations, and available services
outside the park have also been noted as factors that
influence visitation (Neuvonen et al., 2010; Puustinen et
al., 2009). In fact, a site is considered by visitors within
the larger context of a destination and is evaluated based
on its tourism attractiveness (Formica & Uysal, 2006).
The concept has been widely used to classify
destinations, and has also been applied within the
context of protected areas (Choi, 2012; Deng et al., 2002;
Lee et al., 2010). Tourism attractiveness (Gearing et al.,
1974) has been utilized to understand visitors’ decision
making processes and is dependent on availability of
attractions and associated perceived importance
(Formica & Uysal, 2006). Moreover, tourism
attractiveness has been segmented into two broad
categories: primary and secondary attributes. Primary
attributes are innate to a destination and are related to
its natural beauty and heritage, while secondary
attributes are related to tourist infrastructure (Laws,
www.iucn.org/parks www.iucn.org/parks
ABSTRACT
Understanding the determinant attributes that affect the tourism attractiveness of National Parks is a
strategic planning tool for protected areas. This exploratory study assessed the relative importance of
various internal and external park characteristics on visitation numbers in Brazil. Data were collected from
several sources: 28 park managers, internal park documents, government databases and various websites.
The study used correlation and regression analysis. Results demonstrated that tourism attractiveness in the
national parks can be predicted through reputation, recreation facilities, attractions in the region and
population density. Results show that both internal park attributes and external setting characteristics are
considered by visitors. The results have practical utility and can be used to improve investments efficacy
among the parks that already receive visitors, as well as serve to evaluate the tourism attractiveness for new
parks. Also, findings are useful for the communities and small businesses located in the adjacent areas,
since adequate prediction of visitor demand provides support for tourism activities.
Key words: Ecotourism, outdoor recreation, tourism attractiveness, national parks, Brazil
DETERMINANTS OF TOURISM ATTRACTIVENESS IN THE NATIONAL PARKS OF BRAZIL
Ernesto Viveiros de Castro1, Thiago Beraldo Souza2,4 * and Brijesh Thapa3 * Corresponding author: [email protected] 1Tijuca National Park, Rio de Janeiro, Brazil 2 Chico Mendes Institute for Biodiversity Conservation, Brasília, Brazil 3 Department of Tourism, Recreation & Sport Management, University of Florida, USA 4 School of Natural Resources and Environment, University of Florida, USA
PARKS 2015 Vol 21.2
10.2305/IUCN.CH.2014.PARKS-21-2EVDC.en
52
Viveiros de Castro, Souza & Thapa
1995). The secondary attributes include accessibility,
lodging facilities, food, services and activities. In
addition, these have been further subdivided into
internal and external attributes. In protected areas,
internal are those that exist within, such as management
policy, infrastructure and services. External are related to
infrastructure and concentration of attractions around
the protected areas (Puustinen et al., 2009). The
determination of the relative importance of each of these
factors is the most critical aspect for development of a
destination (Hu & Ritchie, 1993; Neuvonen et al., 2010).
Most research has been based on qualitative analyses via
expert panels (Deng et al., 2002; Lee et al., 2010) or
quantitative tourist surveys (Choi, 2012; Thapa et al.,
2011). While both approaches have their merits,
limitations are evident given the subjectivity and ability
to analyze multiple destinations, especially remote
regions where most protected areas are located.
Moreover, research has largely been focused on either a
demand (i.e., tourists) or supply perspective (i.e.,
internal park attributes) with limited integration of both
to understand visitation (Neuvonen et al., 2010). While
demand-based research has been dominant, the supply
side analysis has also emerged to further examine the
relationships between park characteristics and visitation.
An analysis by Puustinen et al. (2009) of 35 Finnish
national parks acknowledged that higher volume of
visitation was associated with natural characteristics as
well as the availability of recreational facilities inside and
tourism services outside the parks. Furthermore, based
on the same sample, Neuvonen et al. (2010) examined
the visitation numbers in relationship to the parks’
internal and external attributes and identified that
recreational opportunities, trails, diversity of biotopes,
and a park’s age increased volume of visits from all
around the country. However, a park’s location was only
significant in southern Finland. Overall, both studies
provide an improved approach to the examination of
park visitation which has demonstrated utility for
planning, policy and management decisions.
Using a similar framework, this exploratory study was to
further build and assess the relative importance of
various internal and external park characteristics with
respect to visitation numbers in the national parks of
Brazil. The federal system of protected areas
encompasses 76 million hectares divided into 320 units,
of which 71 are designated as national parks (see Figure
1). Based on the scale and units, the national parks
receive a comparatively small volume of visitors: 6.5
million in 2014 which is skewed towards two parks
(Tijuca and Iguaçu) that have an international brand
image (ICMBio, 2014). The lack of visitor influx to other
PARKS VOL 21.2 NOVEMBER 2015
Figure 1: Visitation in national parks of Brazil in 2013
53
parksjournal.com
parks may be the result of various issues. For example,
the lack of opportunities and infrastructure development
has been evident. One possible cause is due to the
Protected Areas Agency’s longstanding viewpoint
towards tourism. For the past 30 years, tourism has been
perceived as an agent of change, such as exotic plants or
fire which has justified strong restrictive policies for
outdoor recreation in the national parks of Brazil
(Zimmerman, 2006). Furthermore, the combination of
lack of societal support and budgetary constraints has
also created a vicious cycle which has hindered the
growth of visitation and support for protected areas. In
order to assist decision-makers and park managers with
respect to resources allocation, investment priorities, and
sustainability of protected areas, the objective of this
study is to contribute to an enhanced understanding
based on factors that influence visitor flows to the
national parks in Brazil.
METHODS
Sample: ICMBio (Chico Mendes Institute for
Biodiversity Conservation) is the federal authority under
the Ministry of Environment that is responsible for the
management of Brazilian Federal Protected Areas.
Among the national park units (N=71), there are only a
few that are prepared for tourism, while others are
minimally equipped, and most do not control access nor
have entry fees. Based on the General Coordination of
Public Use and Business, this study only included
national parks (N=36) that had registered visitors in
2013 based on paid user fees (see Table 1).
PARKS VOL 21.2 NOVEMBER 2015
National Park Name Year of
establishment
Area (ha.) Ecoregion 2013 Visits
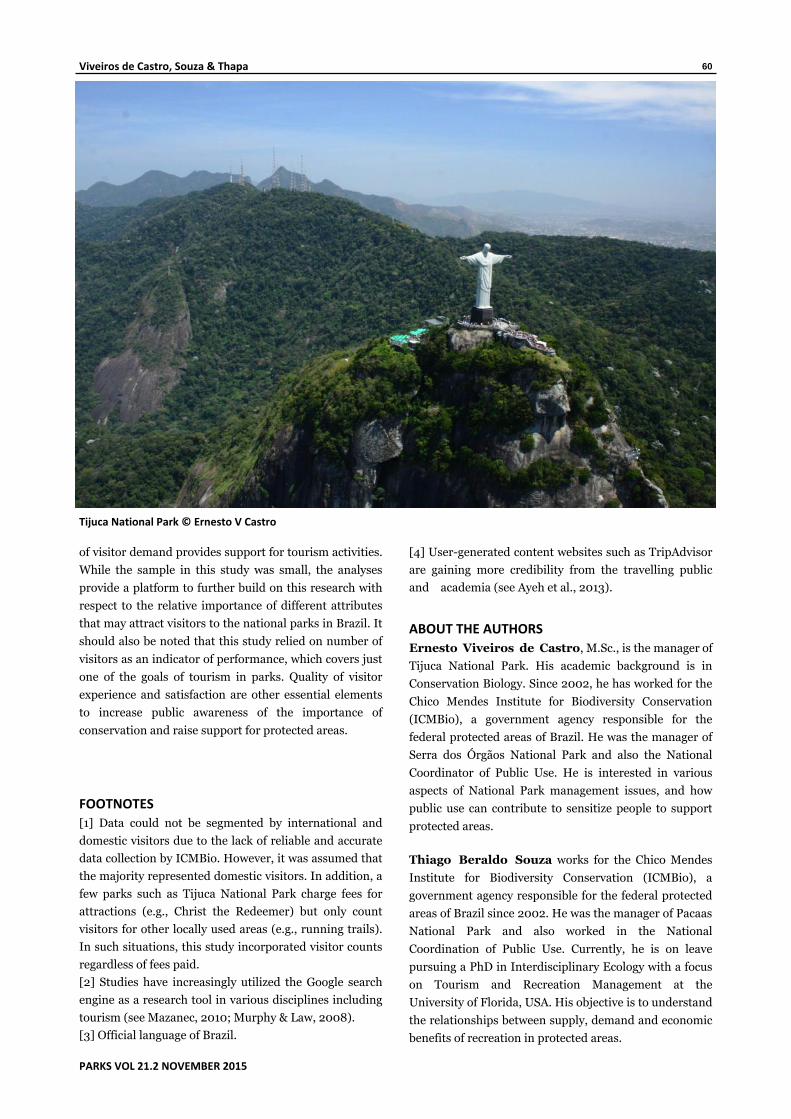
Tijuca NP 1961 3,950 AF 2,899,972
Iguaçu NP 1939 185,262 AF 1,518,876
Brasília NP 1961 42,355 CE 248,287
São Joaquim NP 1961 49,300 AF 139,743
Serra dos Orgãos NP 1939 20,020 AF 132,246
Ubajara NP 1959 6,288 CA 108,529
Serra da Bocaina NP 1971 104,000 AF 106,691
Chapada dos Guimaraes NP 1989 33,000 CE 102,753
Itatiaia NP 1937 30,000 AF 99,495
Aparados da Serra NP 1959 10,250 AF 73,590
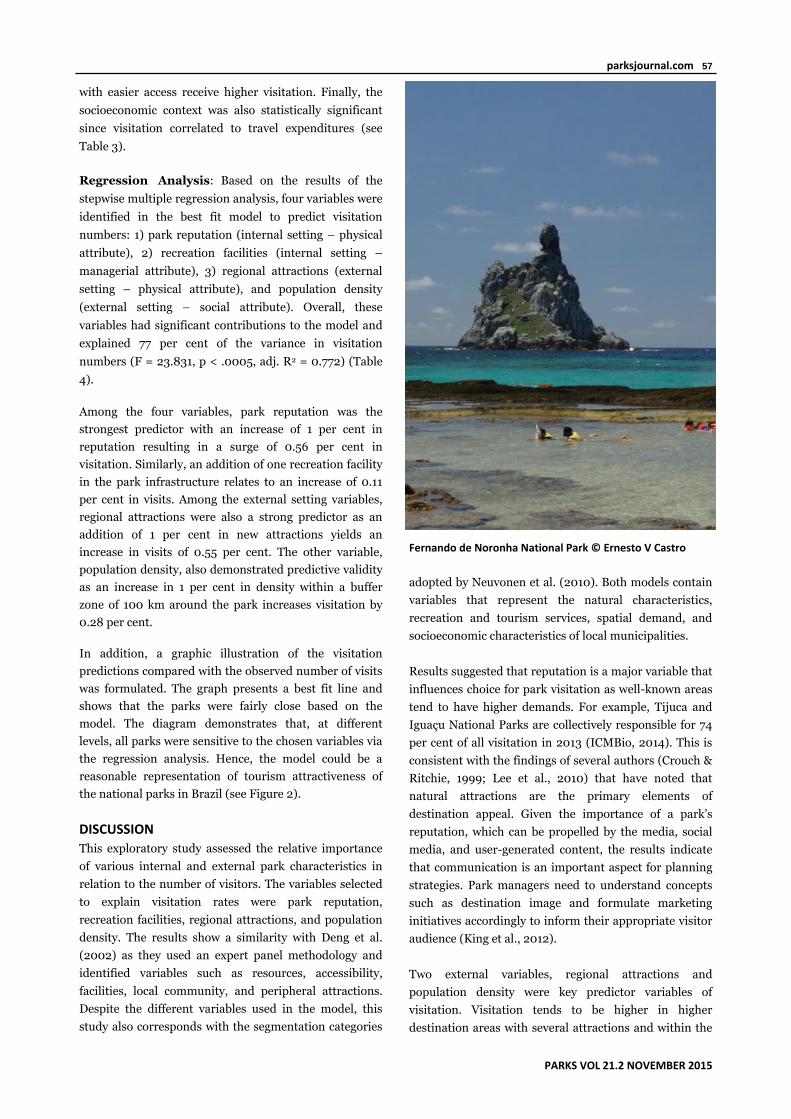
Fernando de Noronha NMP 1988 11,270 MA 61,580
Serra Geral NP 1992 17,300 AF 52,139
Serra da Canastra NP 1972 71,525 CE 46,274
Caparaó NP 1961 31,800 AF 32,245
Chapada dos Veadeiros NP 1961 64,795 CE 27,407
Serra do Cipó NP 1984 33,800 CE 25,438
Sete Cidades NP 1961 6,221 CA 20,726
Serra da Capivara NP 1979 129,000 CA 19,998
Superagui NP 1989 33,988 MA 15,374
Serra do Itajaí NP 2004 57,374 AF 10,221
Abrolhos NMP 1983 91,255 MA 4,328
Emas NP 1961 132,642 CE 2,325
Viruá NP 1998 227,000 AM 2,000
Amazônia NP 1974 1,085,000 AM 686
Jaú NP 1980 2,272,000 AM 292
Serra da Bodoquena NP 2000 76,481 CE 226
Cavernas do Peruaçu NP 1999 56,800 CE 210
Pantanal Matogrossense NP 1981 135,000 PA 146
Table 1: National Parks included in this study (ICMBio, 2014)
Key: AF: Atlantic Forest
AM: Amazon
CE: Cerrado (savannah)
CA: Caatinga
MA: Marine
54
Viveiros de Castro, Souza & Thapa
Data collection: Data were collected from three
different sources. First, primary data were collected from
databases and various websites from the Internet were
used. The use of the Web as a source of information
within the tourism academic discipline has been found to
be a reliable alternative as it is more practical and less
costly than primary field data (Wood et al., 2013).
Operationalization of variables: Park visits were the
dependent variable and were represented by the
registered number of visitors in each national park [1].
For the independent variables, first, a comprehensive
literature review was conducted prior to the development
of the variables for the framework. Additional emphasis
was given to the empirical studies on Finnish national
parks (Neuvonen et al., 2010; Puustinen et al., 2009). A
total of 13 independent variables were defined and
operationalized. The identified variables were
categorized based on the Recreation Opportunity
Spectrum (ROS) classification – Physical, Social, and
Managerial (Clark & Stankey, 1979). The 13 variables
within the three ROS classifications (Physical, Social, and
Managerial) were further segmented into two categories
of settings – Internal and External to the park (see Table
2). All variables were discussed and approved via a focus
group session with park managers in August 2014.
Internal setting: The variables within this setting were
reflective of internal attributes of a park, such as natural
beauty, diversity of recreation activities, park age and
planning tools. The physical category is usually
comprised of park attributes that include natural beauty
and historical heritage. However, the perception of
beauty or importance thereof is subjective and poses
measurement challenges (Neuvonen et al., 2010;
Puustinen et al., 2009). Hence, the study opted to use the
park’s reputation as a proxy and was objectively
measured based on Google Citations [2]. Essentially,
each park’s name as well as its most important attraction
was queried in English and Portuguese [3] during April
2015. A second variable, park age, was also included
within this category.
PARKS VOL 21.2 NOVEMBER 2015
Table 2: Operationalization of variables
Dependent variable
Visits Number of visitors in each park in 2013 (Log)
Independent variables – Internal Setting
Physical Attributes
Reputation Number of citations based on a Google search of the park’s name and most important attraction in Portuguese and English (Log).
Park Age Number of years since the National Park designation.
Social Attributes
Diversity of Activities
Number of recreation and sports activities offered (i.e., trekking, climbing, diving, cycling etc.).
Managerial Attributes
Recreation Facilities
Number of structures offered (i.e., lookouts, parking lots, visitor centre, etc.).
Visitor Services
Number of services provided by the park or concessionaires (i.e., transport, souvenirs, food etc.).
Planning Tools Number of management documents the park has produced and updated (i.e., General Management Plan, Outdoor Recreation Plan, Interpretation Plan etc.).
Land Tenure Percentage of the park owned by the government.
Independent variables – External Setting
Physical Attributes
Regional Attractions
Number of tourism attractions in the region based on a TripAdvisor web search where the park is queried via the number of ‘Things to Do’ in the park’s adjacent municipalities (Log).
Managerial Attributes
Hospitality Establishments
Number of lodging rooms and restaurants mentioned on Trip Advisor web search for municipalities adjacent to the park (Log).
Social Attributes
Socioeconomic Context
Average Human Development Index – HDI of the municipalities adjacent to the park.
Population Density
Number of citizens living in adjacent municipalities included within a buffer zone of 100 km around the park (Log).
Remoteness Travel time to the park from the nearest large city (> 500,000 people) added to the time from closest national or international airport based on Google Maps tools. For boat access, the park managers were requested to provide the navigation hours (Log).
Local Population
Population that live in the adjacent gateway municipalities of the park (Log).
55
parksjournal.com
The social category encompassed a variable that
represented the diversity of recreation and sport
activities located within the park (e.g., trekking,
climbing, diving, etc.). The managerial category included
variables that focused on recreation facilities (e.g.,
lookouts, parking lots, visitor centre) and visitor services
(e.g., guides, concessionaires). In order to test ICMBio’s
historical assumption that visitation depends on secure
land tenure and prior preparation of general
management plans, variables such as planning tools (e.g.,
management documents, outdoor recreation plan) and
land tenure (i.e., percentage of park ownership by the
government) were also included.
External setting: The variables within this external
setting were considered regional characteristics that
could influence visitation, such as regional attractions,
tourism infrastructure, socioeconomic context, and
population density. More specifically, the physical
category consisted of attractions in the park’s region.
Specific information was compiled from the TripAdvisor
[4] website. The web link ‘Things to do’ was searched for
information in regard to gateway communities/cities.
Similarly, TripAdvisor was employed to compile
information about tourism infrastructure such as
accommodations and restaurants which were noted as
hospitality establishments under the managerial
category. The social category consisted of a park’s
gateway community population and density along with
the socioeconomic context (i.e., average human
development index – HDI). Information about the
regions and population data were collected from
georeferenced databases. Additionally, remoteness along
PARKS VOL 21.2 NOVEMBER 2015
Table 3: Pearson’ Correlation Coefficients
ROS
Variables
Pearson’ correlation coefficient
p-value
Internal Setting
Physical Attributes Reputation 0.749** 0.000
Park Age 0.462* 0.013
Social Attributes Diversity of Activities 0.441* 0.019
Brijesh Thapa, Ph.D., is a Professor in the Department
of Tourism, Recreation & Sport Management at the
University of Florida. His research theme is within the
nexus of tourism, conservation and sustainability. He has
been involved in numerous projects in various capacities
in over 32 countries. Additionally, he has been involved
in projects at World Heritage Sites with respect to
tourism, cultural heritage, and natural resources
management issues. Recently, Dr Thapa has focused on
numerous capacity building and institutional
development projects through curriculum development,
research, and training in tourism, nature and cultural
heritage conservation, and natural resources
management.
REFERENCES
Ayeh, J. K., Au, N. and Law, R. (2013). Do we believe in TripAdvisor? Examining credibility perceptions and online travelers’ attitude toward using user-generated content. Journal of Travel Research, 52(4), 437-452. DOI:10.1177/0047287512475217
Clark, R. and Stankey, G. (1979). The Recreation Opportunity Spectrum: A Framework for Planning, Management, and Research. U.S. Department of Agriculture – Forest Service Research paper PNW-98. USDA Forest Service.
Cooper, D. R. & Schindler, P. S. (2011). Business research methods. New York: McGraw-Hill/Irwin series.
Crouch, G. I. and Ritchie, J. R. B. (1999). Tourism, competitiveness, and societal prosperity. Journal of Business Research, 44(3), 137-152. DOI:10.1016/S0148-2963(97)00196-3
Deng, J., King, B. and Bauer, T. (2002). Evaluating natural attractions for tourism. Annals of Tourism Research, 29(2), 422-438.
Eagles, P. and McCool, S. (2002). Tourism in National Parks and Protected Areas: Planning and Management. Wallingford, UK: CABI.
Emerton, L., Bishop, J. and Thomas, L. (2006). Sustainable financing of protected areas: A global review of challenges and options. Gland, Switzerland: IUCN.
Gearing, C. E., Swart, W. W. and Var, T. (1974). Establishing a measure of touristic attractiveness. Journal of Travel Research, 12(4), 1-8. DOI: 10.1177/004728757401200401
Hair, J. F. (2010). Multivariate data analysis. Upper Saddle River, NJ: Prentice Hall.
Hanink, D.M. and White, K. (1999). Distance effects in the demand for wildland recreational services: The case of national parks in the U.S. Environment & Planning, 31(3), 477-492. DOI: 10.1068/a310477
Hu,Y. and Ritchie, J.R.B. (1993). Measuring destination attractiveness: A contextual approach. Journal of Travel Research, 32(2), 25-34.
DOI: 10.1177/004728759303200204 Iatu, C. and Bulai, M. (2011). New approach in evaluating
tourism attractiveness in the region of Moldavia (Romania). International Journal of Energy and Environment, 2(5), 165-174.
ICMBio. (2012). Relatório de Gestão de 2011 [Trans. Administrative Report 2011]. Brasília: Chico Mendes Institute for Biodiversity Conservation.
ICMBio (2014). Visitor Numbers in Protected Areas. General Coordination of Public Use and Business CGEUP (internal document), Brasilia.
Kim, S.S., Lee, C. K. and Klenosky, D. B. (2003). The influence of push and pull factors at Korean national parks. Tourism Management, 24(2), 169-180. DOI:10.1016/S0261-5177(02)00059-6
King, L., McCool, S., Fredman, P. and Halpenny, E. (2012). Protected area branding strategies to increase stewardship among park constituencies. PARKS, 18(2), 55-64. DOI:10.2305/IUCN.CH.2012.PARKS-18-2.LMK.en
Laws, E. (1995). Tourism destination management: Issues, analysis, and policies. New York: Routledge.
Lee, C., Huang, H. and Yeh, H. (2010). Developing an evaluation model for destination attractiveness: Sustainable forest recreation tourism in Taiwan. Journal of Sustainable Tourism, 18(6), 811-828. DOI: 10.1080/09669581003690478
Manning, R. E. (2011). Studies in Outdoor Recreation: search and research for satisfaction. 3rd Edition. Corvallis, OR:
Mazanec, J. A. (2010). Tourism-receiving countries in connotative google space. Journal of Travel Research, 49(4), 501-512. DOI:10.1177/0047287509349269
Mills, A. S. and Westover, T. N. (1987). Structural differentiation. Annals of Tourism Research, 14(4), 486-498.
Moisey, R. N., (2002). The Economics of Tourism in National Parks and Protected Areas. In: P. F. J. Eagles and S. McCool, Tourism in national parks and protected areas: planning and management, pp. 235-253. New York: CABI Publishing.
Mulholland, G. and Eagles, P. (2002). African parks: combining fiscal and ecological sustainability. PARKS, 12(1), 42-49.
Murphy, J. and Law, R. (2008). Google scholar visibility and tourism journals. Annals of Tourism Research, 35(4), 1078-1082.
Neuvonen, M., Pouta, E., Puustinen, J. and Sievänen, T. (2010). Visits to national parks: Effects of park characteristics and spatial demand. Journal for Nature Conservation, 18(3), 224-229. http://dx.doi.org/doi:10.1016/j.jnc.2009.10.003
Prideaux, B. (2000). The role of the transport system in destination development. Tourism Management, 21(1), 53-63. http://dx.doi.org/10.1016/S0261-5177(99)00079-5
Puustinen, J., Pouta, E., Neuvonen, M. and Sievaenen, T. (2009). Visits to national parks and the provision of natural and man-made recreation and tourism resources. Journal of Ecotourism, 8(1), 18-31.
DOI: 10.1080/14724040802283210 Thapa, B. (2013). Introduction to the Special Issue – Managing
protected areas: Global perspectives, Volume 1. Journal of Park and Recreation Administration, 31(2), 1-5.
Thapa, B., Parent, G., Mupeta, P. and Child, B. (2011). Zambia Tourism Demand Assessment. Washington, DC: US Millennium Challenge Corporation and US Department of Agriculture-Foreign Agricultural Service.
Weiler, B., Moore, S. and Moyle, B. (2013). Building and sustaining support for national parks in the 21st century: why and how to save the national park experience from extinction. Journal of Park and Recreation Administration, 31(2), 115-131.
Wood, S., Guerry, A., Silver, J. and Lacayo, M. (2013). Using social media to quantify nature-based tourism and recreation. Scientific Reports, 3, 2976. DOI:10.1038/srep02976
PARKS VOL 21.2 NOVEMBER 2015
62
Viveiros de Castro, Souza & Thapa
PARKS VOL 21.2 NOVEMBER 2015
RESUMEN
La comprensión de los factores determinantes que afectan el atractivo turístico de los parques nacionales es
un instrumento de planificación estratégica para las áreas protegidas. Este estudio exploratorio evaluó la
importancia relativa de las diversas características internas y externas de los parques en función del número
de visitas en Brasil. Se recolectó información de varias fuentes: administradores de 28 parques, documentos
internos de los parques, bases de datos gubernamentales y diversos sitios web. El estudio utilizó análisis de
correlación y regresión. Los resultados demostraron que el atractivo turístico en los parques nacionales se
puede predecir a través de la reputación, las instalaciones de esparcimiento, lugares de interés en la región y
densidad de población. Los resultados revelan que los visitantes consideran tanto los atributos internos del
parque como las características externas del entorno. Los resultados tienen utilidad práctica y pueden ser
utilizados para mejorar la eficacia de las inversiones entre los parques que ya reciben visitantes, así como
para evaluar el atractivo turístico para nuevos parques. Los resultados también son útiles para las
comunidades y las pequeñas empresas ubicadas en las zonas adyacentes, habida cuenta de que la predicción
adecuada de la demanda de visitantes proporciona apoyo a las actividades turísticas.
RÉSUMÉ
Comprendre les attributs déterminants qui affectent l'attractivité touristique des parcs nationaux est
déterminant pour la planification stratégique des aires protégées. Cette étude exploratoire a évalué
l'importance de divers éléments internes et externes aux parcs au Brésil sur le nombre de visites. Des
données ont été recueillies à partir de plusieurs sources: 28 gestionnaires de parc, des documents internes
au parc, des bases de données gouvernementales et divers sites Web. L'étude est basée sur une analyse de
corrélation et de régression. Les résultats ont démontré que l'attrait touristique des parcs nationaux
dépendait de facteurs liés à la réputation, aux équipements récréatifs, aux infrastructures de la région et à la
densité de la population. Les résultats montrent que les visiteurs prennent en compte les attributs internes
et externes aux parcs. Ces résultats présentent un réel intérêt pratique susceptible non seulement
d’améliorer l'efficacité des investissements dans les parcs qui reçoivent déjà des visiteurs, mais aussi de
servir à évaluer l'attrait touristique de nouveaux parcs. De plus, les conclusions sont utiles pour les
communautés et les petites entreprises situées dans les régions adjacentes, puisque une prédiction adéquate
de la demande touristique constitue un soutien aux activités de tourisme.