165
NUCLEAR FUEL CYCLE ROYAL COMMISSION FINAL REPORT QUANTITATIVE ANALYSIS AND INITIAL BUSINESS CASE – ESTABLISHING A NUCLEAR POWER PLANT AND SYSTEMS IN SOUTH AUSTRALIA FEBRUARY 2016

NUCLEAR FUEL CYCLE ROYAL COMMISSION
FINAL REPORTQUANTITATIVE ANALYSIS AND INITIALBUSINESS CASE – ESTABLISHING A NUCLEARPOWER PLANT AND SYSTEMS IN SOUTHAUSTRALIA
FEBRUARY 2016

Project no: 2265048A-STC-REP-004 Rev1Date: February 2016
–WSP | Parsons BrinckerhoffLevel 14, 1 King William StreetAdelaide SA 5000GPO Box 398Adelaide SA 5001
Tel: +61 8 8405 4300Fax: +61 8 8405 4301www.wspgroup.comwww.pbworld.com
FINAL REPORTQUANTITATIVE ANALYSIS AND INITIALBUSINESS CASE – ESTABLISHING ANUCLEAR POWER PLANT ANDSYSTEMS IN SOUTH AUSTRALIANuclear Fuel Cycle Royal Commission
Parsons Brinckerhoff Australia Pty LtdABN 47 005 113 468
Level 14, 1 King William StreetAdelaide SA 5000GPO Box 398Adelaide SA 5001
Tel: +61 8 8405 4300Fax: +61 8 8405 4301
www.wspgroup.comwww.pbworld.com
Our ref: 2265048A-STC-REP-004 Rev1
3 February 2016
Ashok KaniyalTechnical Research OfficerNuclear Fuel Cycle Royal CommissionLevel 5, 50 Grenfell StreetADELAIDE SA 5000
Dear Ashok
Detailed Business Case – Quantitative Analysis and Initial Business Case –Establishing a Nuclear Power Plant and Systems in South Australia
We are pleased to submit the final version of our report for the nuclear power plantcomponent of the Nuclear Fuel Cycle Royal Commission’s work.
Yours sincerely
David DowningPrincipal Consultant
cc: WSP | Parsons Brinckerhoff (UK) – Paul WillsonSargent & Lundy Consulting – Kenneth GreenKPMG – Matthew Pearce

Q U A L I T Y M A N A G E M E N TISSUE/REVISION FIRST ISSUE REVISION 1 REVISION 2 REVISION 3
Date 23 December2015 2 February 2016
Prepared by
D Downing,P Willson,P McKay,C Best,V Cantone,E Hobart,M Busby,C Reynolds,M Waters,S Luyks, Sargent& Lundy, KPMG,Aquenta
D Downing
Signature
Reviewed by G Sampson G Kneebone
Signature
Authorised by David Downing David Downing
Signature
Project number 2265048A 2265048A

i
WSP | Parsons BrinckerhoffFebruary 2016
Project No 2265048A-STC-REP-004 Rev1Final ReportNuclear Fuel Cycle Royal Commission
TABLE OF CONTENTS1 INTRODUCTION .............................................................................. 11.1 Nuclear Fuel Cycle Royal Commission ............................................................. 11.2 The brief ............................................................................................................. 11.3 The process ....................................................................................................... 11.4 Disclaimers and limitations ............................................................................... 2
1.4.1 Reliance on information ....................................................................................... 21.4.2 Indemnities and warnings..................................................................................... 21.4.3 Continuing engagement ....................................................................................... 31.4.4 Assumptions ........................................................................................................ 3
2 NUCLEAR GENERATION TECHNOLOGIES ................................. 42.1 Potential technologies ....................................................................................... 42.2 Evolutionary reactor designs ............................................................................ 42.3 Advanced reactor designs ................................................................................ 52.4 Large-scale technologies .................................................................................. 5
2.4.1 Pressurised water reactors ................................................................................... 52.4.2 Boiling water reactors .......................................................................................... 62.4.3 Heavy water reactors ........................................................................................... 7
2.5 Small modular reactors ..................................................................................... 82.6 Supporting infrastructure .................................................................................. 9
3 TECHNOLOGY ASSESSMENT .................................................... 103.1 Methodology .................................................................................................... 103.2 Review of technology status ........................................................................... 10
3.2.1 Development status ........................................................................................... 103.2.2 Timescale to 2030.............................................................................................. 113.2.3 Preliminary technology availability ...................................................................... 12
3.3 Limitations for application in South Australia ................................................ 13
3.3.1 Reactor specific limitations ................................................................................. 133.3.2 General site limitations ....................................................................................... 14
3.4 Identification of best-fit technologies ............................................................. 16
4 ALTERNATIVE APPLICATIONS ................................................... 174.1 Storage in electrical generation systems ....................................................... 17
4.1.1 Need for storage ................................................................................................ 174.1.2 Supply characteristics ........................................................................................ 174.1.3 Demand characteristics ...................................................................................... 18
ii
WSP | Parsons BrinckerhoffFebruary 2016
Project No 2265048A-STC-REP-004 Rev1Final ReportNuclear Fuel Cycle Royal Commission
4.1.4 Matching supply and demand............................................................................. 184.1.5 Storage capability .............................................................................................. 184.1.6 Storage options.................................................................................................. 194.1.7 Conclusion ......................................................................................................... 20
4.2 Hydrogen coproduction from nuclear plant ................................................... 204.2.1 Introduction ........................................................................................................ 204.2.2 Hydrogen production techniques ........................................................................ 204.2.3 Review of alternative hydrogen production technologies..................................... 21
4.3 Neutron irradiation services ............................................................................ 224.3.1 Introduction ........................................................................................................ 224.3.2 Production of cobalt-60 ...................................................................................... 224.3.3 Production of molybenum-99 ............................................................................. 224.3.4 Neutron irradiation of silicon ............................................................................... 23
5 REGULATION ................................................................................ 245.1 Existing regulatory environment ..................................................................... 245.2 Legislative barriers .......................................................................................... 265.3 Planning approvals .......................................................................................... 275.4 Community and stakeholder engagement ...................................................... 28
5.4.1 Key principles of engagement to be considered.................................................. 285.4.2 Engagement during environmental assessment and approvals........................... 305.4.3 Key social aspects to be considered .................................................................. 30
6 COST AND PERFORMANCE ESTIMATES .................................. 326.1 Pre-construction capital costs ........................................................................ 326.2 Generating plant capital costs ........................................................................ 336.2.1 Pressurised water reactors ................................................................................. 336.2.2 Boiling water reactors ........................................................................................ 356.2.3 Pressurised heavy water reactors ...................................................................... 356.2.4 Small modular reactors ...................................................................................... 356.2.5 Imported vs. Australian content .......................................................................... 366.2.6 Summary ........................................................................................................... 406.2.7 Life extension refurbishment .............................................................................. 40
6.3 Infrastructure Capital costs ............................................................................. 41
6.3.1 Road infrastructure ............................................................................................ 416.3.2 Rail infrastructure ............................................................................................... 416.3.3 Water supply infrastructure ................................................................................ 426.3.4 Electricity transmission infrastructure ................................................................. 44
6.4 Decommissioning costs .................................................................................. 476.5 Fuel costs ......................................................................................................... 486.6 Spent fuel liability transfer costs .................................................................... 49

iii
WSP | Parsons BrinckerhoffFebruary 2016
Project No 2265048A-STC-REP-004 Rev1Final ReportNuclear Fuel Cycle Royal Commission
6.7 Non-fuel operating costs ................................................................................. 50
6.7.1 Imported vs. Australian content .......................................................................... 516.7.2 Insurance ........................................................................................................... 546.7.3 Transmission use of system (TUoS) & electricity charges ................................... 54
6.8 Performance and availability estimates .......................................................... 556.9 Manpower requirements .................................................................................. 56
6.9.1 Construction manpower ..................................................................................... 576.9.2 Construction Manpower capabilities ................................................................... 586.9.3 Operational manpower ....................................................................................... 59
7 COMMERCIAL ANALYSIS ............................................................ 617.1 Market analysis ................................................................................................ 61
7.1.1 Electricity demand.............................................................................................. 617.1.2 Electricity generation .......................................................................................... 637.1.3 Interconnectors .................................................................................................. 657.1.4 Opportunities for SA nuclear power generation to supply South Australian
market ............................................................................................................... 677.1.5 Opportunities for SA nuclear power generation to supply the Victorian
market ............................................................................................................... 68
7.2 Financing considerations ................................................................................ 707.2.1 Financing challenges ......................................................................................... 707.2.2 Consideration of long-term off-take contracts ..................................................... 737.2.3 International experience in financing of nuclear power ........................................ 747.2.4 Implications for SA Government ......................................................................... 75
7.3 Economic viability ........................................................................................... 767.3.1 Methodology ...................................................................................................... 767.3.2 Assumptions ...................................................................................................... 797.3.3 Outputs and conclusions .................................................................................... 83
7.4 Cash flow outputs for CGE analysis ............................................................... 897.4.1 CGE data requested .......................................................................................... 897.4.2 CGE data provided ............................................................................................ 90
7.5 Case Study: Development of nuclear power generation industry inUnited Arab Emirates....................................................................................... 92
7.5.1 Timeline for development of nuclear power generation sector in the UAE ........... 947.5.2 Why did the UAE pursue nuclear power? ........................................................... 957.5.3 Legislative and regulatory framework ................................................................. 967.5.4 Competitive procurement ................................................................................... 977.5.5 Development approval process .......................................................................... 987.5.6 Project financing ................................................................................................ 997.5.7 Project cost and time variances .......................................................................... 997.5.8 Lessons learned .............................................................................................. 100
iv
WSP | Parsons BrinckerhoffFebruary 2016
Project No 2265048A-STC-REP-004 Rev1Final ReportNuclear Fuel Cycle Royal Commission
8 REFERENCES ............................................................................. 101
L I S T O F T A B L E STable ES.1 Suitability of reactor technologies................................................................ xiiTable ES.2 Pre-construction capital costs ($m 2014) ......................................................... xiiiTable ES.3 Nuclear power plant overnight construction capital costs ($m 2014) ................. xiiiTable ES.4 Life extension refurbishment capital cost (US$m 2014) .................................... xiiiTable ES.5 Supporting infrastructure capital cost (AU$m 2014)......................................... xivTable ES.6 Range of SMR water infrastructure capital cost estimates (AU$m 2014) ......... xivTable ES.7 AC HV greenfield connection asset capital cost estimates (AU$m).................. xivTable ES.8 AC HV brownfield connection asset capital cost estimates (AU$m) ................. xivTable ES.9 Decommissioning cost estimates (US$m, 2014) ............................................. xivTable ES.10 Fuel and spent fuel liability transfer cost estimates (US$/MWh output) ............. xvTable ES.11 Estimated annual non-fuel operating cost ($m 2014)........................................ xvTable ES.12 High-low power plant overnight construction capital costs ($m 2014) .............. xviTable ES.13 High-low annual non-fuel operating cost estimates ($m 2014) ......................... xviTable ES.14 Power plant operational assumptions.............................................................. xvii
Table 3.1 Categorisation of design status ........................................................................ 12Table 3.2 Status of relevant reactor technologies ............................................................ 12Table 3.3 Indicative technology scores for the candidate technologies ............................. 16Table 5.1 Relevant South Australian legislation ............................................................... 24Table 5.2 Relevant Commonwealth legislation ................................................................ 25Table 5.3 Legislative barriers to the development of nuclear facilities .............................. 27Table 6.1 Pre-construction capital costs ($m 2014) ......................................................... 32Table 6.2 Overnight FOAK capital cost estimates for SMRs – National Nuclear
Laboratory (UK) ............................................................................................... 35Table 6.3 Percentage distribution of overnight capital costs by account ........................... 37Table 6.4 Proportions of each capital cost category attributed to imported and local
content ............................................................................................................ 38Table 6.5 Percentage distribution of capital cost by account and by jurisdiction ............... 39Table 6.6 Nuclear power plant overnight construction capital costs ($/kW 2014) .............. 40Table 6.7 Nuclear power plant overnight construction capital costs ($m 2014) ................. 40Table 6.8 Life extension refurbishment capital cost (US$m 2014) .................................... 41Table 6.9 Roads infrastructure capital cost (AU$m 2014) ................................................ 41Table 6.10 Specific cost of additional road (AU$k/km 2014) .............................................. 41Table 6.11 Rail infrastructure capital cost (AU$m 2014) .................................................... 42Table 6.12 Specific cost of additional rail (AU$k/km 2014) ................................................. 42Table 6.13 SMR water infrastructure parameters............................................................... 43Table 6.14 SMR water infrastructure base estimates (AU$m) ............................................ 43Table 6.15 Range of SMR water infrastructure estimates (AU$m) ..................................... 44Table 6.16 Range of SMR water infrastructure estimates (AU$m) ..................................... 44

v
WSP | Parsons BrinckerhoffFebruary 2016
Project No 2265048A-STC-REP-004 Rev1Final ReportNuclear Fuel Cycle Royal Commission
Table 6.17 Specific cost of additional pipeline (AU$m/km) ................................................. 44Table 6.18 AC HV greenfield connection asset cost estimates (AU$m).............................. 45Table 6.19 AC HV brownfield connection asset cost estimates (AU$m) ............................. 45Table 6.20 AC HV connection asset incremental cost estimates (AU$m) ........................... 45Table 6.21 Additional AC HV transmission cost estimates ................................................. 46Table 6.22 Additional AC HV substation upgrade cost estimates ....................................... 46Table 6.23 Additional AC HV substation upgrade cost estimates ....................................... 47Table 6.24 HVDC transmission cost estimates .................................................................. 47Table 6.25 Decommissioning cost estimates (US$m, 2014) .............................................. 48Table 6.26 Fuel cost estimates (US$/MWh output) ............................................................ 49Table 6.27 Spent fuel liability transfer cost estimates (US$/MWh output) ........................... 50Table 6.28 Bottom-up estimate of fixed O&M costs – large scale ....................................... 51Table 6.29 Bottom-up estimate of fixed O&M costs – large scale ....................................... 52Table 6.30 Categorisation of fixed O&M costs – large scale .............................................. 52Table 6.31 Categorisation of fixed O&M costs – SMR ....................................................... 53Table 6.32 Estimated annual non-fuel operating cost assumptions ($/MW 2014) ............... 53Table 6.33 Estimated annual non-fuel operating cost ($m 2014)........................................ 54Table 6.34 Estimated annual insurance cost assumptions ($/MW 2014) ............................ 54Table 6.35 Estimated annual insurance cost assumptions ($m 2014) ................................ 54Table 6.36 Estimated annual electricity charges (AU$m 2014) .......................................... 55Table 6.37 Performance assumptions ............................................................................... 55Table 6.38 Availability assumptions ................................................................................... 55Table 6.39 Large-scale plant construction manpower estimates – two-unit plant ................ 57Table 6.40 Large-scale plant construction manpower capabilities estimate ........................ 58Table 7.1 Financier checklist ........................................................................................... 71Table 7.2 Financier due diligence requirements............................................................... 72Table 7.3 NPV and IRR comparisons .............................................................................. 85Table 7.4 Cost sensitivity ................................................................................................ 88Table 7.5 WACC sensitivity ............................................................................................. 88Table 7.6 Nuclear reactors under construction by country ............................................... 92
L I S T O F F I G U R E SFigure ES.1 LCOE/LPOE comparison ............................................................................... xviiiFigure ES.2 Composition of LCOE for different reactor types ............................................. xix
Figure 3.1 Development timeline for large reactors / SMR projects ................................... 11Figure 5.1 IAP2 Public Participation Spectrum .................................................................. 29Figure 7.1 Summary of operation consumption by key component in South Australia ....... 62Figure 7.2 Summer 10% POE maximum demand forecast segments for South
Australia .......................................................................................................... 62Figure 7.3 Rooftop PV forecasts for low, medium and high consumption scenarios
in South Australia ............................................................................................ 63
vi
WSP | Parsons BrinckerhoffFebruary 2016
Project No 2265048A-STC-REP-004 Rev1Final ReportNuclear Fuel Cycle Royal Commission
Figure 7.4 Principal generation plant installed in SA at 30 June 2014 ............................... 64Figure 7.5 Principal electricity generation output in SA year ending 30 June 2014 ............ 64Figure 7.6 South Australia supply adequacy (Medium scenario) ....................................... 65Figure 7.7 SA to VIC electricity transmission interconnects ............................................... 66Figure 7.8 Total interconnector imports and exports, South Australia ................................ 66Figure 7.9 Operational consumption by key component in Victoria.................................... 68Figure 7.10 Principal generation plant installed in VIC at 30 June 2014 .............................. 69Figure 7.11 Principal generation output in VIC year ending 30 June 2014 ........................... 69Figure 7.12 Financial model schematic............................................................................... 78Figure 7.13 Timing assumptions ......................................................................................... 79Figure 7.14 Electricity price forecasts ................................................................................. 80Figure 7.15 Comparison of IS3 Large data at 11 November and 30 November 2015 .......... 81Figure 7.16 Comparison of carbon price forecasts .............................................................. 81Figure 7.17 Comparison of carbon price forecasts .............................................................. 82Figure 7.18 US$/AU$ exchange rate forecast ..................................................................... 83Figure 7.19 LCOE cost breakdown ..................................................................................... 84Figure 7.20 LCOE/LPOE comparison ................................................................................. 85Figure 7.21 Low cost LCOE/LPOE comparison .................................................................. 86Figure 7.22 High cost LCOE/LPOE Comparison ................................................................. 86Figure 7.23 Low case WACC (7%) LCOE/LPOE comparison ............................................. 87Figure 7.24 High case WACC (13%) LCOE/LPOE comparison ........................................... 87Figure 7.25 All construction capex distribution .................................................................... 91Figure 7.26 Power plant components of construction capex distribution .............................. 91Figure 7.27 Non-fuel operating cost distribution (including insurance) ................................. 91Figure 7.28 Components of operating cost distribution ....................................................... 91Figure 7.29 Nuclear reactors operational by country ........................................................... 93Figure 7.30 Status of nuclear reactors by construction start year ........................................ 94Figure 7.31 UAE nuclear timeline ....................................................................................... 95Figure 7.32 UAE nuclear regulatory structure ..................................................................... 97Figure 7.33 Barakah Nuclear Power Plant construction timeline ......................................... 99
L I S T O F A P P E N D I C E SAppendix A Technology-based modelling assumptionsAppendix B Weighted Average Cost of Capital CalculationAppendix C Cashflow outputs for CGE Modelling inputs

vii
WSP | Parsons BrinckerhoffFebruary 2016
Project No 2265048A-STC-REP-004 Rev1Final ReportNuclear Fuel Cycle Royal Commission
A B B R E V I AT I O N SABWR advanced boiling water reactor
AC alternating current
AECL Atomic Energy of Canada Limited
AEMO Australian energy market operator
AUDAU$
Australian dollar
BWR boiling water reactor
°C degrees Celsius
CANDU CANada Deuterium Uranium
CCGT combined cycle gas turbine
CFD contract for difference
CGE computable general equilibrium
DC direct current
DECC Department of Energy and Climate Change (UK Government)
EPC Engineering, Procurement, Construction [contract]
EPR evolutionary pressurised reactor
ESAA Electricity Supply Association of Australia
ESBWR economic simplified boiling water reactor
EUR€
euro
EY Ernst & Young
FID final investment decision
FOAK first-of-a-kind
FTE full-time equivalent
GBP£
United Kingdom pound sterling
GCC Gulf Cooperation Council: an intergovernmental political and economicunion comprising Bahrain, Kuwait, Oman, Qatar, Saudi Arabia, and theUnited Arab Emirates

viii
WSP | Parsons BrinckerhoffFebruary 2016
Project No 2265048A-STC-REP-004 Rev1Final ReportNuclear Fuel Cycle Royal Commission
GW gigawatt
GWd gigawatt-day
GWh gigawatt-hour
HVDC high voltage direct current
IRR internal rate of return
km kilometre
kV kilovolt
kW kilowatt
LCC load commutated converter
LCOE levelised cost of electricity
LWR light water reactor
L/s litres per second
MW megawatt
MWe megawatts electric
MWh megawatt-hour
m³/sec cubic metres per second
NEM National Electricity Market
NFCRC Nuclear Fuel Cycle Royal Commission
NOAK nth-of-a-kind
NPP nuclear power plant
NPV net present value
PHWR pressurised heavy water reactor
POE probability of exceedence
PPA Power purchase agreement
PWR pressurised water reactor
SMR small modular reactors
t tonnes
t/hr tonnes per hour

ix
WSP | Parsons BrinckerhoffFebruary 2016
Project No 2265048A-STC-REP-004 Rev1Final ReportNuclear Fuel Cycle Royal Commission
t/y tonnes per year
TRL technical readiness level
TUoS transmission use of system
UAE United Arab Emirates
UK United Kingdom
US United States
USNRC United States Nuclear Regulatory Commission
US DOE United States Department of Energy
USDUS$
United States dollar
WACC weighted average cost of capital

x
WSP | Parsons BrinckerhoffFebruary 2016
Project No 2265048A-STC-REP-004 Rev1Final ReportNuclear Fuel Cycle Royal Commission
E X E C U T I V E S U M M A RYKEY OBJECTIVES/PURPOSE
WSP | Parsons Brinckerhoff has partnered with KPMG, Sargent & Lundy and Aquenta to investigatethe third of the four main aspects of the nuclear fuel cycle, namely the use of nuclear fuels forelectricity generation in a nuclear power plant that would be planned to enter commercial operationIn South Australia around 2030. The objectives are to:
à estimate the capital and operating costs necessary for the development of commercially-basednuclear power plants in South Australia for commencement of operation by 2030;
à identify contingency and risk factors that will affect these costs;
à calculate the levelised cost of electricity (LCOE) under a range of commercial discount rates;
à identify a checklist of considerations to be satisfied in order to secure project finance.
METHODOLOGY
Having reviewed the reactor types that would be likely to be commercially available by 2030, andhaving identified those that would be most representative of the classes of technology to which theybelong, WSP | Parsons Brinckerhoff estimated the capital and operating costs by a combination oftop-down and bottom-up methodologies, depending on the availability and the reliability of existingcost data. The reactor types selected as representative of their technology class were:
Pressurised water reactor (PWR) Westinghouse AP1000
Boiling water reactor (BWR) GE Hitachi ESBWR – Economicsimplified BWR
Pressurised heavy water reactor (PHWR) – large AECL ACR-1000
Pressurised heavy water reactor – small AECL EC6
Small modular reactor (SMR) – large B&WBechtel
mPower
Small modular reactor – small NuScale Power NuScale
Nuclear power plant construction is an internationally competitive market, so Engineering,Procurement and Construction (EPC) contract costs can vary according to the market’s appetite forthe available technologies or manufacturers’ products. The estimates developed for the nuclearpower plants themselves therefore are based on a top-down approach including verifiable reportingof recent market experience for established technologies, and of forecast costs for maturingtechnologies. Plants under construction in the US (Vogtle and VC Summer), with mandatory publicreporting requirements, serve as ideal reference plants against which to benchmark cost estimatesof large-scale plants. There are no reference plants based on small modular reactor (SMR)technologies for which benchmark cost data can be verified. However, there have been severalinvestigations performed in other jurisdictions which can be used to benchmark likely SMRconstruction costs.
Estimates of the cost of supporting infrastructure, such as roads, transmission connections, etc., arebased on a bottom-up approach in which high-level scopes of supply were developed and costedaccording to published unit prices and building block costs. Supporting infrastructure estimateswere based on the following assumptions made for the siting of a nuclear power plant in South

xi
WSP | Parsons BrinckerhoffFebruary 2016
Project No 2265048A-STC-REP-004 Rev1Final ReportNuclear Fuel Cycle Royal Commission
Australia, namely that a generic brownfield site is assumed to be adjacent or very close to existinginfrastructure, and a generic greenfield site is assumed to be located approximately 50 km fromexisting infrastructure.
Historical costs of the provision of nuclear fuel and forecast costs for the disposal of spent nuclearfuel enabled life-cycle fuel-related costs to be estimated from unit rates. Non-fuel operating costswere estimated from data reported to regulatory agencies by long-term experienced operators ofnuclear generating facilities.
KEY FINDINGS/ CONCLUSIONS
CANDIDATE REACTOR TECHNOLOGIES
Nuclear power has been used for power generation for over 60 years during which time manynuclear reactor concepts have developed and been constructed. Although development continueswith new concepts and possibilities, there are limited nuclear technologies which havedemonstrated safe, reliable and economic operation. The leading technology internationally is thepressurised water reactor (PWR), representing over 275 of the world fleet of 440 operationalreactors. The next most widely adopted technology is the boiling water reactor (BWR) representinga further 80 units. Of the remaining units the pressurised heavy water reactor (PHWR) is the mostsignificant with 32 units.
This study has reviewed the available solutions in each of these categories which fit the potentialapplication in South Australia at a capacity in the region of 1,000 MW, in the event ranging fromabout 700 MW to 1,600 MW. The history and current commercial availability of these technologieshas been considered along with the potential for up-coming simplified and smaller scale versions ofthe same technologies – small modular reactors – which may better fit the limitations of theelectrical network in South Australia.
TECHNICAL ASSESSMENT CRITERIA
Three criteria are identified for the technical assessment: availability of the technology for possibleapplication on a proven basis in 2030, minimum limitations for connection to the electricity networkand minimum constraints on siting of a reactor in South Australia.
Despite the three dominant nuclear technologies having a long history, the commercial availabilityof the current designs is important. Proven pressurised water reactor designs at a scale of1,100-1,400 MW and boiling water reactors at 1,350-1,600 MW are most suitable for the proposedrequirement. The more extensive regulatory and construction cycle required for the currentpressurised heavy water reactor design means that it is considered likely to be available on aproven basis only some years after 2030. The new SMR designs – all small scale PWRs – arecurrently believed to be close to submission for regulatory approval which would allow them to beavailable on a proven basis by 2030 if the vendors can maintain their development schedules.
The scale of the larger reactors of any technology will require substantial uprating of the electricitytransmission network and demand changes in operation of the electricity system to maintainreliability of supply. However, growth in renewable generation is likely to necessitate major networkdevelopment by 2030 which should overcome many such limitations. SMR technologies arecomparable to or smaller than existing generating units in South Australia and present no suchissues for their application.
Siting constraints including the requirement for access to cooling water for the larger reactorsrequire their siting on, or close to, an ocean coast. Such sites could be a suitable greenfield locationor potentially on a brownfield site, subject to consideration of all environmental requirements.Particular requirements include access to road and rail links for construction and operational traffic
xii
WSP | Parsons BrinckerhoffFebruary 2016
Project No 2265048A-STC-REP-004 Rev1Final ReportNuclear Fuel Cycle Royal Commission
with adequate fresh water supplies for process and service use. Access to large volumes of coolingwater is preferred, although the use of cooling towers would be feasible subject to a larger supply offresh water to maintain conditions in the cooling water circulation. Siting constraints for SMRs areless restrictive, allowing them to be applied at a remote inland site with limited water supply,although their capacity would be reduced.
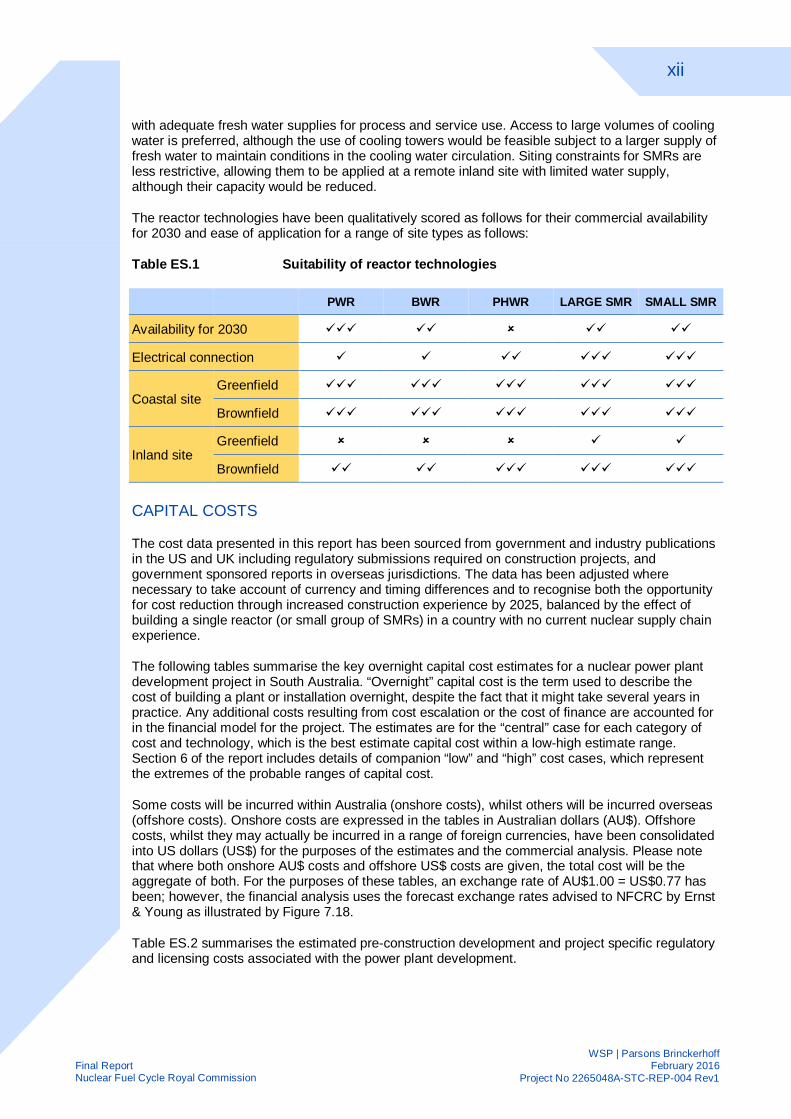
The reactor technologies have been qualitatively scored as follows for their commercial availabilityfor 2030 and ease of application for a range of site types as follows:
Table ES.1 Suitability of reactor technologies
PWR BWR PHWR LARGE SMR SMALL SMR
Availability for 2030 üüü üü û üü üü
Electrical connection ü ü üü üüü üüü
Coastal siteGreenfield üüü üüü üüü üüü üüü
Brownfield üüü üüü üüü üüü üüü
Inland siteGreenfield û û û ü ü
Brownfield üü üü üüü üüü üüü
CAPITAL COSTS
The cost data presented in this report has been sourced from government and industry publicationsin the US and UK including regulatory submissions required on construction projects, andgovernment sponsored reports in overseas jurisdictions. The data has been adjusted wherenecessary to take account of currency and timing differences and to recognise both the opportunityfor cost reduction through increased construction experience by 2025, balanced by the effect ofbuilding a single reactor (or small group of SMRs) in a country with no current nuclear supply chainexperience.
The following tables summarise the key overnight capital cost estimates for a nuclear power plantdevelopment project in South Australia. “Overnight” capital cost is the term used to describe thecost of building a plant or installation overnight, despite the fact that it might take several years inpractice. Any additional costs resulting from cost escalation or the cost of finance are accounted forin the financial model for the project. The estimates are for the “central” case for each category ofcost and technology, which is the best estimate capital cost within a low-high estimate range.Section 6 of the report includes details of companion “low” and “high” cost cases, which representthe extremes of the probable ranges of capital cost.
Some costs will be incurred within Australia (onshore costs), whilst others will be incurred overseas(offshore costs). Onshore costs are expressed in the tables in Australian dollars (AU$). Offshorecosts, whilst they may actually be incurred in a range of foreign currencies, have been consolidatedinto US dollars (US$) for the purposes of the estimates and the commercial analysis. Please notethat where both onshore AU$ costs and offshore US$ costs are given, the total cost will be theaggregate of both. For the purposes of these tables, an exchange rate of AU$1.00 = US$0.77 hasbeen; however, the financial analysis uses the forecast exchange rates advised to NFCRC by Ernst& Young as illustrated by Figure 7.18.
Table ES.2 summarises the estimated pre-construction development and project specific regulatoryand licensing costs associated with the power plant development.

xiii
WSP | Parsons BrinckerhoffFebruary 2016
Project No 2265048A-STC-REP-004 Rev1Final ReportNuclear Fuel Cycle Royal Commission
Table ES.2 Pre-construction capital costs ($m 2014)
Project Development Regulatory/Licensing
Pre-construction costs
AU$m 311 44
US$m 63 16
Total AU$mequivalent 393 65
Table ES.3 summarises the overnight capital cost estimates by currency for the representativepower plants of the different technology classes being studied.
Table ES.3 Nuclear power plant overnight construction capital costs ($m 2014)
PWR BWR PHWRLarge
PHWRSmall
SMRLarge
SMRSmall
Net capacity MW 1,125 1,575 1,200 740 360 285
NPPconstruction
costs
AU$m 3,814 5,339 4,500 2,775 1,102 960
US$m 3,476 4,867 4,092 2,523 1,310 1,143
TotalAU$m
equivalent8,328 11,660 9,814 6,052 2,803 2,444
Given the availability of good quality data from regulatory reporting submissions on recent PWRconstruction projects, we are confident that the PWR cost estimate (based on AP1000 rectortechnology) in Table ES.3 is fundamentally sound. Long-term experience has shown that therelative costs of PWR and BWR projects are reasonably consistent, so we are also quite confidentthat the BWR estimate is reasonably sound, though we are concerned that the capacity of the BWRtechnology considered (GE-Hitachi ABWR) is likely to be too large for the South Australian system.We are less confident of the PHWR estimates owing to the lack of recent projects with publishedout-turn costs. However, given that we believe that the availability of Generation III/III+ PWHRtechnology by 2030 will be very low, the low level of confidence is not material to our overallfindings.
There are no SMR projects yet implemented to serve as cost benchmarks. However, there is aconsiderable amount of SMR manufacturers’ literature available, and independent studies in otherjurisdictions that have looked at the SMR market in considerable detail. Therefore, given the degreeof independent analysis by others, we are quite confident that both the SMR cost estimates arebasically sound.
Table ES.4 summarises the estimated capital cost of the life extension refurbishment associatedwith PHWR CANDU-type reactors after approximately 30 years’ service.
Table ES.4 Life extension refurbishment capital cost (US$m 2014)
PHWR Large PHWR Small
PHWR life extensioncost
US$m 2,000 1,450
Table ES.5 summarises the estimated capital cost of road, rail and marine supporting infrastructureassociated with the power plants located in generic brownfield and greenfield locations.

xiv
WSP | Parsons BrinckerhoffFebruary 2016
Project No 2265048A-STC-REP-004 Rev1Final ReportNuclear Fuel Cycle Royal Commission
Table ES.5 Supporting infrastructure capital cost (AU$m 2014)
Brownfield Greenfield
Supporting infrastructurecost
AU$m 9.184 193.180
The cost of water supply infrastructure for the coastal large-scale plants has been included in theoverall capital cost of the plants. Water supply infrastructure costs for the SMR-based plants locatedaway from the coast are shown in Table ES.6.
Table ES.6 Range of SMR water infrastructure capital cost estimates (AU$m 2014)
Large SMR Small SMR
Greenfield Brownfield Greenfield Brownfield
SMR water supplyinfrastructure cost
AU$m 145.7 10.0 144.3 9.5
Table ES.7 and Table ES.8 summarise the estimated capital cost of high voltage AC transmissioninfrastructure to connect the power plants to existing electricity transmission networks in genericgreenfield and brownfield locations respectively.
Table ES.7 AC HV greenfield connection asset capital cost estimates (AU$m)
PWR BWR PHWRLarge
PHWRSmall
SMRLarge
SMRSmall
Transmission Voltage, kV 500 500 500 500 275 275
Greenfield transmissionconnection assets cost AU$m 344 344 344 265 92 92
Table ES.8 AC HV brownfield connection asset capital cost estimates (AU$m)
PWR BWR PHWRLarge
PHWRSmall
SMRLarge
SMRSmall
Transmission Voltage, kV 500 500 500 500 275 275
Brownfield transmissionconnection assets cost AU$m 167 183 167 112 22 22
DECOMMISSIONING COSTS
Decommissioning of the power plant and remediation of the site will be funded by annualcontributions to a decommissioning reserve that, with investment in low-risk instruments, willaccumulate to provide future funds upon completion of the operating life of the plant equivalent tothe escalated value of the FY2014 estimates in Table ES.9.
Table ES.9 Decommissioning cost estimates (US$m, 2014)
PWR BWR PHWRLarge
PHWRSmall
SMRLarge
SMRSmall
Decommissioning cost US$m 500 575 500 250

xv
WSP | Parsons BrinckerhoffFebruary 2016
Project No 2265048A-STC-REP-004 Rev1Final ReportNuclear Fuel Cycle Royal Commission
OPERATING COSTS
The following tables summarise the “central” case key operating cost estimate components for anuclear power plant development project. Details of the companion “low” and “high” cost cases aregiven in section 6, as are comparatively minor costs such as insurance and connection charges. Aswith the capital cost estimate, some costs will have both onshore and offshore components,denoted in AU$ and US$ respectively. In such cases, the total cost is again the aggregate of both.
Table ES.10 summarises the estimated cost of fuel, and the estimated cost of transferring theliability for long-term storage of spent fuel to the long-term storage facility.
Table ES.10 Fuel and spent fuel liability transfer cost estimates (US$/MWh output)
PWR BWR PHWRLarge
PHWRSmall
SMRLarge
SMRSmall
Fuel cost US$/MWh 7.60 9.10
Spent fuel liabilitytransfer cost US$m/MWh 3.75 27.00 4.50
Table ES.11 summarises the estimated annual non-fuel operating cost excluding insurance.
Table ES.11 Estimated annual non-fuel operating cost ($m 2014)
PWR BWR PHWRLarge
PHWRSmall
SMRLarge
SMRSmall
Net capacity MW 1,125 1,575 1,200 740 360 285
Non-fuel operating cost
AU$m 108.1 151.4 115.3 71.1 37.9 30.0
US$m 63.0 88.2 67.2 41.4 17.6 13.9
TotalAU$m
equivalent189.9 265.9 202.6 124.9 60.8 48.1
CENTRAL ESTIMATE RISKS AND LIMITATIONS
In addition to the “central” case cost estimates summarised here, section 6 of this report considersthe likely range of cost estimates that might be expected. There are several main factors thatintroduce risks and uncertainties to the estimates, a few of which key factors are descried here.
Nuclear power plant construction projects are subject to market forces. An EPC contract value maybe influenced by several market factors at the time a contract is tendered and placed, such as:
à Contractors’ workloads – contractors with low forward workloads may offer better deals thanthose with full order books.
à Market penetration – manufacturers offering particular generation technologies may offer betterdeals to increase their market penetration – this may be particularly prevalent in the SMRmarket as more technologies come to market.
à Jurisdictional penetration – manufacturers seeking to enter new country markets may offerbetter deals to be the first to market.

xvi
WSP | Parsons BrinckerhoffFebruary 2016
Project No 2265048A-STC-REP-004 Rev1Final ReportNuclear Fuel Cycle Royal Commission
Whilst there may be advantages to owners from each of these possibilities, there may also bemarket risks arising from, for example, construction contractors or manufacturers of “popular”nuclear generation technologies becoming more expensive. Ultimately, it will only be possible tojudge the optimum technological and commercial solution following a comprehensive tenderingprocess.
The total equivalent Australian dollar high and low case capital cost estimates shown in TableES.12 also make allowance for the possibility of construction schedule and cost under- or over-runs. Recent project experience has shown that there is a distinct risk of construction scheduleslippage. Whilst under a fixed-price EPC contract, there should be minimal direct impact to the EPCconstruction cost, there will be indirect impacts that would have to be borne by the project owner.Furthermore, it is increasingly likely that EPC contractors will attempt to increase the constructionrisk allowances into their future proposals, although this would be tempered by a downwardpressure resulting from a need to remain competitive in the nuclear construction market. The high-case estimates include some provision for such behaviour.
Table ES.12 High-low power plant overnight construction capital costs ($m 2014)
PWR BWR PHWRLarge
PHWRSmall
SMRLarge
SMRSmall
Low TotalAU$m 7,738 10,831 8,253 5,089 2,385 2,073
High TotalAU$m 9,201 12,881 11,376 7,015 3,368 2,922
Operational costs will also be subject to market forces. The cost of fuel, for example, will depend onthe future demand for uranium and fabricated nuclear fuel and the capacity of the world’s uraniummines and fuel processing facilities to meet it.
A particular issue for the establishment of a nuclear power plant in South Australia will be the lack ofawareness, expertise and experience in nuclear generating facilities among the existing labourforce. In the short-term and in key areas of expertise, the shortfall might be met by the recruitmentof appropriately qualified staff from overseas, but given that there is expected to be a world-wideincrease in demand developing for nuclear-qualified expertise, the cost of such expertise might behigh. The long-term sustainable solution to South Australia’s skills gap will be to transfer nuclearknowledge and expertise under a planned programme of education and retraining to upskill theexisting workforce.
The total equivalent Australian dollar high-low operational cost estimates in Table ES.13 includeprovision for various operational and staffing risks.
Table ES.13 High-low annual non-fuel operating cost estimates ($m 2014)
PWR BWR PHWRLarge
PHWRSmall
SMRLarge
SMRSmall
Net capacity MW 1,125 1,575 1,200 740 360 285
LowTotal
AU$mequivalent
151.9 212.7 162.1 99.9 48.6 38.4
HighTotal
AU$mequivalent
227.9 319.0 243.1 149.8 72.9 57.8

xvii
WSP | Parsons BrinckerhoffFebruary 2016
Project No 2265048A-STC-REP-004 Rev1Final ReportNuclear Fuel Cycle Royal Commission
OPERATIONAL ASSUMPTIONS
Table ES.14 summarises the central case power plant output and availability estimates. Higher andlower range average capacity factors incorporating (respectively) longer and shorter refuellingoutages have also been estimated.
Table ES.14 Power plant operational assumptions
Parameter PWR BWR PHWRLarge
PHWRSmall
SMRLarge
SMRSmall
Unit Net PowerOutput
MW 1,125 1,575 1,200 740 180 47.5
No of Units 1 1 1 1 2 6
Plant Net PowerOutput
MW 1,125 1,575 1,200 740 360 285
Non-refuellingbase yearavailability
% 97 97 96 96 97 97
Refuelling cycle 30 daysevery 18months
30 daysevery 18months
Continuouson-load
Continuouson-load
30 daysevery four
years
30 daysevery two
years
Refit outage n/a n/a Outage inyear 29 &
30
Outage inyear 29 &
30
n/a n/a
Overallavailability profile:Year 1
Year 2
Year 3
Year 4
Year 5
Year 29 and 30(PHWR)
Year 31 (PHWR)
%
%
%
%
%
%
97.00%
89.03%
89.03%
Y1-3repeats
…
97.00%
89.03%
89.03%
Y1-3repeats
…
96.00%
96.00%
85.48%
Y1-3repeats
…
0%
Y1-3repeats
96.00%
96.00%
85.48%
Y1-3repeats
…
0%
Y1-3repeats
96.99%
96.99%
93.01%
93.01%
Y1-4repeats
…
93%
Annually
INPUTS/ASSUMPTIONS
In addition to the cost estimates and siting assumptions described above, WSP | ParsonsBrinckerhoff adopted macro-economic assumptions, in common with other technology study teams,as required by the Royal Commission, which were based on advice from the Royal Commissionand its other advisers.
A general inflation rate of 2.5% was used, with operating and maintenance costs escalating at anadditional 1.05% in real terms. Ernst & Young advised forecast US$/AU$ foreign exchange ratesuntil 2050 (see Figure 7.18), in addition to forecast wholesale electricity prices for four differentclimate action scenarios over the same period.

xviii
WSP | Parsons BrinckerhoffFebruary 2016
Project No 2265048A-STC-REP-004 Rev1Final ReportNuclear Fuel Cycle Royal Commission
WSP | Parsons Brinckerhoff analysed a likely financing structure for a nuclear generating businessin South Australia, and estimated the real pre-tax weighted average cost of capital to be about10.47%, which was within the range of 10-11% that had been expected based on a review of earlierstudies. For the purposes of the financial analysis, a real pre-tax WACC of 10% was used as aproxy for the discount rate in net present value (NPV) calculations.
LEVELISED COST OF ELECTRICITY
Figure ES.1 illustrates for the central case assumptions of each technology type being studied, thelevelised cost of electricity (LCOE) assuming a weighted average cost of capital (on a real, pre-taxbasis) of 10%. Figure ES.1 also illustrates the levelised price of electricity (LPOE) for the wholesaleelectricity price projections forecasted by Ernst & Young as of 11 November 2015. The figure clearlyillustrates the commercial gap that exists for all reactor types under central case cost assumptions.
Figure ES.1 LCOE/LPOE comparison
KEY SENSITIVITIES
The composition of LCOE in Figure ES.2 shows that all nuclear power technologies arecharacterised by high fixed costs and relatively low variable costs. Capital cost recovery, and fixedoperation and maintenance costs account for about 90% of LCOE of nuclear power plants. Capitalcost of plant construction is by far the largest component of the LCOE. The cost of fuel supply tonuclear power plants is a relatively minor component of their LCOE. The PHWR technologies haveproportionately higher costs as a result of estimated spent fuel disposal costs which areapproximately six times greater than other reactor types.

xix
WSP | Parsons BrinckerhoffFebruary 2016
Project No 2265048A-STC-REP-004 Rev1Final ReportNuclear Fuel Cycle Royal Commission
Figure ES.2 Composition of LCOE for different reactor types
Sensitivity analysis shows that LCOE of nuclear power plants is most sensitive to capital cost andWACC assumptions. Under all central case assumptions, the internal rate of return for eachtechnology is less than the base-case WACC assumption, indicating a commercial gap or deficit asopposed to a surplus. However, a small commercial surplus can be calculated if cost estimates atthe extreme low end of the ranges is assumed in combination with plant performance (i.e. capacityfactors) at the high end of the ranges.
Similarly, a commercial surplus can be realised if the project can be financed more cheaply. Ananalysis using a real pre-tax WACC of 7%, which is below the commercial rate of return normallyexpected by project developers, returned a surplus in the analysis for all the large-scalerepresentative technologies analysed.
ECONOMIC ANALYSIS CONCLUSIONS
Analysis of the economic viability measures for the scenarios under consideration suggests thatnuclear power plants in South Australia are not likely to be economically viable, unless:
à capital and operating costs of nuclear power plants are reduced to or below the lowest extremeof the plausible range of costs considered by this study; and/or
à the cost of capital (debt and equity) is reduced to a level that is unlikely to be commerciallyavailable from the open market; and
à electricity prices increase dramatically as a result of strong climate action, such as 100%reduction in emissions relative to 2000 levels by 2040 to 2050.
FINANCING CHALLENGES
Analysis of recent international experience in the development and financing of nuclear powerplants demonstrates that:
à developers require long-term revenue certainty to commit to investment and be able to raiseproject financing and often require Government guarantees of project debt; and
à Governments continue to play a key role in facilitating the development of nuclear power (evenin countries that have a long history in the nuclear power generation industry) through a wide

xx
WSP | Parsons BrinckerhoffFebruary 2016
Project No 2265048A-STC-REP-004 Rev1Final ReportNuclear Fuel Cycle Royal Commission
range of mechanisms, such as long-term Power Purchase Agreements (PPAs), Contracts forDifference (CFDs) guaranteeing a strike price, loan guarantees, and export credit.
Our hypothesis for the financing of nuclear power plants in South Australia is that:
à nuclear power plants would require long-term revenue certainty in order to attract interest ofprivate sector equity investors and debt financiers; and
à the SA Government would need to provide significant support through revenue underwriting,loan guarantees, and/or in other forms in order to attract private sector developers andfinanciers of nuclear power generation.
There are very few precedents in the Australian energy market for PPAs or electricity hedgingcontracts with the very long contract durations that would be required to underpin financing of anuclear power plant, and most of these precedents involved a State Government as a contractcounterparty. If private sector players in the National Electricity Market are not willing to enter intoelectricity hedging contracts with nuclear power stations for a sufficiently long term to underpinproject financing, the SA Government would have to provide revenue certainty to a nuclear powerplant developer through a CFD or another revenue support mechanism.
Depending on the perception of risks associated with nuclear power by project financiers, the SAGovernment may also be required to provide loan guarantees in addition to revenue support. Thishas been the experience in recent nuclear power plants developments – the Vogtle plant in the USAand the Hinkley Point C plant in the UK.
1
WSP | Parsons BrinckerhoffFebruary 2016
Project No 2265048A-STC-REP-004 Rev1Final ReportNuclear Fuel Cycle Royal Commission
1 INTRODUCTION1.1 NUCLEAR FUEL CYCLE ROYAL COMMISSION
The Nuclear Fuel Cycle Royal Commission (NFCRC) was established by the Government ofSouth Australia to investigate South Australia’s participation in the four main aspects of thenuclear fuel cycle:
à exploration and extraction of mineralsà processing of minerals and manufacture of materials containing radioactive substancesà use of nuclear fuels for electricity generation; andà the storage and disposal of radioactive and nuclear waste materials.
Established in March 2015, the Royal Commission has set a strict timetable of work that willenable it to submit its report to the government by 6 May 2016.
1.2 THE BRIEF
WSP | Parsons Brinckerhoff in partnership with KPMG, Sargent & Lundy and Aquenta wasappointed by the NFCRC to investigate the third of these aspects, namely the use of nuclear fuelsfor electricity generation. WSP | Parsons Brinckerhoff is required to quantify the whole-of-life costsentailed in the development, construction, operation and decommissioning of three principal typesof nuclear power plant and their associated systems and infrastructure, taking account of costdatabases and indices appropriate to South Australia.
The assignment is to be conducted in stages, with deliverables to be provided to the NFCRC ateach stage. This report is the final deliverable in response to the scope of work.
This report presents the detailed business case and cost assumptions for a range of nucleargeneration technologies that might be possibilities for the establishment of a nuclear power plantin South Australia.
The brief required the consideration of commercially available Generation III and Generation III+reactor technologies, and how they might be implemented within the South Australian context,assuming a date for the commencement of commercial operation in 2030.
1.3 THE PROCESS
The first stage in the development of any business case is to define what drives the need that theselected solution is designed to satisfy. In this case, the need is driven by the RoyalCommission’s remit to investigate the possibilities for expanding the state’s involvement in allaspects of the nuclear fuel cycle, including the generation of electrical energy from nuclear fuel.Whilst other studies are looking into the possible expansion of mining and exploration, mineralprocessing, and waste storage and disposal; this study is considering the use of products from theexpanded uranium mining and processing industries to generate electricity for use within both thelocal South Australian market and for export to other regions of the National Electricity Market.
In identifying the parameters for the study, NFCRC proposed that several technologies might beappropriate for consideration, broadly separated into large-scale technologies, typically havingreactor outputs of greater than 1000 MW, and small-scale technologies, which are commonlyreferred to as small modular reactors, with reactor outputs of less than 300 MW. WSP | ParsonsBrinckerhoff and Sargent & Lundy nuclear power plant specialists have joined forces to pool theirknowledge and experience of nuclear power plant projects and developments in order to identify

2
WSP | Parsons BrinckerhoffFebruary 2016
Project No 2265048A-STC-REP-004 Rev1Final ReportNuclear Fuel Cycle Royal Commission
and assess the available nuclear power plant technologies that meet the need. The range ofavailable technologies were reduced to a short-list of six categories of plants that either alreadyare, or are expected to be, mature commercially available technologies by 2030.
Establishment of a nuclear power plant necessitates consideration of other impacts including theprovision of new or augmented infrastructure to support the nuclear power plant. The NFCRCproposed that such infrastructure be identified for generic brownfield and greenfield locations,where a brownfield location is defined as one in which there is established connectivity tosupporting infrastructure, and a greenfield site is defined as one in which existing infrastructure islocated 50 km from the site. Together with the nuclear power plant specialists, WSP | ParsonsBrinckerhoff specialists have identified the functional requirements for the supportinginfrastructure, and have identified the new and augmented infrastructure required to support eachpower plant option.
The nuclear power plant specialists used their expertise and contacts to identify sources oftechnical and commercial data that have been used to populate an assumptions book, which isused by KPMG in the modelling of whole-of-life costs for each nuclear power plant option. Theinfrastructure specialists together with Aquenta have identified the infrastructure costs for eachpower plant option. KPMG has combined the technical and commercial assumptions with financialand agreed macro-economic assumptions to develop whole-of-life cost and levelised cost ofenergy outputs for the nuclear power plant options.
1.4 DISCLAIMERS AND LIMITATIONS
1.4.1 RELIANCE ON INFORMATION
To prepare this report we have relied upon macroeconomic assumptions and wholesale pricingforecasts provided in November 2015 by Ernst and Young as NFCRC’s computational generalequilibrium modelling adviser, as well as publically available information and data and whereappropriate WSP | Parsons Brinckerhoff’s, Sargent & Lundy’s, KPMG’s, and Aquenta’s internalsources that we believe to be reliable and accurate. We have no reason to believe that anymaterial facts (that a reasonable person would expect to be disclosed) have been withheld fromus, and we have taken no steps to audit or verify the accuracy, completeness or fairness of thatdata provided.
Our procedures and enquires do not include verification work, nor constitute either an audit orreview.
The sources of information that we have relied upon in providing this report have been outlinedthroughout the body of the document.
1.4.2 INDEMNITIES AND WARNINGS
Our opinions are based upon the basis of information made available to us, and the conditionsand circumstances in place at the time of writing, both of which can change on short noticewithout warning. Accordingly, if the basis of the information provided to us, or the conditions ofcircumstances in place have changed subsequent to the release of our report, our conclusionsmay no longer be relevant. In providing this report, WSP | Parsons Brinckerhoff has no obligationto update this document for such changes, subsequent to its date.
Our report has been prepared for the express purposes outline above, and for the benefit of anduse by the Nuclear Fuel Cycle Royal Commission. No reference to, statement of reliance upon,copy, reprint or image our report can be released to any party other than the Nuclear Fuel CycleRoyal Commission without the prior written consent of WSP | Parsons Brinckerhoff as to the formand content of that release.
3
WSP | Parsons BrinckerhoffFebruary 2016
Project No 2265048A-STC-REP-004 Rev1Final ReportNuclear Fuel Cycle Royal Commission
In relying on our report, the document should always be considered in its entirety.
1.4.3 CONTINUING ENGAGEMENT
This reports on our findings in relation to a business case for the development of a nuclear powerplant in South Australia. As such it is subject to further work before finalisation of the report,including final internal review and approval.
1.4.4 ASSUMPTIONS
In completing the brief, we note that we have relied on the following assumptions:
à Our brief did not extend to undertaking site specific analysis; on the contrary, it was requiredto consider only generic locations for the siting of the candidate nuclear power planttechnologies, and we have outlined appropriate assumptions within the report accordingly.
à We have assumed that each of the power plant options will be operated as a base-loadpower plant, and have detailed corresponding assumptions of power plantavailability/average capacity factor accordingly. The levelised costs of energy resulting fromthe modelling are therefore dependent on this assumption. We understand that otheradvisers to NFCRC are examining the role that a nuclear power plant might play in theNational Electricity Market of the future, including part-load operation and load-followingcapabilities. Such changes to the plant operating profiles would result in changes to thelevelised costs of energy resulting from the modelling.
à We have calculated power plant revenues based on wholesale electricity price forecasts,which have been advised by NFCRC based on market modelling and forecasting performedby Ernst and Young as of 15 November 2015. We note that any later revisions to thewholesale price assumptions may have a material effect on our opinions regarding thecommercial outcomes of the study.
à In order to provide consistency with the other studies being performed for NFCRC, we havebeen advised macroeconomic assumptions by NFCRC, including assumptions for forecastinflation of costs. We understand that this and other macroeconomic assumptions, such asforeign exchange rates have been provided to NFCRC by Ernst & Young, and may yet besubject to further revision.

4
WSP | Parsons BrinckerhoffFebruary 2016
Project No 2265048A-STC-REP-004 Rev1Final ReportNuclear Fuel Cycle Royal Commission
2 NUCLEAR GENERATIONTECHNOLOGIES
2.1 POTENTIAL TECHNOLOGIES
Identification of the nuclear plant options that will be available for proposed commercial operationin the 2030 time frame requires some speculation. There are potentially attractive optionsavailable today which may not continue to be offered in the international marketplace in a fewyears and there are promising new alternatives that are not yet commercially available and may ormay not be viable in the future depending on economic and technical developments.
Nuclear reactors are popularly characterised by their “Generation” (i.e. Generation II, GenerationIII or III+, Generation IV). There is a grey area associated with defining the characteristics thatplace a reactor in one generation or another, but for the purpose of this study all the reactors ofinterest are Generation III or III+. Generation II reactors include most of the currently operatingplants in the world but are no longer offered by the reactor vendors as a commercial product fornew plants. Generation III and III+ designs include both “evolutionary” designs, some of which dohave operating examples as well as ones under construction and “advanced” designs includingenhanced safety features. None of the “advanced” designs are operating but some are underconstruction.
In addition to the larger Generation III and III+ reactors, there are also a set of smaller advanceddesigns termed as Small Modular Reactors (SMR) which are passive designs on a smaller scale,and which allow offsite assembly line type construction.
Generation IV designs, which often have innovative features to deal with nuclear waste or to usealternative fuels, are at an earlier stage of development and are not judged to be likely to be aproven alternative within the time frame under study. However, by 2030, Generation IV designsmay be sufficiently developed to offer new opportunities for the fuel cycle. These might particularlyaffect the disposal costs of spent fuel if spent fuel becomes a resource rather than a waste.
2.2 EVOLUTIONARY REACTOR DESIGNS
Generation III evolutionary designs are enhanced versions of the Generation II operating reactors.Although these plants still require active safety systems (systems which utilise pumps and otherpowered components to remove the core heat and hence avoid excessive fuel temperatures),they have modified the designs to eliminate some of the more probable failure modes. As a result,the risk of radioactive release after an accident has been reduced by one or two orders ofmagnitude from the already low risk of the previous generation of operating units. There have alsobeen design changes included to reduce the construction and operating costs. One of thesechanges is a general increase in the size of the units to take advantage of economies of scalenow practical to implement.
There are a number of evolutionary designs available, but five designs are mature and active inthe market. These are the General Electric/Hitachi ABWR, the Korean APR-1400, the AREVAEPR, the CANDU EC6, and the ATMEA 1100 reactor. The first three are in operation or underconstruction whilst the last two have mature designs with some potential for near term projects. Inaddition some Russian and Chinese designs fall into this category, but the available informationon the technical content, pricing and marketing of these units is limited. As a result they will not beaddressed here except to note their potential existence.
In addition to the domestically developed Russian and Chinese designs, other evolutionarydesigns exist but do not appear to be strong market contenders at the present time. Mitsubishi
5
WSP | Parsons BrinckerhoffFebruary 2016
Project No 2265048A-STC-REP-004 Rev1Final ReportNuclear Fuel Cycle Royal Commission
has developed a 1,700 MWe PWR which gained some interest in Japan and the US for a periodof time, but there appear to be no active projects using this design at present. In spite of thesignificant success of Westinghouse PWR plants among operating units, Westinghouse haschosen to focus on passive Advanced Reactor and Small Modular Reactor designs.Westinghouse offerings are addressed below in the Advanced Reactor discussion.
The Enhanced CANDU 6 (EC6) pressurised heavy water reactor is an evolutionary reactor designbut differs from the others because it is smaller (740 MWe). This design has not yet been built orcontracted for but some potential exists for two units to be added to an existing site in Romania.The available information indicates it would have cost characteristics similar to the CANDU ACR-1000 which is considered an Advanced Reactor while the EC6 would be of interest primarilybecause of the smaller capacity of the unit.
The critical question to be answered about the active safety evolutionary designs is whether theywill continue to be attractive alternatives if the passive safety advanced designs prove to be theirequal commercially. Currently the evolutionary designs appear to offer a small cost advantageresulting from longer experience with these plant designs and their larger size which allowseconomy of scale. However, we believe that the reduced complexity of the passive designs willreduce or eliminate the cost differential in the future such that costs of evolutionary and advancedreactors will converge for plants scheduled to enter operation around 2030.
2.3 ADVANCED REACTOR DESIGNS
Generation III+ advanced reactors are functionally similar to Generation II and evolutionaryGeneration III reactors, but have more passive safety systems. This means that operation ofactive components that require electric power is not required for at least several days after theoccurrence of an event requiring or causing a rapid reactor shutdown. On previous reactordesigns, the failure of offsite power and onsite emergency power supplies has always been amajor contributor to accident risk. Removal of this potential failure provides an additional reductionin risk of significant release of radioactivity. These designs incorporate features that allow heat tobe removed by natural convection and heat transfer mechanisms without requiring activecomponents to operate. The extent to which the safety systems are passive, and the delay timebefore active functions are required eventually to come into operation vary between the designs.
Reactor designs in this category include the Westinghouse AP1000 (1,100 MWe PWR), theGeneral Electric/Hitachi ESBWR (1,500 MWe BWR) and the CANDU ACR1000 (1,200 MWePressurised Heavy Water Reactor PHWR). Domestically developed Russian and Chinesedesigns may also exist in this category, but again, little is known about their designs or cost.
Each of these three Advanced Reactor designs is analysed separately. From availableinformation, many of the costs and characteristics of projects using any of these options would besimilar, as one would expect in a competitive market.
2.4 LARGE-SCALE TECHNOLOGIES
The following identifies and briefly describes available reactor technologies and manufacturersaccording to broad headings below.
2.4.1 PRESSURISED WATER REACTORS
2.4.1.1 EVOLUTIONARY DESIGNS
PWR designs have been the most widely utilised reactor technology with over 275 operating unitsworldwide.

6
WSP | Parsons BrinckerhoffFebruary 2016
Project No 2265048A-STC-REP-004 Rev1Final ReportNuclear Fuel Cycle Royal Commission
The Korean APR-1400 is a larger version of a 1000 MWe pressurised water reactor (PWR)Korean plant which incorporated advanced safety features into a previous standard design. Nineof the 1000 MWe versions are operating. Four APR-1400 units are under construction in Koreaand four more are under construction in United Arab Emirates (UAE). The units in Korea areslightly delayed and slightly over budget. The UAE units were sold as a fixed price project andappear to be on schedule. Additional units are planned in Korea and it is likely the design will beaggressively marketed internationally as successful operational experience accumulates. It shouldbe noted that the Korean 1000 MWe design could probably be marketed internationally but wouldhave a higher cost per unit of capacity than the APR-1400.
The AREVA EPR is a 1600 MWe evolutionary design. Single unit examples are underconstruction in Finland and France and two units are under construction in China. All theseprojects have a troubled history with very large cost increases and schedule delays, the Europeanprojects more than the Chinese projects. Some of this resulted from licensing complications butthe more significant issues seem to be fabrication and construction problems. The EPR wasproposed for several US sites but the USNRC design certification effort has been suspended andthe proposed projects are inactive. The EPR has also been proposed for the Hinkley Point Cproject in the UK but that has also been delayed.
AREVA has teamed with Mitsubishi to develop the ATMEA, a 1,100 MWe PWR design,apparently in response to the construction and market challenges of the EPR, but there are noprojects under construction using this design. The ATMEA design was chosen for a project nowunder development in Turkey and is being considered for other locations such as Vietnam.
The size of both the APR-1400 and the EPR would be a significant challenge to integrate into theSouth Australian network. The ATMEA design would be easier but it is very questionable whetherthe design would be proven in a time frame to support operation in 2030 in South Australia.
2.4.1.2 ADVANCED DESIGNS
The AP1000 is clearly the most successful advanced reactor design to date. The reactor hasbeen design certified by the USNRC, approved in China and is under review in UK and othercountries. Four units of the AP1000 are under construction in the US (two at each of two sites)and similarly a further four units are under construction at two sites in China. At least eight moreUS units are in the licensing process and China has announced ambitious plans to build 20 ormore additional units. Other international projects are in the development phase. The US andChinese projects have experienced some First Of A Kind (FOAK) problems leading to costincreases and schedule delays, but these have not resulted in serious concerns about the viabilityof the projects.
The Chinese are using their technology transfer agreements with Westinghouse to develop largerversions of the AP1000, probably in the 1400 to 1500 MWe range. As noted previously, theRussian designs appear to be advanced passive designs to some extent, but details have notbeen investigated for this review.
2.4.2 BOILING WATER REACTORS
2.4.2.1 EVOLUTIONARY DESIGNS
BWR plants have been successful with about 80 units in operation in the US, Europe and Asia.
The ABWR is a nominal 1,300 MWe design. It is the evolutionary extension of the GeneralElectric BWR technology. Four units have been completed and operated in Japan with two moreunder construction. Two units were completed in Taiwan but have not operated because ofpolitical issues. The Japanese units appear to have been constructed reasonably consistently with

7
WSP | Parsons BrinckerhoffFebruary 2016
Project No 2265048A-STC-REP-004 Rev1Final ReportNuclear Fuel Cycle Royal Commission
the planned cost and schedule. The Taiwan units experienced cost and schedule problems butthese were primarily driven by political decisions unique to Taiwan.
The ABWR has been design certified in the US and was under consideration for several projectsin the US. The most advanced of these, the South Texas Project Units 3 & 4, is maintaining itslicensing schedule but has suspended design work. It now appears that US utilities may nowchoose the ESBWR (an advanced design) over the ABWR. The ABWR is proposed for the WylfaNewydd project in the UK by Horizon Nuclear Power Ltd and is being offered elsewhere as acurrent design.
2.4.2.2 ADVANCED DESIGNS
The ESBWR design has also been certified in the US and reviewed in other countries such asUK. Currently two projects in the US have applied for licenses using the ESBWR. Neither of theseis yet under construction. There are several international projects actively considering theESBWR. There appears to be a reasonable probability for the ESBWR to become a provendesign in the near term. However, the capacity of the design is over 1,500 MWe which may provechallenging for the South Australia power system. There are no plans to produce a smallerversion.
2.4.3 HEAVY WATER REACTORS
2.4.3.1 EVOLUTIONARY DESIGNS
Pressurised Heavy Water Reactors have been developed particularly in Canada as they offer theadvantage of avoiding the historically costly step of uranium enrichment for the fuel. Enrichmenttechnology advances seem to have eliminated the value of this advantage, given the significantlylarger quantity of fuel that must be fabricated for CANDU reactors. The CANDU series of heavywater reactors developed and constructed by AECL have had limited application with only 32reactors being constructed worldwide, with a significant majority being in Canada.
The currently available design is the Enhanced CANDU 6 (EC6) which has a capacity of about740 MWe.
The EC6 is a version of the established CANDU 6 reactor, enhanced to overcome identifieddesign limitations and to increase the level of passive safety. The design incorporates additionalcooling water tanks within the containment and a gravity fed containment cooling facility. The EC6has not been sold or deployed to date and appears to be ready for regulatory approval of thedesign revisions from the base CANDU 6 elements.
The EC6 design has been proposed for two future units in Romania to supplement the operatingCANDU 6 units. The realistic potential for this project to be authorised in the near future is notknown. The proposal, using the Canadian EC6 technology, is apparently being made by aChinese organisation, utilising the experience and fabrication capability they have gained with theQuinshan CANDU 6 projects.
2.4.3.2 ADVANCED DESIGNS
A further design based on CANDU technology is the ACR-1000. All the operating CANDU unitsuse heavy water for both the reactor circulating coolant and moderator. The ACR-1000 is ahybrid, with light water circulating coolant and heavy water moderator. As a result, it can no longeroperate on natural uranium fuel but requires enriched fuel, but with a lower enrichment than lightwater reactors.
The status of the ACR-1000 is not clear. An earlier, smaller version (ACR-700) was originallyconsidered by a US utility and submitted for design certification to the USNRC. However those
8
WSP | Parsons BrinckerhoffFebruary 2016
Project No 2265048A-STC-REP-004 Rev1Final ReportNuclear Fuel Cycle Royal Commission
initiatives were suspended. At this time there do not appear to be any active projects in Canada orinternationally considering the ACR-1000 and no regulatory approval processes are under way.
2.5 SMALL MODULAR REACTORS
Small Modular Reactors have a capacity of below 300 MWe. The SMRs considered here arethose currently at an advanced stage of development; all of these are PWRs.
An alternative to the PWR technology could be gas-cooled technology, which holds considerablepromise. However, the only design that could potentially be commercially available for 2030operation appears to the Pebble Bed Modular Reactor (PBMR) concept started in Germany,developed in South Africa but now taken up by China. It is not clear that the Chinese will have aninternational product offered in the time frame of interest so the PBMR is not considered further,but it does deserve mention as a potential future entry to the market.
SMR technology is intended to address several apparent limitations and problems with theexisting operating reactor technology and the Evolutionary/Advanced reactors proposed or underconstruction.
The first is that many projects have experienced difficulty in maintaining construction schedulesand, even for those that can control schedule, construction schedules of 5 or 6 years and overallprojects schedules of 10 years or more expose the projects to great risks from the changingeconomic and political conditions over the duration of the project. Relatively small units with majorcomponents factory built and shipped to the site promise to cut the construction period to half orless the time of a large unit.
The second is that generation projects based on the economies of scale of units sized from1,100 MWe up to 1,700 MWe or more and often on sites with two to four or more reactors arevery attractive to some countries with extensive power transmission systems and densepopulation centres, but are not feasible in other circumstances. The SMRs are defined as units ofbetween 50 MWe and 300 MWe making them adaptable (in varying multiples) to smallerelectricity systems.
Finally, SMR modularity is also well suited to a smaller electricity system with low or uncertaingrowth rates. Capacity can be added at rate matching overall load growth and capitalexpenditures delayed until needed. The lead time to add incremental capacity is relatively short.
At this time there are a number of SMR designs in various stages of design, component testing,licensing and commercial development. The number of SMR designs which have progressed tothe extent they appear to be technically feasible is too large to address comprehensively in thisevaluation. As a result the scope is limited to a few representative designs that appear to havesome commercial backing and have achieved some level of official review by licensing authorities.
The two designs chosen to represent the small and large ends of the SMR range are the NuScale50 MWe reactor and the mPower 180 MWe reactor. These two designs have received US DOEfunding, are close to submission of designs for review by the USNRC, and have some supportfrom potential customers. This is not intended to discount the active design projects such asseveral small reactors being developed in China, the Korean SMART reactor, other US designsby Westinghouse and HOLTEC and a host of others. However, the public nature of the selectedprojects, based on their funding and license applications, provides a more reliable basis forevaluation.
Although the sizes of the NuScale and mPower units are quite different, they share a commondesign approach. The reactor core and coolant system is contained in a vessel that also containsthe steam generator and serves as a containment. Other than this physical arrangement, thedesign is functionally a fairly conventional PWR. The vessel is partially or completely immersed in

9
WSP | Parsons BrinckerhoffFebruary 2016
Project No 2265048A-STC-REP-004 Rev1Final ReportNuclear Fuel Cycle Royal Commission
an underground pool of water, providing the passive cooling required. The reactor units arefactory assembled and small enough for easy barge or rail shipment.
Sufficient design and test work has been accomplished to establish the technology feasibility ofthe design. The extent to which efficiency in factory assembly line type fabrication will overcomethe economies of scale offered by a larger unit is yet to be proven, but the potential is real. Thelower risk associated with smaller units, smaller investment and shorter project durations will alsojustify a higher capital cost in some situations.
The development schedules for the mPower and NuScale reactors will support the start ofcommercial projects sometime between 2020 and 2025, and commercial operation of units by2030. Until an actual project is planned and contracted, costs will be speculative and based onprojections by the reactor designers. For the purposes of this study, it is being assumed that theprojections have some accuracy and that SMR costs have to be reasonably close to the betterunderstood Advanced Reactor costs to be a viable product in the market. Although the SMR hasappeal in some markets to which large reactors are not suited, it is likely that the required volumeof SMR production can only be reached if the design is successful in competition with the largerreactors.
Economic conditions also impact the potential for SMRs to become competitive with largerreactors because of the significant reduction in construction time and the potential to better matchcash flow and capacity increases to actual demand increases. The delays experienced in recentnuclear projects would have had a much larger cost impact if the interest rates had not been athistorically low levels. SMRs would minimise the risk of such cost impacts in future.
2.6 SUPPORTING INFRASTRUCTURE
The supporting infrastructure required includes:
à electrical interconnectionà system reserve capacity to support a large single generatorà access roadà rail connectionà cooling water provisionà process water supply.
These elements are well understood in terms of scope, which depends somewhat on the scale ofplant, and will be detailed further in later sections on technology assessment (Section 3) andcosts (Section 5).

10
WSP | Parsons BrinckerhoffFebruary 2016
Project No 2265048A-STC-REP-004 Rev1Final ReportNuclear Fuel Cycle Royal Commission
3 TECHNOLOGY ASSESSMENT3.1 METHODOLOGY
The available large scale technologies and small modular reactors have been discussedpreviously in Section 2.
The purpose of this section is to review the current status and availability for the identifiedtechnology classes, and to review the limitations for application in South Australia. Followingreview of these issues, candidate technology classes are identified for further consideration.
The terms of reference for the study specify a timeframe for nuclear deployment in SouthAustralia by 2030. The available technology classes have been reviewed with this timeframe inmind to identify the most likely technology classes which could be completed and operational by2030.
It has been further assumed that the deployed technology class for South Australia would need tobe deployed internationally to an “Nth-of-a-Kind” (NOAK) basis by the target timeframe of thestudy. It is not considered likely, or advisable, that an international “First-of-a-Kind” (FOAK)technology would be adopted for the first nuclear project to be developed in South Australia.
Specific limitations to the application of the identified technology classes in South Australia arealso considered. These include both “reactor specific” limitations (which tend to differ according tothe type and size of reactor unit), and “site specific” limitations (which would tend to apply for anynuclear power project development in South Australia).
3.2 REVIEW OF TECHNOLOGY STATUS
3.2.1 DEVELOPMENT STATUS
There are diverse nuclear reactor technologies that are offered by vendors internationally or atvarious stages of development from concept to close to market. The primary categories of reactortechnology considered here are those detailed in Section 2, notably pressurised water reactor,boiling water reactor, and pressurised heavy water reactor, with all of these being available at ascale of 700-1,600 MW. In addition there are reactor technologies at earlier stages ofdevelopment including liquid metal cooled fast reactors, molten salt reactors and high temperaturegas reactors. Technology vendors are proposing to offer these technologies as small modularreactors of below 300 MW capacity. In addition several vendors are developing small-scaleversions of the proven pressurised water reactor technology as small modular reactors.
The identification of suitable reactor technologies for application in South Australia is beingconsidered for a potential deployment around 2030. Experience indicates that vendors will notwant to offer a prototype commercial unit into a new market such as South Australia as theywould face avoidable risks and uncertainties through lack of familiarity with local conditions andlimited local nuclear supply chain capability. Hence the first nuclear technology to be appliedwould need to be a proven design, a so-called Nth-of-a-Kind (NOAK) unit.
It is unavoidable that there would still be local FOAK elements in such a project because of thelack of commercial nuclear experience in Australia. It is expected that the impact of the localFOAK efforts would be less if a small modular reactor technology were selected owing to theincreased factory manufacturing content and reduced on-site detailed assembly requirements.
It is important to recognise that new or enhanced reactor designs require several years’ work fordevelopment and approval processes before a prototype unit can be built, with a subsequent unit

11
WSP | Parsons BrinckerhoffFebruary 2016
Project No 2265048A-STC-REP-004 Rev1Final ReportNuclear Fuel Cycle Royal Commission
following some years later. The consequences of this schedule on potential deployment of adesign in South Australia are very significant to the shortlisting of potential nuclear technologies.
3.2.2 TIMESCALE TO 2030
A fundamental requirement for the timescale is that a reactor technology should have beendeployed internationally in multiple units (i.e.to an NOAK level) prior to commercial procurementfor operation in 2030. It is therefore necessary for the specific technology to be at the point ofcompletion of the second commercial project prior to commencing pre-licensing activities for theSouth Australia project. Based upon this definition, and using internationally representativedurations for pre-construction stages and construction period for the Large Reactors / SMRprojects, the following typical central case development timeline is derived as shown in Figure 3.1.
Figure 3.1 Development timeline for large reactors / SMR projects
The figure shows that working backwards from the target date for operation in 2030, it would benecessary for a Large Reactor technology (defined as a large scale PWR / BWR / PHWR designgreater than 700 MWe, single unit) to be undertaking construction of the FOAK project andapproaching final investment decision for the second project with construction commencing in2016 at the latest. It is known that both the PWR and BWR categories satisfy this condition bysome margin, however the PHWR category does not. The BWR design which supports anacceptable schedule is the ABWR, an evolutionary design. The passive BWR design, theESBWR, is unlikely to meet the above schedule criteria.
By comparison, for a Small Modular Reactor technology (defined as a modular constructiondesign with multiple reactors totalling less than 400 MWe) due to the shorter anticipatedconstruction period the first project would need to be at the point of completion of pre-licensing(with a view to regulatory submission in 2016), with the second project following one year behind.It is believed that the lead SMR technologies are close to this timeframe.
If the criterion is relaxed to accept designs in the latter stages of construction, rather than incommercial operation at the South Australian decision point, the number of acceptable candidatedesigns may be larger. This may also be necessary should, for example, representative FOAKprojects be delayed.
2014 2015 2016 2017 2018 2019 2020 2021 2022 2023 2024 2025 2026 2027 2028 2029 2030
Construction - 5 years
Development to FIDConstruction - 5 years
Pre-LicensingLicensing Review
Development to FIDConstruction - 5 years
Pre-LicensingLicensing Review
Development to FIDConstruction - 3 years
Pre-LicensingLicensing Review
Development to FIDConstruction - 3 years
Pre-LicensingLicensing Review
Development to FIDConstruction - 3 years
Ope
ratio
nin
Sout
hAu
stra
liain
2030
Larg
eR
eact
or(>
700M
W)
Smal
lMod
ular
Rea
ctor
(<40
0M
W)
Decision Gate (South Aus)By this time the Reactor
Technology should be at pointof completion of 2nd Project
Decision Gate (South Aus)By this time the Reactor
Technology should be at pointof completion of 2nd Project
FOAK technology projectsconstructed elsewhere
FOAK technology projectsconstructed elsewhere
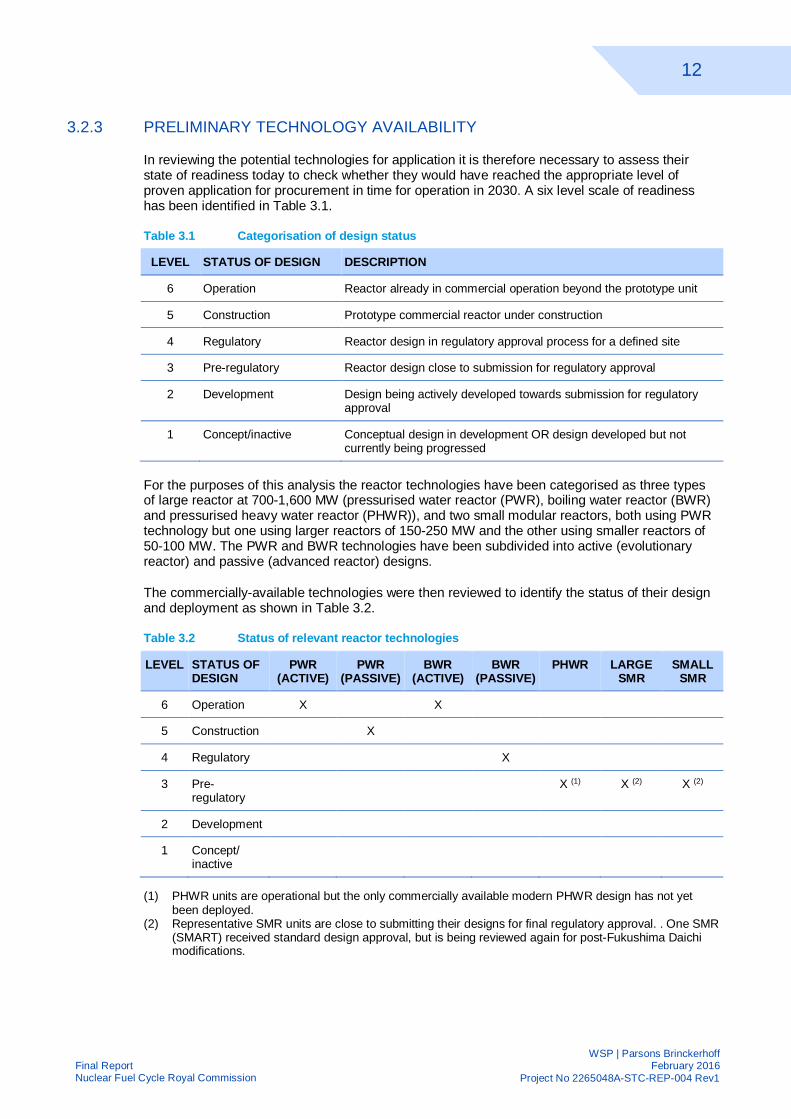
12
WSP | Parsons BrinckerhoffFebruary 2016
Project No 2265048A-STC-REP-004 Rev1Final ReportNuclear Fuel Cycle Royal Commission
3.2.3 PRELIMINARY TECHNOLOGY AVAILABILITY
In reviewing the potential technologies for application it is therefore necessary to assess theirstate of readiness today to check whether they would have reached the appropriate level ofproven application for procurement in time for operation in 2030. A six level scale of readinesshas been identified in Table 3.1.
Table 3.1 Categorisation of design status
LEVEL STATUS OF DESIGN DESCRIPTION
6 Operation Reactor already in commercial operation beyond the prototype unit
5 Construction Prototype commercial reactor under construction
4 Regulatory Reactor design in regulatory approval process for a defined site
3 Pre-regulatory Reactor design close to submission for regulatory approval
2 Development Design being actively developed towards submission for regulatoryapproval
1 Concept/inactive Conceptual design in development OR design developed but notcurrently being progressed
For the purposes of this analysis the reactor technologies have been categorised as three typesof large reactor at 700-1,600 MW (pressurised water reactor (PWR), boiling water reactor (BWR)and pressurised heavy water reactor (PHWR)), and two small modular reactors, both using PWRtechnology but one using larger reactors of 150-250 MW and the other using smaller reactors of50-100 MW. The PWR and BWR technologies have been subdivided into active (evolutionaryreactor) and passive (advanced reactor) designs.
The commercially-available technologies were then reviewed to identify the status of their designand deployment as shown in Table 3.2.
Table 3.2 Status of relevant reactor technologies
LEVEL STATUS OFDESIGN
PWR(ACTIVE)
PWR(PASSIVE)
BWR(ACTIVE)
BWR(PASSIVE)
PHWR LARGESMR
SMALLSMR
6 Operation X X
5 Construction X
4 Regulatory X
3 Pre-regulatory
X (1) X (2) X (2)
2 Development
1 Concept/inactive
(1) PHWR units are operational but the only commercially available modern PHWR design has not yetbeen deployed.
(2) Representative SMR units are close to submitting their designs for final regulatory approval. . One SMR(SMART) received standard design approval, but is being reviewed again for post-Fukushima Daichimodifications.

13
WSP | Parsons BrinckerhoffFebruary 2016
Project No 2265048A-STC-REP-004 Rev1Final ReportNuclear Fuel Cycle Royal Commission
The implications of this analysis are that while PWR and BWR designs would be able to bedeployed as an nth-of-a-kind in 2030, a PHWR would only be feasible some years later anddeployment of SMRs on this basis would only be feasible if they can maintain their programme ofstart of final regulatory review in 2016. If only passive safety designs are to be considered, BWRswould probably not be candidates in the defined time frame, and choices would be limited to thePWR and SMR designs.
3.3 LIMITATIONS FOR APPLICATION IN SOUTH AUSTRALIA
3.3.1 REACTOR SPECIFIC LIMITATIONS
The following sections outline the reactor specific limitations for application in South Australia asdistinguished for Large Reactor projects (generally >700 MW), and for Small Modular Reactorprojects (generally <400 MW). The limitations related to the electricity transmission anddistribution system are based on the system as it exists today. Efforts to reduce the dependenceof the overall economy on carbon-based fuels will, of necessity, involve upgrades to the electricgrid and increases in the portion of basic energy supplied in the form of electricity, independent ofwhat type of generation is added. Large scale electrical storage to support intermittentrenewables, if it becomes economic, may also impact the grid requirements for generation of alltypes. These necessary changes may alleviate some of the apparent limitations that exist today.
3.3.1.1 SPINNING RESERVE
Reliable operation of any power network means that a ‘spinning reserve’ of running capacityneeds to be maintained to avoid blackouts in case of the unexpected trip of any generating unit orlarge transmission in-feed. This spinning reserve may be shared with other interconnectedsystems to minimise costs but is an essential feature of system operation. In the case of SouthAustralia the largest generating unit is around 270 MW while the largest interconnector is theHeywood interconnector to Victoria which is currently being upgraded to 650 MW. It is anticipatedthat AEMO currently maintains a spinning reserve of around 600 MW.
Installation of large nuclear plant would increase the largest potential loss of generation to thegross capacity of the nuclear plant, an increase of 150-1,000 MW. This additional reserve wouldconventionally be supplied by reducing the operating despatch of other running power plant toprovide the additional margin in case of a nuclear plant trip. The consequence of this reducedoperating output of other units is that they will be operating less efficiently, consumingproportionately more fuel and hence increasing the costs of operation of the system.
Analysis of the existing power plant across the interconnected network in South Australia andVictoria suggests that the current cost of such additional spinning reserve would be approximatelyAU$15,000/MW/annum assuming a cost of coal of AU$1.80/GJ (Bureau of Resources and EnergyEconomics, 2012).
However it is likely that by 2030, coal plant will not be preferred for this duty and it is likely that asolution using short-term electricity storage, backed up by fast start gas turbine plant would beemployed for the medium- and longer-term. While the storage system cost might be covered as anecessary part of wider renewable deployment, the additional gas turbine capacity and fuelconsumption would likely be attributable to the nuclear plant. The future cost of reserve capacity,therefore, would depend heavily on the forecast mix of generation technologies contributing to thegeneration market over the operating life of the nuclear power plant.
Installation of a nuclear generating unit with capacity less than or comparable to the existingspinning reserve would incur no additional operational costs for spinning reserve.
The potential for co-location of a large nuclear unit with a large electrical consumer might also beconsidered. If a significant portion of the electrical (or steam) output is dedicated to an adjacent

14
WSP | Parsons BrinckerhoffFebruary 2016
Project No 2265048A-STC-REP-004 Rev1Final ReportNuclear Fuel Cycle Royal Commission
industrial process, the electrical grid would not be required to accept the full unit capacity. Theindustrial facility would have to be able to accept the potential for a periodic loss of capacity butmodern nuclear units are capable of availability significantly in excess of 90% and more than halfof the unavailability is planned.
3.3.1.2 TRANSMISSION VOLTAGE
The current transmission system in South Australia is based on a backbone of 275 kVtransmission lines. The capability of the switching equipment used at this voltage has a particularsafe rating to interrupt currents in case of a fault. The potential current flow in case of a fault isdetermined by the capacity of nearby generators and the impedance of connected transmissionlines and equipment. Adding a single generator rated at 1,100-1,600 MW, typical of the largenuclear units under consideration, with the necessary transmission lines for power export, wouldrisk exceeding the fault rating of 275 kV switchgear. The assessment of the suitability of theexisting 275 kV voltage level for connection of a large generator will require comprehensiveanalysis for each potential location. Avoiding this issue would require the introduction of a highertransmission voltage e.g. 400 kV or 500 kV, for which more highly rated switchgear is available.
The smaller scale reactors such as the smaller PHWR and SMRs would not be expected torequire any such change of transmission voltage.
3.3.2 GENERAL SITE LIMITATIONS
The following sections outline the site specific limitations for any nuclear power stationdevelopment in South Australia as distinguished for a “Greenfield” site and “Brownfield” site.
3.3.2.1 TRANSPORTATION LOGISTICS
Access to the nuclear plant site will be needed for construction deliveries, for construction workersand for operational and emergency site deliveries and personnel. It is anticipated that constructiondeliveries will include a significant proportion of heavy loads delivered by rail, but someexceptionally large loads may require delivery by road from a local port or temporary coastal roll-on roll-off unloading site. Hence a route for heavy haulage is likely to be required includingbridges and crossings uprated to the desired loading.
Access requirements may include elements determined by emergency planning standards set bythe nuclear regulator. These may be more demanding than for a conventional power plant,potentially requiring at least one alternative access to the site for emergency use in case ofobstruction of the main route.
Operational access can be expected to be conventional, with limited heavy goods deliveries, whilespent fuel will be stored on site in specially designed facilities. During or after decommissioningmaterial may be removed by rail and/or road to the long-term storage/ disposal site. Such loadswill generally be of conventional size, although they may include specialised shielded containers.
While access of this type will generally be expected to be in place for a brownfield site, provisionsfor a remote greenfield site would require substantial works.
3.3.2.2 AVAILABILITY OF LOCAL STAFFING
The requirement for construction staffing at remote sites is conventionally provided fromtemporary construction site accommodation. Operational staffing is usually recruited to liverelatively locally to the plant. Where a plant is to be located remote from existing settlements,construction of a new community with appropriate facilities will be necessary. Such a communitywill require an adequate supply of utilities including power and water.

15
WSP | Parsons BrinckerhoffFebruary 2016
Project No 2265048A-STC-REP-004 Rev1Final ReportNuclear Fuel Cycle Royal Commission
For a brownfield site it is anticipated that there will be an existing community nearby, although itmay require extension to support the different staffing requirements of a nuclear plant. In case ofa remote greenfield site it is likely that specific provisions for a new community to support theplant would be required.
3.3.2.3 COOLING REQUIREMENTS
All of the nuclear technologies being considered here use a conventional steam cycle to convertheat from the nuclear reactor to electricity. The steam cycle requires heat to be rejected from thesteam turbine condenser to the environment. There are three conventional means of rejecting thisheat, each requiring a different quantity of water for a 1,200 MW unit:
à Direct cooling using water from a large source such as the ocean or a large river – typicallyrequiring a flow of 50-100 m³/sec to limit the temperature rise to 5-10°C.
à Cooling towers which recirculate water over an evaporative pack in the tower with make-upfrom a local source to replace the water lost and avoid excessive build-up of salts in waterpurged from the cycle – typically requiring 2.5 m³/sec.
à Air cooled condenser where air is blown over finned tubes to condense the turbine exhauststeam directly – generally requiring no cooling water.
The relative quantities of cooling water determine the feasibility of the alternative site types. Aconventional location for a nuclear plant would be on an open coast using direct cooling.
A brownfield coastal site suitable for a smaller power plant may offer adequate access to the seabut would require detailed analysis to identify whether high levels of recirculation would occurdegrading plant performance and resulting in environmentally damaging high seawatertemperatures.
Inland locations, such as the defined greenfield site, would generally require a large river tosupply the make-up water to cooling towers or where this was not available air cooled condenserswould be used.
The choice of site determines cooling options which in turn have a significant impact on thermalcycle performance. Direct cooling maximises electrical capacity, cooling towers typically reduceoutput by 2.5% while air cooled condensers can reduce output by 5% or more, according toambient conditions. These adverse effects are worse in summer when power demands arehigher.
3.3.2.4 WATER SUPPLY
The steam cycles used for nuclear power stations require make-up of high purity water tocompensate for losses from leakage and purge flows. These are typically at the level of 0.5% ofsteam flow, requiring 60 t/h of raw water supplied to the water treatment plant for a 1,200 MWeunit.
Other water users include domestic consumption for staff and service water for cleaning, flushingand maintenance uses. Such water needs to be of potable quality and would typically total lessthan 5 t/h.
The scale of these water demands indicates the challenge for a remote greenfield site where anadequate source of raw water would be needed even to supply a small nuclear plant with an aircooled condenser. A brownfield site would be expected to have existing supplies of this scale. Anew coastal site would be equipped with a local desalination plant to supply these demands.

16
WSP | Parsons BrinckerhoffFebruary 2016
Project No 2265048A-STC-REP-004 Rev1Final ReportNuclear Fuel Cycle Royal Commission
3.4 IDENTIFICATION OF BEST-FIT TECHNOLOGIES
The consideration above of the different technologies and their suitability for deployment in SouthAustralia in 2030 can be summarised by allocating a desirability score to each for each majorissue. This represents a somewhat subjective assessment of the relative merits of the alternativesto be considered alongside the quantitative financial comparison. The scores give a measure ofthe ease of application of each technology.
The technology scores are set out in Table 3.3.
Table 3.3 Indicative technology scores for the candidate technologies
PWR BWR PHWR LARGE SMR SMALL SMR
Availability for 2030 üüü üü û üü üü
Electrical connection ü ü üü üüü üüü
Coastal site Greenfield üüü üüü üüü üüü üüü
Brownfield üüü üüü üüü üüü üüü
Inland site Greenfield û û û ü ü
Brownfield üü üü üüü üüü üüü

17
WSP | Parsons BrinckerhoffFebruary 2016
Project No 2265048A-STC-REP-004 Rev1Final ReportNuclear Fuel Cycle Royal Commission
4 ALTERNATIVE APPLICATIONS4.1 STORAGE IN ELECTRICAL GENERATION SYSTEMS
Hydrogen generation and storage has been mentioned as an issue to be explored in relation tonuclear generation options. However, the specific option of generating hydrogen from nuclearpower installations is probably too narrow a topic to be evaluated at this time. Of more value is ageneral discussion on the potential for energy storage in general to be a valuable feature of ageneration mix that includes nuclear power plants.
4.1.1 NEED FOR STORAGE
Electrical systems do not have either constant supply (generation) or constant demand (electricityuse) characteristics. As a result, the system must have features and characteristics to respond tothe potential mismatch of supply and demand. The least challenging but generally most expensiveapproach is to have a surplus of generation capacity at all times and put the resource into serviceas needed.
4.1.2 SUPPLY CHARACTERISTICS
Generation assets can be characterised in several ways, reflecting the cost profiles of operationand the capability to respond to demand. Some resources have relatively small capital cost buthigh marginal cost of operation (usually because of fuel cost). Most fossil fuel generation falls intothis category with gas and oil providing the extreme cases of low capital cost but high fuel cost.Nuclear energy and most renewable resources provide the other extreme of having high capitalcost and relatively low (or zero) fuel cost. Some resources fall between the extremes such aslarge coal units which moderate fuel cost by efficient operation but have significant capital cost.Typically, a high capital cost, low fuel cost resource would be used in base load (operating 100%of the time) mode if possible while low capital cost high fuel cost resources would be called ononly when the demand was high enough to create a high marginal value on peak electricalsupply.
Another characteristic is availability. This simply refers to whether the generation capacity isavailable when it is needed. No resource is perfectly available. There is always some potential forequipment failure or some other limitation that prevents the generation asset from providing 100%of its rated capability or, in some cases, from operating at all. Unavailability is often classified asPlanned and Unplanned but this is overly simplistic. Clearly a mechanical failure that prevents anasset from operating is completely unplanned. A scheduled refuelling outage for a nuclear plant ormaintenance outage for a fossil or renewable plant is completely planned. Similarly, the daily lossof a solar asset at night can be predicted. However, solar power reductions because of cloudyweather or loss of wind power generation due to low wind speed may or may not be predicted andmay have advance warning of days, hours or not at all. The extent to which a resource can bedepended on is sometimes called “Dispatchability”.
Because of climate change concerns there is a strong initiative to reduce the use of fossil fuels inelectrical generation. As noted above, fossil fuels have historically been used for both base loadand peaking load applications. The utilisation of nuclear and renewable resources to replace fossilbase load generation is obvious but replacement of low capital assets for peaking service iseconomically difficult. This leads to consideration of energy storage as a replacement for thosepeak load assets.
18
WSP | Parsons BrinckerhoffFebruary 2016
Project No 2265048A-STC-REP-004 Rev1Final ReportNuclear Fuel Cycle Royal Commission
4.1.3 DEMAND CHARACTERISTICS
The total electrical demand varies in a number of ways. There is a typical annual cycle, usuallywith summer and winter peaks, the relative magnitude of these peaks being dependent on thelocal climate and need for air conditioning as contrasted with the extent to which electricity is usedfor heating. A weekly cycle exists, driven by industrial and commercial loads and impact ofweekends and holidays. Finally, daily cycles of daytime and night-time use exist, additionallydriven by temperature variations from the average. Over a year, the peak demand will generallybe at least twice the minimum demand. In some climates, especially with large air conditioningloads, the ratio can be larger.
Demand side management can be implemented to moderate the variation and modify the profileof energy use but there are practical limitations to this approach.
4.1.4 MATCHING SUPPLY AND DEMAND
Ideally, an electrical system would have enough baseload capacity with high availability to supplyat least the minimum annual demand. This baseload capacity can be increased by the plannedunavailability of these baseload assets such that these assets can operate as their maximumcapacity factor. As an example, if a system had enough nuclear capacity and baseload coalcapacity to supply the minimum demand with units out of service for refuelling/maintenance asrequired, it would meet this goal.
In traditional systems, fossil assets with lower capital cost and higher fuel cost would be utilised tofill the gap between the minimum load and maximum load. These assets would be included in themix in ratios dependent on the predicted required capacity factor. However, system planning forthe future will be driven to minimise utilisation of fossil assets. Goals of completely eliminatingfossil use are often proposed, but the marginal cost of eliminating the last small amount of fossilgeneration, because of its high availability and very low capital cost, may be very high.
Utilisation of renewables poses unique challenges in system planning. The renewables havesome potential for unpredictable loss of capacity. In addition, the capacity variations that can bepredicted may not match well with local demand profiles. It is beyond the scope of this work toinvestigate the South Australia supply and demand characteristics, but other parts of the worldhave found a variety of problems with matching renewables supply with demand. Solar output ismuch lower in the winter in many locations and does not support winter peaks due to electricheating. In some areas, the highest summer temperatures correspond with relatively low windvelocities.
These issues lead to consideration of energy storage technologies to fill the gaps between supplyand demand.
4.1.5 STORAGE CAPABILITY
Many different forms of energy storage have been proposed and are being actively investigatedand, in some cases, utilised on experimental or commercial bases. The characteristics of thesewill be discussed later. First, it should be realised that storage cost vs. benefit may well be morefavourable for storage in a nuclear generation based systems than a renewable based system.This is a direct result of the extent to which the most probable renewable generation profilematches the demand profile in a local environment. If the total capacity available, consideringnuclear and renewables, at any time exceeds the demand, one of the sources must be shut down.Because of similar characteristics of high capital cost and low operating cost, the economicperformance of the underutilised asset will be damaged.
If a system is envisioned that includes predominantly high capital cost, low fuel cost resourcesplus storage, the storage will probably also function as a high capital cost, low fuel cost resource.

19
WSP | Parsons BrinckerhoffFebruary 2016
Project No 2265048A-STC-REP-004 Rev1Final ReportNuclear Fuel Cycle Royal Commission
The overall economics of the system will be best if the utilisation of the storage (i.e. the frequencyand total energy flow of storage/discharge cycles) is high.
Because nuclear is a true baseload, high capacity factor source, storage is not required to covergaps in generation. To the extent renewables are credited as minimum baseload and becomeunavailable at low demand periods, storage may have to be utilised to fill in the gap unless fossilassets are available. Therefore, storage in a renewable system may function to supplementsupply and to address demand peaks while storage in a nuclear system is primarily used toaddress demand peaks.
Without investigating the specific characteristics of South Australia, it is probable that the demandvariability is more predictable than the supply variability. Since a nuclear-based system requiresstorage only to address demand variability, it is likely that the storage requirements to supplementa nuclear-based system and minimise the utilisation of fossil fuel-based assets is less than in asystem that is highly renewable dependent.
4.1.6 STORAGE OPTIONS
In electrical generation systems, storage systems can be used that either directly store electricalenergy, or store energy in other forms that can subsequently be used to generate electrical powerat peak demand times or can be used in other ways. Decisions on the viability of storageschemes will depend on the capital cost of the storage system, the energy loss in conversion andthe final value of the electricity or other product. The economics of long-term storage must also beconsidered if the storage is intended to address seasonal load peaks.
Hydrogen has been studied extensively as a storage medium. It is attractive because it hasmultiple uses and is well understood. A variety of factors impact the attractiveness of hydrogen asa storage medium. If the hydrogen is used for non-electrical generation purposes, for example asa chemical feedstock or a transportation fuel, it may have high value but does not address theelectrical demand issue. In this case additional baseload capacity is still required and amechanism to address peak loads is necessary. If it is used to generate electricity, either in gasturbines or fuel cells, significant conversion losses must be considered. There are various ways togenerate hydrogen but most are more efficient at high temperatures. Because of this, hydrogen isprobably more attractive in systems based on nuclear generation and concentrating solar. A majorshift to a “hydrogen economy” for uses like transportation would probably be an incentive to moveto Generation IV high temperature gas reactors.
Some generation sources may have the direct capability to store energy in the form of hightemperature material and utilise it at other times. The most attractive of these options has beenconcentrated solar systems. In these cases, the size of the generation system does not have tobe increased because the stored energy is used when the primary source (the sun) is notavailable. There is an additional cost of storage medium which must either have a high heatcapacity such as molten salt or be able to undergo a phase change (solid to liquid) at atemperature attractive for power generation.
Battery storage has generated increasing interest as technology advances occur. Utility scalebatteries to supplement peak grid demands are being tested. Use of excess power to chargevehicle batteries, off peak, is promising but, like non-power hydrogen use, this does not addressthe electrical load peak requirements directly except to the extent it will utilise additional base loadresources. In the transportation sector, there is interest in quick-change battery packs, whichcould be changed instead of filling a fuel tank, and flow batteries where the electrolyte is changedinstead of charging the battery. Both these approaches would centralise the charging process andpotentially make it easier to synchronise loads with grid capacity, assuming transportation is goingto largely move away from fossil fuels. However, the likely scale of feasible battery storage isunlikely to be adequate for longer duration shortages of generation e.g. exceeding six hours.
20
WSP | Parsons BrinckerhoffFebruary 2016
Project No 2265048A-STC-REP-004 Rev1Final ReportNuclear Fuel Cycle Royal Commission
Hydropower, both traditional and pumped storage, combines very well with either renewable ornuclear capacity. It is, however, limited by local geographical features. The appeal of hydropoweris obvious since it can address both short-term (daily) and long-term (seasonal) load variations.Beyond the geographical requirements, there may also be environmental objections tohydropower installations.
Flywheel storage is being tested in several locations. The concept is simple and the advances inbearing technology result in relatively high efficiency. The ultimate economics, given the need formass and volume as a storage characteristic, remain to be determined. The technology isindependent of energy source.
Geothermal power is not normally considered a storage technology but it has interesting potentialas a seasonal peaking supply. In the past, the difficulty with geothermal has been that, after theexpense of boreholes and generation equipment, the high temperature source cools and losesgeneration capability. If a geothermal resource can be economically developed as a source tosupply peak summer and winter demands, the off demand time might allow the sourcetemperature to recover for the next peak. If peak power is credited with a higher value than offpeak power, the economics of geothermal might improve.
4.1.7 CONCLUSION
Because there are no attractive primary energy sources other than fossil fuels that possess thedesired low capital cost characteristics for peaking demand, storage or alternative energy use willbe a very attractive attribute in future electrical generation systems. To the extent alternative usesare identified, this will increase the overall required generation capacity, but will often reduce fossilfuel use in non-electrical power applications.
Unless renewable power generation profiles can be established to closely follow the short-termand long-term electricity demand profiles, the overall cost of storage/alternative use technologyshould be lower for nuclear-based systems than renewable-based systems.
4.2 HYDROGEN COPRODUCTION FROM NUCLEAR PLANT
4.2.1 INTRODUCTION
Hydrogen production has been identified as a means of storing nuclear energy when powerdemand is insufficient to make full use of plant capacity. The hydrogen can be subsequently usedas a substitute for natural gas in power plant or converted to electricity using a fuel cell whenpower demand increases.
Hydrogen can be produced by electrolysis or by means of a number of alternative chemical cyclesusing high temperatures to split water into hydrogen and oxygen.
The possible use of heat from a nuclear reactor to produce hydrogen was identified by the RoyalCommission as an option to be considered in evaluating the potential economic value of a nuclearpower plant in South Australia.
4.2.2 HYDROGEN PRODUCTION TECHNIQUES
The alternative hydrogen production techniques can be characterised by their energy conversionefficiency, by their level of technical readiness and by their cost of capacity. While energyefficiency can be estimated relatively accurately before a technique has been demonstrated atscale, costs are difficult to estimate well at an earlier stage of development.

21
WSP | Parsons BrinckerhoffFebruary 2016
Project No 2265048A-STC-REP-004 Rev1Final ReportNuclear Fuel Cycle Royal Commission
4.2.2.1 ELECTROLYTIC HYDROGEN PRODUCTION
Electrolytic hydrogen production uses an electrolytic cell to split water in an acid or alkalinesolution into hydrogen at the negative electrode and oxygen at the positive electrode. Thisprocess is well proven and has well-understood characteristics and limitations. The practicalperformance of such an electrolytic cell requires a significantly higher voltage to function thanshould theoretically be necessary. This inefficient operation results from practical constraints suchas ‘anode effects’ and thermodynamic limitations that increase the necessary voltage. Alternativeelectrolytic cell designs include special electrode materials and catalysts to reduce losses. Theefficiencies of advanced cells range from 60-90%, and is typically 85%. However, it should benoted that conversion of hydrogen back to electricity is unlikely to exceed an efficiency of 70%,resulting in an overall ‘round-trip’ efficiency that is extremely unlikely to exceed 60%.
Electrolysis at elevated temperatures is reported to offer higher efficiencies of somewhat over90%, but the technology is not yet commercially available.
The best current examples of this technology offer an energy efficiency of about 85%, equivalentto 166 MW electricity consumption for a production of 1 kg/s. The technology is proven andcommercially available. Capital costs are estimated to be around US$50m for a 1 kg/s facility.
4.2.2.2 THERMAL HYDROGEN PRODUCTION
Water can be split into hydrogen and oxygen by a range of chemical cycles using heat and, insome processes electricity, to provide the necessary energy. The two best known are thesulphur/iodine and the copper/chlorine chemical cycles. The sulphur/iodine cycle requirestemperatures of around 850°C to perform the critical decomposition of sulphuric acid into water,oxygen and sulphur dioxide, while the copper/chlorine cycle requires about 530°C to decomposecopper chloride in addition to an electrolytic step. The latter cycle is better matched tocontemporary light water reactor temperatures, although additional heating would be needed toreach 530°C. Future Generation IV reactors may be able to offer higher temperatures and heatoutput better matched to these chemical processes.
If the copper/chlorine cycle was to be applied with contemporary nuclear reactor technologies, theheating processes would need to partly use heat at below 280°C from the reactor cycle with thehigh temperatures being delivered by another source. This could be an external fuel, such asnatural gas, or it could be as electrical heating using generated power. The consequence of theuse of generated power for heat as well as for the electrolysis step is that the effective efficiencyof hydrogen production by such processes is reduced to around 60%, equivalent to an electricityinput of 238 MW for a production of 1 kg/s.
The copper/chlorine cycle has been demonstrated in the laboratory but a pilot plant is yet to bebuilt. While it is possible that this technology would be commercially available in 2030, it isconsidered unlikely to be available at the scale required for a nuclear plant contracted around2025.
At this stage of preliminary development of the cycle, cost assessments have high degrees ofuncertainty. Based on estimates by the University of Ontario Institute of Technology and others, a1 kg/s plant would cost around $300m. (Naterer, et al., 2008)
4.2.3 REVIEW OF ALTERNATIVE HYDROGEN PRODUCTION TECHNOLOGIES
Considering the two techniques that might be used in conjunction with a nuclear plant, it appearsthat the conventional route of hydrogen electrolysis is to be preferred for the following reasons:
à Energy efficiency of electrolysis is up to about 85% compared with about 60% for the copper/chlorine cycle used with current LWR nuclear plant;

22
WSP | Parsons BrinckerhoffFebruary 2016
Project No 2265048A-STC-REP-004 Rev1Final ReportNuclear Fuel Cycle Royal Commission
à Electrolysis technology is commercially available at scale and would have developed furtherbefore 2030 whereas the copper/chlorine cycle has only been demonstrated at laboratoryscale to date, and is unlikely to be commercially available at scale in time for it to beintegrated with a nuclear plant to be operational in 2030;
à The cost of capacity of hydrogen production by the electrolysis process is well establishedand is radically less than the estimated cost for a comparable copper/ chlorine unit.
à In any hydrogen storage system, the round-trip energy efficiency is unlikely to exceed 60%with the best available current technology, and may well not exceed 40% with currentcommercially available technology.
4.3 NEUTRON IRRADIATION SERVICES
4.3.1 INTRODUCTION
Irradiation with neutrons from a nuclear reactor allows materials to be modified to produce newisotopes which can undergo radioactive decay to form new elements. The new isotope may havedesirable characteristics itself or the decay product may be valuable.
There are number of products of irradiation that have commercial value. These include isotopes ofmolybdenum used to generate technetium for medical diagnostic purposes, cobalt-60 for non-destructive inspection by gamma ray radiography or sterilisation and silicon-31 to achieve veryevenly distributed doping in power semiconductors.
Irradiation of samples to produce the desired isotopes is usually conducted on a modest scale inresearch reactors such as the OPAL reactor operated by ANSTO in New South Wales. The scaleof production of isotopes in a nuclear reactor is relatively slow and the quantities produced arelimited. It is not conventional to use power reactors to provide irradiation services as the facilitiesrequired and the necessary operations in many cases are either difficult to provide or mayinterfere with power generation. Nevertheless this section examines the possible opportunities toimprove the value of a power reactor in South Australia by incorporating such facilities.
The following sections consider the isotopes that might be worth producing.
4.3.2 PRODUCTION OF COBALT-60
Cobalt-60 is a powerful source of gamma radiation used for radiography, radiotherapy andproduct sterilisation. The material is produced by irradiating appropriately packaged natural cobaltpins in nuclear reactor for a period of up to three years (International Atomic Energy Agency,2003). The cobalt pins are repackaged and sealed into concentric stainless steel tubes to formpencils and inspected in a well shielded ‘cave’ before being loaded into heavy transportcontainers.
Cobalt-60 production may be integrated with most of the reactor types considered in this study.However, facilities for post-irradiation fuel handling need to permit the carriers of the activatedcobalt pins to be recovered and handled safely in fuel ponds. The intensity of high energyradiation from the Cobalt-60 pins may necessitate the provision of additional radiation shieldingand/or extra deep ponds. Suitable caves for the safe handling of the extremely radioactivematerial will be needed along with transfer facilities from the ponds.
4.3.3 PRODUCTION OF MOLYBENUM-99
Molybenum-99 is a short-lived nuclear isotope with a half-life of 65 hours that decays totecnetium-99, which is used in medical positron tomography. Molybenum-99 is produced byirradiation of molybdenum oxide in a reactor for about one week (International Atomic EnergyAgency, 2003). The irradiated powder is dissolved in sodium hydroxide solution and transferred to

23
WSP | Parsons BrinckerhoffFebruary 2016
Project No 2265048A-STC-REP-004 Rev1Final ReportNuclear Fuel Cycle Royal Commission
laboratories close to hospital users for technetium-99 production. The short half-life of the materialmeans that any reactor producing it needs to be located within easy reach of the relevant medicallaboratories by road due to the safe handling requirements of the shielded containers.
The specific requirements for molybdenum-99 production appear to be very demanding for apower reactor prospectively located in South Australia. The accessible market for this productwithin reach of any site would be likely to be quite limited.
4.3.4 NEUTRON IRRADIATION OF SILICON
The irradiation of silicon and other materials can be used to produce desirable characteristics forsemiconductor devices. There is a significant demand for irradiation of silicon from semiconductormanufacturers with a current worldwide demand of the order of 200 t/y. The wider application ofelectric vehicles, for example, would have the potential to increase this market significantly.
The process involves the exposure of 200-300 mm silicon ingots in the intense neutron flux in anuclear reactor for a period of between 2 and 100 hours (International Atomic Energy Agency,2012). The process requires specific facilities for introducing the ingots into the reactor and forremoving them and cooling them in both a literal sense of reducing their temperature and in anuclear sense of allowing the induced radioactivity to decay.
Currently up to about 30 t/y silicon ingots are irradiated at particular nuclear research reactorswhere staff have the appropriate skills to control the process to give assured product quality. Itdoes not appear that any commercial power reactors are equipped or used for such purposes.
While any reactor design can be equipped to insert samples into the high neutron flux region ofthe core, the only type of reactor which is designed to incorporate such features is the pool typeresearch reactor. These reactors are typically contained in a vessel through which various verticalexperiment tubes pass. The vessel is usually filled with heavy water as a moderator, while thereactor core is cooled by circulating cooling water. The reactor is located at the bottom of a pool ofwater that acts a radiation shield for operators above who may nevertheless observe and controlthe insertion and removal of experimental samples or ingots for treatment.
The World Nuclear Association reported that the HIFAR reactor at Lucas Heights in New SouthWales earned US$ 2.5m/y from irradiating silicon ingots. It is estimated that the newer OPALreactor operated by ANSTO, which has facilities better matched to the process earns US$5-10mper year for irradiating about 25 t/y of silicon. This is reported to represent about 15% of the worldmarket in silicon irradiation services.
A large irradiation facility incorporated into a commercial reactor could handle substantial amountsof silicon, but it would be likely to depress the market price so that revenue would not exceedUS$30m. The facility could have the capacity to irradiate very large amounts of silicon e.g.500 t/y, but this could not be justified on the basis of the current market size.
None of the commercial reactor types considered in this study have standard facilities to providesilicon irradiation services. However, the pressurised heavy water reactor would perhaps be mostsimply modified to include the facility. Such modification would add significant costs for additionalreactor features, materials handling and necessary shielded cooling facilities to receive theirradiated silicon. The additional function of the plant would require specific staff to manage andoperate the facility which would also increase operating costs.
Without a detailed assessment of the full implications and costs of adding a silicon irradiationfacility it is difficult to confirm the viability or otherwise of including the feature. However the netadditional revenue after operating costs would appear to be insufficient to justify the costs, andtechnical and regulatory risks of making a significant change to an established reactor design andproviding considerable additional handling facilities.

24
WSP | Parsons BrinckerhoffFebruary 2016
Project No 2265048A-STC-REP-004 Rev1Final ReportNuclear Fuel Cycle Royal Commission
5 REGULATION5.1 EXISTING REGULATORY ENVIRONMENT
Activities involving the use, handling and transport of radioactive substances in South Australiaare primarily governed by the Radiation Protection and Control Act, 1982 and Regulations. ThisAct provides for the control of activities related to radioactive substances and radiation apparatus,and for protecting the environment and the health and safety of people against the harmful effectsof radiation. The Act is regulated by the Radiation Protection Branch of the South AustralianEnvironment Protection Authority and its delegated Radiation Protection Committee.
The Minister and Radiation Protection Committee must, in exercising and discharging powers,function and duties under the Act and any other person must, in carrying on an activity related toradioactive substances or ionising radiation apparatus, endeavour to ensure that exposure ofpersons to ionising radiation is kept as low and reasonably achievable, social and economicfactors being taken into account.
In addition to the primary regulation via the Radiation Protection and Control Act, 1982 there are anumber of other South Australian and Commonwealth Acts and regulatory processes that are alsorelevant. In general these Acts address the protection of Aboriginal heritage, regulation of landuse through planning approvals, the supply and distribution of electricity, protection of Europeanheritage, regulation of exploration and mining activities, the enhancement and protection of nativevegetation, and environmental protection and pollution control.
Table 5.1 Relevant South Australian legislation
ACT OBJECTIVE
Aboriginal Heritage Act, 1988 Provides for the protection and preservation of Aboriginal sites,objects and human remains (including burials).
Climate Change andGreenhouse EmissionsReduction Act, 2007
Provides for measures to assist in the achievement of ecologicallysustainable development in the State by addressing issuesassociated with climate change and to promote commitment to actionwithin the State to address climate change.
Development Act, 1993 Provides the process for the assessment and approval ofdevelopments and projects including the construction of new buildingsand Major Projects.
Electricity Act, 1993 Regulates the generation, transmission and distribution of electricity.
Environment Protection Act,1993
Provides for the protection of the environment including theestablishment of the Environment Protection Authority.
Heritage Places Act, 1993 Provides for the identification, recording and conservation of placesand objects of non-Aboriginal heritage significance.
Mines and Works InspectionAct, 1920
Provides the regulation of safety and amenity aspects of mines andassociated works.
Mining Act, 1971 Provides the process for the assessment, approval and regulation ofexploration and mining operations, including the milling andprocessing of ores.

25
WSP | Parsons BrinckerhoffFebruary 2016
Project No 2265048A-STC-REP-004 Rev1Final ReportNuclear Fuel Cycle Royal Commission
ACT OBJECTIVE
Native Title (South Australia)Act, 1994
Outlines the existence of native title, native title rights, compensationfor extinguishment or impairment of native title and acquisition ofnative title in land, or entry to native title land or any other matterrelated to native title.
Native Vegetation Act, 1991 Regulates the preservation and enhancement of native vegetationand the control of clearance of native vegetation.
National Parks and Wildlife Act,1972
Designed to allow for the establishment and maintenance of a systemof reserves, as well as the protection of threatened species of floraand fauna.
Natural Resource ManagementAct, 2004
Promotes sustainable and integrated management of naturalresource.
Nuclear Waste Storage Facility(Prohibition) Act, 2000
Prohibits the establishment of certain nuclear waste storage facilitiesin South Australia.
Pastoral Land Management andConservation Act, 1989
Makes provision for the management and conservation of (Crownowned) pastoral land.
Radiation Protection Act, 1982 Provides for the control of activities related to radioactive substancesand radiation apparatus, and for protecting the environment and thehealth and safety of people. Is regulated by the Radiation ProtectionBranch of the South Australian Environment Protection Authority.
Roxby Downs (IndentureRatification) Act, 1982
To provide a specific indenture between the State of South Australiaand the mining operator of the Olympic Dam Mine.
Work Health and Safety Act,2012
To secure the health, safety and welfare of persons at work; to protectthe public against risks to health or safety arising out of, or inconnection with, the activities of persons at work or the use oroperation of various types of machinery.
In addition to the South Australian legislation, the Government of Australia established theAustralian Radiation Protection and Nuclear Safety Agency and its framework the AustralianRadiation Protection and Nuclear Safety Act, 1998 to regulate parts of the nuclear fuel cycle.
In safeguarding Australian uranium from use for military purposes the Government of Australiaalso established the Australian Safeguards Office and the Nuclear Non-Proliferation (Safeguards)Act, 1987. This Act makes provision in relation to the non-proliferation of nuclear weapons and toestablish, in accordance with certain international treaties and agreements to which Australia is aparty, a system for the imposition and maintenance of nuclear safeguards in Australia. Theregulatory framework includes a permitting system for the establishment of nuclear facilities toensure that appropriate control measures are in place for the physical security of nuclearmaterials.
Table 5.2 Relevant Commonwealth legislation
ACT OBJECTIVE
Australian Radiation Protectionand Nuclear Safety Act 1998
Provides for the regulation of activities involving radiation, includingthe control of material, apparatus and facilities, as well as theformation of the Radiation Health and Safety Advisory Council.
Atomic Energy Act 1953 Provides for the regulation of prescribed substances, including thediscovery of radioactive materials within Commonwealth territories, aswell as the authority to mine the Ranger Uranium Mine.

26
WSP | Parsons BrinckerhoffFebruary 2016
Project No 2265048A-STC-REP-004 Rev1Final ReportNuclear Fuel Cycle Royal Commission
ACT OBJECTIVE
Australian Nuclear Science andTechnology Organisation Act1987
An Act relating to the establishment of the Australian Nuclear Scienceand Technology Organisation, the governing body to oversee themanagement of radioactive materials and radioactive wastegenerated, possessed or controlled by the Commonwealth or aCommonwealth entity.
Environment Protection andBiodiversity Conservation Act1999
An Act relating to the protection of the environment and theconservation of biodiversity, and for related purposes. In particular therequirement for approval of nuclear actions including but not limited toestablishing a nuclear installation.
National Radioactive WasteManagement Act 2012
An Act to make provision in relation to the selection of a site for, andthe establishment and operation of, a radioactive waste managementfacility.
Nuclear Non-Proliferation(Safeguards) Act 1987
An Act to make provision in relation to the non-proliferation of nuclearweapons and to establish, in accordance with certain internationaltreaties and agreements to which Australia is a party, a system for theimposition and maintenance of nuclear safeguards in Australia.
5.2 LEGISLATIVE BARRIERS
Currently there are several regulatory barriers to the establishment and operation of nuclearfacilities and activities in Australia, and South Australia in particular.
At the State level the Nuclear Waste Storage Facility (Prohibition) Act, 2000 mandates against:
à the construction or operation of nuclear waste storage facility;
à the importation or transportation of nuclear waste for delivery to nuclear waste storagefacility.
In addition the Radiation Protection and Control Act, 1982 whilst regulating the use, handling andtransport of radioactive substances in South Australia prohibits the conversion or enrichment ofuranium.
At the Federal level the Environment Protection and Biodiversity Conservation Act, 1999 (theEPBC Act) mandates the protection of the environment from nuclear actions, including:
à establishing or significantly modifying a nuclear installation;
à transporting spent nuclear fuel or radioactive waste products arising from reprocessing;
à establishing or significantly modifying a facility for storing radioactive waste products arisingfrom reprocessing;
à mining or milling uranium ore;
à establishing or significantly modifying a large-scale disposal facility for radioactive waste;
à decommissioning or rehabilitating any facility or area in which an activity described abovehas been undertaken.
In essence the Minister for the EPBC Act must not approve an action consisting of or involving theconstruction or operation of a nuclear fuel fabrication plant, nuclear power plant, enrichment plantor a reprocessing facility.
These legislative barriers to the development of nuclear facilities are as described in Table 5.3below.
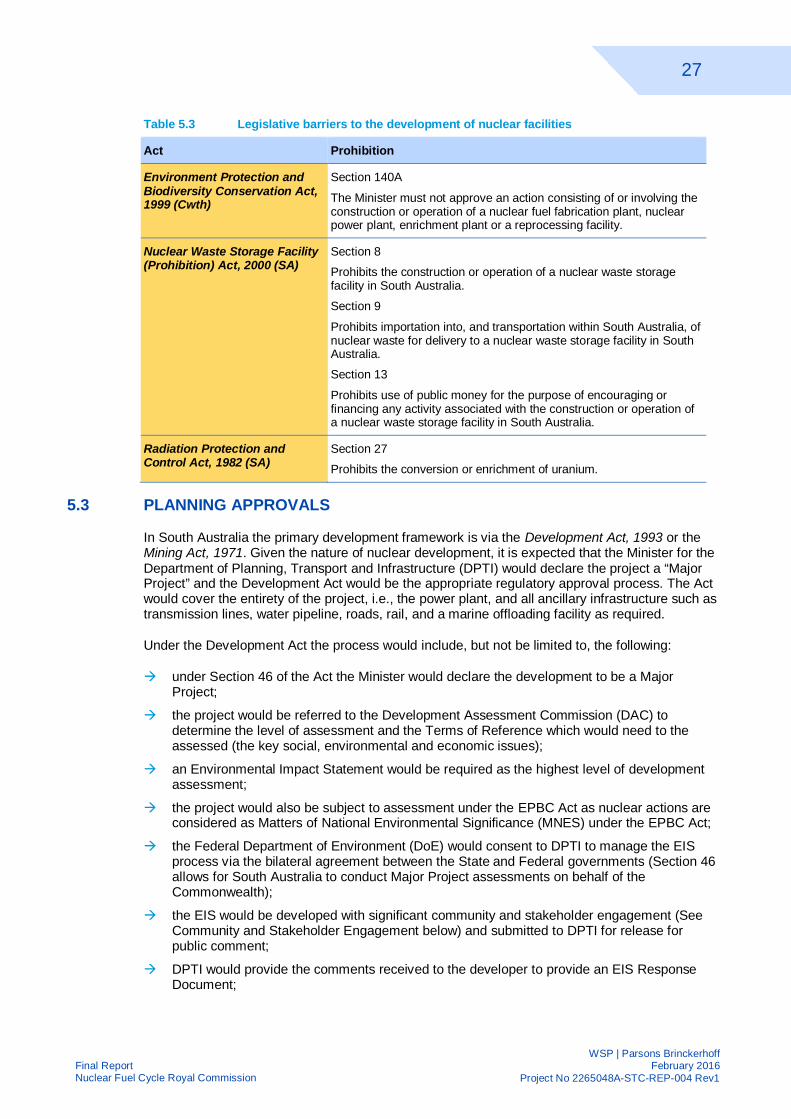
27
WSP | Parsons BrinckerhoffFebruary 2016
Project No 2265048A-STC-REP-004 Rev1Final ReportNuclear Fuel Cycle Royal Commission
Table 5.3 Legislative barriers to the development of nuclear facilities
Act Prohibition
Environment Protection andBiodiversity Conservation Act,1999 (Cwth)
Section 140A
The Minister must not approve an action consisting of or involving theconstruction or operation of a nuclear fuel fabrication plant, nuclearpower plant, enrichment plant or a reprocessing facility.
Nuclear Waste Storage Facility(Prohibition) Act, 2000 (SA)
Section 8
Prohibits the construction or operation of a nuclear waste storagefacility in South Australia.
Section 9
Prohibits importation into, and transportation within South Australia, ofnuclear waste for delivery to a nuclear waste storage facility in SouthAustralia.
Section 13
Prohibits use of public money for the purpose of encouraging orfinancing any activity associated with the construction or operation ofa nuclear waste storage facility in South Australia.
Radiation Protection andControl Act, 1982 (SA)
Section 27
Prohibits the conversion or enrichment of uranium.
5.3 PLANNING APPROVALS
In South Australia the primary development framework is via the Development Act, 1993 or theMining Act, 1971. Given the nature of nuclear development, it is expected that the Minister for theDepartment of Planning, Transport and Infrastructure (DPTI) would declare the project a “MajorProject” and the Development Act would be the appropriate regulatory approval process. The Actwould cover the entirety of the project, i.e., the power plant, and all ancillary infrastructure such astransmission lines, water pipeline, roads, rail, and a marine offloading facility as required.
Under the Development Act the process would include, but not be limited to, the following:
à under Section 46 of the Act the Minister would declare the development to be a MajorProject;
à the project would be referred to the Development Assessment Commission (DAC) todetermine the level of assessment and the Terms of Reference which would need to theassessed (the key social, environmental and economic issues);
à an Environmental Impact Statement would be required as the highest level of developmentassessment;
à the project would also be subject to assessment under the EPBC Act as nuclear actions areconsidered as Matters of National Environmental Significance (MNES) under the EPBC Act;
à the Federal Department of Environment (DoE) would consent to DPTI to manage the EISprocess via the bilateral agreement between the State and Federal governments (Section 46allows for South Australia to conduct Major Project assessments on behalf of theCommonwealth);
à the EIS would be developed with significant community and stakeholder engagement (SeeCommunity and Stakeholder Engagement below) and submitted to DPTI for release forpublic comment;
à DPTI would provide the comments received to the developer to provide an EIS ResponseDocument;

28
WSP | Parsons BrinckerhoffFebruary 2016
Project No 2265048A-STC-REP-004 Rev1Final ReportNuclear Fuel Cycle Royal Commission
à DPTI would assess the project and provide approval subject to conditions and offsets.
It is entirely possible that the government of South Australia would instate an Indenture Act forsuch a development such that all aspects of the project are regulated by a one stop shopframework.
5.4 COMMUNITY AND STAKEHOLDER ENGAGEMENT
This section provides an outline of the key considerations for community and stakeholderengagement for establishing a nuclear power station and systems in South Australia. Thisincludes consideration of the South Australian State Government’s guidelines for engagement,industry frameworks, regulatory requirements and WSP | Parsons Brinckerhoff’srecommendations on the key social aspects that should be considered for a project of this nature.It is also recommended that consideration is also undertaken once the findings are concludedfrom the Nuclear Fuel Cycle Royal Commission in relation to Topic 13: Community Engagementand Nuclear Facilities.
5.4.1 KEY PRINCIPLES OF ENGAGEMENT TO BE CONSIDERED
5.4.1.1 SOUTH AUSTRALIA GOVERNMENT’S BETTER TOGETHER: PRINCIPLES OFENGAGEMENT
The South Australian State Government released guidelines in 2013 to engage with communitiesand stakeholders in major decisions, entitled Better Together: Principles of Engagement(Department of the Premier and Cabinet, South Australia, 2013). These guidelines highlight sixprinciples to ensure good engagement strategy is developed and implemented.
The six principles of engagement in summary are:
1. We know why we are engaging and we communicate this clearly: This principle is aboutdefining the engagement rationale and measurable objectives, understanding the public’slevel of influence in shaping the objectives and communicating this clearly to the communityand stakeholders.
2. We know who to engage: This principle involves defining the community and stakeholdersthat should be included in the engagement process including mapping out who is affected,who is interested, who are the influencers, opinion leaders and knowing the community.
3. We know the history and the background: This principle is about understanding previoushistory and engagement with the community. It includes proactively understanding keyconcerns and issues that may be relevant.
4. We begin early: This principle is about ensuring engagement commences early andopportunities for involvement exists prior to decisions are being made. This includes formingrelationships with the community and stakeholders, working together to identify thechallenges faced and commencing a process towards working together to develop solutionsto the challenges and issues.
5. We are genuine: This principle is about active listening to understand stakeholder andcommunity issues, concerns and interests. It is also about being open, honest andtransparent in communication.
6. We are creative, relevant and engaging: This principle is about using tools and techniquesthat are appropriate and will provide the most effective and highest level of involvementrequired for project’s decision making. It is also about designing engagement activities thatare creative to capture an audience’s participation and to capture a wide range of communityand stakeholders.

29
WSP | Parsons BrinckerhoffFebruary 2016
Project No 2265048A-STC-REP-004 Rev1Final ReportNuclear Fuel Cycle Royal Commission
5.4.1.2 INTERNATIONAL ASSOCIATION OF PUBLIC PARTICIPATION
The International Association of Public Participations (IAP2) exists to advance the practice ofcommunity and stakeholder engagement and provides a framework from which industry andgovernment can better engage with stakeholders and the community. IAP2 Australasia is theleading public participation Association in Australia. When developing an engagement process, itis recommended that there is consideration of the core values of IAP2 including:
1. Public participation is based on the belief that those who are affected by a decision have aright to be involved in the decision-making process.
2. Public participation includes the promise that the public's contribution will influence thedecision.
3. Public participation promotes sustainable decisions by recognising and communicating theneeds and interests of all participants, including decision makers.
4. Public participation seeks out and facilitates the involvement of those potentially affected byor interested in a decision.
5. Public participation seeks input from participants in designing how they participate.
6. Public participation provides participants with the information they need to participate in ameaningful way.
7. Public participation communicates to participants how their input affected the decision.
IAP2’S PUBLIC PARTICIPATION SPECTRUM
The IAP2 Federation (2014) developed a Public Participation Spectrum to assist in define thepublic’s role in any public participation process. IAP2 state that this is quickly becoming aninternational standard.
Figure 5.1 IAP2 Public Participation Spectrum
Source: (IAP2 International Federation, 2014)

30
WSP | Parsons BrinckerhoffFebruary 2016
Project No 2265048A-STC-REP-004 Rev1Final ReportNuclear Fuel Cycle Royal Commission
5.4.2 ENGAGEMENT DURING ENVIRONMENTAL ASSESSMENT AND APPROVALS
It is recommended that engagement and consultation commences early and prior to theenvironmental approvals phase of a project, however there are general expectations andguidelines that will need to be taken into consideration when preparing an Environment ImpactStatement under the Australian Environment Protection and Biodiversity Conservation Act 1999and a Major Development requiring an EIS under the State’s Development Act 1993.
These include planning and implementing an engagement program that provides opportunities forcommunity and stakeholder involvement and education throughout the EIS assessment andapprovals process. The EIS will also need to provide an outline of the public consultation processthat has taken place during the preparation of the EIS including the outcome and results of theconsultation.
Furthermore, it is expected that for a major development such as this, there would be a need toinclude a socio-economic impact assessment that identifies and assesses the social andeconomic impacts and benefits of the development on the existing socio-economic environment.This would include understanding the existing profile of the community, predication of the impactsand benefits, the potential consequences and includes identification of prevention, managementand mitigation measures throughout the life cycle of the project.
There would also be a formal consultation process whereby the community and stakeholders aregiven an opportunity to provide a submission on the EIS report under a regulatory set exhibitionperiod timeframe and a submission report would be prepared to address issues raised prior to adetermination being made.
Also to be considered under the EPBC Act 1999, is the potential for a public inquiry. An office ofCommissioner is established and this person is empowered to undertake a public inquiry into theenvironmental and other impacts of a proposed action if required. A public inquiry provides themost thorough process of environmental assessment. On completion of the inquiry, theCommissioner must report to the Minister.
5.4.3 KEY SOCIAL ASPECTS TO BE CONSIDERED
In summary and conclusion, the key social aspects recommended to be considered indevelopment of the community and stakeholder engagement approach for a nuclear power plantin South Australia include:
à Design and implementation of an engagement process that enables the community andstakeholders to influence and/or have direct involvement in the decisions that will potentiallyaffect them and the wider and diverse community and stakeholders.
à Early and ongoing engagement with the community and stakeholders to identify socialvalues, issues and aspects to be considered during all phases of the development of anuclear power station in South Australia.
à Design and delivery of a community and stakeholder engagement plan as part of thebusiness case, need and justification of the project; identification and assessment of siteoptions; design aspects; engagement throughout the environmental assessment processincluding mitigation of potential impacts and the enhancement of benefits to the community;and engagement in planning for operation and closure.
à Assessment of the potential impacts and benefits of a nuclear power plant development onthe existing socio-economic environment and engagement with stakeholders on the potentialsolutions and measures to alleviate negative impacts throughout the project’s life-cycle fromfeasibility to closure.

31
WSP | Parsons BrinckerhoffFebruary 2016
Project No 2265048A-STC-REP-004 Rev1Final ReportNuclear Fuel Cycle Royal Commission
à Providing responsive, adequate and transparent information and education about nuclearenergy that addresses key issues and perceptions around safety and understanding theimpacts and benefits from a social, environmental and economic perspective. This mayinclude providing access to local and international technical experts, information and currentresearch.

32
WSP | Parsons BrinckerhoffFebruary 2016
Project No 2265048A-STC-REP-004 Rev1Final ReportNuclear Fuel Cycle Royal Commission
6 COST AND PERFORMANCE ESTIMATESThis section of the report summarises the cost estimates adopted for each technology (includingcapital costs, operating costs, and fuel costs) and the performance estimates adopted (includingMW capacity, availability, and development timescales). These inputs feed into the commercialanalysis which is discussed separately in Section 7.
While certain specific vendor technologies are referred to directly in the following sections, thisshould not be interpreted as a judgment that these are the only options that should be considered.There are a number of potential nuclear plant designs that could, under some scenarios beavailable for operation in 2030 and, if the operating period is extended to a date like 2035 or later,even more options could be viable.
The derivation of these costs is given in more detail in document number 2265048A-STC-REP-002 Detailed Estimate. The following sections summarise the derived costs. Note that some costcategories incur costs in both Australian dollars and offshore currencies, which in turn have beensummarised in US dollars. For the avoidance of doubt, please note that the onshore costsdetailed in AU$ and the offshore costs detailed in US$ would both be incurred; the data shouldnot be interpreted as being the currency equivalents of each other.
6.1 PRE-CONSTRUCTION CAPITAL COSTS
Cost estimates have been derived from costs recently experienced in the US market. Whilst theyare based on US experience, it is believed that they are reasonably consistent with what would beexperienced in Australia, though without an established regulatory framework for nuclear powergeneration in Australia, it is not possible to be more certain.
It has also been assumed that for all of the reactor technologies of whatever type and capacity, acommon pre-construction regime would be required encompassing all development, siteidentification and investigations, regulatory licensing, permitting, approvals and public inquiries,and similar timeframes and expenditure requirements would apply.
Given the lack of a regulatory framework in Australia, we have adopted a wide range ofuncertainty in the estimate. Jurisdictional first of a kind issues, and the likely need for in-depthinvestigations and inquiries may well drive the cost towards the high-range estimate.
In the event that standardisation and modularisation is effective in SMR designs, it may bepossible for SMRs to be licenced and approved with a “lighter touch” regulatory regime. In suchcircumstances, the cost may be lower, but the timeframe is unlikely to be much reduced belowthat estimated for our central case.
The resulting common assumptions adopted are presented in Table 6.1.
Table 6.1 Pre-construction capital costs ($m 2014)
Project Development Regulatory/Licensing
LowAU$ 156 27
US$ 31 10
Central AU$ 311 44
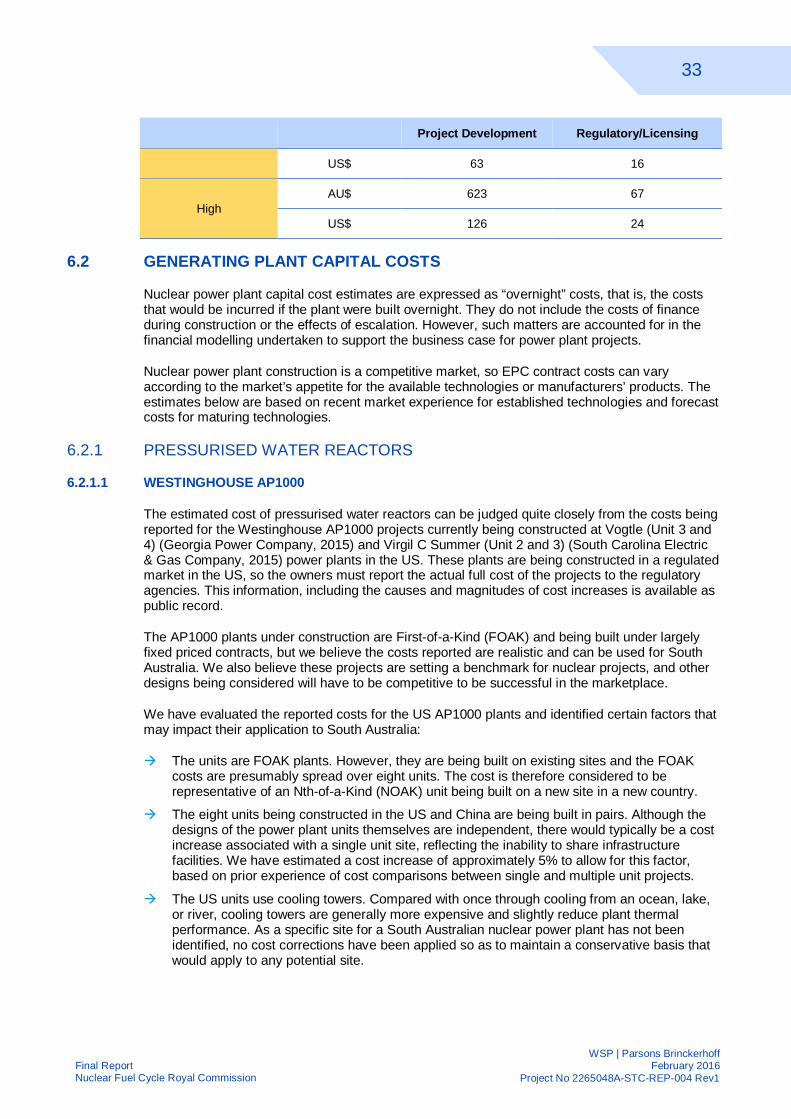
33
WSP | Parsons BrinckerhoffFebruary 2016
Project No 2265048A-STC-REP-004 Rev1Final ReportNuclear Fuel Cycle Royal Commission
Project Development Regulatory/Licensing
US$ 63 16
HighAU$ 623 67
US$ 126 24
6.2 GENERATING PLANT CAPITAL COSTS
Nuclear power plant capital cost estimates are expressed as “overnight” costs, that is, the coststhat would be incurred if the plant were built overnight. They do not include the costs of financeduring construction or the effects of escalation. However, such matters are accounted for in thefinancial modelling undertaken to support the business case for power plant projects.
Nuclear power plant construction is a competitive market, so EPC contract costs can varyaccording to the market’s appetite for the available technologies or manufacturers’ products. Theestimates below are based on recent market experience for established technologies and forecastcosts for maturing technologies.
6.2.1 PRESSURISED WATER REACTORS
6.2.1.1 WESTINGHOUSE AP1000
The estimated cost of pressurised water reactors can be judged quite closely from the costs beingreported for the Westinghouse AP1000 projects currently being constructed at Vogtle (Unit 3 and4) (Georgia Power Company, 2015) and Virgil C Summer (Unit 2 and 3) (South Carolina Electric& Gas Company, 2015) power plants in the US. These plants are being constructed in a regulatedmarket in the US, so the owners must report the actual full cost of the projects to the regulatoryagencies. This information, including the causes and magnitudes of cost increases is available aspublic record.
The AP1000 plants under construction are First-of-a-Kind (FOAK) and being built under largelyfixed priced contracts, but we believe the costs reported are realistic and can be used for SouthAustralia. We also believe these projects are setting a benchmark for nuclear projects, and otherdesigns being considered will have to be competitive to be successful in the marketplace.
We have evaluated the reported costs for the US AP1000 plants and identified certain factors thatmay impact their application to South Australia:
à The units are FOAK plants. However, they are being built on existing sites and the FOAKcosts are presumably spread over eight units. The cost is therefore considered to berepresentative of an Nth-of-a-Kind (NOAK) unit being built on a new site in a new country.
à The eight units being constructed in the US and China are being built in pairs. Although thedesigns of the power plant units themselves are independent, there would typically be a costincrease associated with a single unit site, reflecting the inability to share infrastructurefacilities. We have estimated a cost increase of approximately 5% to allow for this factor,based on prior experience of cost comparisons between single and multiple unit projects.
à The US units use cooling towers. Compared with once through cooling from an ocean, lake,or river, cooling towers are generally more expensive and slightly reduce plant thermalperformance. As a specific site for a South Australian nuclear power plant has not beenidentified, no cost corrections have been applied so as to maintain a conservative basis thatwould apply to any potential site.

34
WSP | Parsons BrinckerhoffFebruary 2016
Project No 2265048A-STC-REP-004 Rev1Final ReportNuclear Fuel Cycle Royal Commission
à The US retains a reasonable infrastructure of nuclear engineering, construction expertiseand component suppliers to support new nuclear units; Australia will have to import much ofthis support, which might tend to increase costs. However, the increasing rate of nuclearconstruction should result in a more robust and widespread international nuclearinfrastructure in the future. Therefore, no specific adjustment for integration of foreignsuppliers was applied.
à The reported costs of the Vogtle and Summer projects differ by over 10%, with Vogtle beinghigher than Summer. Some of this may reflect contractual and site differences and somemay reflect the original intent that Vogtle be the lead unit (the schedules are virtuallyconcurrent at present). In order to estimate an NOAK cost for a South Australian power plant,the Vogtle and Summer costs have been averaged.
6.2.1.2 OTHER MANUFACTURERS
The recent Korean supply of four 1,400 MWe units for Barakah in the United Arab Emirates had awidely reported fixed price contract value of US$5b per reactor, equivalent to approximatelyUS$3,500/kWe. This appears to challenge the market level for the AP1000, since the content andschedule of the projects should be similar. However, there are several reasons why the UAE costmay be less.
à The larger unit size of 1,400 MWe will result in additional economies of scale compared withthe 1,125 MWe AP1000.
à The fixed price contract does not appear to include some infrastructure and project supportactivities which are being directly implemented by the plant owner.
à The cost of the plants may be accurate but the contract, as Korea’s first major nuclear exportproject, may not contain the type of risk margins that might normally be expected in aUS$20b fixed price contract.
à The construction contract is accompanied by a US$10b operation and fuel contract that maywell be more profitable than the construction contract.
6.2.1.3 PWR SUMMARY
The base-case overnight capital cost has been estimated to be US$5,700/kWe, based on theadjusted Vogtle and Summer pricing, and a five-year construction programme.
The primary source of uncertainty in the costing is the possibility of schedule variation. There is apossibility, albeit unlikely, that the construction programme would be shorter than the estimatedfive years. By the time that a decision would be made for a South Australian nuclear power plantproject to proceed, several similar power plants would have been built in the US and elsewhere,which would give much greater certainty to the construction schedule. Lessons learned andincorporated into project planning might reasonably be assumed to result in a reduction of theschedule of up to one year, which would result in a corresponding reduction in cost. More likely,however, is the possibility that the construction programme will run longer than five years, owingto the project being a first-of-a-kind project in Australia. If the programme were to overrun by twoyears, we estimate that the cost will increase by approximately $300/kWe per annum. The lowand high case overnight capital costs have therefore been estimated to be US$5,300/kWe andUS$6,300/kWe respectively.
The AP1000 cost information has been used as a benchmark from which to estimate capital costsof other large reactor technologies. Whilst there are a number of reports available listing costsassociated with completed or proposed projects, the data is not as accessible and therefore notas assured as that associated with the AP1000 projects, and therefore has a higher level ofuncertainty.

35
WSP | Parsons BrinckerhoffFebruary 2016
Project No 2265048A-STC-REP-004 Rev1Final ReportNuclear Fuel Cycle Royal Commission
6.2.2 BOILING WATER REACTORS
Boiling water technologies, as promoted by GE-Hitachi in the ABWR and ESBWR variants arecompeting in much the same markets as the AP1000. Those built to date in Japan and Taiwan donot openly publicise their outturn costs; as such, we have assumed that competitive markets willcompel successful technologies to achieve similar price points. We have therefore estimated theovernight capital cost of BWR technologies to be of the same range as PWR technologies. Thecentral case overnight capital cost estimate for the BWR category is adopted at US$5,700/kWe,with low and high extremes of US$5,300/kWe and US$6,300/kWe respectively.
6.2.3 PRESSURISED HEAVY WATER REACTORS
PHWR designs currently being offered by CANDU are sufficiently different from recent PWRplants to make a direct comparisons questionable. Neither of the currently offered CANDUdesigns have yet been built, nor do they have firm project schedules. Data from any earlier unitsis now somewhat dated – the most recent operating units in Canada started construction about 30years ago and international units (Romania and China) about 20 years ago.
Reviews of the historical costs of earlier CANDU designs in comparison with light water reactorsof the same era indicate the capital cost of CANDU units to be higher. The last CANDU units builtin Canada (Darlington) went into service around 1990 with a final cost of well over US$3,000/kWe(1990 base). The most recent report of a CANDU EC6 cost was an offering by China to providetwo units to Romania at a cost of about US$6,000/kWe. For the purposes of this study, we haveestimated the base-case overnight capital cost to be approximately 10% greater than that of theAP1000, but have estimated that there is likely to be a wider variation in cost from a low case costequal to that of the AP1000 low range case, to a high case somewhat greater than that of theAP1000. The central case overnight capital cost for the PHWR category is estimate to beUS$6,300/kWe, with a low and high case cost of US$5,300/kWe and US$7,300/kWe respectively.
6.2.4 SMALL MODULAR REACTORS
Small modular reactors are new technologies with no publically available as-built costs on whichto base estimates. However, a recent independent study conducted by the UK National NuclearLaboratory in December 2014 (National Nuclear Laboratory, et al., 2014) included a review ofFOAK cost information supplied by four leading SMR developers. The study team reviewed andanalysed the cost data and made adjustments to each in order to place them on as equal afooting as possible, resulting in the overnight capital costs shown in Table 6.2.
Table 6.2 Overnight FOAK capital cost estimates for SMRs – National Nuclear Laboratory (UK)
US$/kW Project 1 Project 2 Project 3 Project 4
Unadjusted 5,607 7,384 6,423 7,697
Adjusted 6,380 8,861 8,030 8,850
Source: National Nuclear Laboratory (UK), Small Modular Reactors Feasibility Study, figure 20
The estimates in Table 6.2 are FOAK estimates; NOAK estimates should allow for learningeconomies, economies of multiplies, and economies of scale, and would therefore be expected tobe somewhat lower than FOAK costs. It is also reasonable to assume that SMR costs will becomereasonably competitive with the costs of large-scale power plants in order to be successful.Therefore the overnight capital cost estimates should be relatively close to the previousassumptions for the BWR/PWR designs.

36
WSP | Parsons BrinckerhoffFebruary 2016
Project No 2265048A-STC-REP-004 Rev1Final ReportNuclear Fuel Cycle Royal Commission
For the purposes of this study we estimate that by 2025-2030, the overnight capital cost of plantsequipped with the Large SMR class of reactor such as the Babcock and Wilcox mPower reactorwould have a specific cost approximately 5% greater than the large-scale PWR / BWR costsestimates. Plants equipped with the Small SMR class of reactor (e.g. NuScale) would be slightlymore expensive owing to being disadvantaged by the economies of scale enjoyed by their largercousins. We estimate the specific cost of Small SMR plants would be approximately 10% greaterthan that of the Large SMR plants.
The base-case overnight capital cost of Large SMR plants is estimated to be US$6,000/kWe,ranging from a low of US$5,100/kWe to a high of US$7,200/kWe. The base-case overnight capitalcost of Small SMR plants is estimated to be US$6,600/kWe, ranging from a low of US$5,600/kWeto a high of US$7,900/kWe.
6.2.5 IMPORTED VS. AUSTRALIAN CONTENT
The overnight capital costs discussed above are all expressed in US dollar terms, as is customaryin the nuclear power plant construction industry. However, should a nuclear power plant projectproceed in South Australia, expenditure would actually be incurred in a suite of currenciesdepending on the sources of the equipment and services being supplied to the project.Predominantly, expenditure would be incurred in Australian dollars and the currency of the homecountry of the principal supplier of the nuclear reactor technology being used. For the purposes ofthis study, we have assumed that whichever technology is finally selected for implementation, wewill use US dollars as a proxy for the overseas currency.
In order to identify the relative proportions of Australian and US dollars in the capital costsestimated for each technology, we have taken a three-step approach. The first step is to identifythe proportion of expenditure that should be allocated to each component of capital expenditure.A widely referenced study by the University of Chicago summarised the percentage distribution ofcapital costs for a mature design ABWR (see Table 6.3) (The University of Chicago, 2004). Steptwo was then to estimate within each component, or “account” as it is termed in the table, whatproportion of expenditure would be attributable to imported and to Australian content, and withinthe Australian content, what proportion would be attributable to South Australian content. This issummarised in Table 6.4. Step three was to combine these to determine what percentage of thewhole cost is attributable to each component in each jurisdiction’s content (see Table 6.5), andstep four was to aggregate the percentages by currency to determine the relative proportions ofAustralian and US dollars in the NPP capital cost estimate.
The tables outline the process for large-scale nuclear power plants. We performed a similarexercise for SMR power plants in order to develop currency-based capital cost estimates for eachtechnology being studied.

37
WSP | Parsons BrinckerhoffFebruary 2016
Project No 2265048A-STC-REP-004 Rev1Final ReportNuclear Fuel Cycle Royal Commission
Table 6.3 Percentage distribution of overnight capital costs by account
Account Description FactoryEquipment
Cost(E)
SiteMaterial
Cost(M)
Site LabourCost
(L)
Account Costs asPercent of Total
Costs
21 Structures &improvements
1.6 4.5 7.7 13.8
22 Reactor plantequipment
17.0 0.9 2.5 20.4
23 Turbine plantequipment
12.5 0.5 1.7 14.7
24 Electric plantequipment
2.5 0.6 1.3 4.4
25 Miscellaneous. plantequipment
1.5 0.4 1.3 3.2
26 Main condenser heatrejection system
2.2 0.2 1.0 3.4
Total Direct Costs 37.3 7.0 15.4 59.8
91 Construction services 3.5 4.5 5.0 13.0
92 Engineering & homeoffice services
6.4 6.4
93 Field supervision &field office services
4.3 0.6 0.6 5.5
Total Indirect Costs 14.2 5.2 5.6 24.9
94 Owner’s cost 5.1 5.1
96 Contingency 10.2
Total 100.0

38
WSP | Parsons BrinckerhoffFebruary 2016
Project No 2265048A-STC-REP-004 Rev1Final ReportNuclear Fuel Cycle Royal Commission
Table 6.4 Proportions of each capital cost category attributed to imported and local content
Account Description Imported Content Australian Content
E M L E M L
21 Structures &improvements
0% 0% 0% 100% 100% 100%
22 Reactor plantequipment
95% 20% 50% 5% 80% 50%
23 Turbine plantequipment
95% 20% 20% 5% 80% 80%
24 Electric plant equipment 70% 20% 20% 30% 80% 80%
25 Miscellaneous. plantequipment
50% 20% 20% 50% 80% 80%
26 Main condenser heatrejection system
50% 20% 20% 50% 80% 80%
Total Direct Costs
91 Construction services 20% 20% 10% 80% 80% 90%
92 Engineering & homeoffice services
100% 100% 100% 0% 0% 0%
93 Field supervision & fieldoffice services
20% 20% 20% 80% 80% 80%
Total Indirect Costs
94 Owner’s cost 80% 20%
96 Contingency Applied proportionally to all categories
Total

39
WSP | Parsons BrinckerhoffFebruary 2016
Project No 2265048A-STC-REP-004 Rev1Final ReportNuclear Fuel Cycle Royal Commission
Table 6.5 Percentage distribution of capital cost by account and by jurisdiction
Account Description Imported(% of Total)
Australia(% of Total)
Total (cf.Table6.3)
E M L E M L
21 Structures &improvements
0.00% 0.00% 0.00% 1.60% 4.50% 7.70% 13.8%
22 Reactor plantequipment
16.15% 0.18% 1.25% 0.85% 0.72% 1.25% 20.4%
23 Turbine plantequipment
11.88% 0.10% 0.34% 0.63% 0.40% 1.36% 14.7%
24 Electric plantequipment
1.75% 0.12% 0.26% 0.75% 0.48% 1.04% 4.4%
25 Miscellaneous. plantequipment
0.75% 0.08% 0.24% 0.75% 0.32% 0.96% 3.1%
26 Main condenserheat rejectionsystem
1.10% 0.04% 0.20% 1.10% 0.16% 0.80% 3.4%
Total Direct Costs 31.63% 0.52% 2.29% 5.68% 6.58% 13.11% 59.8%
91 Constructionservices
0.70% 0.90% 0.50% 2.80% 3.60% 4.50% 13.0%
92 Engineering & homeoffice services
0.00% 0.00% 6.40% 0.00% 0.00% 0.00% 6.4%
93 Field supervision &field office services
0.86% 0.12% 0.12% 3.44% 0.48% 0.48% 5.5%
Total IndirectCosts
1.56% 1.02% 7.02% 6.24% 4.08% 4.98% 24.9%
94 Owner’s cost 0.00% 0.00% 4.08% 0.00% 0.00% 1.02% 5.1%
96 Contingency 3.04% 0.82% 2.19% 2.08% 0.56% 1.50% 10.2%
Total 36.22% 2.36% 15.58% 14.00% 11.22% 20.61% 100.0%
54.17% 45.83%
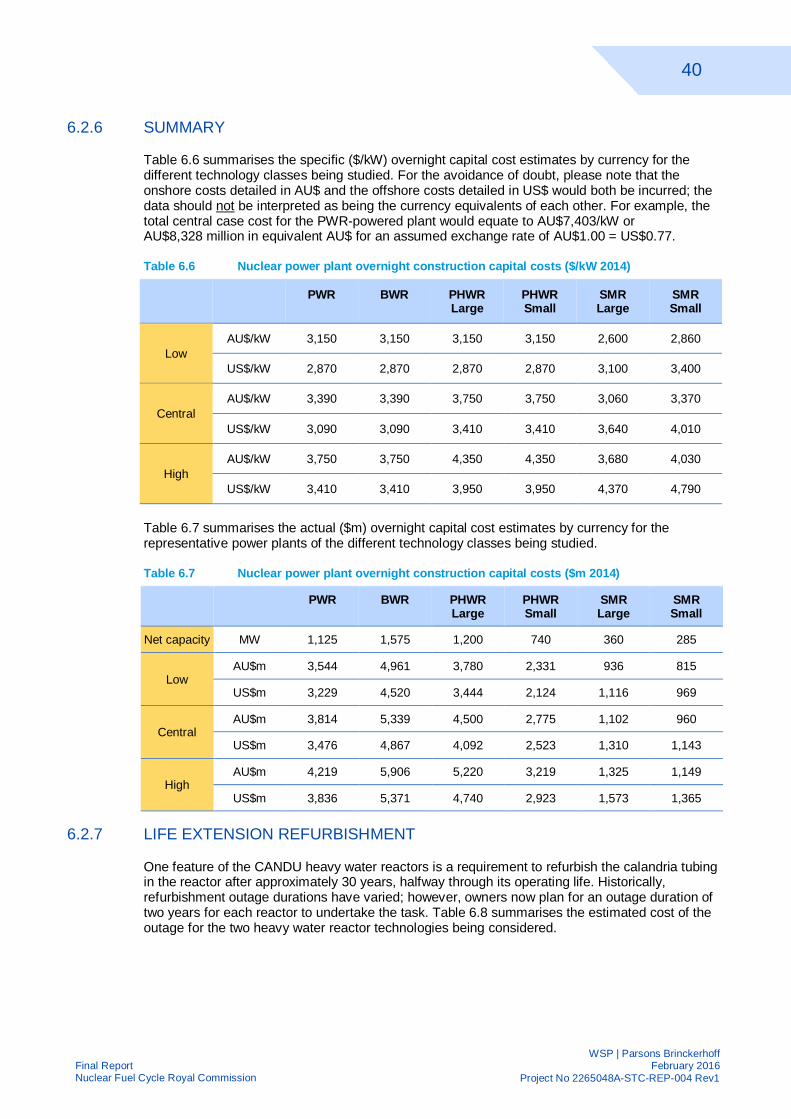
40
WSP | Parsons BrinckerhoffFebruary 2016
Project No 2265048A-STC-REP-004 Rev1Final ReportNuclear Fuel Cycle Royal Commission
6.2.6 SUMMARY
Table 6.6 summarises the specific ($/kW) overnight capital cost estimates by currency for thedifferent technology classes being studied. For the avoidance of doubt, please note that theonshore costs detailed in AU$ and the offshore costs detailed in US$ would both be incurred; thedata should not be interpreted as being the currency equivalents of each other. For example, thetotal central case cost for the PWR-powered plant would equate to AU$7,403/kW orAU$8,328 million in equivalent AU$ for an assumed exchange rate of AU$1.00 = US$0.77.
Table 6.6 Nuclear power plant overnight construction capital costs ($/kW 2014)
PWR BWR PHWRLarge
PHWRSmall
SMRLarge
SMRSmall
LowAU$/kW 3,150 3,150 3,150 3,150 2,600 2,860
US$/kW 2,870 2,870 2,870 2,870 3,100 3,400
CentralAU$/kW 3,390 3,390 3,750 3,750 3,060 3,370
US$/kW 3,090 3,090 3,410 3,410 3,640 4,010
HighAU$/kW 3,750 3,750 4,350 4,350 3,680 4,030
US$/kW 3,410 3,410 3,950 3,950 4,370 4,790
Table 6.7 summarises the actual ($m) overnight capital cost estimates by currency for therepresentative power plants of the different technology classes being studied.
Table 6.7 Nuclear power plant overnight construction capital costs ($m 2014)
PWR BWR PHWRLarge
PHWRSmall
SMRLarge
SMRSmall
Net capacity MW 1,125 1,575 1,200 740 360 285
LowAU$m 3,544 4,961 3,780 2,331 936 815
US$m 3,229 4,520 3,444 2,124 1,116 969
CentralAU$m 3,814 5,339 4,500 2,775 1,102 960
US$m 3,476 4,867 4,092 2,523 1,310 1,143
HighAU$m 4,219 5,906 5,220 3,219 1,325 1,149
US$m 3,836 5,371 4,740 2,923 1,573 1,365
6.2.7 LIFE EXTENSION REFURBISHMENT
One feature of the CANDU heavy water reactors is a requirement to refurbish the calandria tubingin the reactor after approximately 30 years, halfway through its operating life. Historically,refurbishment outage durations have varied; however, owners now plan for an outage duration oftwo years for each reactor to undertake the task. Table 6.8 summarises the estimated cost of theoutage for the two heavy water reactor technologies being considered.

41
WSP | Parsons BrinckerhoffFebruary 2016
Project No 2265048A-STC-REP-004 Rev1Final ReportNuclear Fuel Cycle Royal Commission
Table 6.8 Life extension refurbishment capital cost (US$m 2014)
PHWR Large PHWR Small
Low US$m 1,400 1,050
Central US$m 2,000 1,450
High US$m 2,600 1,900
6.3 INFRASTRUCTURE CAPITAL COSTS
6.3.1 ROAD INFRASTRUCTURE
Estimates of the road infrastructure required to provide access to the nuclear power plant havebeen based on the provision of a two-lane sealed highway from the power plant to an existingroad. Roads would be designed and constructed to appropriate national standards, and estimatesinclude reasonable allowances for lighting, drainage culverts and road furniture, in addition totraffic signalling at the intersection with the existing road.
The brownfield estimate assumes that only a short 1 km long spur road would be required toconnect the power plant to the existing road; the greenfield estimate assumes that a 50 km-longroad will be required. Estimated costs are based on unit rate costs of the various elements takenfrom recent experience of studies and road construction projects undertaken in South Australiaand are at current Australian dollar values.
Table 6.9 Roads infrastructure capital cost (AU$m 2014)
Brownfield Greenfield
Low AU$m 3.027 34.064
Central AU$m 3.784 42.580
High AU$m 5.676 63.454
In addition, we have estimated the cost of additional road infrastructure over and above the baseinfrastructure allowed for the greenfield and brownfield options.
Table 6.10 Specific cost of additional road (AU$k/km 2014)
Brownfield/ Greenfield
Low AU$k 670
Central AU$k 830
High AU$k 1,240
6.3.2 RAIL INFRASTRUCTURE
Estimates of the rail infrastructure required to provide access to the nuclear power plant havebeen based on the provision of a single-track line from the power plant to an existing railroad. Railinfrastructure design and construction would conform to appropriate national standards, andestimates include reasonable allowances for a parallel service road, drainage culvert crossings,catchpoints and signalling and road furniture, in addition to signalling at the turnout from theexisting track.
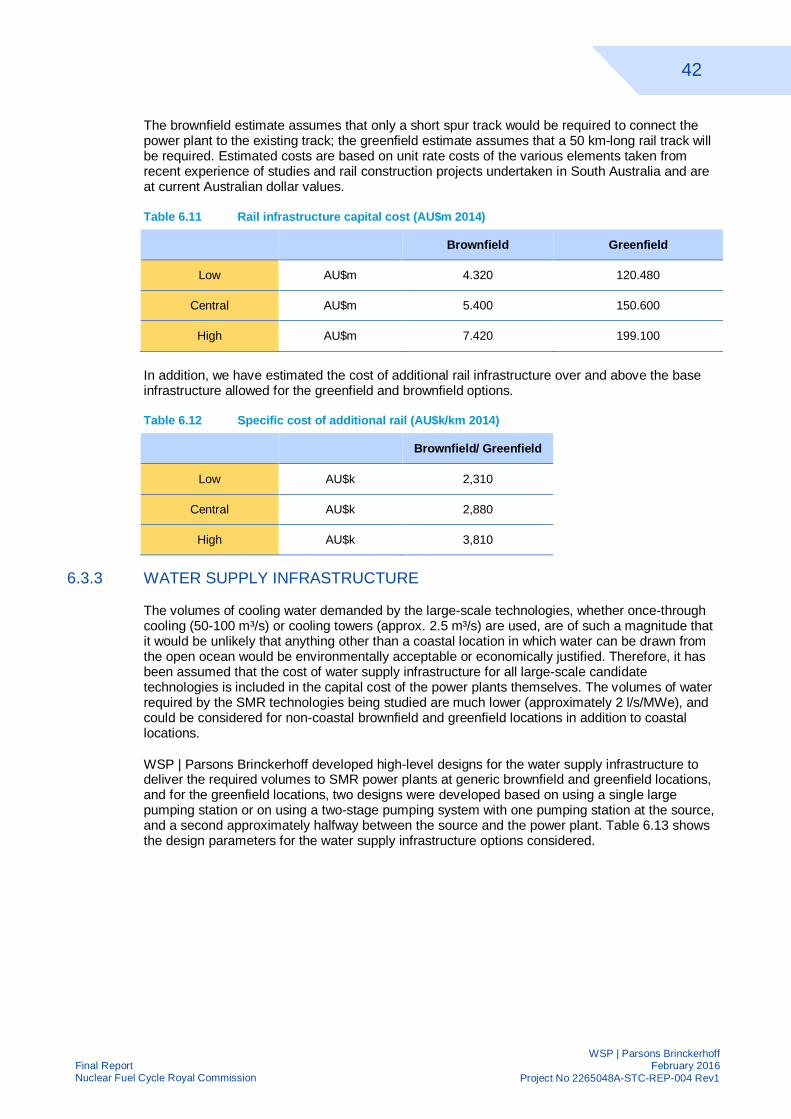
42
WSP | Parsons BrinckerhoffFebruary 2016
Project No 2265048A-STC-REP-004 Rev1Final ReportNuclear Fuel Cycle Royal Commission
The brownfield estimate assumes that only a short spur track would be required to connect thepower plant to the existing track; the greenfield estimate assumes that a 50 km-long rail track willbe required. Estimated costs are based on unit rate costs of the various elements taken fromrecent experience of studies and rail construction projects undertaken in South Australia and areat current Australian dollar values.
Table 6.11 Rail infrastructure capital cost (AU$m 2014)
Brownfield Greenfield
Low AU$m 4.320 120.480
Central AU$m 5.400 150.600
High AU$m 7.420 199.100
In addition, we have estimated the cost of additional rail infrastructure over and above the baseinfrastructure allowed for the greenfield and brownfield options.
Table 6.12 Specific cost of additional rail (AU$k/km 2014)
Brownfield/ Greenfield
Low AU$k 2,310
Central AU$k 2,880
High AU$k 3,810
6.3.3 WATER SUPPLY INFRASTRUCTURE
The volumes of cooling water demanded by the large-scale technologies, whether once-throughcooling (50-100 m³/s) or cooling towers (approx. 2.5 m³/s) are used, are of such a magnitude thatit would be unlikely that anything other than a coastal location in which water can be drawn fromthe open ocean would be environmentally acceptable or economically justified. Therefore, it hasbeen assumed that the cost of water supply infrastructure for all large-scale candidatetechnologies is included in the capital cost of the power plants themselves. The volumes of waterrequired by the SMR technologies being studied are much lower (approximately 2 l/s/MWe), andcould be considered for non-coastal brownfield and greenfield locations in addition to coastallocations.
WSP | Parsons Brinckerhoff developed high-level designs for the water supply infrastructure todeliver the required volumes to SMR power plants at generic brownfield and greenfield locations,and for the greenfield locations, two designs were developed based on using a single largepumping station or on using a two-stage pumping system with one pumping station at the source,and a second approximately halfway between the source and the power plant. Table 6.13 showsthe design parameters for the water supply infrastructure options considered.

43
WSP | Parsons BrinckerhoffFebruary 2016
Project No 2265048A-STC-REP-004 Rev1Final ReportNuclear Fuel Cycle Royal Commission
Table 6.13 SMR water infrastructure parameters
Large SMR Small SMR
Greenfield Brownfield Greenfield Brownfield
Single-lift Booster lift Single-lift Booster lift
Flow (l/s) 730 600
Pumpingstations
1 2 - 1 2 -
Pumpingdemand (kW)
1,740 2,580 N/A 1,330 2,570 N/A
Total pumprating (kW)
2,340 3,440 N/A 1,800 3,440 N/A
Pipeline dia.(OD - mm)
916 762 762 916 660 660
Pipelinelength (km)
50 50 2 50 50 2
Bills of quantities produced for these designs were costed by Aquenta.
Greenfield cost assumptions are based on the provision of 50 km of pipeline and equipmentconnecting the power plant to a pumping station located at the source of the water supply, whichmay itself be coastal. Brownfield cost assumptions are based on providing a short spurconnection into existing water supply infrastructure. All water treatment plant required to ensurethat water supplied to the various consumers of water within the nuclear power plant is assumedto be included within the capital cost of the nuclear power plant.
Table 6.14 SMR water infrastructure base estimates (AU$m)
Large SMR Small SMR
Greenfield Brownfield Greenfield Brownfield
Single-lift Booster lift Single-lift Booster lift
Pumpingstations
25.6 30.8 - 24.5 30.2 -
Pipelines 83.7 68.0 7.5 83.7 58.4 7.1
Other costs 12.1 11.0 0.8 12.0 9.8 0.8
Contingency 24.3 21.9 1.7 24.1 19.7 1.6
Total 145.7 131.7 10.0 144.3 118.1 9.5
Allowances and deductions were estimated for certain elements that might or might not form partof the final project, including:
à Provision of construction power at pumping station sites
à Provision of access road
à Provision of pipe crossings
à Provision of temporary camp/accommodation
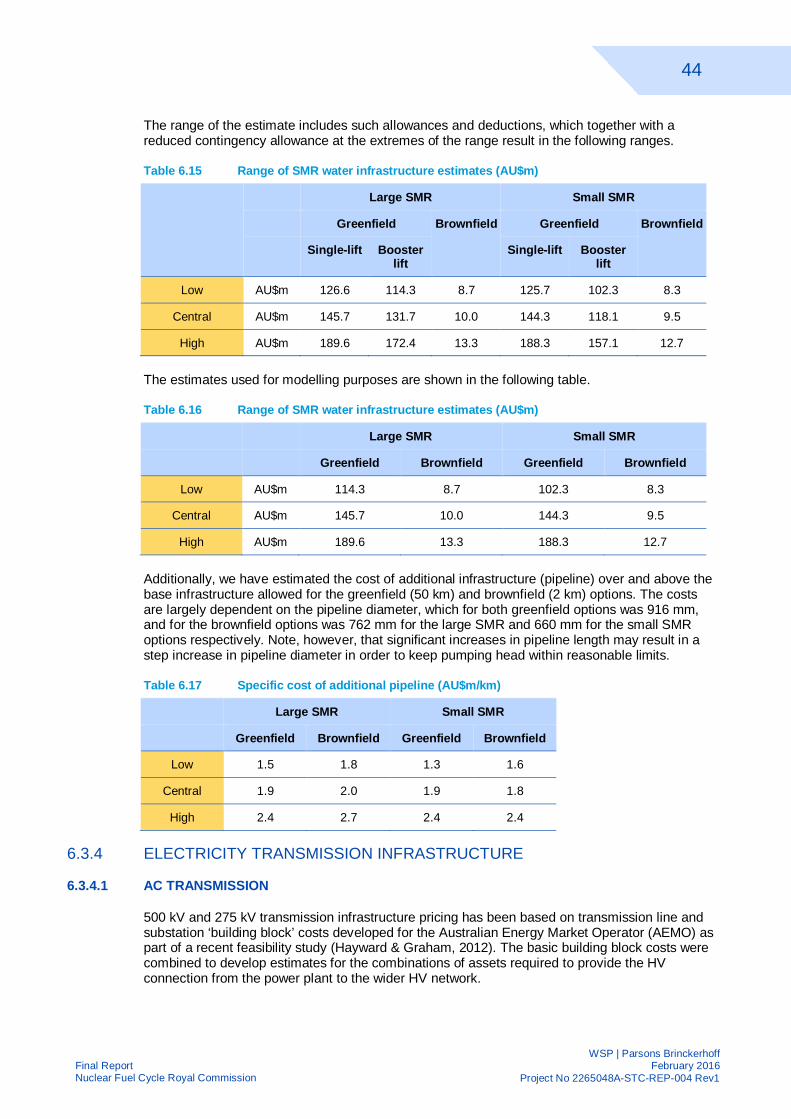
44
WSP | Parsons BrinckerhoffFebruary 2016
Project No 2265048A-STC-REP-004 Rev1Final ReportNuclear Fuel Cycle Royal Commission
The range of the estimate includes such allowances and deductions, which together with areduced contingency allowance at the extremes of the range result in the following ranges.
Table 6.15 Range of SMR water infrastructure estimates (AU$m)
Large SMR Small SMR
Greenfield Brownfield Greenfield Brownfield
Single-lift Boosterlift
Single-lift Boosterlift
Low AU$m 126.6 114.3 8.7 125.7 102.3 8.3
Central AU$m 145.7 131.7 10.0 144.3 118.1 9.5
High AU$m 189.6 172.4 13.3 188.3 157.1 12.7
The estimates used for modelling purposes are shown in the following table.
Table 6.16 Range of SMR water infrastructure estimates (AU$m)
Large SMR Small SMR
Greenfield Brownfield Greenfield Brownfield
Low AU$m 114.3 8.7 102.3 8.3
Central AU$m 145.7 10.0 144.3 9.5
High AU$m 189.6 13.3 188.3 12.7
Additionally, we have estimated the cost of additional infrastructure (pipeline) over and above thebase infrastructure allowed for the greenfield (50 km) and brownfield (2 km) options. The costsare largely dependent on the pipeline diameter, which for both greenfield options was 916 mm,and for the brownfield options was 762 mm for the large SMR and 660 mm for the small SMRoptions respectively. Note, however, that significant increases in pipeline length may result in astep increase in pipeline diameter in order to keep pumping head within reasonable limits.
Table 6.17 Specific cost of additional pipeline (AU$m/km)
Large SMR Small SMR
Greenfield Brownfield Greenfield Brownfield
Low 1.5 1.8 1.3 1.6
Central 1.9 2.0 1.9 1.8
High 2.4 2.7 2.4 2.4
6.3.4 ELECTRICITY TRANSMISSION INFRASTRUCTURE
6.3.4.1 AC TRANSMISSION
500 kV and 275 kV transmission infrastructure pricing has been based on transmission line andsubstation ‘building block’ costs developed for the Australian Energy Market Operator (AEMO) aspart of a recent feasibility study (Hayward & Graham, 2012). The basic building block costs werecombined to develop estimates for the combinations of assets required to provide the HVconnection from the power plant to the wider HV network.

45
WSP | Parsons BrinckerhoffFebruary 2016
Project No 2265048A-STC-REP-004 Rev1Final ReportNuclear Fuel Cycle Royal Commission
The range of the estimates depends on variables such as terrain, vegetation, climatic and groundgeotechnical conditions for transmission lines, and climatic and geotechnical conditions forsubstations. Until site-specific factors can be assessed, wide ranges of cost estimate should beexpected.
Table 6.18 AC HV greenfield connection asset cost estimates (AU$m)
PWR BWR PHWRLarge
PHWRSmall
SMRLarge
SMRSmall
Transmission Voltage,kV 500 275
Low AU$m 310 239 82
Central AU$m 344 265 92
High AU$m 450 350 118
Table 6.19 AC HV brownfield connection asset cost estimates (AU$m)
PWR BWR PHWRLarge
PHWRSmall
SMRLarge
SMRSmall
Transmission Voltage,kV 500 275
Low AU$m 150 165 150 100 20
Central AU$m 167 183 167 112 22
High AU$m 225 250 225 150 30
Table 6.20 AC HV connection asset incremental cost estimates (AU$m)
PWR BWR PHWRLarge
PHWRSmall
SMRLarge
SMRSmall
Transmission Voltage,kV 500 275
Low AU$m/km 1.6 1.4 0.7
Central AU$m/km 2.0 1.8 0.9
High AU$m/km 3.0 2.7 1.4
Additionally, the Statement of Work requested estimated costs for a range of additional HVinfrastructure at specific ratings over and above that specifically required as connection assets.These costs were estimated from the transmission line and substation building block costs in thesame way.
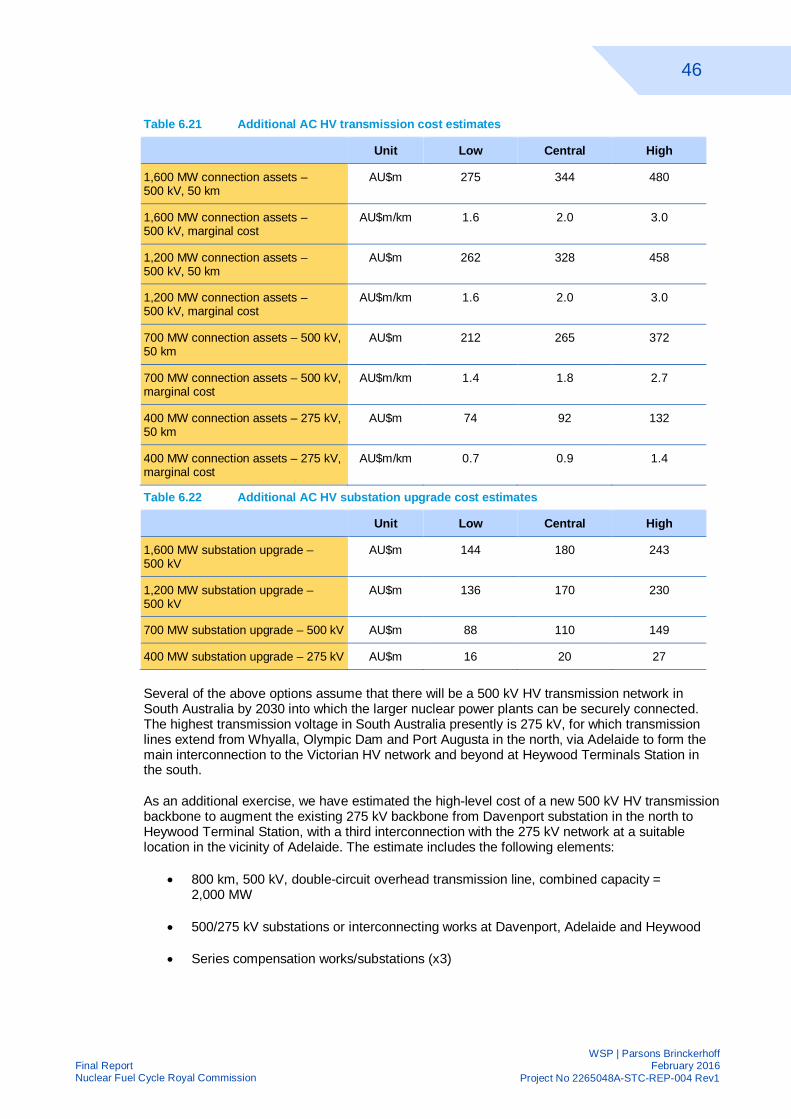
46
WSP | Parsons BrinckerhoffFebruary 2016
Project No 2265048A-STC-REP-004 Rev1Final ReportNuclear Fuel Cycle Royal Commission
Table 6.21 Additional AC HV transmission cost estimates
Unit Low Central High
1,600 MW connection assets –500 kV, 50 km
AU$m 275 344 480
1,600 MW connection assets –500 kV, marginal cost
AU$m/km 1.6 2.0 3.0
1,200 MW connection assets –500 kV, 50 km
AU$m 262 328 458
1,200 MW connection assets –500 kV, marginal cost
AU$m/km 1.6 2.0 3.0
700 MW connection assets – 500 kV,50 km
AU$m 212 265 372
700 MW connection assets – 500 kV,marginal cost
AU$m/km 1.4 1.8 2.7
400 MW connection assets – 275 kV,50 km
AU$m 74 92 132
400 MW connection assets – 275 kV,marginal cost
AU$m/km 0.7 0.9 1.4
Table 6.22 Additional AC HV substation upgrade cost estimates
Unit Low Central High
1,600 MW substation upgrade –500 kV
AU$m 144 180 243
1,200 MW substation upgrade –500 kV
AU$m 136 170 230
700 MW substation upgrade – 500 kV AU$m 88 110 149
400 MW substation upgrade – 275 kV AU$m 16 20 27
Several of the above options assume that there will be a 500 kV HV transmission network inSouth Australia by 2030 into which the larger nuclear power plants can be securely connected.The highest transmission voltage in South Australia presently is 275 kV, for which transmissionlines extend from Whyalla, Olympic Dam and Port Augusta in the north, via Adelaide to form themain interconnection to the Victorian HV network and beyond at Heywood Terminals Station inthe south.
As an additional exercise, we have estimated the high-level cost of a new 500 kV HV transmissionbackbone to augment the existing 275 kV backbone from Davenport substation in the north toHeywood Terminal Station, with a third interconnection with the 275 kV network at a suitablelocation in the vicinity of Adelaide. The estimate includes the following elements:
· 800 km, 500 kV, double-circuit overhead transmission line, combined capacity =2,000 MW
· 500/275 kV substations or interconnecting works at Davenport, Adelaide and Heywood
· Series compensation works/substations (x3)

47
WSP | Parsons BrinckerhoffFebruary 2016
Project No 2265048A-STC-REP-004 Rev1Final ReportNuclear Fuel Cycle Royal Commission
· Protection, metering, control, SCADA, communications equipment
Table 6.23 Additional AC HV substation upgrade cost estimates
Unit Low Central High
500 kV HV transmission backbone AU$m 1,632 2,040 2,997
6.3.4.2 DC TRANSMISSION
HVDC converter costs have been estimated taking information from a study conducted by theEuropean Network of Transmission System Operators (ENTSOE) as part of an offshoretransmission technology study (ENTSOE Regional Group North Sea, 2011).
Due to the high power ratings and long distances that are required to make HVDC connectionscost effective, cost estimates are based on single-circuit bipole interconnections using LCCtechnology over a distance of 800 km. A connection as short as that required to conform to thedefinition of a greenfield connection would not be economically feasible owing to the high cost ofthe converter stations in comparison with the transmission line.
Table 6.24 HVDC transmission cost estimates
Unit Low Central High
1,600 MW bipole interconnection –500 kV DC, 800 km
AU$m 1,112 1,390 1,998
1,600 MW bipole transmission line –500 kV DC, marginal cost
AU$m/km 0.8 1.0 1.5
1,200 MW bipole interconnection –500 kV DC, 800 km
AU$m 1,016 1,270 1,836
1,200 MW bipole transmission line –500 kV DC, marginal cost
AU$m/km 0.8 1.0 1.5
700 MW bipole interconnection –500 kV DC, 800 km
AU$m 848 1,060 1,540
700 MW bipole transmission line –500 kV DC, marginal cost
AU$m/km 0.7 0.9 1.4
400 MW bipole interconnection –500 kV DC, 800 km
AU$m 848 1,060 1,540
400 MW bipole transmission line –500 kV DC, marginal cost
AU$m/km 0.7 0.9 1.4
6.4 DECOMMISSIONING COSTS
Decommissioning of the nuclear power plant, and site remediation of the nuclear plant site will bea significant end of life cost commitment. Following the end of the 60-year operating life of thereactor, the power plant will commence a long period of care and maintenance during which theirradiated components of the power plant will be allowed to safely ‘cool down’, until such time asthe irradiated components can be dismantled in a safe and controlled manner. Followingdismantling, the waste material and scrap will be placed into long-term storage in a nucleardisposal and storage facility designed specifically for the purpose. The duration of the ‘cool down’period is estimated to be similar to that of the plant’s operating life, i.e. approximately 60 years.The time required to dismantle the plant and remediate the power plant site is estimated to be5-10 years.

48
WSP | Parsons BrinckerhoffFebruary 2016
Project No 2265048A-STC-REP-004 Rev1Final ReportNuclear Fuel Cycle Royal Commission
Table 6.25 Decommissioning cost estimates (US$m, 2014)
PWR BWR PHWRLarge
PHWRSmall
SMRLarge
SMRSmall
Low US$m 400 460 400 200
Central US$m 500 575 500 250
High US$m 600 690 600 300
Table 6.25 shows the estimated amount in real terms that will be required to remediate each ofthe candidate technologies. In practice, the amount in nominal terms that will be required as adecommissioning fund at the end of the operating life will be significantly greater than this owingto inflation, which is allowed for in the modelling. The modelling also allows for the fund to be builtup over the operating life of the plant by deducting an annual decommissioning allowance as anoperating cost, effectively treating the decommissioning fund as a pension plan for the end of thepower plant’s working life. In addition to the annual contribution of the decommissioningallowance, the fund will be invested in long-term low-risk investments such as government bondsin order to minimise the ongoing cost to the nuclear power plant.
6.5 FUEL COSTS
Roughly half of the cost of LWR fuel is the cost of yellowcake, with the other half being the cost ofenrichment and fabrication. This ratio can vary over time owing to yellowcake being a marketablecommodity, and to enrichment and fabrication being a competitive field. There is a volatileuranium spot-market; however, the underlying fuel cost is fairly stable because most ore and fuelstocks are supplied under long-term contracts with durations of up to 10 to 15 years.
Heavy water reactors, such as the CANDU plants, can use natural uranium, thereby avoiding theenrichment step of the fuel production process. However, a much larger quantity of fuel isrequired owing to the lower content of fissionable uranium, which results in increased fabricationcosts.
The most reliable source for current nuclear fuel costs is the US Nuclear Energy Institute, whichdocuments average fuel costs for all operating US nuclear power plants annually, and whichshould be a reasonable indicator for international nuclear fuel cost estimates. In 2014, theaverage cost of enriched LWR nuclear fuel was equivalent to US¢0.76/kWh generated(US$7.60/MWh), which is the base value being used in the evaluation.
A reliable equivalent source for unenriched PHWR fuel costs is not available owing to the muchsmaller PHWR fuel market. However, the best informal information available indicates thatCanadian PHWR fuel costs fall within a very similar range to those of US LWR fuel costs. Thelower enrichment and initial ore costs associated with the PHWR are offset by increasedfabrication costs and the slightly lower thermal efficiency of CANDU units. Varied assumptions onthese costs could result in small differences in the comparison but there is no significant basis toinclude such differences in this evaluation.
The SMRs included in the initial study have fuel requirements and fabrication designs similar tothe LWRs. However, they tend to have a lower thermal efficiency, and in some cases requirehigher enrichment. In general, they are expected to have higher fuel costs. In the evaluation, theyhave also been assigned a fuel cost 20% higher than the LWR average.
The variability of fuel costs has been addressed by assigning a ±20% range to the costs. Thismay seem to be a small variation for a commodity-based component of the life-cycle cost over afairly long period of time, but it is reasonable to assume that nuclear fuel costs will remain

49
WSP | Parsons BrinckerhoffFebruary 2016
Project No 2265048A-STC-REP-004 Rev1Final ReportNuclear Fuel Cycle Royal Commission
relatively stable. Historically, nuclear fuel costs over the last 20 years show a slow, steady rate ofincrease. Uranium is a widely distributed resource and it is likely that in a high demandenvironment, more resources will emerge. The enrichment portion of the cost has been reducingdriven by technological advances, moving away from old energy-intensive diffusion technology, toincreasingly efficient centrifuge processes. Still newer laser enrichment processes hold promisefor another step-change in enrichment efficiency.
Table 6.26 Fuel cost estimates (US$/MWh output)
PWR BWR PHWRLarge
PHWRSmall
SMRLarge
SMRSmall
Low US$/MWh 6.10 7.30
Central US$/MWh 7.60 9.10
High US$/MWh 9.10 10.90
6.6 SPENT FUEL LIABILITY TRANSFER COSTS
There is little evidence on which to base an estimate for the disposal and long-term storage ofspent fuel. Once the spent fuel assemblies have been removed from the reactor core, it isnecessary for them to spend several years “cooling down”. This is achieved by storing them incooling pools within the power plant facility (wet storage), the cost of which is a component of thefixed operating and maintenance cost of the power plant.
After several years cooling down, spent fuel assemblies are transferred to ‘dry cask storage’, inwhich they are stored in specially fabricated containers, which are then transferred to a long-termstorage facility.
Jacobs has been studying the cost of developing a long-term nuclear waste storage facility inSouth Australia, and has advised that they estimate that the liability transfer cost associated withthe dry-cask storage of spent fuel will be US$1-2 million per tonne of heavy metal ($/tHM). Heavymetal is the generic term used to describe the spent fuel and fuel assemblies contained in the drycask containers. Depending on the type of fuel (i.e. enriched fuel or natural uranium), and the typeof reactor, (i.e. LWR, HWR or SMR), the liability transfer cost can be determined as a cost perMWh generated, similar to the original cost of fuel.
For spent fuel from an LWR such as the AP1000 PWR, the calculation is as follows:
Net electrical output power = 1,125 MWe
Availability = 97%
Annual electrical energy exported = 1125 x 0.97 x 8760 / 1000= 9,559 GWh
Reactor thermal output = 3,400 MWth
Thermal efficiency = 1125 / 3400 = 33.09%
Annual nuclear fuel energy input = 9559 / 0.3309= 28,890 GWh= 1,203.77 GWd

50
WSP | Parsons BrinckerhoffFebruary 2016
Project No 2265048A-STC-REP-004 Rev1Final ReportNuclear Fuel Cycle Royal Commission
Burn-up rate of enriched fuel in LWR = 50 GWd/tHM
Annual spent fuel production quantity = 1203.77 / 50= 24.08 tHM
Liability transfer cost = US$1m to US$2m/tHM
Annual liability transfer cost
(using AU$1.00 = US$0.77)
= US$24.08m to US$48.15m= US$2.52 to US$5.04/MWhe= AU$3.27 to AU$6.54/MWhe
Similar calculations were performed for a representative CANDU heavy water reactors and for arepresentative SMRs. The much lower burn-up rate of unenriched fuel in CANDU reactors(approximately 7 GWd/tHM) results in the production of a much greater quantity of spent fuel, andtherefore a much higher liability transfer cost for CANDU reactors. The combination of slightlylower thermal efficiency of SMRs, and slightly reduced burn-up rate of fuel result in the productionof a slightly increased quantity of spent fuel. The resulting liability transfer costs used in themodelling are shown in Table 6.27.
Table 6.27 Spent fuel liability transfer cost estimates (US$/MWh output)
PWR BWR PHWRLarge
PHWRSmall
SMRLarge
SMRSmall
Low US$m/MWh 2.50 18.00 3.00
Central US$m/MWh 3.75 27.00 4.50
High US$m/MWh 5.00 36.00 6.00
6.7 NON-FUEL OPERATING COSTS
Non-fuel operating costs include the ongoing operations and maintenance (O&M) cost, which areoften reported as a cost per unit of generated energy (i.e. cents/kWhe). For nuclear units, thereality is that these costs, which include staffing and maintenance of equipment, are largely fixed,with a comparatively very small variable component. Nuclear power plants require a permanentstaff much larger than fossil or renewable plants would require, and a significant portion ofmaintenance work is based on a scheduled programme of testing or component replacement thatis independent of the operating history. It is important to understand that the reported costs arebased on the expected low forced outage rates and correspondingly high capacity factors ofbaseload nuclear units. If the capacity factor is reduced, the O&M costs per unit of generation canbe expected to rise proportionately.
The best source for O&M costs is the US Nuclear Energy Institute, which collects the relevantdata from the US civil reactor fleet. NEI reported that the average O&M cost in 2014 wasUS¢1.64/kWhe. This unit cost has steadily decreased as reliability enhancement programs haveincreased US plant capacity factors and improved the cost effectiveness of the units.
Each supplier offering new reactor designs claims to have made improvements that will reduceO&M costs further. Whilst these are probably valid claims to some extent, it is difficult to place averifiable value on them. Historically, PHWR and BWR units have had higher O&M costs becauseof contamination and complexity of some maintenance work. In particular, it has been noted thatstaffing at CANDU plants in Canada is higher than at PWR units in the US.

51
WSP | Parsons BrinckerhoffFebruary 2016
Project No 2265048A-STC-REP-004 Rev1Final ReportNuclear Fuel Cycle Royal Commission
For the purposes of this study, $/MWh-based costs have been converted to a $/year/MW basis,using an assumed historical average capacity factor of 90%. Whilst modern units would beexpected to achieve higher average capacity factors, we expect this to result in the reporting oflower $/kWh-based costs as opposed to higher absolute costs overall.
Anecdotal evidence suggests that BWR and PHWR O&M costs may be higher, and it could alsobe supposed that SMR costs could be lower because of the reduced staffing requirement and thereduced number of components. However, verifiable evidence of such differences is extremelylimited. In any event, the differences would not be significant within the variability of the overallestimates because of the predominant influence of capital cost. Accordingly, we estimate that theannual fixed O&M costs of the nuclear power plants will be US$130,000/MWe. Given therelatively good quality of the NEI data, we estimate that the range of the estimate can be as closeas ±20%; thus the estimate ranges from US$104,000/MWe to US$156,000/MWe.
6.7.1 IMPORTED VS. AUSTRALIAN CONTENT
As is the case with the overnight capital cost, O&M costs will not be entirely incurred overseas.Significant proportions of the costs will be incurred within Australia and more specifically, withinSouth Australia. In order to estimate the proportion of onshore and offshore cost, we adopted asimilar approach to that adopted for the capital cost, though in this case, there was no O&Mequivalent to the University of Chicago study on which to base the initial breakdown.
The starting point, therefore, was to make a rough bottom-up estimate of O&M costs, which whilstit would not result in a cost equal to the US$130,000/MWe derived from NEI data, it would givethe relative proportions of each element of the whole.
Table 6.28 Bottom-up estimate of fixed O&M costs – large scale
Item Assumptions US$m
NPP technology AP1000 – 1,125 MW
Staffing 400 staff at US$60,000 pa average cost 24.00
Training Estimated at US$3,000 / member of staff pa 1.20
Regulatory fees Estimated annual fee 10.00
Spares 1% of capex 64.13
Consumables Water treatment chemicals at US$30/t make-up for 18t/h for8,000 hours pa
4.32
Professional Fees 2% of annual operational expenditure 2.90
Transmissionnetwork charges
Estimated US$10,000/MW/yr 11.25
Water supplycharges
US$10/t for 25t/h for 8000 hours pa 2.00
Waste managementcosts
10t/y ILW at US$100,000/t, 60t/y LLW at US$20,000/t(excluding spent fuel)
2.20
TOTAL 122.00
The next stage was to apportion these costs to categories that approximate to the economicmodelling categories that were being used by EY in its computable general equilibrium (CGE)modelling, followed by an assessment of the proportions of the EY category costs that would beincurred in the three jurisdictional categories of South Australia, Commonwealth and Import.

52
WSP | Parsons BrinckerhoffFebruary 2016
Project No 2265048A-STC-REP-004 Rev1Final ReportNuclear Fuel Cycle Royal Commission
The mapping of the costs in Table 6.28 to EY categories resulted in the contents of Table 6.29
Table 6.29 Bottom-up estimate of fixed O&M costs – large scale
Item
Rea
ctor
Spec
ialis
edeq
uipm
ent
Mat
eria
lsu
pplie
s
Prof
essi
onal
serv
ices
Staf
fcos
ts
Util
itych
arge
s
Was
tean
dde
com
mis
sion
ing
char
ges
US$
m
Staffing 24.00 24.00
Training 1.20 1.20
Regulatory fees 10.00 10.00
Spares 32.06 32.06 64.13
Consumables 4.32 4.32
Professional Fees 2.90 2.90
Transmission networkcharges
11.25 11.25
Water supply charges 2.00 2.00
Waste management costs 2.20 2.20
TOTAL 32.06 32.06 4.32 12.90 25.20 13.25 2.20 122.00
(percentage of total) 26.28% 26.28% 3.54% 10.57% 20.66% 10.86% 1.80%
Table 6.30 Categorisation of fixed O&M costs – large scale
Item “Bottom-up” totals
Proportions Percent of Total
SouthAustralia
Rest ofAustralia
Import SouthAustralia
Rest ofAustralia
Import
Reactor 26.28% 100% 0.00% 0.00% 26.28%
Specialised equipment 26.28% 20% 20% 60% 5.26% 5.26% 15.77%
Material supplies 3.54% 80% 20% 2.83% 0.71% 0.00%
Professional services 10.57% 50% 40% 10% 5.29% 4.23% 1.06%
Staff costs 20.66% 100% 20.66% 0.00% 0.00%
Utility charges 10.86% 100% 10.86% 0.00% 0.00%
Waste anddecommissioningcharges
1.80% 100% 1.80% 0.00% 0.00%
TOTAL 46.70% 10.19% 43.11%
56.89% 43.11%
Thus, we estimate that 43.11% of the fixed O&M cost will be incurred overseas, and 56.89%within Australia. Using the overall estimate of US$130,000/MW per annum, we estimate that

53
WSP | Parsons BrinckerhoffFebruary 2016
Project No 2265048A-STC-REP-004 Rev1Final ReportNuclear Fuel Cycle Royal Commission
US$56,000/MWe per annum will be incurred overseas, and US$74,000/MWe within Australia,which is equivalent to AU$96,100/MWe per annum.
We performed a similar exercise for the SMR-based plants. There will be slight differences in theproportions of expenditure in the bottom-up estimate such that slightly more of the O&Mexpenditure will be incurred onshore, and slightly less off shore.
Table 6.31 Categorisation of fixed O&M costs – SMR
Item “Bottom-up” totals
Proportions Percent of Total
SouthAustralia
Rest ofAustralia
Import SouthAustralia
Rest ofAustralia
Import
Reactor 22.47% 100% 0.00% 0.00% 22.47%
Specialised equipment 22.47% 20% 20% 60% 4.49% 4.49% 13.48%
Material supplies 2.50% 80% 20% 2.00% 0.50% 0.00%
Professional services 16.23% 50% 40% 10% 8.11% 6.49% 1.62%
Staff costs 26.22% 100% 26.22% 0.00% 0.00%
Utility charges 8.66% 100% 8.66% 0.00% 0.00%
Waste anddecommissioningcharges
1.46% 100% 1.46% 0.00% 0.00%
TOTAL 50.94% 11.49% 37.58%
62.42% 37.58%
Thus, for SMRs, we estimate that 37.58% of the fixed O&M cost will be incurred overseas, and62.42% within Australia. Using the overall estimate of US$130,000/MW per annum, we estimatethat US$48,900/MWe per annum will be incurred overseas, and US$81,100/MWe within Australia,which is equivalent to AU$105,400/MWe per annum.
Table 6.32 Estimated annual non-fuel operating cost assumptions ($/MW 2014)
PWR BWR PHWRLarge
PHWRSmall
SMRLarge
SMRSmall
LowAU$/MW 76,800 84,300
US$/MW 44,800 39,100
CentralAU$/MW 96,100 105,400
US$/MW 56,000 48,900
HighAU$/MW 115,300 126,500
US$/MW 67,200 58,600

54
WSP | Parsons BrinckerhoffFebruary 2016
Project No 2265048A-STC-REP-004 Rev1Final ReportNuclear Fuel Cycle Royal Commission
Table 6.33 Estimated annual non-fuel operating cost ($m 2014)
PWR BWR PHWRLarge
PHWRSmall
SMRLarge
SMRSmall
Net capacity MW 1,125 1,575 1,200 740 360 285
LowAU$m 86.4 121 92.2 56.8 30.3 24
US$m 50 71 54 33 14 11.1
CentralAU$m 108 151 115 71 38 30
US$m 63 88.2 67 41 18 14
HighAU$m 130 182 138 85 46 36
US$m 76 106 81 50 21 17
6.7.2 INSURANCE
The annual cost of insurance has been estimated to be 0.3% of the overnight capital cost.
Table 6.34 Estimated annual insurance cost assumptions ($/MW 2014)
PWR BWR PHWRLarge
PHWRSmall
SMRLarge
SMRSmall
Low US$/MW 15,900 15,900 15,300 16,800
Central US$/MW 17,100 18,900 18,000 19,800
High US$/MW 18,900 21,900 21,600 23,700
Table 6.35 Estimated annual insurance cost assumptions ($m 2014)
PWR BWR PHWRLarge
PHWRSmall
SMRLarge
SMRSmall
Low US$m 17.9 25.0 19.1 11.8 5.5 4.8
Central US$m 19.2 26.9 22.7 14.0 6.5 5.6
High US$m 21.3 29.8 26.3 16.2 7.8 6.8
6.7.3 TRANSMISSION USE OF SYSTEM (TUOS) & ELECTRICITY CHARGES
Transmission Use of System (TUoS) charges are not payable by generators; however mostgenerating plant will retain a load off-take agreement to meet backfeed requirements whengenerating plant is not operational. TUoS fixed and variable costs have been estimated usinginformation for typical connection points in the ElectraNet and SP Ausnet transmission systems.Central case operating assumptions are as follows:
à Auxiliary power demand is approximately 5% of rated generation output.
à Demand is drawn for 5% annual operating hours.
à Energy cost is an average of AU$50/MWh.
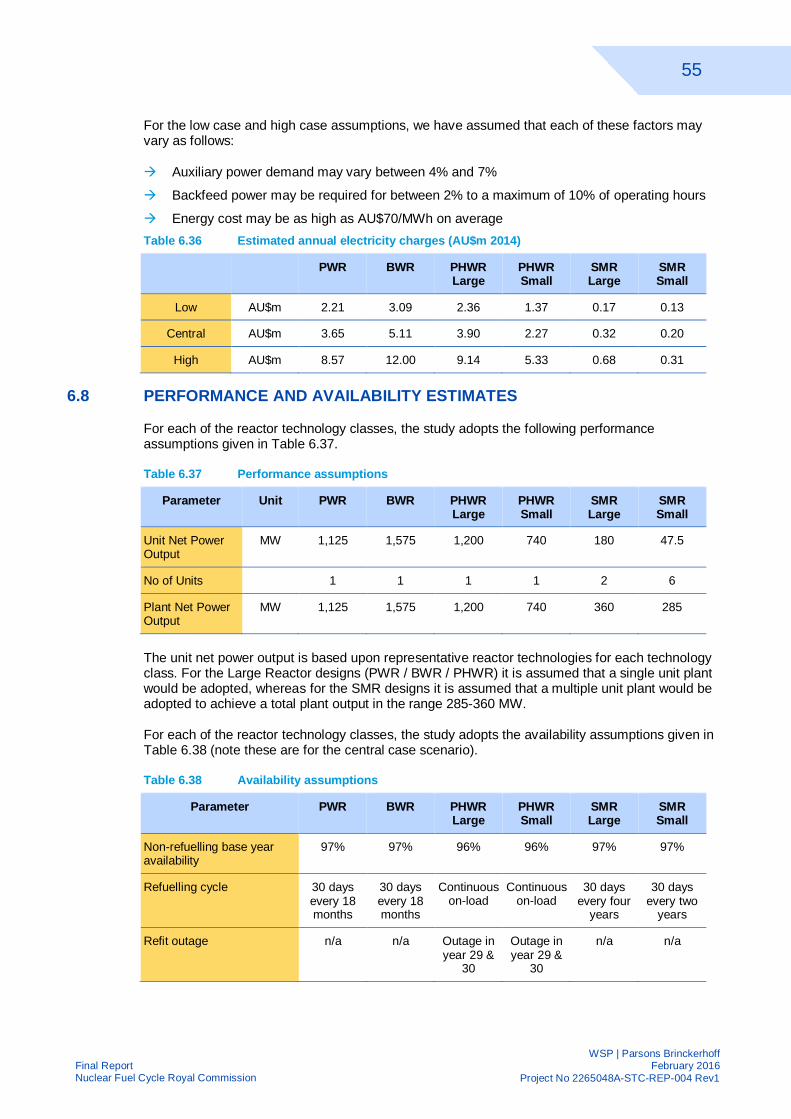
55
WSP | Parsons BrinckerhoffFebruary 2016
Project No 2265048A-STC-REP-004 Rev1Final ReportNuclear Fuel Cycle Royal Commission
For the low case and high case assumptions, we have assumed that each of these factors mayvary as follows:
à Auxiliary power demand may vary between 4% and 7%
à Backfeed power may be required for between 2% to a maximum of 10% of operating hours
à Energy cost may be as high as AU$70/MWh on averageTable 6.36 Estimated annual electricity charges (AU$m 2014)
PWR BWR PHWRLarge
PHWRSmall
SMRLarge
SMRSmall
Low AU$m 2.21 3.09 2.36 1.37 0.17 0.13
Central AU$m 3.65 5.11 3.90 2.27 0.32 0.20
High AU$m 8.57 12.00 9.14 5.33 0.68 0.31
6.8 PERFORMANCE AND AVAILABILITY ESTIMATES
For each of the reactor technology classes, the study adopts the following performanceassumptions given in Table 6.37.
Table 6.37 Performance assumptions
Parameter Unit PWR BWR PHWRLarge
PHWRSmall
SMRLarge
SMRSmall
Unit Net PowerOutput
MW 1,125 1,575 1,200 740 180 47.5
No of Units 1 1 1 1 2 6
Plant Net PowerOutput
MW 1,125 1,575 1,200 740 360 285
The unit net power output is based upon representative reactor technologies for each technologyclass. For the Large Reactor designs (PWR / BWR / PHWR) it is assumed that a single unit plantwould be adopted, whereas for the SMR designs it is assumed that a multiple unit plant would beadopted to achieve a total plant output in the range 285-360 MW.
For each of the reactor technology classes, the study adopts the availability assumptions given inTable 6.38 (note these are for the central case scenario).
Table 6.38 Availability assumptions
Parameter PWR BWR PHWRLarge
PHWRSmall
SMRLarge
SMRSmall
Non-refuelling base yearavailability
97% 97% 96% 96% 97% 97%
Refuelling cycle 30 daysevery 18months
30 daysevery 18months
Continuouson-load
Continuouson-load
30 daysevery four
years
30 daysevery two
years
Refit outage n/a n/a Outage inyear 29 &
30
Outage inyear 29 &
30
n/a n/a

56
WSP | Parsons BrinckerhoffFebruary 2016
Project No 2265048A-STC-REP-004 Rev1Final ReportNuclear Fuel Cycle Royal Commission
Parameter PWR BWR PHWRLarge
PHWRSmall
SMRLarge
SMRSmall
Overall availability profile:
Year 1
Year 2
Year 3
Year 4
Year 5
Year 29 and 30 (PHWR)
Year 31 (PHWR)
97.00%
89.03%
89.03%
Y1-3repeats
97.00%
89.03%
89.03%
Y1-3repeats
96.00%
96.00%
85.48%
Y1-3repeats
…
0%
Y1-3repeats
96.00%
96.00%
85.48%
Y1-3repeats
…
0%
Y1-3repeats
96.99%
96.99%
93.01%
93.01%
Y1-4repeats
93%
Annually
The availability profiles for PWR and BWR technologies follow an 18-month refuelling cycle with a30-day outage for each fuel recharge. On an annual modelling basis this results in a repeatingthree-year cycle of availabilities averaging long-term at approximately 91.7%. Plant maintenanceactivities are generally scheduled to coincide with the refuelling outage cycle, so that the 30-dayallowance includes provision for planned maintenance activities. Sensitivity cases of higher andlower average capacity factors incorporating (respectively) longer and shorter refuelling outageshave also been considered. For example, advances in outage planning and tooling design areexpected to result in refuelling outages as short as 20 days being commonplace by 2030.
The availability profile for PHWRs also follow a three-year cycle of overall availability, the reducedavailability in the third year relating to required scheduled maintenance activities for the unit.There is an availability of 0% for years 29 and 30 due to the required mid-life refit works which area major undertaking over a 24-month outage period. The planned refurbishment outages aresometimes reported to be as short as 12 to 15 months, but that has not been achieved in practicein Canada where actual refurbishment outages lasting from 27 months to over four years haveoccurred.
Availability profiles for the Large SMR and Small SMR technologies also include refuellingoutages (as is the case for PWR and BWR technologies), though with longer refuelling cycles offour years and two years respectively. However, owing to the consideration that there would bemultiple units on each site, the average availabilities of the complete power stations aresomewhat levelled out.
Low and high availability extremes have been assumed on the basis of combining lower andhigher base year availabilities with longer and shorter refuelling outage durations, respectively.Base year availabilities of ±1% of the central case availability, and refuelling outage times of ±10days of the central case outage duration.
6.9 MANPOWER REQUIREMENTS
Nuclear power plants require higher levels of staffing, both during construction and duringoperation, than conventional fossil-fuelled generation facilities. The related manpower costpartially offsets the cost advantages of fuel. As a result, optimisation of staffing levels had beenintensely studied over the years. The need to minimise the manpower cost must be balancedagainst potential negative impacts on reliability or safety that could result from reduced staffing.

57
WSP | Parsons BrinckerhoffFebruary 2016
Project No 2265048A-STC-REP-004 Rev1Final ReportNuclear Fuel Cycle Royal Commission
6.9.1 CONSTRUCTION MANPOWER
The high levels of staffing at construction sites have impacts on construction cost which arereflected in the estimated capital cost of the plants. As a result, it is not necessary to directlyidentify a cost associated with manpower. However, the influx of a large construction staff for thelimited period of time a plant is under construction is of concern for local area resources.
In the US, large nuclear projects under construction (e.g., 2 x 1,100 MWe units at Vogtle) arecurrently utilising site peak staffs of 3,000 to 5,000 workers (Hylko, 2013) (Mirshak, 2014). Thestaffing curve is usually represented as a form of bell-curve, peaking in the middle or slightly pastthe middle of the overall construction duration. This peak value can vary depending on theamount of fabrication and technical support work that can be accomplished off-site. The move to“modular” construction and standardised designs is an attempt to reduce the peak site staffingand the resultant congestion and inefficiency.
From a twin-unit plant, the construction manpower for a single unit can be estimated by repeatinga single unit estimate for each unit, whilst allowing for efficiencies and learnings on the secondunit. This can then be validated by comparison with the manpower curve for the twin-unit plant.The table below shows an estimated manpower requirement for each unit for the AP1000-basedVC Summer plant that aligns well with the forecast and actual manpower on site (Hylko, 2013).
Table 6.39 Large-scale plant construction manpower estimates – two-unit plant
Year 1st unit 2nd unit Total
0 0 0 0
1 1,300 300 1,600
2 1,900 1,040 2,940
3 2,000 1,520 3,520
4 1,400 1,600 3,000
5 0 1,120 1,120
6 0 0
Total (man-years) 6,600 5,580 12,180
Proportion 54% 46%
Considering the construction of a single unit, the manpower bell curve is found to have a flatterconstruction peak than for a twin-unit plant. If a peak site staffing of 3,500-5,000 is assumed for atwo-unit large-scale plant, a peak of 2,000 to 2,800 can be anticipated for a single unit, allowingfor a slight loss of efficiency in building a single unit.
Based on the estimated profile and peak manpower estimates above, the total site effort for asingle 1,000 MW class nuclear plant is likely to be in the range 6,500-9,500 man-years.
International projects in developed countries with existing industrial and nuclear infrastructuresare expected to utilise similar staffing approaches to the US plants now under construction.However, developing countries present a different situation, both because of the lack of existingoff-site support, and the lower cost of labour. The UAE Barakah projects (4 x 1,400 MWe units)have been reported to have reached a site staff level of 18,000 (World Nuclear News, 2015b).
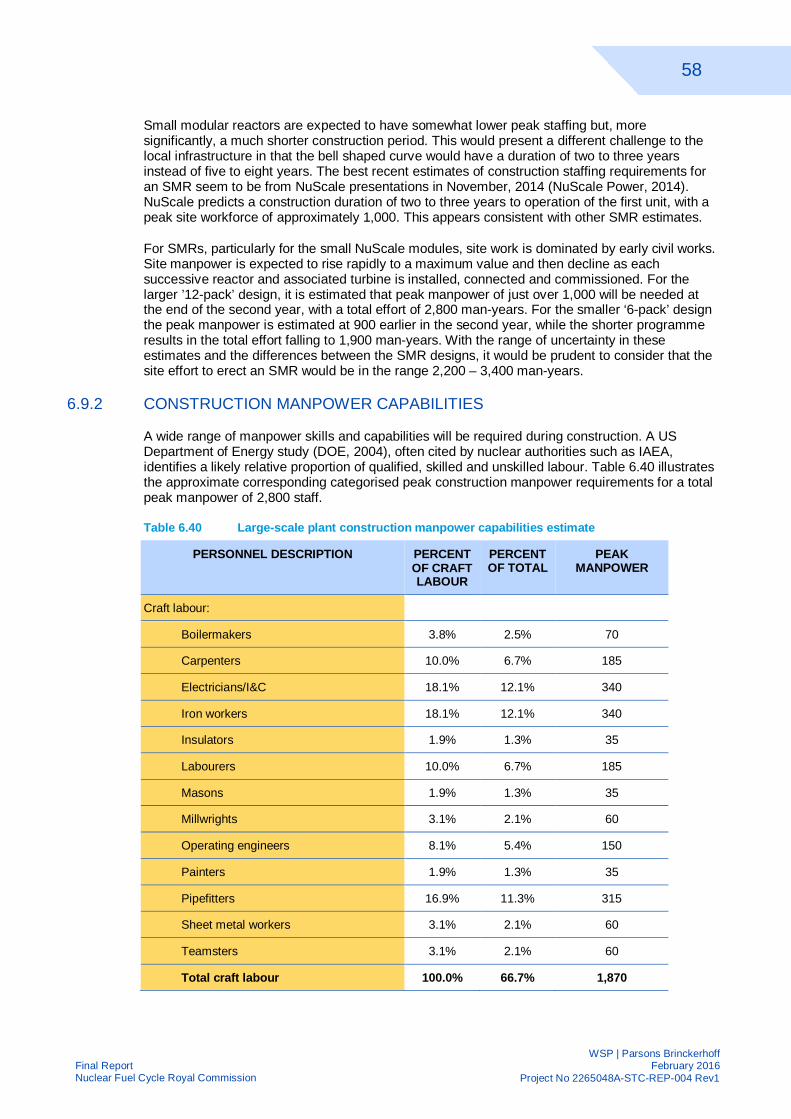
58
WSP | Parsons BrinckerhoffFebruary 2016
Project No 2265048A-STC-REP-004 Rev1Final ReportNuclear Fuel Cycle Royal Commission
Small modular reactors are expected to have somewhat lower peak staffing but, moresignificantly, a much shorter construction period. This would present a different challenge to thelocal infrastructure in that the bell shaped curve would have a duration of two to three yearsinstead of five to eight years. The best recent estimates of construction staffing requirements foran SMR seem to be from NuScale presentations in November, 2014 (NuScale Power, 2014).NuScale predicts a construction duration of two to three years to operation of the first unit, with apeak site workforce of approximately 1,000. This appears consistent with other SMR estimates.
For SMRs, particularly for the small NuScale modules, site work is dominated by early civil works.Site manpower is expected to rise rapidly to a maximum value and then decline as eachsuccessive reactor and associated turbine is installed, connected and commissioned. For thelarger ’12-pack’ design, it is estimated that peak manpower of just over 1,000 will be needed atthe end of the second year, with a total effort of 2,800 man-years. For the smaller ‘6-pack’ designthe peak manpower is estimated at 900 earlier in the second year, while the shorter programmeresults in the total effort falling to 1,900 man-years. With the range of uncertainty in theseestimates and the differences between the SMR designs, it would be prudent to consider that thesite effort to erect an SMR would be in the range 2,200 – 3,400 man-years.
6.9.2 CONSTRUCTION MANPOWER CAPABILITIES
A wide range of manpower skills and capabilities will be required during construction. A USDepartment of Energy study (DOE, 2004), often cited by nuclear authorities such as IAEA,identifies a likely relative proportion of qualified, skilled and unskilled labour. Table 6.40 illustratesthe approximate corresponding categorised peak construction manpower requirements for a totalpeak manpower of 2,800 staff.
Table 6.40 Large-scale plant construction manpower capabilities estimate
PERSONNEL DESCRIPTION PERCENTOF CRAFTLABOUR
PERCENTOF TOTAL
PEAKMANPOWER
Craft labour:
Boilermakers 3.8% 2.5% 70
Carpenters 10.0% 6.7% 185
Electricians/I&C 18.1% 12.1% 340
Iron workers 18.1% 12.1% 340
Insulators 1.9% 1.3% 35
Labourers 10.0% 6.7% 185
Masons 1.9% 1.3% 35
Millwrights 3.1% 2.1% 60
Operating engineers 8.1% 5.4% 150
Painters 1.9% 1.3% 35
Pipefitters 16.9% 11.3% 315
Sheet metal workers 3.1% 2.1% 60
Teamsters 3.1% 2.1% 60
Total craft labour 100.0% 66.7% 1,870

59
WSP | Parsons BrinckerhoffFebruary 2016
Project No 2265048A-STC-REP-004 Rev1Final ReportNuclear Fuel Cycle Royal Commission
PERSONNEL DESCRIPTION PERCENTOF CRAFTLABOUR
PERCENTOF TOTAL
PEAKMANPOWER
Craft supervision 3.3% 90
Indirect labour 6.7% 190
Quality Control Inspectors 1.7% 50
NSSS vendor and subcontractor staffs 5.8% 160
EPC contractor's managers, engineers, andschedulers
4.2% 120
Owner's O&M Staff 8.3% 230
Start-up personnel 2.5% 70
Licensing inspectors 0.8% 20
Total 100.0% 2,800Source: (Moore, 2013)
Currently, there is little or no manpower available in Australia with nuclear experience orawareness, which may cause some issues for construction and future operation of a nuclearpower plant in South Australia. However, these issues could be addressed by appropriateplanning during the project development and construction phase.
During construction, it would be normal for EPC contractors and/or the manufacturers of selectednuclear generation technologies to relocate key project and engineering staff with the requisitequalifications, skills and experience to the project site for the duration of construction. Local staffwould also be recruited for roles appropriate to their existing qualifications and competences, andwould receive additional training where additional competences specific to nuclear generationtechnology were required.
It would also be usual for EPC contractors and plant manufacturers to provide extensive trainingand education packages as part of their scopes of services, in order to ensure that the futureowner of the generating plant has staff equipped with the relevant skills and competences oncethe plant enters into commercial operation. Again, some of these staff in key positions or withspecific qualifications and expertise, might be recruited from overseas, at least in the short term.However, there would be an opportunity for South Australia to leverage the skill-sets developedduring construction and operation, and to develop a nuclear services sector and nucleareducation sector that could be marketed widely.
6.9.3 OPERATIONAL MANPOWER
The operating staff cost is also included in the overall estimated cost of operation for the variousplants. As a basis for estimating staffing, we can use existing operating plants as a benchmark.Information on operating staff is again most readily available and reliable from data on the USfleet of operating plants. This is a result of the size of the US fleet, the uniformity of operatingconstraints on the US plants and the transparency of the data. Operating staff levels are oftenreported and compared on the basis of Full Time Equivalent (FTE) staff per MWe capacity. TheFTE data include operating and support staff at the site, off-site support staff dedicated to thefacility, and contract staff, though some support functions may be separately rolled into overheadoperating costs.
Levels of staffing in the 1970s and 1980s were identified as a potential area of cost reduction.Plants generally had 1.5 to 2.0 FTE staff per MWe at the time, and have significantly reduced FTE

60
WSP | Parsons BrinckerhoffFebruary 2016
Project No 2265048A-STC-REP-004 Rev1Final ReportNuclear Fuel Cycle Royal Commission
staff whilst also markedly improving reliability and safety performance since then. The ElectricUtility Cost Group (Electric Utility Cost Group, 2015) provides a focal point for various aspects ofplant cost and has tracked staffing costs. Staff levels have stabilised over the last 10 years asdescribed in a EUCG report from 2010 (Peltier, 2010). About 80% of staff are usually site-based,and staffing levels vary from about 0.54 FTE/MWe for the first quartile to 0.93 FTE/MWe for thethird quartile.
These values are consistent with other reported averages. In general multiple unit sites that arepart of a large utility with multiple stations have lower staffing levels than single unit sites andsmall utilities. Average staffing levels of 0.58 FTE/MWe on multiple-unit sites and 0.94 FTE/MWeon single unit sites have been reported (World Nuclear News, 2008).
Staffing information for CANDU sites in Canada is also available, but information for sites in othercountries is not easily found. Canadian staffing appears to be similar to US levels. CANDU sitesare large, with typically four to eight units. Darlington Nuclear Generation Station, with four unitstotalling 3,512 MWe, was reported in 2013 to have about 2,600 employees, whilst Pickering (sixoperational units totalling 3,252 MW) had about 3,500 (Durham Workforce Authority, 2013). Thegreater number at Pickering reflects the location of more common support functions at Pickering.
The most recent designs of large units are expected to require staffing levels at the lower end ofthe current plant range. Westinghouse AP1000 units at two unit sites are expected to have totaloperating staff headcounts of about 800 FTE or about 0.36 FTE/MWe (Hylko, 2013). This can beviewed as a realistic estimate for new multi-unit large nuclear stations operated by existingnuclear-powered utilities with multiple nuclear plants where many corporate services could beshared across the whole portfolio. However, for a single-unit site operated by a utility with no othernuclear plants, it should be increased to about 0.75/MWe based on the staffing ratios at existingnuclear units. For a single-unit plant based on AP1000 reactor technology, this would equateapproximately 850 FTE.
SMRs are also expected to minimise the number of employees by simplification of operations andmaintenance. However, the small size of the units will negate some of the advantages becausethe requirements for operating shift staff and security will not scale down perfectly. The staffingrequirements reported by NuScale (360 staff for a “12-pack” – 570 MWe) (NuScale Power, 2014)is similar to other staffing projections at 0.63 FTE/MWe. Smaller installations would result inincreased staffing on a FTE per MWe basis.
The staffing requirements for existing nuclear facilities in other jurisdictions have generally beenviewed favourably by their local communities because of the relatively high skill levels and incomeof nuclear facility staff, and the broader economic benefits that are brought to host communitiesand regions.

61
WSP | Parsons BrinckerhoffFebruary 2016
Project No 2265048A-STC-REP-004 Rev1Final ReportNuclear Fuel Cycle Royal Commission
7 COMMERCIAL ANALYSISThis section of the Business Case considers the potential role of nuclear power generation inSouth Australia, provides an assessment of the economic viability of nuclear power generationbased on the cost estimates set out in Section 6 and forecast electricity prices, and discussescommercial structures and revenue support mechanisms which may be required to underpinequity investment and debt financing for nuclear power stations in Australia.
The analysis contained in this section is indicative only, and further detailed analysis based onmore accurate cost assumptions, electricity market modelling, and consultation with potentialinvestors and financiers is required before drawing any definitive conclusions on the commercialand financial viability of nuclear power plants in South Australia.
7.1 MARKET ANALYSIS
Analysis of the electricity market and a potential role of nuclear power plants in this market is animportant consideration in the development of a high-level business case for nuclear powergeneration in South Australia.
South Australia is part of the National Electricity Market (NEM), which is one of the longestinterconnected networks in the world and includes South Australia, Victoria, Tasmania, NSW andQueensland. While South Australia has a significant generation portfolio in the State, it also relieson the interconnection with Victoria for both import and export of electricity. Two electricitytransmission links connect the South Australian and Victorian regions of the NEM.
Our analysis examines not only the potential for SA based nuclear power generation to supplySouth Australian market demand, but also the opportunity to export power into Victoria.
We provide below a high-level overview of the supply and demand trends in the South Australianand Victorian regions of the NEM. Our overview is based on the market analysis conducted by theAustralian Energy Market Operator (AEMO) (Australian Energy Market Operator, 2015b)(Australian Energy Market Operator, 2015a) and Electricity Supply Association of Australia(ESAA) (Energy Supply Association of Australia, 2015).
7.1.1 ELECTRICITY DEMAND
Operational electricity consumption in South Australia – all electricity used by residential,commercial and industrial consumers drawn from the grid – has been declining steadily for thelast four years to 2014/2015 as shown in Figure 7.1. The reduction in electricity consumption fromthe grid has been driven primarily by energy efficiency initiatives and increased uptake of rooftopsolar PV by residential and commercial sectors.
AEMO forecasts a slight short-term increase in operational electricity consumption in SA mainlydue to Port Pirie smelter redevelopment. However, in the medium-term, operational consumptionis forecast to decline as uptake of solar PV exceeds any demand growth. In the long-term,operational consumption is nearly static, as rooftop PV uptake slows to a level offsetting theincrease in consumption due to population growth. AEMO is also forecasting a significant declinein per capita consumption of electricity from the grid. These forecast trends are illustrated inFigure 7.1.

62
WSP | Parsons BrinckerhoffFebruary 2016
Project No 2265048A-STC-REP-004 Rev1Final ReportNuclear Fuel Cycle Royal Commission
Figure 7.1 Summary of operation consumption by key component in South Australia
Source: AEMO, National Electricity Forecasting Report, Detailed Summary of 2015 Electricity Forecasts
Maximum demand forecasts developed by AEMO for SA also show little demand growth asdemonstrated by Figure 7.2. Maximum demand is expected to increase from about 3,200 MW in2015 to about 3,600 MW by 2035.
Figure 7.2 Summer 10% POE maximum demand forecast segments for South Australia
Source: AEMO, National Electricity Forecasting Report, Detailed Summary of 2015 Electricity Forecasts
South Australia has a peaky load profile as compared to other States – its minimum operationaldemand in 2014/15 was only 790 MW comprising 1,235 MW of end user demand offset by445 MW generated by rooftop solar PV. The low load factor provides a challenge for somegeneration plant – there is a significant need for “load following” plant to be able to supply highlyvariable demand.
An uptake of solar PV in SA is expected to increase further as shown in Figure 7.3. Coupled withadoption of battery storage, this will lead to a further reduction in demand and consumption ofelectricity from the grid. AEMO estimates that installed rooftop solar PV capacity in SA will

63
WSP | Parsons BrinckerhoffFebruary 2016
Project No 2265048A-STC-REP-004 Rev1Final ReportNuclear Fuel Cycle Royal Commission
increase from 671 MW in 2014/15 to over 2,600 MW by 2034/35, and solar PV generation outputwill increase from 862 GWh per annum to 3,544 GWh per annum over this period.
Figure 7.3 Rooftop PV forecasts for low, medium and high consumption scenarios in SouthAustralia
Source: AEMO, National Electricity Forecasting Report, Detailed Summary of 2015 Electricity Forecasts
The above forecasts are based on industrial electricity consumption and maximum industrialdemand in SA remaining nearly unchanged in the medium and long term. A high industrialconsumption scenario adopted by AEMO would result in additional 1,500 GWh of annualconsumption over the static medium scenario by 2030. AEMO’s high industrial growth scenario isbased on growth in electricity consumption from manufacturing and mining sectors, includingexpansion of Olympic Dam and commissioning of Hillside Copper Project. Assuming fairly flatload profile of industrial demand, these additional 1,500 GWh of annual consumption could beprovided by about 180 MW of base load generation operating at 95% average capacity factor.
7.1.2 ELECTRICITY GENERATION
Electricity generation mix in South Australia is dominated by natural gas and renewable energysources – wind and solar PV. The following graphs in Figure 7.4 and Figure 7.5 show generationmix in SA by installed capacity and by generation output.
It should be noted that rooftop solar PV is not shown on these graphs as a principal generationsource – it is placed “behind the meter” and its generation output reduces demand for supply ofelectricity from the grid. Based on AEMO’s estimates, the share of electricity generated by rooftopsolar PV in the total electricity consumption (including “behind the meter” generation) in SA willincrease from 6.5% in 2014/15 to 17.5% in 2024/25 and to 23% in 2034/35.
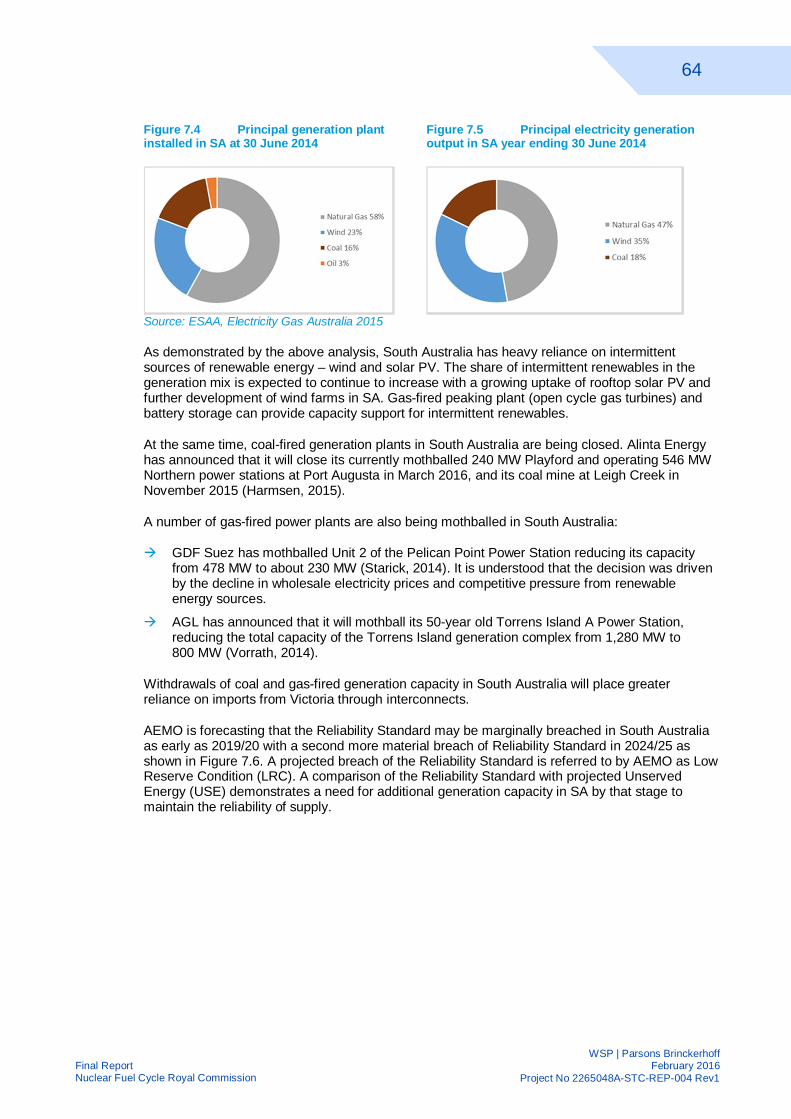
64
WSP | Parsons BrinckerhoffFebruary 2016
Project No 2265048A-STC-REP-004 Rev1Final ReportNuclear Fuel Cycle Royal Commission
Figure 7.4 Principal generation plantinstalled in SA at 30 June 2014
Figure 7.5 Principal electricity generationoutput in SA year ending 30 June 2014
Source: ESAA, Electricity Gas Australia 2015
As demonstrated by the above analysis, South Australia has heavy reliance on intermittentsources of renewable energy – wind and solar PV. The share of intermittent renewables in thegeneration mix is expected to continue to increase with a growing uptake of rooftop solar PV andfurther development of wind farms in SA. Gas-fired peaking plant (open cycle gas turbines) andbattery storage can provide capacity support for intermittent renewables.
At the same time, coal-fired generation plants in South Australia are being closed. Alinta Energyhas announced that it will close its currently mothballed 240 MW Playford and operating 546 MWNorthern power stations at Port Augusta in March 2016, and its coal mine at Leigh Creek inNovember 2015 (Harmsen, 2015).
A number of gas-fired power plants are also being mothballed in South Australia:
à GDF Suez has mothballed Unit 2 of the Pelican Point Power Station reducing its capacityfrom 478 MW to about 230 MW (Starick, 2014). It is understood that the decision was drivenby the decline in wholesale electricity prices and competitive pressure from renewableenergy sources.
à AGL has announced that it will mothball its 50-year old Torrens Island A Power Station,reducing the total capacity of the Torrens Island generation complex from 1,280 MW to800 MW (Vorrath, 2014).
Withdrawals of coal and gas-fired generation capacity in South Australia will place greaterreliance on imports from Victoria through interconnects.
AEMO is forecasting that the Reliability Standard may be marginally breached in South Australiaas early as 2019/20 with a second more material breach of Reliability Standard in 2024/25 asshown in Figure 7.6. A projected breach of the Reliability Standard is referred to by AEMO as LowReserve Condition (LRC). A comparison of the Reliability Standard with projected UnservedEnergy (USE) demonstrates a need for additional generation capacity in SA by that stage tomaintain the reliability of supply.

65
WSP | Parsons BrinckerhoffFebruary 2016
Project No 2265048A-STC-REP-004 Rev1Final ReportNuclear Fuel Cycle Royal Commission
Figure 7.6 South Australia supply adequacy (Medium scenario)
Source: AEMO, Electricity Statement of Opportunities, August 2015
The shortfall in grid-connected generation capacity in SA is likely to be met by gas-fired plantsand wind farms. According to the AEMO Electricity Statement of Opportunities 2015, proposednew generation projects in South Australia include 720 MW of gas-fired generation capacity(150 MW combined cycle gas turbines used to meet base/shoulder load and 570 MW open-cyclegas turbines typically used as peaking plant) and nearly 3,000 MW of wind projects. Clearly, onlyfew of these proposed projects will be developed; however, the strength of project pipeline isindicative of fierce competition in the generation market.
7.1.3 INTERCONNECTORS
SA is interconnected to the other states in the NEM through two interconnectors which cantransfer energy between the NEM and SA via the Victorian network as shown in Figure 7.7:
à Heywood – an alternating current (AC) interconnector between the South East of SA andHeywood Terminal Substation in Victoria with nominal capacity of 460 MW operated byElectraNet; and
à Murraylink – a direct current (DC) connection between Monash in the Riverland region ofSouth Australia and Red Cliffs in Victoria with nominal capacity of 220 MW operated by APAGroup.
Both interconnectors are regulated by the Australian Energy Regulator in terms of pricing andaccess.

66
WSP | Parsons BrinckerhoffFebruary 2016
Project No 2265048A-STC-REP-004 Rev1Final ReportNuclear Fuel Cycle Royal Commission
Figure 7.7 SA to VIC electricity transmission interconnects
Source: ElectraNet 2015 Annual Planning Report
The Heywood interconnector is being augmented to provide an additional 190 MW of capacity byJuly 2016, resulting in nominal transmission capacity of 650 MW in both directions (ElectraNet,2015). This will increase cumulative transmission capacity of the two interconnects from 680 MWto 870 MW.
The interconnectors play an important role in enhancing the reliability of power supply in both SAand Victoria. Bi-directional flows of electricity through interconnectors enable both export andimport of electricity by South Australia, although SA has historically been a net importer as shownin Figure 7.8.
Figure 7.8 Total interconnector imports and exports, South Australia
Source: AEMO, Historical Market Information Report, 2015

67
WSP | Parsons BrinckerhoffFebruary 2016
Project No 2265048A-STC-REP-004 Rev1Final ReportNuclear Fuel Cycle Royal Commission
7.1.4 OPPORTUNITIES FOR SA NUCLEAR POWER GENERATION TO SUPPLYSOUTH AUSTRALIAN MARKET
As demonstrated by the above analysis, the SA electricity market is characterised by:
à stagnant grid electricity consumption – in fact, AEMO forecasts total grid consumption ofelectricity in SA to decline marginally from 12,498 GWh in 2014/15 to 12,240 GWh in2034/35 (Australian Energy Market Operator, 2015a)
à peaky load shape of electricity demand with relatively low base load requirements; and
à generation mix dominated by renewables and natural gas-fired generation.
We believe that in the absence of any new industrial mega-loads, the electricity market in SouthAustralia is not conducive to entry of base load large-scale nuclear power plants based onPressurised Water Reactor (PWR), Boiling Water Reactor (BWR) and Pressurised Heavy WaterReactor (PHWR) technologies with reactor sizes ranging from 740 MW to 1575 MW per unit.
Installed generation capacity in SA is expected to grow in smaller increments to meet fairly lowgrowth in demand for capacity – this can be easily met by gas-fired generation which offers arange of turbine sizes to meet growth in demand for capacity (or provide replacement for retiringcapacity).
South Australia already has a high share of intermittent renewables – wind and solar PV – in itsgeneration mix and this share is expected to increase. Therefore, it requires peaking generatorswith fast response times to complement intermittent renewables. Peaky electricity demand in SAsimilarly requires generation that can meet highly variable electricity load and operate in “stop-start” mode when required.
Nuclear power plants usually operate as base load generators. While modern nuclear reactorshave some operational flexibility and can offer limited load following capabilities, we understandthat they have relatively slow response times to load changes and operation at reduced capacityutilisation is likely to be uneconomic.
Analysis of the Levelised Cost of Electricity (LCOE) in the following section of our reportdemonstrates that fixed costs – capital cost recovery and fixed operation and maintenance costs– account for most of the LCOE of nuclear power plants. Their marginal cost of generation is verylow. Operation of nuclear reactors at reduced capacity significantly reduces their overallprofitability. An advantage of a low marginal cost of generation is that it positions nuclear powerplants well in the merit order dispatch in the NEM.
Load following capabilities of nuclear power plants seem inferior to other technologies such asOpen Cycle Gas Turbines, which are often used to provide peaking generation capacity. Thedevelopment of commercial scale electricity storage offers a potential alternative to gas turbinesto meet demand peaks and/or provide backup for intermittent renewables.
In summary, the SA electricity market requires load-following generation plant, with relativelysmall unit sizes to meet incremental growth in demand for capacity. In contrast to SA marketneeds, large-scale nuclear power plants have large unit sizes and are designed for base loadoperation.
There could be market opportunities for SMRs to supply base load requirements of the SouthAustralian electricity market. SMR technologies considered in this study vary from 47.5 MWe to180 MWe per reactor. Small unit size and modular approach to development of SMRs positionthem well to meet incremental growth in demand for capacity in South Australia.

68
WSP | Parsons BrinckerhoffFebruary 2016
Project No 2265048A-STC-REP-004 Rev1Final ReportNuclear Fuel Cycle Royal Commission
We also understand that SMRs have greater operational flexibility and faster response times toload changes than larger reactors, i.e. they have better load following capabilities. However,similarly to larger reactors, operation at reduced capacity would significantly reduce overallprofitability of SMRs. We do not therefore see current SMR technologies beingsuitable/economically viable for operation as peaking generators. However, the potential to deploySMRs to meet base load and, possibly, shoulder load in the SA electricity market should beexplored in further detail.
7.1.5 OPPORTUNITIES FOR SA NUCLEAR POWER GENERATION TO SUPPLYTHE VICTORIAN MARKET
The Victorian electricity market presents better potential for large-scale nuclear power generation.In comparison with South Australia, the electricity market in Victoria has significantly higherdemand with a flatter load shape, prospects of moderate growth in grid electricity consumptionover the medium to long term, and existing generation mix dominated by ageing coal-firedgeneration fleet.
Following decline in grid electricity consumption in Victoria over the last five years, AEMOforecasts Victorian grid electricity consumption to increase gradually in the short, medium andlong term. The recovery in grid electricity consumption is expected to be driven by the residentialand commercial sectors, which account for most of the Victorian load. AEMO forecasts gridelectricity consumption in Victoria to increase from 42,635 GWh in 2014/15 to 50,315 GWh in2034/35 (Australian Energy Market Operator, 2015a).
Forecast grid electricity consumption in Victoria is shown in Figure 7.9.
Figure 7.9 Operational consumption by key component in Victoria
Source: AEMO, National Electricity Forecasting Report, Detailed Summary of 2015 Electricity Forecasts
Maximum demand in Victoria is expected to increase gradually by 2,000 MW – from about10,000 MW in 2014/15 to over 12,000 MW by 2034/35.
Brown coal-fired generation dominates Victorian electricity generation mix both by installedcapacity and by generation output, as shown in Figures 6.10 and 6.11.

69
WSP | Parsons BrinckerhoffFebruary 2016
Project No 2265048A-STC-REP-004 Rev1Final ReportNuclear Fuel Cycle Royal Commission
Rooftop solar PV is not shown on these graphs as a principal generation source. Similarly to SA,AEMO is predicting significant growth in installed capacity and generation output of rooftop solarPV in Victoria. However, the share of electricity generated by rooftop solar PV in the totalelectricity consumption (including “behind the meter” generation) in Victoria is expected to belower than in South Australia.
Figure 7.10 Principal generation plantinstalled in VIC at 30 June 2014
Figure 7.11 Principal generation output inVIC year ending 30 June 2014
Source: ESAA, Electricity Gas Australia 2015
Based on AEMO’s Electricity Statement of Opportunities 2015, Victoria has adequate generationcapacity to meet the Reliability Standard until 2024/25. Similar to SA, there is a strongdevelopment pipeline of proposed gas-fired generators and wind farms in Victoria.
The opportunity for SA-based large-scale nuclear power plants connected to the Victorian marketis to provide base load generation capacity when ageing brown coal-fired generators –Hazelwood (1,760 MW) and Yallourn (1,480 MW) – are ultimately retired. These generators havehighest carbon emissions in Australia’s generation sector – Hazelwood’s emission intensity is1.53 tonnes CO₂ per MWh sent-out, while Yallourn’s emission intensity is 1.42 tonnes CO₂ perMWh sent-out (ACIL Tasman, 2009). By comparison, Combined Cycle Gas Turbines in Victoriahave emission intensities of about 0.4 tonnes CO₂ per MWh sent-out and nuclear powergeneration would have near zero emissions.
Depending on other new entrants into the Victorian generation market and uptake of solar PV,closure of Hazelwood and Yallourn could create a market opportunity for over 3,200 MW of baseload generation capacity. This capacity could be provided by SA-based nuclear power plantsexporting to the Victorian market. Clearly, the existing interconnection capacity between SA andVictoria would be insufficient, and export of electricity to Victoria by large-scale nuclear powerplants based in SA would require development of new interconnectors with Victoria, as well asinvestment in the SA transmission grid ‘backbone’.
It should be noted that the following assumptions have been adopted for the purposes of ourfinancial analysis, as requested by the Nuclear Fuel Cycle Royal Commission:
à Small Modular Reactors are connected to SA region of the NEM and receive SA RegionalReference Price, i.e. spot price at the SA Regional Reference Node. The cost of connectionto the SA grid has been allowed for in the analysis of LCOE. No additional investment in SAgrid infrastructure would be required for connection of SMRs.
à Similarly, large-scale nuclear reactors are connected to SA region of the NEM and receiveSA Regional Reference Price. The cost of connection of these plants to the SA grid has beenallowed for in the analysis of LCOE. However, capital and operating costs of SA gridaugmentation and interconnects with Victoria to enable export of power from SA are notincluded in the calculation of LCOE.

70
WSP | Parsons BrinckerhoffFebruary 2016
Project No 2265048A-STC-REP-004 Rev1Final ReportNuclear Fuel Cycle Royal Commission
For both SMRs and large scale nuclear power plants, the LCOE is effectively measured at thepoint of connection to the SA grid. We note that, under the current regulatory regime fortransmission networks, nuclear power plants causing the need for SA grid augmentation anddevelopment of additional interconnectors with Victoria would have to pay for the recovery ofcapital and operating costs of these assets. Unless there is a Government subsidy to cover thecost of SA grid augmentation and new interconnection assets or a fundamental change inregulation of transmission networks and recovery of their costs, the projected LCOE for large-scale nuclear power plants would in fact be higher than the outcomes of our analysis.
7.2 FINANCING CONSIDERATIONS
Our analysis of financing considerations for nuclear power plants is based on our experience infinancing energy and infrastructure projects in the Australian market and a high-level desk-topreview of recent international experience in nuclear power development and financing. We havenot undertaken market sounding discussions with potential equity investors in nuclear powerplants and potential debt financiers. Any comments on the financing challenges and potentialsupport mechanisms to underpin financing are based on desk-top analysis and require furtherconsideration in dialogue with equity investors and debt financiers.
7.2.1 FINANCING CHALLENGES
Nuclear power plants have faced a number of financing challenges in international jurisdictions.We expect that these financing challenges would be magnified for the first nuclear power plants tobe developed in the Australian market. While the assumption is that nuclear power plants beingconsidered for South Australia would be Next-of-a-Kind from the technology perspective, theywould ultimately be considered First-of-a-Kind from a commercial and financing perspective.
We have developed a list of key considerations for debt financiers of nuclear power plants,assuming they are to be financed on a non-recourse or limited recourse basis by private sectorlenders. We have set out a financier checklist (Table 7.1) and financier due diligencerequirements (Table 7.2) in the following pages.
We believe that the four threshold issues in financing of nuclear power plants in the Australianmarket are as follows:
1. Legislative/regulatory risk
This study is based on the assumption of a legislative change allowing commercialproduction of nuclear power in Australia and introduction of a comprehensive range ofregulations governing the nuclear power industry. However, a legislative changeaccompanied by appropriate regulatory instruments does not eliminate the risk of futurechanges in legislation/regulations that could have an adverse impact on nuclear powerindustry. Asset life of a nuclear power plant is estimated at 60 years – it would span twentyFederal elections. Strong bipartisan support of a nuclear power industry in Australia would berequired to reduce the perception of legislative/regulatory risk by equity investors and debtfinanciers.
Depending on the assessment of legislative/regulatory risk by the financiers of nuclear powerplants at the time of investment decision, they could seek for the Government to step in andmitigate this risk, at least for a part of the asset life.
Typical instruments for the Government to mitigate legislative/regulatory risk include debtguarantees and commitments to compensate equity investors in case of adverse legislativechanges.
2. Reputation risk
Reputation risk would be one of the key issues for major Australian banks in lending tonuclear power plants, as they have a strong focus on the public acceptance of their business

71
WSP | Parsons BrinckerhoffFebruary 2016
Project No 2265048A-STC-REP-004 Rev1Final ReportNuclear Fuel Cycle Royal Commission
practices. Negative public opinion and impact on reputation could impact on the ability ofmajor Australian banks to provide financing.
A national study of public opinion on nuclear power conducted by Macquarie University postthe Fukushima disaster concluded that most Australians were not willing to accept nuclearpower as an option to help tackle climate change, despite believing that nuclear poweroffered a cleaner option than coal for domestic energy production (Bird, et al., 2013).
Public acceptance of nuclear power would need to improve significantly to ensureparticipation of Australian banks in nuclear power plant financing. Raising debt financing fornuclear power developments in Australia purely from international banks/capital marketswould be more challenging and could lead to increased financing costs.
3. Revenue riskDebt financiers of nuclear power plants would likely seek mitigation of revenue risk for part ofthe asset life through long-term power off-take contracts or other instruments, such asContracts for Differences. Different mechanisms for providing revenue certainty required tounderpin debt financing are discussed in further detail below.
4. Technology risk
Debt financiers typically undertake a thorough assessment of technology risk beforecommitting funds to a project – this would include technical due diligence by independentengineering firms and review of operational track record of projects based on similartechnologies. Nuclear power technologies considered in this study would need to reach alevel of technical maturity by the time of their proposed deployment in Australia, andtechnology vendors would need to be able to provide appropriate performance warranties forthe technology risk to be acceptable to debt financiers.
Table 7.1 Financier checklist
KEY RISK MITIGATION FACTORS
Power Purchase Agreement (or other instrument providing revenue certainty)à covering most forecast generation output
à providing long-term price certainty (ideally with pass-through of any additional costs)à term of PPA to exceed debt repayment profile by at least a couple of years
Engineering, Procurement, and Construction (EPC) contractà fixed price with cost overruns passed to the EPC contractor
à damages for delays
à performance warranties
à creditworthy contractor
Fuel supply and pricing arrangementsà certainty of supply of fuel meeting power plant specifications
à transparent pricing mechanism
Operation and maintenance contractsà experienced contractors
à largely fixed pricing
à operating performance warranties
à creditworthy contractors
Interest rate risk – appropriate hedging strategy

72
WSP | Parsons BrinckerhoffFebruary 2016
Project No 2265048A-STC-REP-004 Rev1Final ReportNuclear Fuel Cycle Royal Commission
KEY RISK MITIGATION FACTORS
Appropriate insurance policies to cover all aspects of plant, operations, environment, employees
Mitigation of legislative/regulatory riskà may require a form of “termination” payment from the SA Government to ensure full repayment of
debt and other priority or secured creditors in the event of an adverse legislative change
Reserve accounts to be funded and maintained to cover items which may include:à debt interest service reserve
à maintenance reserveà plant decommissioning and spent fuel disposal reserve
Table 7.2 Financier due diligence requirements
FINANCIER DUE DILIGENCE REQUIREMENTS
Financial model (independently reviewed), including:à detailed P&L, cash flow and balance sheet forecasts for entire asset life cycle
à full debt and covenant schedule
Financial due diligence, including independent review of assumptions on:à energy market overview
à plant availability and capacity
à volumes of electricity generated
à electricity pricing forecasts
à project costs – capital and operating
à fuel supply and spent fuel disposal costs
à development timetable
à plant decommissioning strategy and plan
à insurance
à financing package
à refinancing strategy
à taxation

73
WSP | Parsons BrinckerhoffFebruary 2016
Project No 2265048A-STC-REP-004 Rev1Final ReportNuclear Fuel Cycle Royal Commission
FINANCIER DUE DILIGENCE REQUIREMENTS
Legal due diligence, including independent review of:à compliance with relevant legislation and regulations
à licencing requirements and licences held
à EPC contracts
à network access and connection agreements
à Operation & Maintenance contracts
à fuel supply agreements
à PPAà insurance policies
à shareholder agreements
à employee & management contracts
à real estate titles or lease agreements
à any hardware / equipment leases
Technical due diligence, including independent review of:à track record of selected technology vendors
à historical performance of selected technologies at other sites
à site conditions
à Environmental Impact Study
à grid connection studies and agreements with network operator
à construction budgets and timetable
à operating regime assumptions
à operation and maintenance costs
à nuclear safety case
à arrangements for disposal of spent fuel
7.2.2 CONSIDERATION OF LONG-TERM OFF-TAKE CONTRACTS
Participants in the NEM face exposure to volatility in spot electricity prices – spot prices canfluctuate from negative $1,000/MWh (National Electricity Rules, clause 3.9.6) to a maximum of$13,800/MWh (National Electricity Rules, clause 3.9.4; Schedule of reliability settings, 12February 2015 (Australian Energy Market Commission, 2015). Arguably, the electricity spotmarket in the NEM shows greater volatility than most financial or commodity markets. Electricitymarket participants hedge their exposure to spot market price volatility in the contract marketusing a range of risk management tools aimed at providing revenue certainty to generators andcost certainty to retailers/energy users. The contract market is fairly liquid for short-term hedgingof spot electricity prices (up to one year), has some liquidity for medium-term hedging (one tothree years), and has very limited liquidity for long-term contracts. Most contracts with terms overthree years are bilateral agreements between generators and retailers/large industrial users.Terms of such bilateral contracts vary, but rarely exceed 15 years.
Nuclear power plants face higher risks as compared to other generation technologies, as they:
à are more capital intensive and have longer asset life than most other proven generationtechnologies;
à have long development timeframes and are highly sensitive to interest rate and foreignexchange rate fluctuations;
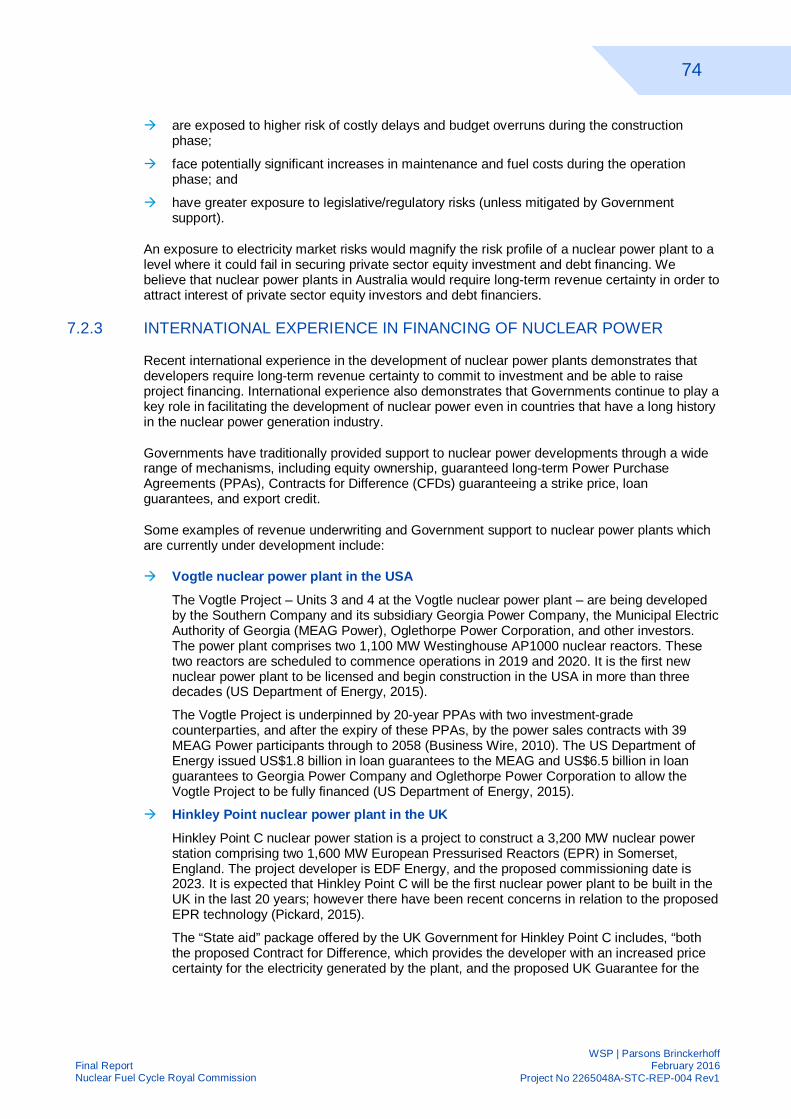
74
WSP | Parsons BrinckerhoffFebruary 2016
Project No 2265048A-STC-REP-004 Rev1Final ReportNuclear Fuel Cycle Royal Commission
à are exposed to higher risk of costly delays and budget overruns during the constructionphase;
à face potentially significant increases in maintenance and fuel costs during the operationphase; and
à have greater exposure to legislative/regulatory risks (unless mitigated by Governmentsupport).
An exposure to electricity market risks would magnify the risk profile of a nuclear power plant to alevel where it could fail in securing private sector equity investment and debt financing. Webelieve that nuclear power plants in Australia would require long-term revenue certainty in order toattract interest of private sector equity investors and debt financiers.
7.2.3 INTERNATIONAL EXPERIENCE IN FINANCING OF NUCLEAR POWER
Recent international experience in the development of nuclear power plants demonstrates thatdevelopers require long-term revenue certainty to commit to investment and be able to raiseproject financing. International experience also demonstrates that Governments continue to play akey role in facilitating the development of nuclear power even in countries that have a long historyin the nuclear power generation industry.
Governments have traditionally provided support to nuclear power developments through a widerange of mechanisms, including equity ownership, guaranteed long-term Power PurchaseAgreements (PPAs), Contracts for Difference (CFDs) guaranteeing a strike price, loanguarantees, and export credit.
Some examples of revenue underwriting and Government support to nuclear power plants whichare currently under development include:
à Vogtle nuclear power plant in the USA
The Vogtle Project – Units 3 and 4 at the Vogtle nuclear power plant – are being developedby the Southern Company and its subsidiary Georgia Power Company, the Municipal ElectricAuthority of Georgia (MEAG Power), Oglethorpe Power Corporation, and other investors.The power plant comprises two 1,100 MW Westinghouse AP1000 nuclear reactors. Thesetwo reactors are scheduled to commence operations in 2019 and 2020. It is the first newnuclear power plant to be licensed and begin construction in the USA in more than threedecades (US Department of Energy, 2015).
The Vogtle Project is underpinned by 20-year PPAs with two investment-gradecounterparties, and after the expiry of these PPAs, by the power sales contracts with 39MEAG Power participants through to 2058 (Business Wire, 2010). The US Department ofEnergy issued US$1.8 billion in loan guarantees to the MEAG and US$6.5 billion in loanguarantees to Georgia Power Company and Oglethorpe Power Corporation to allow theVogtle Project to be fully financed (US Department of Energy, 2015).
à Hinkley Point nuclear power plant in the UK
Hinkley Point C nuclear power station is a project to construct a 3,200 MW nuclear powerstation comprising two 1,600 MW European Pressurised Reactors (EPR) in Somerset,England. The project developer is EDF Energy, and the proposed commissioning date is2023. It is expected that Hinkley Point C will be the first nuclear power plant to be built in theUK in the last 20 years; however there have been recent concerns in relation to the proposedEPR technology (Pickard, 2015).
The “State aid” package offered by the UK Government for Hinkley Point C includes, “boththe proposed Contract for Difference, which provides the developer with an increased pricecertainty for the electricity generated by the plant, and the proposed UK Guarantee for the

75
WSP | Parsons BrinckerhoffFebruary 2016
Project No 2265048A-STC-REP-004 Rev1Final ReportNuclear Fuel Cycle Royal Commission
project, which will help unlock debt finance” (Department of Energy & Climate Change,2014).
The European Commission has approved the Hinkley Point C state aid case. “The UKGovernment and EDF are continuing to work together to finalise the Hinkley Point project,including the full terms of the Contract for Difference and the financing arrangements for theproject, which includes support from the UK Guarantee” (Department of Energy & ClimateChange, 2014). CFD provides revenue guarantee to EDF for 35 years from the agreed dateof commissioning of the Hinkley Point C nuclear power plant. We understand that the HinkleyPoint C project is yet to reach financial close.
7.2.4 IMPLICATIONS FOR SA GOVERNMENT
Our hypothesis for the financing of nuclear power plants in South Australia is that:
1. nuclear power plants would require long-term revenue certainty in order to attract interest ofprivate sector equity investors and debt financiers; and
2. the SA Government would need to provide significant support through revenue underwriting,loan guarantees and/or other forms in order to attract private sector developers andfinanciers of nuclear power generation.
There are very few precedents in the Australian energy market for PPAs or electricity hedgingcontracts with very long contract durations, and some of these long-term agreements involvedGovernments as counterparties. As an example, the Victorian Government entered into a long-term PPA with the developers of a coal-fired power station to support its 30-year power supplyarrangements with Alcoa’s aluminium smelters.
If private-sector players in the National Electricity Market are not willing to enter into electricityhedging contracts with nuclear power stations for a sufficiently long term to underpin projectfinancing, the SA Government may consider providing revenue certainty to a nuclear power plantdeveloper through a CFD or another revenue support mechanism. Clearly, the SA Governmentwould need to conduct comprehensive market consultation and thorough cost-benefit analysisbefore committing to a revenue support for a nuclear power plant.
Similarly, renewable energy projects and new generation assets supplying mining/mineralsprocessing operations are also seeking long-term revenue certainty to underpin project financing,albeit for shorter periods than terms likely to be sought by nuclear power developers. A number ofrenewable energy projects have recently secured long-term off-take contracts for electricity andLarge-scale Generation Certificates with terms of around 15 years, i.e. until the expiry ofRenewable Energy Target in 2030. Several mining projects in WA have entered into 15-20 yearPPAs to underpin the development and financing of dedicated generation infrastructure to supplytheir power requirements.
State Governments in Australia play an active role in underpinning the development of renewableenergy projects by providing long-term off-take contracts or guaranteed feed-in tariffs. Examplesof direct Government support to renewables include 200 MW wind and 40 MW solar auctionsconducted by the ACT Government, plans by the QLD Government to facilitate a 40 MW solarproject, and considerations by the Victorian Government of using its energy procurementframework to underpin new renewable energy capacity. State Government-owned waterauthorities in SA, VIC, NSW and WA have entered into long-term renewable energy purchaseagreements.
As demonstrated by international examples, nuclear power plant developers are likely to seekrevenue support for longer terms than the current market precedents with renewable energyprojects in Australia. It is therefore considered unlikely that the development of nuclear powerindustry will occur without some form of Government support.

76
WSP | Parsons BrinckerhoffFebruary 2016
Project No 2265048A-STC-REP-004 Rev1Final ReportNuclear Fuel Cycle Royal Commission
Comments on potential capital structure for nuclear power plants in this report are based on theassumption that:
1. nuclear power plants in South Australia will have long-term revenue certainty to attractprivate sector funding; and
2. revenue received by nuclear power plants will generate sufficient net operating income tomeet debt covenants imposed by the financiers, such as Debt Service Cover Ratio and LoanLife Cover Ratio.
The SA Government may need to provide both long-term revenue support and loan guarantees tofacilitate the development of nuclear power industry in the State.
7.3 ECONOMIC VIABILITY
7.3.1 METHODOLOGY
A comparison of the Levelised Cost of Electricity (LCOE) for a particular generation technologywith the Levelised Price of Electricity (LPOE) in the market is often used to provide a high-levelassessment of the potential economic viability of the generation technology.
LCOE is an economic assessment of the unit price of electricity required for the generator tocover its lifecycle costs (i.e. initial capital investment, operation and maintenance, fuel usage anddecommissioning, etc.) and generate a required rate of return on capital. LCOE is an industrymeasure frequently used to compare the competitiveness of different power generationtechnologies.
LCOE is calculated as the net present value (NPV) of total life cycle costs of the project divided bythe NPV of net quantity of electricity produced over the project life.
=NPVTotallifecyclecosts
NPVTotallifetimeelectricityproduction
LCOE is then compared with the LPOE in the wholesale market to assess the potential economicviability of the generator. LPOE is the net present value of total electricity sales over the life of theproject divided by the net present value of the net quantity of electricity produced over the projectlife.
=NPVTotalelectricitysales
NPVTotallifetimeelectricityproduction
The same real pre-tax Weighted Average Cost of Capital (WACC) is used as a discount rate toderive the NPVs used to calculate the LCOE and the LPOE. It is based on the analysis ofpotential gearing structure, the estimated rate of return on equity, and the estimated cost of debtfinancing.
The difference between the LCOE and the LPOE is described below as a commercial gap orsurplus. A commercial gap analysis can also be used as a high-level measure of the degree ofGovernment financial support that may be required to facilitate delivery of the project by a privatesector developer; a surplus indicates that the project may be economically viable in its own right.
To derive the LCOE and LPOE for nuclear reactor types being considered in this study (referSection 2), we have developed an ungeared pre-tax cash flow model. We have assumed singlereactor plants for large-scale nuclear reactors and multiple reactor configurations for SMRs, suchas a 2 x 180 MW for a Large SMR and 6 x 47.5 MW for a Small SMR facility. The model coverspre-construction, construction and operating cash flows for each type of nuclear power plant. It

77
WSP | Parsons BrinckerhoffFebruary 2016
Project No 2265048A-STC-REP-004 Rev1Final ReportNuclear Fuel Cycle Royal Commission
also includes an annual contribution to a decommissioning reserve to be funded through theoperating life of the plant to cover its expected decommissioning costs.
An overview of the financial model structure is set out in Figure 7.12.

78
WSP | Parsons BrinckerhoffFebruary 2016
Project No 2265048A-STC-REP-004 Rev1Final ReportNuclear Fuel Cycle Royal Commission
Figure 7.12 Financial model schematic

79
WSP | Parsons BrinckerhoffFebruary 2016
Project No 2265048A-STC-REP-004 Rev1Final ReportNuclear Fuel Cycle Royal Commission
7.3.2 ASSUMPTIONS
We summarise below the assumptions adopted for calculation of LCOE and LPOE in ouranalysis.
Development timeframes: As instructed by the Nuclear Fuel Cycle Royal Commission, we haveassumed that nuclear power plants would commence operations in 2030 at the earliest. Section 6sets out a range of assumptions for pre-construction and construction timeframes, including High,Central, and Low scenarios for each reactor type. Large-scale reactors with longer developmenttimeframes have later start dates as compared to SMRs, which can be constructed over shorterperiods.
As requested by the Royal Commission, the valuation date for the calculation of both LCOE andLPOE is 30 June 2015. Our timing assumptions are shown in the following chart.
We note that investment in the development of nuclear power plants does not commence until2020/21, i.e. five years from the adopted valuation date, in all scenarios considered in ouranalysis. Both LCOE and LPOE would be proportionally higher, if calculated as at the impliedinvestment decision date of 30 June 2020.
In comparing the LCOE of nuclear power plants to LCOE of other generation technologies, it isimportant to adopt consistent assumptions in respect of the valuation date and commencementdate for the project development.
Figure 7.13 Timing assumptions
Operating and dispatch regime – As discussed in Section 3, it has been assumed that allnuclear power plants operate as base load generators. The assumed average capacity factorstherefore reflect plant availability. It has been assumed that nuclear power plants are alwaysdispatched into the National Electricity Market, when they are technically available to generate.
Operating timeframes – It has been assumed that all plants will have a 60-year operating life.Mid-life refurbishment assumptions have been incorporated for reactors that require it.
Capital and operating cost assumptions – Capital and operating cost assumptions for differentnuclear plants considered in this study are set out in Section 6. The inclusion of High, Central, andLow scenarios for most cost assumptions enables sensitivity analysis.
Electricity price –Figure 7.14 shows the forecast electricity price in South Australia developed byErnst & Young for the Nuclear Fuel Cycle Royal Commission as of 11 November 2015.

80
WSP | Parsons BrinckerhoffFebruary 2016
Project No 2265048A-STC-REP-004 Rev1Final ReportNuclear Fuel Cycle Royal Commission
Figure 7.14 Electricity price forecasts
Source: Ernst & Young
Price forecasting methodology and assumptions underpinning each of the above electricity pricescenarios are discussed in a separate report by Ernst & Young.
We are aware that Ernst & Young continued to refine the wholesale electricity price forecast afterthe data set of 11 November 2015, and that later data from 30 November 2015 was used by otheradvisers to the NFCRC in their work. However, we were unable to use the later data due to thetime pressures of analysis and reporting deadlines for our study. Ernst & Young has provided acomparison of the data from 30 November 2015 with that of 11 November 2015, which wesummarise as follows.
The data set concerned is known as scenario “IS3 Large”, and represents the wholesale priceforecast resulting from strong climate action and the inclusion of a large-scale nuclear generationfacility in the generation mix. The IS3 Large price trajectory used in the analysis assumed arelatively high carbon price, and relatively low penetration of renewable energy storage systemscompared with later projections. Figure 7.15 shows the comparison between the data as issuedby Ernst & Young on 11 November 2015 and 30 November 2015.
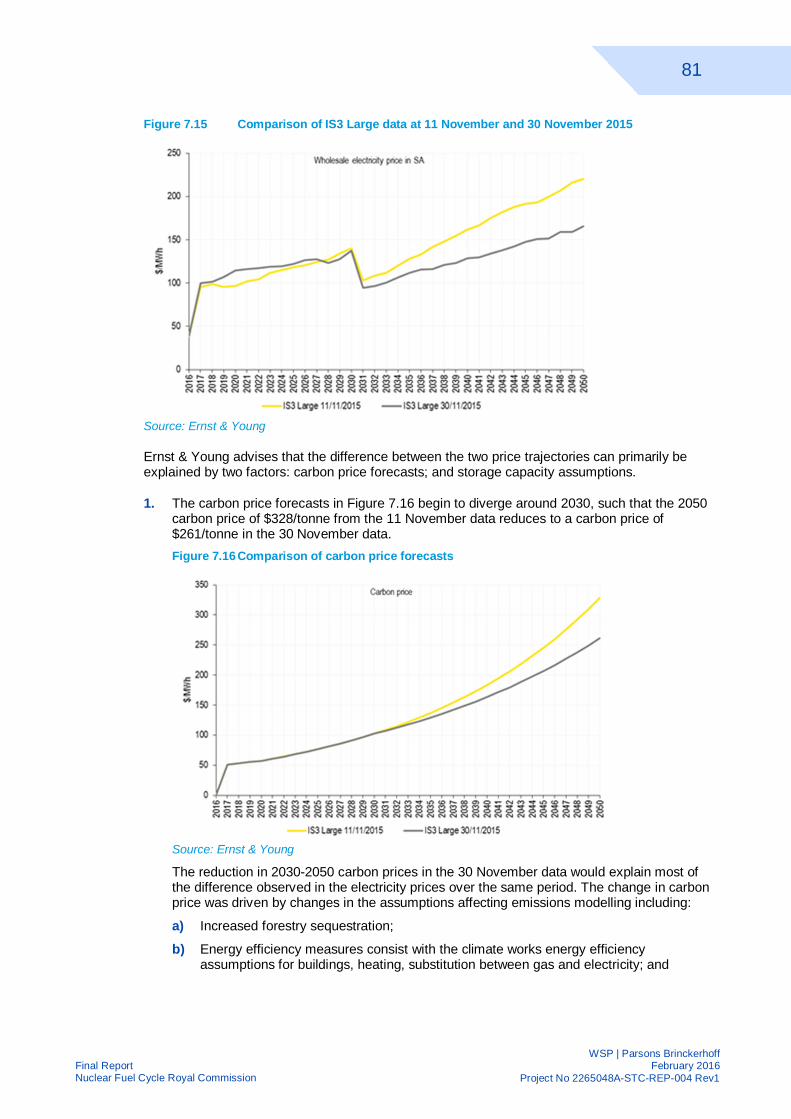
81
WSP | Parsons BrinckerhoffFebruary 2016
Project No 2265048A-STC-REP-004 Rev1Final ReportNuclear Fuel Cycle Royal Commission
Figure 7.15 Comparison of IS3 Large data at 11 November and 30 November 2015
Source: Ernst & Young
Ernst & Young advises that the difference between the two price trajectories can primarily beexplained by two factors: carbon price forecasts; and storage capacity assumptions.
1. The carbon price forecasts in Figure 7.16 begin to diverge around 2030, such that the 2050carbon price of $328/tonne from the 11 November data reduces to a carbon price of$261/tonne in the 30 November data.Figure 7.16 Comparison of carbon price forecasts
Source: Ernst & Young
The reduction in 2030-2050 carbon prices in the 30 November data would explain most ofthe difference observed in the electricity prices over the same period. The change in carbonprice was driven by changes in the assumptions affecting emissions modelling including:
a) Increased forestry sequestration;
b) Energy efficiency measures consist with the climate works energy efficiencyassumptions for buildings, heating, substitution between gas and electricity; and

82
WSP | Parsons BrinckerhoffFebruary 2016
Project No 2265048A-STC-REP-004 Rev1Final ReportNuclear Fuel Cycle Royal Commission
c) Re-parameterisation of non-combustion marginal abatement cost curves in Ernst &Young’s CGE model.
2. Storage capacity assumptions of 30 November 2015 included more capacity than those of 11November 2015. The increased assumption was made particularly in response to volatiledemand and prices. The storage capacity assumption of 11 November 2015, it was assumedthat in the long term approximately 30% of all rooftop solar photovoltaic systems would bepaired with battery storage. The assumption of 30 November 2015 increased the penetrationof storage systems to 50%. The additional storage would lead to a reduction in the frequencyof high price events, and thereby a reduction in average wholesale electricity price.Figure 7.17 Comparison of carbon price forecasts
Source: Ernst & Young
In addition to the above changes, Ernst & Young introduced a number of other changes into themodelling with regards to demand, capacity mix, bidding strategy and EV demand, that alsocontributed to differences between the 11 November and 30 November data.
Ernst & Young provided the two sets of price forecasts to NFCRC at the time as draft data.Indeed, we understand that the data has been further refined to account for the more aggressivecarbon abatement commitments made at the United Nations Conference on Climate Change inParis. At this stage, we have not been requested to review the analysis in light of the wholesaleprice forecast of 30 November or that post-Paris, and confirm that our analysis is based on theforecasts supplied by Ernst & Young on 11 November 2015.
Inflation and real cost escalator – Consistent with other work streams being undertaken by theNuclear Fuel Cycle Royal Commission, we have assumed:
à CPI of 2.5% for all cash flows; and
à Real escalator of 1.05% for operating costs (excluding fuel costs)
Foreign exchange rate – Costs estimated in US$ have been converted to AU$ at the forecastexchange rate for the year when costs are expected to be incurred. No exchange rate hedginghas been assumed in our financial analysis. Figure 7.18 shows the US$/AU$ exchange rateforecasts developed by Ernst & Young for the Nuclear Fuel Cycle Royal Commission.

83
WSP | Parsons BrinckerhoffFebruary 2016
Project No 2265048A-STC-REP-004 Rev1Final ReportNuclear Fuel Cycle Royal Commission
Figure 7.18 US$/AU$ exchange rate forecast
Source: Ernst & Young
Discount rate – Consistent with other work streams being undertaken by the Nuclear Fuel CycleRoyal Commission, we have used a 10% pre-tax real WACC as a discount rate in our analysis ofLCOE and LPOE. The WACC adopted by the Nuclear Fuel Cycle Royal Commission is broadlyconsistent with both of the following:
· our own analysis of WACC for nuclear power plants in Australia which has resulted in a pre-tax real WACC of 10.47% (see Appendix B for our WACC estimation); and
· WACC analysis developed by Imperial College in its study “Cost estimates for nuclear powerin the UK” (Harris, et al., 2012). Imperial College applied a real pre-tax WACC of 11% in theiranalysis of LCOE for nuclear power plants in the UK, up from 10% real pre-tax in their earlieranalysis. Imperial College also refers to estimates provided by Areva, whose view was that“liberalised markets would require 11% pre-tax real WACC to invest in nuclear powergeneration”.
We have also undertaken the analysis of sensitivity of model outcomes to the discount rateassumption by calculating the LCOE and LPOE using a 7% and 13% pre-tax real WACC.
7.3.3 OUTPUTS AND CONCLUSIONS
In order to assess the potential economic viability of different nuclear reactor types in SouthAustralia, we have considered a range of scenarios incorporating various assumptions forelectricity price, nuclear power plant (NPP) capital and operating costs, and WACC.
The outputs of our financial analysis are under the base-case assumptions (Central scenario forcapital and operating costs and 10% pre-tax real WACC) and analysis of sensitivities to: a) capitaland operating costs; and b) WACC; are discussed in this section of the report.

84
WSP | Parsons BrinckerhoffFebruary 2016
Project No 2265048A-STC-REP-004 Rev1Final ReportNuclear Fuel Cycle Royal Commission
7.3.3.1 KEY COST DRIVERS FOR NUCLEAR POWER PLANTS
The composition of LCOE for different nuclear reactor types under the base-case scenario isshown in Figure 7.19 and summarised in the following tables:
Figure 7.19 LCOE cost breakdown
The composition of LCOE shows that all nuclear power technologies are characterised by highfixed costs and relatively low variable costs. Capital cost recovery and fixed operation &maintenance costs account for about 90% of LCOE of nuclear power plants (Central costscenario, 10% real pre-tax WACC). Capital cost of plant construction is by far the largestcomponent of the LCOE. The cost of fuel supply to nuclear power plants is a relatively minorcomponent of their LCOE. The PHWR technologies have proportionately higher variable costs asa result of estimated spent fuel disposal costs which are approximately six times greater thanother reactor types.
7.3.3.2 POTENTIAL ECONOMIC VIABILITY OF NUCLEAR POWER PLANTS
The potential economic viability of nuclear power plants can be assessed using a range ofmeasures such as
1. commercial surplus or gap, i.e. the difference between LPOE and LCOE (gap indicating thatthe plant is not viable under given assumptions);
2. NPV (negative NPV indicating that the plant is not viable under given assumptions); and
$/MWh %133 71%34 19%10 6%7 4%
184
Construction and developmentFixed operating costsFuel supply costsVariable operating costs
Cost categoryPWR - AP1000 Cost Breakdown
Total
$/MWh %128 71%35 19%10 6%7 4%
180
Construction and developmentFixed operating costsFuel supply costsVariable operating costs
Cost categoryBWR - ESBWR Cost Breakdown
Total
$/MWh %146 61%35 15%10 4%48 20%238
Construction and developmentFixed operating costsFuel supply costsVariable operating costs
Cost categoryPHWR (Large) - ACR1000 Cost Breakdown
Total
$/MWh %154 63%34 14%10 4%48 19%246
Construction and developmentFixed operating costsFuel supply costsVariable operating costs
Cost categoryPHWR (Small) - EC6 Cost Breakdown
Total
$/MWh %147 74%31 16%12 6%8 4%
198
Construction and developmentFixed operating costsFuel supply costsVariable operating costs
Cost categorySMR (Large) - mPower Cost Breakdown
Total
$/MWh %172 78%32 14%12 5%8 3%
225
Construction and developmentFixed operating costsFuel supply costsVariable operating costs
Cost categorySMR (Small) - NuScale Cost Breakdown
Total
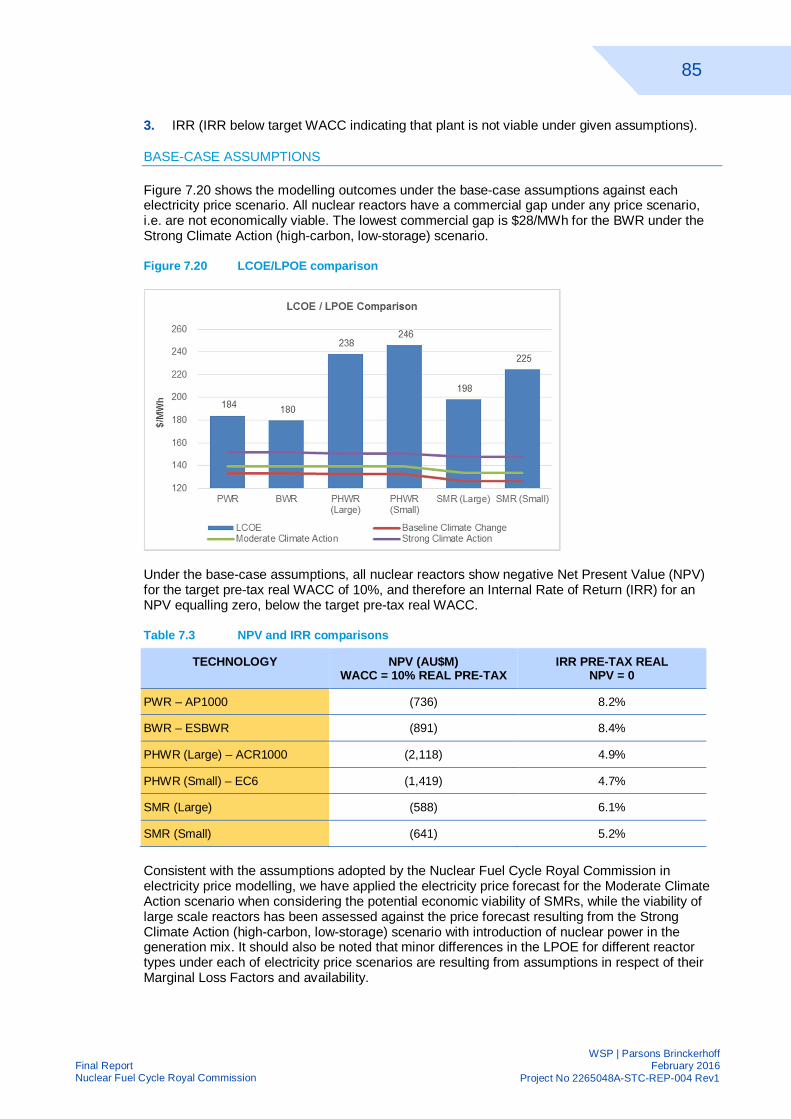
85
WSP | Parsons BrinckerhoffFebruary 2016
Project No 2265048A-STC-REP-004 Rev1Final ReportNuclear Fuel Cycle Royal Commission
3. IRR (IRR below target WACC indicating that plant is not viable under given assumptions).
BASE-CASE ASSUMPTIONS
Figure 7.20 shows the modelling outcomes under the base-case assumptions against eachelectricity price scenario. All nuclear reactors have a commercial gap under any price scenario,i.e. are not economically viable. The lowest commercial gap is $28/MWh for the BWR under theStrong Climate Action (high-carbon, low-storage) scenario.
Figure 7.20 LCOE/LPOE comparison
Under the base-case assumptions, all nuclear reactors show negative Net Present Value (NPV)for the target pre-tax real WACC of 10%, and therefore an Internal Rate of Return (IRR) for anNPV equalling zero, below the target pre-tax real WACC.
Table 7.3 NPV and IRR comparisons
TECHNOLOGY NPV (AU$M)WACC = 10% REAL PRE-TAX
IRR PRE-TAX REALNPV = 0
PWR – AP1000 (736) 8.2%
BWR – ESBWR (891) 8.4%
PHWR (Large) – ACR1000 (2,118) 4.9%
PHWR (Small) – EC6 (1,419) 4.7%
SMR (Large) (588) 6.1%
SMR (Small) (641) 5.2%
Consistent with the assumptions adopted by the Nuclear Fuel Cycle Royal Commission inelectricity price modelling, we have applied the electricity price forecast for the Moderate ClimateAction scenario when considering the potential economic viability of SMRs, while the viability oflarge scale reactors has been assessed against the price forecast resulting from the StrongClimate Action (high-carbon, low-storage) scenario with introduction of nuclear power in thegeneration mix. It should also be noted that minor differences in the LPOE for different reactortypes under each of electricity price scenarios are resulting from assumptions in respect of theirMarginal Loss Factors and availability.

86
WSP | Parsons BrinckerhoffFebruary 2016
Project No 2265048A-STC-REP-004 Rev1Final ReportNuclear Fuel Cycle Royal Commission
Sensitivity analysis shows that LCOE of nuclear power plants is most sensitive to capital cost andWACC assumptions.
SENSITIVITY TO CAPITAL AND OPERATING COSTS
Figure 7.21 summarises the modelling outcomes under Low cost assumptions and a base-caseWACC of 10%. Under this Low cost sensitivity, the PWR and BWR nuclear reactor technologiesappear to be economically viable under the Strong Climate Action (high-carbon, low-storage)price scenario.
Figure 7.21 Low cost LCOE/LPOE comparison
Figure 7.22 summarises the modelling outcomes under High cost assumptions and a base-caseWACC of 10%. All technologies are not economically viable under any price scenario. The lowestcommercial gap is $65/MWh for the BWR under the Strong Climate Action (high-carbon, low-storage) price scenario.
Figure 7.22 High cost LCOE/LPOE Comparison

87
WSP | Parsons BrinckerhoffFebruary 2016
Project No 2265048A-STC-REP-004 Rev1Final ReportNuclear Fuel Cycle Royal Commission
SENSITIVITY TO WACC
Figure 7.23 summarises the modelling outcomes under Central cost assumptions and a lowerWACC of 7%. Under this low WACC sensitivity, the PWR, BWR and Large SMR technologiesappear to be economically viable under the Strong Climate Action (high-carbon, low-storage)price scenario.
Figure 7.23 Low case WACC (7%) LCOE/LPOE comparison
Figure 7.24 summarises the modelling outcomes under Central cost assumptions and a higherWACC of 13%. All technologies are not economically viable under any price scenario. The lowestcommercial gap is $94/MWh for the BWR under the Strong Climate Action (high-carbon, low-storage) scenario.
Figure 7.24 High case WACC (13%) LCOE/LPOE comparison
7.3.3.3 LCOE & COMMERCIAL SURPLUS/GAP ANALYSIS
The following tables demonstrate the sensitivity of LCOE and the commercial surplus/gapresulting from different scenarios of the capital and operating costs and WACC.

88
WSP | Parsons BrinckerhoffFebruary 2016
Project No 2265048A-STC-REP-004 Rev1Final ReportNuclear Fuel Cycle Royal Commission
Table 7.4 Cost sensitivity
Table 7.5 WACC sensitivity
Note: PWR, BWR, and PHWR are considered under the assumption of a Strong Climate Action(high-carbon, low-storage) scenario with introduction of nuclear power in the generation mix.SMRs are considered under the assumption of a Moderate Climate Action scenario.
Under the Low capital and operating cost assumptions and a WACC of 10%, only the PWR andBWR reactors are marginally viable under the Strong Climate Action (high-carbon, low-storage)electricity price scenario. The LPOE of these plants exceeds LCOE by up to $5/MWh.
Under the Central capital and operating cost assumptions and a WACC of 10%, all reactor typesexamined have a commercial gap between the LCOE and LPOE under all price scenarios. Thelowest commercial gap is $28/MWh for the BWR under the Strong Climate Action (high-carbon,low-storage) price scenario, while the small PHWR has the highest commercial gap of $95/MWhunder the Strong Climate Action (high-carbon, low-storage) price scenario.
Under the High capital and operating cost assumptions and a WACC of 10%, all of the reactortypes examined have even higher commercial gaps under any price scenario – from $65/MWh forthe BWR under the Strong Climate Action (high-carbon, low-storage) electricity price scenario to$187/MWh for the small SMR under the Moderate Climate Action price scenario.
Larger reactors, such as PWR and BWR tended to return a lower LCOE and lower commercialgap compared with other reactor types. This is largely a result of lower capital cost per MW ofgeneration capacity as compared with other reactor types.
The economic viability of nuclear power plants improves with lower WACC and furtherdeteriorates with higher WACC assumptions. Given high capital intensity of this generationtechnology, the cost of capital is a major driver of its economic viability.
Analysis of the economic viability measures for the scenarios under consideration suggests thatnuclear power plants in South Australia are not likely to be economically viable, unless:
à capital and operating costs of nuclear power plants are reduced to and below the lowest endof a plausible range considered in this study; and
à electricity prices increase dramatically as a result of Strong Climate Action, such as 100%reduction in emissions relative to 2000 levels by 2040 to 2050.
89
WSP | Parsons BrinckerhoffFebruary 2016
Project No 2265048A-STC-REP-004 Rev1Final ReportNuclear Fuel Cycle Royal Commission
7.4 CASH FLOW OUTPUTS FOR CGE ANALYSIS
NFCRC has engaged Ernst & Young (EY) to undertake computable general equilibrium (CGE)modelling of the economic data resulting from the studies undertaken by the several technicaladvisers to the Royal Commission. One of the outputs from the financial modelling of the powerplant options is a set of cash flow data that can be used for CGE modelling purposes.
7.4.1 CGE DATA REQUESTED
EY submitted an information request asking for annual cash flow data for to a wide range ofeconomic categories between FY13 and FY50 inclusive. These factors included:
à Exploration and mining support services
à Petroleum and coal products
à Basic chemicals
à Iron and steel
à Structural and metal products
à Metal containers and other sheet metal products
à Other fabricated metal products
à Motor vehicles and parts; other transport equipment
à Specialised and other machinery and equipment
à Other manufactured products
à Electricity
à Heavy and civil engineering construction
à Construction services
à Wholesale and retail trade
à Accommodation
à Food & beverage services
à Transport
à Finance
à Insurance
à Rental and hiring services
à Professional, scientific and technical services
à Other administration services
à Public services
à Other repairs and services
à Wages and salaries
à SA government taxes
à Commonwealth government taxes
The data was requested for both South Australian and other states content, in addition to asmaller set of categories for imported content.

90
WSP | Parsons BrinckerhoffFebruary 2016
Project No 2265048A-STC-REP-004 Rev1Final ReportNuclear Fuel Cycle Royal Commission
7.4.2 CGE DATA PROVIDED
A limitation of the financial model is that the cost and timing assumptions that drive the cash flowsin the model are aggregated into a limited number of types:
à pre-construction capex
à construction capex (including infrastructure)
à refurbishment capex
à total operating costs (including fuel)
à fuel costs
à decommissioning reserve
Moreover, all costs are consolidated into only nominal Australian dollars. WSP | ParsonsBrinckerhoff was unable to develop a methodology that would provide a reasonably assured levelof accuracy regarding the disaggregation and distribution of costs across the wide range of CGEcategories requested by EY. Instead, we proposed providing nominal cash flows categorised inline with the categories described by the University of Chicago study discussed in sections 6.2.5and 6.7.1 of the Detailed Estimate (The University of Chicago, 2004). These categories are asfollows:
à accommodation and services
à civil construction
à construction services
à finance
à insurance
à material supplies
à professional services
à reactor
à specialised equipment
à staff costs
à transport
à utility charges
à waste and decommissioning charges
We also disaggregated costs in these categories into nominal amounts attributed to SouthAustralia, other Australian states, and offshore content.
For the Detailed Estimate, the objective was to determine the relative proportions of onshore(AU$) and offshore (US$) costs to be used as cost assumptions for modelling purposes.However, the methodology was also designed to be able to extract categorised costs from thenominal cash flows produced by the model. The first step was to disaggregate each year’s cashflows into separate currency elements (albeit still expressed in AU$), including separatinginfrastructure costs from the overall construction capex. The second step was to apportion thecurrency elements across the proposed CGE categories and jurisdictions for each type of cashflow output: AU$ amounts to South Australia and other Australian states; and US$ amounts tooffshore categories. The final step was to aggregate the same category/jurisdiction amountsacross all cash flow types.
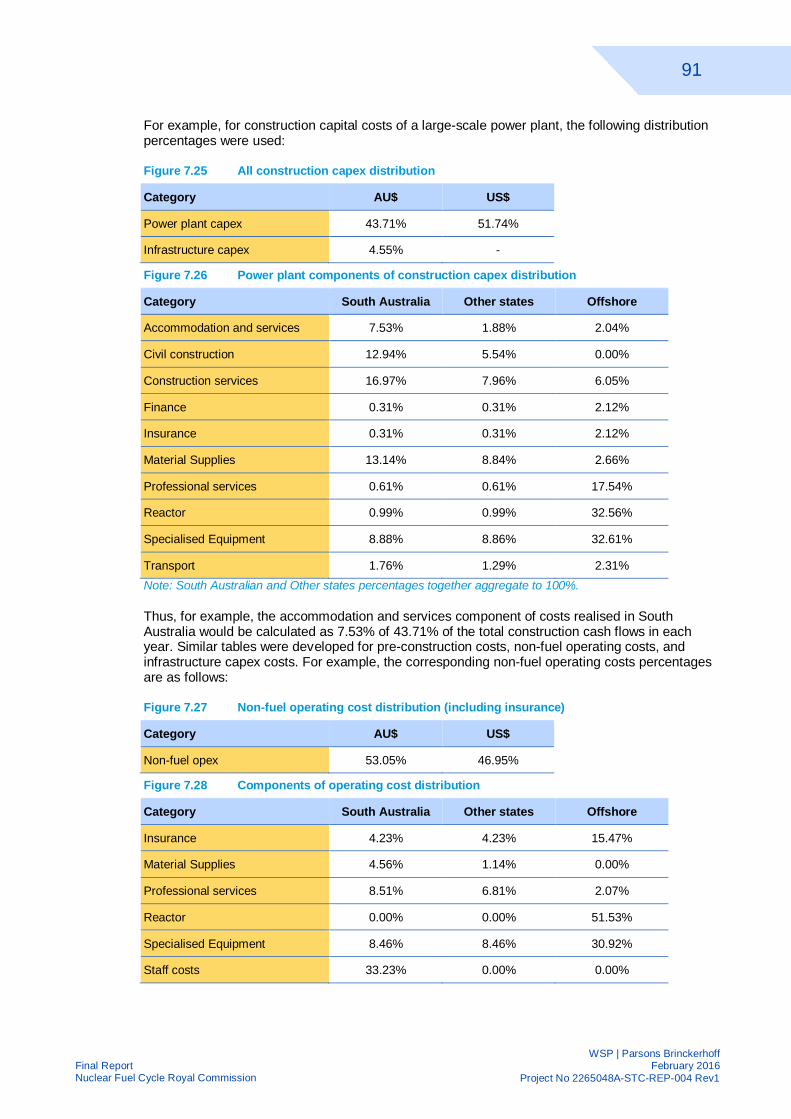
91
WSP | Parsons BrinckerhoffFebruary 2016
Project No 2265048A-STC-REP-004 Rev1Final ReportNuclear Fuel Cycle Royal Commission
For example, for construction capital costs of a large-scale power plant, the following distributionpercentages were used:
Figure 7.25 All construction capex distribution
Category AU$ US$
Power plant capex 43.71% 51.74%
Infrastructure capex 4.55% -
Figure 7.26 Power plant components of construction capex distribution
Category South Australia Other states Offshore
Accommodation and services 7.53% 1.88% 2.04%
Civil construction 12.94% 5.54% 0.00%
Construction services 16.97% 7.96% 6.05%
Finance 0.31% 0.31% 2.12%
Insurance 0.31% 0.31% 2.12%
Material Supplies 13.14% 8.84% 2.66%
Professional services 0.61% 0.61% 17.54%
Reactor 0.99% 0.99% 32.56%
Specialised Equipment 8.88% 8.86% 32.61%
Transport 1.76% 1.29% 2.31%Note: South Australian and Other states percentages together aggregate to 100%.
Thus, for example, the accommodation and services component of costs realised in SouthAustralia would be calculated as 7.53% of 43.71% of the total construction cash flows in eachyear. Similar tables were developed for pre-construction costs, non-fuel operating costs, andinfrastructure capex costs. For example, the corresponding non-fuel operating costs percentagesare as follows:
Figure 7.27 Non-fuel operating cost distribution (including insurance)
Category AU$ US$
Non-fuel opex 53.05% 46.95%
Figure 7.28 Components of operating cost distribution
Category South Australia Other states Offshore
Insurance 4.23% 4.23% 15.47%
Material Supplies 4.56% 1.14% 0.00%
Professional services 8.51% 6.81% 2.07%
Reactor 0.00% 0.00% 51.53%
Specialised Equipment 8.46% 8.46% 30.92%
Staff costs 33.23% 0.00% 0.00%

92
WSP | Parsons BrinckerhoffFebruary 2016
Project No 2265048A-STC-REP-004 Rev1Final ReportNuclear Fuel Cycle Royal Commission
Category South Australia Other states Offshore
Utility charges 17.47% 0.00% 0.00%
Waste and decom charges 2.90% 0.00% 0.00%Note: South Australian and Other states percentages together aggregate to 100%.
Having used the above distributions to determine the annual nominal cash flows for eacheconomic and jurisdictional category from each modelling output, the total annual cash flows foreach were aggregated to provide the CGE input table for EY. The annual cost of fuel wascalculated separately within the model, and was simply repeated in the CGE input table requiredby EY.
The above percentages were assumed to be reasonably representative of all large-scale powerplants being considered and were determined from data representative of the AP1000 PWR-based power plant. An alternative set of percentages were determined for the smaller SMR-basedpower plants, based on data representative of the NuScale reactor-based power plant.
The final cash flows amounts provided to EY are summarised in Appendix C.
7.5 CASE STUDY: DEVELOPMENT OF NUCLEAR POWER GENERATIONINDUSTRY IN UNITED ARAB EMIRATES
This section of our report contains a case study on the development of a nuclear powergeneration industry in the United Arab Emirates (UAE), a country with no prior involvement in thenuclear fuel cycle.
Globally, there are over 435 operational nuclear reactors located in 31 countries and generatingapproximately 11% of the world’s electricity consumption. Further there are over 60 reactorscurrently under construction in 15 countries. The USA, France, Japan and Russia have long beenthe leaders in nuclear energy generation. China is currently pursuing a significant nuclearprogram and is likely to operate the third highest number of reactors globally (after USA andFrance) with the completion of its current construction program of 22 reactors. The followingfigures outlines the current state of global nuclear power industry.
Table 7.6 Nuclear reactors under construction by country
COUNTRY OPERATIONALREACTORS
REACTORSUNDER
CONSTRUCTION
Argentina 3 1
Belarus - 2
Brazil 2 1
China 29 22
Finland 4 1
France 58 1
India 21 6
Japan 43 3

93
WSP | Parsons BrinckerhoffFebruary 2016
Project No 2265048A-STC-REP-004 Rev1Final ReportNuclear Fuel Cycle Royal Commission
COUNTRY OPERATIONALREACTORS
REACTORSUNDER
CONSTRUCTION
South Korea 24 4
Pakistan 3 2
Russia 34 9
Slovakia 4 2
Taiwan 6 2
UAE - 4
USA 99 5Source: (World Nuclear Association, 2015b)Figure 7.29 Nuclear reactors operational by country
Source: (European Nuclear Society, 2015)
In recent years there has been an increase in the number of nuclear reactors commencingconstruction as shown in the following graph, stalling briefly in 2011 following the FukushimaDaichi disaster, however continuing upward subsequently. It should be noted that the decline inconstruction after 2014 may be misleading as the chart includes “projected” start dates accordingto the International Atomic Energy Agency (IAEA) Power Reactor Information System database,but not all proposed reactors around the world have officially announced their construction startdates.
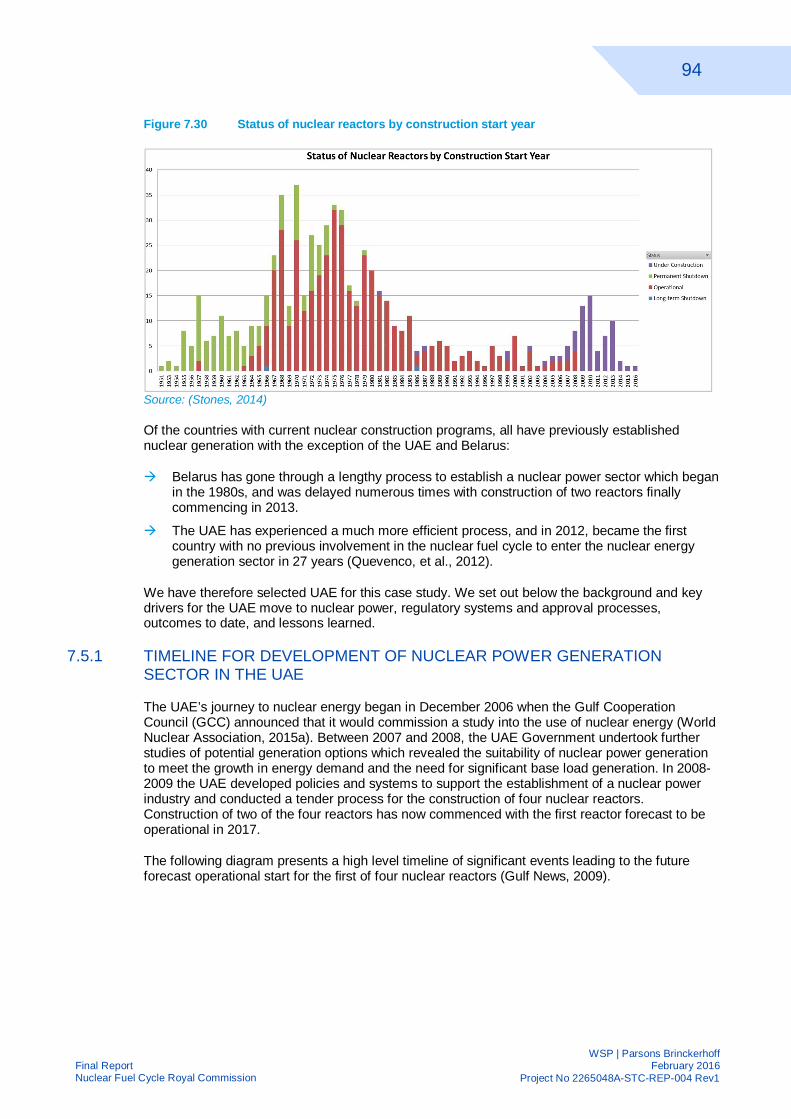
94
WSP | Parsons BrinckerhoffFebruary 2016
Project No 2265048A-STC-REP-004 Rev1Final ReportNuclear Fuel Cycle Royal Commission
Figure 7.30 Status of nuclear reactors by construction start year
Source: (Stones, 2014)
Of the countries with current nuclear construction programs, all have previously establishednuclear generation with the exception of the UAE and Belarus:
à Belarus has gone through a lengthy process to establish a nuclear power sector which beganin the 1980s, and was delayed numerous times with construction of two reactors finallycommencing in 2013.
à The UAE has experienced a much more efficient process, and in 2012, became the firstcountry with no previous involvement in the nuclear fuel cycle to enter the nuclear energygeneration sector in 27 years (Quevenco, et al., 2012).
We have therefore selected UAE for this case study. We set out below the background and keydrivers for the UAE move to nuclear power, regulatory systems and approval processes,outcomes to date, and lessons learned.
7.5.1 TIMELINE FOR DEVELOPMENT OF NUCLEAR POWER GENERATIONSECTOR IN THE UAE
The UAE’s journey to nuclear energy began in December 2006 when the Gulf CooperationCouncil (GCC) announced that it would commission a study into the use of nuclear energy (WorldNuclear Association, 2015a). Between 2007 and 2008, the UAE Government undertook furtherstudies of potential generation options which revealed the suitability of nuclear power generationto meet the growth in energy demand and the need for significant base load generation. In 2008-2009 the UAE developed policies and systems to support the establishment of a nuclear powerindustry and conducted a tender process for the construction of four nuclear reactors.Construction of two of the four reactors has now commenced with the first reactor forecast to beoperational in 2017.
The following diagram presents a high level timeline of significant events leading to the futureforecast operational start for the first of four nuclear reactors (Gulf News, 2009).

95
WSP | Parsons BrinckerhoffFebruary 2016
Project No 2265048A-STC-REP-004 Rev1Final ReportNuclear Fuel Cycle Royal Commission
Figure 7.31 UAE nuclear timeline
*FANR – Federal Authority for Nuclear Regulation / ENEC – Emirates Nuclear Energy Corporation
7.5.2 WHY DID THE UAE PURSUE NUCLEAR POWER?
The decision to pursue nuclear energy was based on an in-depth evaluation of the UAE’s futureenergy needs and review of a range alternatives to meet growing demand. The followingconditions contributed to the decision to pursue nuclear power:
SIGNIFICANTAND INCREASINGENERGYDEMAND
A Government study determined that the annual peak demand for electricity in the UAEis likely to rise from 12,000MW in 2006 to over 40,000MW by 2020, reflecting acumulative annual growth rate of about nine percent from 2007. The projected demandwas well beyond current generation capacity as shown by the following chart: (WorldNuclear Association, 2015a)
Source: (Permanent Mission of the United Arab Emirates to the IAEA, n.d.)
DESIRE FORREDUCEDCARBONFOOTPRINT
The UAE is one of the 10 highest carbon emitting countries on a per capita basis with98% of historical energy generation coming from oil and gas fired plants. In 2007, theGovernment launched an ambitious clean energy program whereby it sought toincrease the proportion of low-carbon generation to approximately 30% (Krane, 2014).

96
WSP | Parsons BrinckerhoffFebruary 2016
Project No 2265048A-STC-REP-004 Rev1Final ReportNuclear Fuel Cycle Royal Commission
PUBLICSUPPORT
Based on surveys conducted, a majority of the general public are in favour of adoptingnuclear power as a primary energy source. A poll conducted in 2012 found that 89% ofresidents feel that peaceful nuclear energy is important for the UAE with 55% viewingnuclear power as the main source of generation (World Nuclear Association, 2015a).
LACK OF VIABLEALTERNATIVES(EMBASSY OFTHE UNITEDARAB EMIRATES,2015)
The following alternative energy sources were considered and it was determined that:
Natural gas – insufficient capacity to meet future demand
Crude oil/diesel – logistically viable but costly and environmentally harmful
Coal – cheaper but environmentally unacceptable and higher supply security riskRenewables – Only able to supply 6-7% of electricity demand by 2020
COMMERCIALLYCOMPETITIVE
The UAE Foreign Minister publically stated at the International Conference on Accessto Civil Energy in 2010: “In evaluating different options to meet this demand, nuclearenergy emerged as a proven, environmentally promising and commercially competitiveoption which could make a significant contribution to the UAE's economy and futureenergy security”. Detailed cost analysis or comparisons were not made publicallyavailable.
FLOW ONBENEFITS
According to the Chief Executive Officer of the Emirates Nuclear Energy Corporation,“An important factor in the UAE’s decision to pursue a peaceful nuclear energy programwas the opportunity to develop a new industrial sector to support the nation’s economicgrowth and diversification strategy” (Emirates Nuclear Energy Corporation, 2015b).
As a result of these factors, the UAE Government opted to take the next steps in the pursuit ofnuclear power generation.
7.5.3 LEGISLATIVE AND REGULATORY FRAMEWORK
Following the initial study into potential options, the UAE Government published a comprehensivepolicy on nuclear energy in April 2008. This policy, which was developed in consultation with theInternational Atomic Energy Agency (IAEA) and the governments of major nuclear suppliernations, laid out a set of principles, commitments and strategies that guided the assessment andimplementation of a peaceful nuclear energy program within the UAE (al-Nahyan, et al., 2008).The policy made a number of commitments, which are enforced in a number of legislativemechanisms including the UAE Nuclear Law brought into effect in 2009. The policy states that theUAE:
à Will forgo domestic enrichment and reprocessing of nuclear fuel (the two parts of the nuclearfuel cycle that can most readily be used for non-peaceful purposes);
à Is committed to complete operational transparency;
à Is committed to pursuing the highest standards of non-proliferation;
à Is committed to the highest standards of safety and security;
à Will work directly with the IAEA and conform to its standards in evaluating and potentiallyestablishing a peaceful nuclear energy program;
à Hopes to develop any peaceful domestic nuclear power capability in partnership with thegovernments and firms of responsible nations, as well with the assistance of appropriateexpert organisations; and
à Will approach any peaceful domestic nuclear power program in a manner that best ensureslong-term sustainability.
The UAE set up the following key bodies to assist with the establishment and regulation of nuclearpower:

97
WSP | Parsons BrinckerhoffFebruary 2016
Project No 2265048A-STC-REP-004 Rev1Final ReportNuclear Fuel Cycle Royal Commission
Figure 7.32 UAE nuclear regulatory structure
The key roles of the specific agencies include:
à Nuclear Energy Program Implementing Organisation (NEPIO) – responsible for:
§ coordinated planning, including research and policy recommendation;
§ stakeholder management across government, atomic energy organisations, electricityproviders, national industries and general public;
§ oversight of the development of infrastructure to support the project including projectmanagement.
à Emirates Nuclear Energy Corporation (ENEC) – Government owned company, charged withdeveloping nuclear power plants within the UAE. ENEC has contracted with the primarycontractor for the construction of Abu Dhabi’s nuclear plants. ENEC was initially funded withUS$100 million to evaluate and implement nuclear power plants within the UAE.
à Federal Authority of Nuclear Regulation (FANR) – An independent federal agency chargedwith regulation and licensing of all nuclear energy activities in the UAE with public safety asits primary objective.
à International Advisory Board – This advisory body includes former heads of nationalregulatory bodies, nuclear industry leaders, and recognised academic authorities, reportsdirectly to the Ministry of Presidential Affairs and provides independent assessments of thestatus and performance of the various entities associated with the UAE civil nuclear program,as well as analysis of progress made in addressing any areas of potential concern.
7.5.4 COMPETITIVE PROCUREMENT
The UAE Government stated that the nuclear program would be based on the use of globalexpertise. A tender process for the construction of the first nuclear power plant was undertakenwith three parties proposing different technical solutions shortlisted in 2009:
à Total, Avera, Suez – European Pressurised Reactor (EPR)
à GE-Hitachi – Advanced Boiling Water Reactor (ABWR)
à Korean Consortium led by Korea Electric Power Co. (KEPCO) – Advanced PressurisedWater Reactor (APR-1400)

98
WSP | Parsons BrinckerhoffFebruary 2016
Project No 2265048A-STC-REP-004 Rev1Final ReportNuclear Fuel Cycle Royal Commission
The tender evaluation process took approximately one year with a team of 75 experts involved(Emirates Nuclear Energy Corporation, 2015a).
KEPCO was subsequently selected as the preferred bidder for the construction of four reactors atBarakah, 295 km west of Abu Dhabi. KEPCO has claimed that the reason for their selection wastheir “demonstrable highest capacity factor, lowest construction cost and shortest constructiontime among the bidders” (World Nuclear Association, 2015a). It is intended that the plant will beoperated by a new entity to be set up in 2017 with 82% ENEC equity and 18% KEPCO equityinterest (World Nuclear Association, 2015a).
The nuclear power generation plant at Barakah will consist of four APR-1400 reactors withgeneration capacity of 1,400 MW each. The APR-1400 is an Advanced Pressurised WaterReactor designed by KEPCO. It is an upgraded version of OPR1000, the Optimum PowerReactor with 1,000 MW capacity, the first standard pressurised water reactor (PWR) plant inKorea. The APR-1400 design was developed by the Korean nuclear industry under the leadershipof KEPCO over a period of 10 years and licensed by the Korean nuclear safety regulator. FourAPR-1400 units are now under construction in South Korea, with the first of these scheduled to beoperational in April 2016. These units will serve as the “reference plants” for the UAE afterappropriate adaptations have been made to suit the UAE’s climate conditions and specific FANRrequirements.
The APR-1400 includes advanced safety features such as direct vessel injection from the safetyinjection system, passive flow regulation device in the safety injection tank, in-containmentrefuelling water supply system, and systems for severe accident mitigation and management(power-technology.com, 2015).
7.5.5 DEVELOPMENT APPROVAL PROCESS
FANR was responsible for the site selection and assessment of construction and operationapplications. FANR considered 10 possible locations for the reactors with Barakah the locationultimately selected. FANR considered the construction application for the reactors in four stages:
1. ENEC submitted the Site Preparation License and Limited Construction License for the fourunits at Barakah. The Site Preparation License allows ENEC to start the installation of siteinfrastructure. It also allows construction to begin on areas of the facility that are not part ofthe nuclear power plants, such as roads, telecommunications networks and siteadministration buildings. The Limited Construction License authorises the manufacture andassembly of components, including reactor pressure vessels, steam generators and coolantpumps important to safety.
2. The Construction License application for units 1 and 2 was submitted in December 2010 andwas approved by FANR in July 2012.
3. ENEC submitted the Construction License application for units 3 and 4 to FANR in February2013 with subsequent approval in in September 2014.
4. The Operating License application for the first two units was filed with FANR in March 2015.
The 15,000-page Operating License application was the culmination of five years’ work by teamsfrom ENEC and reactor builder KEPCO, with further input from international experts. Thesubmission included a final safety analysis report, an independent safety verification and designreview, details of the organisation's physical protection plan, facility safeguards plan, operationalquality assurance manual and emergency plan, as well as a probabilistic risk assessmentsummary report and a severe accident analysis report (World Nuclear News, 2015a).

99
WSP | Parsons BrinckerhoffFebruary 2016
Project No 2265048A-STC-REP-004 Rev1Final ReportNuclear Fuel Cycle Royal Commission
7.5.6 PROJECT FINANCING
The UAE has adopted a similar project financing and operating structure to that which has beenused successfully in the oil production and electricity generation sectors. This involves closecooperation with project partners and offering joint-venture arrangements for the operation ofnuclear power plants (International Business Publications, Inc., 2015).
The total cost of constructing the four new nuclear reactors including finance is expected to beUS$32 billion, which equates to US$5.7million per MW of installed capacity. Of that,US$20.4 billion relates to the KEPCO construction contract. While exact details of the projectfinancing are unknown, business news reports have claimed that the following capital structurewas established: (Daya & Bianchi, 2011)
à US$10 billion equity contribution from the UAE Government (82% equity share) andKEPCO/JV partners (18% equity)
à US$10 billion debt from the Export Import Bank of Korea (KEXIM)
à US$6 billion in debt funding from the Government of Abu Dhabi
à US$2 billion in debt from the Export Import Bank of the US (US EXIM)
à US$2 billion in debt from five separate commercial banks
It is understood that electricity pricing arrangements are yet to be finalised, but financing is basedon the UAE Government guarantees provided to investors and financiers.
7.5.7 PROJECT COST AND TIME VARIANCES
The high level construction timeline is shown in Figure 7.33.
Figure 7.33 Barakah Nuclear Power Plant construction timeline
To date, the program has claimed that it has hit all milestones, although as the project is ongoing,the final results, cost and time variances are unknown (McAuley, 2015 ). The final stage ofconstruction for each reactor represents the most significant technical challenge, in particular as itprogresses through systems integration. As none of the reactors have yet progressed through thisstage, there remains a risk to the schedule.
Currently, the most significant risk to the project schedule relates to challenges KEPCO haveexperienced at its prototype APR-1400 reactor under construction at Shin Kori, 450 kilometressouth-east of Seoul. Barakah is reliant on Shin Kori reactors for its operating procedures template,a crucial connection that is reflected in the fact that KEPCO faces financial penalties under itsBarakah contract if it misses milestones on the South Korean APR-1400 construction program.
100
WSP | Parsons BrinckerhoffFebruary 2016
Project No 2265048A-STC-REP-004 Rev1Final ReportNuclear Fuel Cycle Royal Commission
7.5.8 LESSONS LEARNED
There are a number of key lessons from the UAE experience in developing a nuclear powersector which have been summarised below:
1. Strong business case – The year-on-year energy demand growth and looming energysupply gap was the primary factor behind the decision to pursue nuclear power for itssignificant base load generation capability. This was further supported by the need toimprove long-term supply security and reduce the UAE’s high carbon footprint. The UAE hasconsidered alternative options and has selected nuclear power as the most viable source ofbase load electricity supply.
2. Significant government support required – The UAE Government has funded initialproject development activities and contributed a large proportion of the required equityfunding. The UAE Government has guaranteed the debt package and has also effectivelyaccepted 100% of electricity revenue risk.
3. Strong transparent governance working in partnership with the IAEA – The UAEGovernment has adopted the IAEA safety standards, and has made safety and security itshighest priority throughout the development and planning phase which has played a strongpart in securing international and public support.
4. There are significant flow on benefits to local industry – More than 1,100 UAEcompanies are now contributing to the construction of the country’s first nuclear energyplants with contracts totalling more than US$2.5 billion.

101
WSP | Parsons BrinckerhoffFebruary 2016
Project No 2265048A-STC-REP-004 Rev1Final ReportNuclear Fuel Cycle Royal Commission
8 REFERENCESACIL Tasman, 2009. Fuel resource, new entry and generation costs in the NEM, s.l.: AustralianEnergy Market Operator.
al-Nahyan, A. b. Z., Araj, K. J., Fahmy, N. & Chongkum, S., 2008. Why Go Nuclear?. Bulletin ofthe Atomic Scientists, 64(4), pp. 14-19.
Australian Energy Market Commission, 2015. Schedule of reliability settings. [Online]Available at: http://www.aemc.gov.au/Australias-Energy-Market/Market-Legislation/Electricity-Guidelines-and-Standards/Schedule-of-Reliability-Settings-(MPC-and-CPT-(3)/Schedule-of-reliability-settings-Calculation-2015.aspx[Accessed 11 December 2015].
Australian Energy Market Operator, 2015a. Detailed Summary of 2015 Electricity Forecasts -2015 National Electricity Forecasting Report, s.l.: Australian Energy Market Operator.
Australian Energy Market Operator, 2015b. Electricity Statement of Opportunities, s.l.: AustralianEnergy Market Operator.
Bird, D. K. et al., 2014. Nuclear power in Australia: A comparative analysis of public opinionregarding climate change and the Fukushima disaster. Energy Policy, Volume 65, pp. 644-653.
BIS Shrapnel, 2015. Long Term Forecasts 2015-2030, Sydney, Australia: BIS Shrapnel.
Bureau of Resources and Energy Economics, 2012. Australian Energy Technology Assessment,Canberra: Commonwealth of Australia.
Business Wire, 2010. Fitch Rates MEAG Power (GA) Plant Vogtle Project M & J Bonds 'A+' andProject P Bonds 'A-'. [Online]Available at: http://www.businesswire.com/news/home/20100217006021/en/Fitch-Rates-MEAG-Power-GA-Plant-Vogtle[Accessed 11 December 2015].
Daya, A. & Bianchi, S., 2011. U.A.E.’s Nuclear Power Program Said to Cost $30 Billion.Bloomberg Businessweek.. [Online]Available at: http://www.bloomberg.com/news/articles/2011-11-24/u-a-e-s-plan-to-develop-nuclear-power-facilities-said-to-cost-30-billion[Accessed 11 December 2015].
Department of Energy & Climate Change, 2014. State aid approval for Hinkley Point C nuclearpower plant. [Online]Available at: https://www.gov.uk/government/news/state-aid-approval-for-hinkley-point-c-nuclear-power-plant[Accessed 11 December 2015].
Department of the Premier and Cabinet, South Australia, 2013. Better Together: Principles ofEngagement, Adelaide: Government of South Australia.
DOE, 2004. NP2010 Construction Schedule Evaluation, Washington, DC: Department of Energy.
Durham Workforce Authority, 2013. Nuclear Sector 2013 Community Report, Oshawa, ON:Durham Workforce Authority.
ElectraNet, 2015. SA-Vic (Heywood) Interconnector Upgrade. [Online]Available at: http://www.electranet.com.au/network/current-and-planned-projects/south-east/sa-vic-interconnection-upgrade/[Accessed 11 December 2015].
Electric Utility Cost Group, 2015. Electric Utility Cost Group. [Online]Available at: https://www.eucg.org/[Accessed 11 December 2015].

102
WSP | Parsons BrinckerhoffFebruary 2016
Project No 2265048A-STC-REP-004 Rev1Final ReportNuclear Fuel Cycle Royal Commission
Embassy of the United Arab Emirates, 2015. Peaceful Nuclear Energy. [Online]Available at: http://www.uae-embassy.org/about-uae/energy/peaceful-nuclear-energy[Accessed 11 December 2015].
Emirates Nuclear Energy Corporation, 2015a. Prime Contractor. [Online]Available at: http://www.enec.gov.ae/our-nuclear-energy-program/prime-contractor/[Accessed 11 December 2015].
Emirates Nuclear Energy Corporation, 2015b. US$ 2.5 Billion In Contracts Awarded To LocalCompanies Participating In UAE Nuclear Energy Program. [Online]Available at: http://www.enec.gov.ae/news/content/us-2.5-billion-in-contracts-awarded-to-local-companies-participating-in-uae[Accessed 11 December 2015].
Energy Supply Association of Australia, 2015. Electricity Gas Australia 2015, s.l.: Energy SupplyAssociation of Australia.
ENTSOE Regional Group North Sea, 2011. Offshore Transmisison Technology, Brussels,Belgium: ENTSOE.
European Nuclear Society, 2015. Nuclear power plants, world-wide. [Online]Available at: https://www.euronuclear.org/info/encyclopedia/n/nuclear-power-plant-world-wide.htm[Accessed 11 December 2015].
Georgia Power Company, 2015. Thirteenth Semi-annual Vogtle Construction Monitoring Report,s.l.: Georgia Power Company.
Gulf News, 2009. Timeline: UAE nuclear development. [Online]Available at: http://gulfnews.com/news/uae/general/timeline-uae-nuclear-development-1.558796[Accessed 11 December 2015].
Harmsen, N., 2015. Alinta's Leigh Creek coal mine to close next month, Port Augusta powerstation next March. [Online]Available at: http://www.abc.net.au/news/2015-10-07/alinta-leigh-creek-coal-mine-to-close-next-month/6833402[Accessed 11 December 2015].
Harris, G., Heptonstall, P., Gross, R. & Handley, D., 2012. Cost estimates for nuclear power in theUK, London, UK: Imperial College Centre for Energy Policy and Technology.
Hayward, J. & Graham, P., 2012. AEMO 100% renewable energy study: Projection ofelectricity generation tech nology capital costs for Scenario 1, Newcastle, Australia: CSIRO.
Hylko, J., 2013. V.C. Summer Nuclear Station Construction Update. [Online]Available at: http://www.powermag.com/v-c-summer-nuclear-station-construction-update/[Accessed 11 December 2015].
IAP2 International Federation, 2014. IAP2's Public Participation Spectrum. [Online]Available at: https://www.iap2.org.au/documents/item/84[Accessed 8 December 2015].
International Atomic Energy Agency, 2003. Manual for Reactor Produced Radioisotopes. Vienna:International Atomic Energy Agency.
International Atomic Energy Agency, 2012. Neutron Transmutation Doping of Silicon at ResearchReactors. Vienna: International Atomic Energy Agency.
International Business Publications, Inc., 2015. United Arab Emirates Energy Policy, Laws andRegulations Handbook - Strategic Information and Basic Laws. 2015 ed. Washington:International Business Publications, Inc..
Krane, J., 2014. An Expensive Diversion: Abu Dhabi's Renewale Energy Investments Amid aContext of Challenging Demand, Houston: JAMES A. BAKER III INSTITUTE FOR PUBLICPOLICY.

103
WSP | Parsons BrinckerhoffFebruary 2016
Project No 2265048A-STC-REP-004 Rev1Final ReportNuclear Fuel Cycle Royal Commission
McAuley, A., 2015 . UAE nuclear project enters critical phase. The National, 7 July.
Mirshak, M., 2014. Plant Vogtle reaches largest workforce since 1980s construction. [Online]Available at: http://chronicle.augusta.com/latest-news/2014-09-07/plant-vogtle-reaches-largest-workforce-1980s-construction[Accessed 11 December 2015].
Moore, J., 2013. NPP Construction Activities March 2013, Vienna, Austria: International AtomicEnergy Agency.
Naterer, G. F., Fowler, M., Cotton, J. & Gabriel, K., 2008. Synergistic roles of off-peak electrolysisand thermochemical production of hydrogen from nuclear energy in Canada. International Journalof Hydrogen Energy, 33(23), pp. 6849-6857.
National Nuclear Laboratory, et al., 2014. Small Modular Reactors (SMR) Feasibility Study, s.l.:National Nuclear Laboratory.
NuScale Power, 2014. Presentation to Washington State Joint Select Task Force on NuclearEnergy. [Online]Available at:http://leg.wa.gov/JointCommittees/NEJSTF/Documents/14%2011%2007/NuScale.pdf[Accessed 11 December 2015].
Peltier, R., 2010. Benchmarking Nuclear Plant Staffing. [Online]Available at: http://www.powermag.com/benchmarking-nuclear-plant-staffing/[Accessed 11 December 2015].
Permanent Mission of the United Arab Emirates to the IAEA, n.d. Peaceful Nuclear Energy.[Online]Available at: http://www.uae-mission.ae/mission/iaea/Content/1159[Accessed 11 December 2015].
Pickard, J., 2015. French reactor problems cast doubt on UK nuclear power plant. FinancialTimes, 14 June.
power-technology.com, 2015. Barakah Nuclear Power Plant, Abu Dhabi, United Arab Emirates.[Online]Available at: http://www.power-technology.com/projects/barakah-nuclear-power-plant-abu-dhabi/[Accessed 11 December 2015].
Quevenco, R., Starz, A. & Dyck, E., 2012. UAE First "Newcomer" in 27 Years to Start NuclearPower Plant Construction. [Online]Available at: https://www.iaea.org/newscenter/news/uae-first-newcomer-27-years-start-nuclear-power-plant-construction[Accessed 11 December 2015].
South Carolina Electric & Gas Company, 2015. Quarterly Report to the South Carolina Office ofRegulatory Staff Quarter Ending June 30, 2015, s.l.: South Carolina Electric & Gas Company.
Starick, P., 2014. Pelican Point Power Station will cut more than half its generation capacity earlynext year, threatening jobs. [Online]Available at: http://www.adelaidenow.com.au/news/south-australia/pelican-point-power-station-will-cut-more-than-half-its-generation-capacity-early-next-year-threatening-jobs/news-story/dec703384bd7448e1facc1c0d79b2047?sv=70934cf893f90dc7e634897b66988932[Accessed 11 December 2015].
Stones, C., 2014. A Closer Look at the Global Nuclear Industry. [Online]Available at: https://sites.utexas.edu/mecc/2014/05/07/a-closer-look-at-the-global-nuclear-industry/[Accessed 11 December 2015].
The University of Chicago, 2004. The Economic Future of Nuclear Power, Chicago: TheUniversity of Chicago.

104
WSP | Parsons BrinckerhoffFebruary 2016
Project No 2265048A-STC-REP-004 Rev1Final ReportNuclear Fuel Cycle Royal Commission
US Department of Energy, 2015. Energy Department Issues Remaining $1.8 Billion in LoanGuarantees for Vogtle Advanced Nuclear Energy Project. [Online]Available at: http://www.energy.gov/articles/energy-department-issues-remaining-18-billion-loan-guarantees-vogtle-advanced-nuclear[Accessed 11 December 2015].
Vorrath, S., 2014. AGL to shutter 480MW of South Australian gas power plant. [Online]Available at: http://reneweconomy.com.au/2014/agl-to-shutter-480mw-of-south-australia-gas-power-plant-43960[Accessed 11 December 2015].
World Nuclear Association, 2015a. Nuclear Power in the United Arab Emirates. [Online]Available at: http://www.world-nuclear.org/info/Country-Profiles/Countries-T-Z/United-Arab-Emirates/[Accessed 11 December 2015].
World Nuclear Association, 2015b. World Nuclear Power Reactors & Uranium Requirements.[Online]Available at: http://www.world-nuclear.org/info/Facts-and-Figures/World-Nuclear-Power-Reactors-and-Uranium-Requirements/[Accessed 20 November 2015].
World Nuclear News, 2008. Staffing levels steady at US plants. [Online]Available at: http://www.world-nuclear-news.org/NP-Staffing_levels_steady_at_US_plants-1411088.html[Accessed 11 December 2015].
World Nuclear News, 2015a. UAE applies for first nuclear operating licence. [Online]Available at: http://www.world-nuclear-news.org/NN-UAE-applies-for-first-nuclear-operating-licence-2703157.html[Accessed 11 December 2015].
World Nuclear News, 2015b. UAE's fourth power reactor under construction. [Online]Available at: http://www.world-nuclear-news.org/NN-UAEs-fourth-power-reactor-under-construction-0209155.html[Accessed 11 December 2015].

Appendix ATECHNOLOGY-BASED MODELLING ASSUMPTIONS

WSP | Parsons BrinckerhoffFebruary 2016
Project No 2265048A-STC-REP-004 Rev1Final ReportNuclear Fuel Cycle Royal Commission
: PWR – AP1000

Type Unit PWR PWR PWRDesign AP1000 AP1000 AP1000Scenario Low Central HighRegional Market Interconnection: SA SA SAFuel:Fuel price USD/MWh of net
output6.1 7.6 9.1
Timing:Total Pre-Construction Period (including pre-licensing /approvals,licensing & public enquiry)
Years 5 5 7
Construction Period Years 4 5 7Refit interval Years Not applicable Not applicable Not applicablePlant Operating Period Years 60 60 60Spent Fuel Cool Down Period Years 60 60 60Decommissioning Period Years 5 7 10Technical:Net Generation Capacity per Reactor MW 1125 1125 1125Plant Configuration (number of reactors) # 1 1 1Net Generation Capacity MW 1125 1125 1125In Station Usage MW 0 0 0Efficiency profile Flat (no degradation)Flat (no degradation)Flat (no degradation)Availability profile See drop down See drop down See drop downYear 1 98.00% 97.00% 96.00%Year 2 92.63% 89.03% 85.48%Year 3 92.63% 89.03% 85.48%Year 4 98.00% 97.00% 96.00%Year 5 92.63% 89.03% 85.48%Year 6 92.63% 89.03% 85.48%Year 7 98.00% 97.00% 96.00%Year 8 92.63% 89.03% 85.48%Year 9 92.63% 89.03% 85.48%Year 10 98.00% 97.00% 96.00%Year 11 92.63% 89.03% 85.48%Year 12 92.63% 89.03% 85.48%Year 13 98.00% 97.00% 96.00%Year 14 92.63% 89.03% 85.48%Year 15 92.63% 89.03% 85.48%Year 16 98.00% 97.00% 96.00%Year 17 92.63% 89.03% 85.48%Year 18 92.63% 89.03% 85.48%Year 19 98.00% 97.00% 96.00%Year 20 92.63% 89.03% 85.48%Year 21 92.63% 89.03% 85.48%Year 22 98.00% 97.00% 96.00%Year 23 92.63% 89.03% 85.48%Year 24 92.63% 89.03% 85.48%Year 25 98.00% 97.00% 96.00%Year 26 92.63% 89.03% 85.48%Year 27 92.63% 89.03% 85.48%Year 28 98.00% 97.00% 96.00%Year 29 92.63% 89.03% 85.48%Year 30 92.63% 89.03% 85.48%Year 31 98.00% 97.00% 96.00%Year 32 92.63% 89.03% 85.48%Year 33 92.63% 89.03% 85.48%Year 34 98.00% 97.00% 96.00%Year 35 92.63% 89.03% 85.48%Year 36 92.63% 89.03% 85.48%Year 37 98.00% 97.00% 96.00%Year 38 92.63% 89.03% 85.48%Year 39 92.63% 89.03% 85.48%Year 40 98.00% 97.00% 96.00%Year 41 92.63% 89.03% 85.48%Year 42 92.63% 89.03% 85.48%Year 43 98.00% 97.00% 96.00%Year 44 92.63% 89.03% 85.48%Year 45 92.63% 89.03% 85.48%Year 46 98.00% 97.00% 96.00%Year 47 92.63% 89.03% 85.48%Year 48 92.63% 89.03% 85.48%Year 49 98.00% 97.00% 96.00%Year 50 92.63% 89.03% 85.48%Year 51 92.63% 89.03% 85.48%Year 52 98.00% 97.00% 96.00%Year 53 92.63% 89.03% 85.48%Year 54 92.63% 89.03% 85.48%Year 55 98.00% 97.00% 96.00%Year 56 92.63% 89.03% 85.48%Year 57 92.63% 89.03% 85.48%Year 58 98.00% 97.00% 96.00%Year 59 92.63% 89.03% 85.48%Year 60 92.63% 89.03% 85.48%Refuelling cycle 20 days every
18 months30 days every
18 months40 days every
18 months

Type Unit PWR PWR PWRDesign AP1000 AP1000 AP1000Scenario Low Central HighPre-Construction costs:Project Development (locally incurred costs) AUDm 154 308 616Project Development (overseas incurred costs) USDm 31 63 126Regulatory + licensing + public enquiry AUDm 39 65 97o Annual phasing profile (Pre-Construction period) See drop down See drop down See drop downYear 1 5% 5% 5%Year 2 10% 10% 10%Year 3 15% 15% 15%Year 4 30% 30% 15%Year 5 40% 40% 15%Year 6 0% 0% 20%Year 7 0% 0% 20%Construction costsNuclear power plant:Capital costs (ex interest) overseas incurred USD per kW net 2870 3090 3410Capital costs (ex interest) locally incurred AUD per kW net 3150 3390 3750o Annual phasing profile (Construction period) See drop down See drop down See drop downYear 1 17% 17% 15%Year 2 22% 16% 3%Year 3 38% 33% 11%Year 4 23% 27% 19%Year 5 7% 22%Year 6 18%Year 7 12%Year 8Mid-life refurbishmentRefit Cost USDm N/A N/A N/AIn year N/A N/A N/ARefurbishment period Years 0 0 0Year 30 0% 0% 0%Year 31 0% 0% 0%Infrastructure costs- Base Case infrastructure cost (greenfield) AUDmRoads infrastructure (greenfield) AUDm 34.1 42.6 63.5Rail/port infrastructure (greenfield) AUDm 90 100 130Cooling water AUDm 0 0 0Raw water supply pipeline - 0km AUDm 0 0 0Local network connection infrastructure AUDm 10 10 10HVAC transmission - T line upgrade/ replacement 50km AUDm 90 100 120HVAC transmission - substation addition/ upgrade AUDm 220 244 330HVDC 1600MW - LCC converter stations and AC substations AUDm 0 0 0HVDC 1600MW - Heywood Victoria 800km HVDC transmission line toVictoria 500kV system
AUDm 0 0 0
BASE AUDm 444.1 496.6 653.5Marginal Loss Factor:Base MLF 0.99 0.98 0.96Operational costs:O&M fixed (overseas incurred costs) USD per MW per
annum44,800 56,000 67,200
O&M fixed (locally incurred costs) AUD per MW perannum
76,800 96,100 115,300
Insurance (overseas incurred costs) USD per MW perannum
15,900 17,100 18,900
Spent fuel disposal funding USD per MWh 2.50 3.75 5.00Plant Decommissioning Cost (overseas incurred) USDm 400 500 600Plant Decommissioning Cost (locally incurred) AUDm 0 0 0System spinning reserve costs AUDm per annum 5.250 7.875 10.500
Transmission connection & use of system - fixed charge AUDm per annum 4.20 4.70 5.60

WSP | Parsons BrinckerhoffFebruary 2016
Project No 2265048A-STC-REP-004 Rev1Final ReportNuclear Fuel Cycle Royal Commission
: BWR - ESBWR

Type UnitDesignScenarioRegional Market Interconnection:Fuel:Fuel price USD/MWh of net
outputTiming:Total Pre-Construction Period (including pre-licensing /approvals,licensing & public enquiry)
Years
Construction Period YearsRefit interval YearsPlant Operating Period YearsSpent Fuel Cool Down Period YearsDecommissioning Period YearsTechnical:Net Generation Capacity per Reactor MWPlant Configuration (number of reactors) #Net Generation Capacity MWIn Station Usage MWEfficiency profile Flat (no degradation)Availability profileYear 1Year 2Year 3Year 4Year 5Year 6Year 7Year 8Year 9Year 10Year 11Year 12Year 13Year 14Year 15Year 16Year 17Year 18Year 19Year 20Year 21Year 22Year 23Year 24Year 25Year 26Year 27Year 28Year 29Year 30Year 31Year 32Year 33Year 34Year 35Year 36Year 37Year 38Year 39Year 40Year 41Year 42Year 43Year 44Year 45Year 46Year 47Year 48Year 49Year 50Year 51Year 52Year 53Year 54Year 55Year 56Year 57Year 58Year 59Year 60Refuelling cycle
BWR BWR BWRESBWR ESBWR ESBWR
Low Central HighSA SA SA
6.1 7.6 9.1
5 5 7
4 5 7Not applicable Not applicable Not applicable
60 60 6060 60 605 7 10
1575 1575 15751 1 1
1575 1575 15750 0 0
Flat (no degradation)Flat (no degradation)Flat (no degradation)See drop down See drop down See drop down
98.00% 97.00% 96.00%92.63% 89.03% 85.48%92.63% 89.03% 85.48%98.00% 97.00% 96.00%92.63% 89.03% 85.48%92.63% 89.03% 85.48%98.00% 97.00% 96.00%92.63% 89.03% 85.48%92.63% 89.03% 85.48%98.00% 97.00% 96.00%92.63% 89.03% 85.48%92.63% 89.03% 85.48%98.00% 97.00% 96.00%92.63% 89.03% 85.48%92.63% 89.03% 85.48%98.00% 97.00% 96.00%92.63% 89.03% 85.48%92.63% 89.03% 85.48%98.00% 97.00% 96.00%92.63% 89.03% 85.48%92.63% 89.03% 85.48%98.00% 97.00% 96.00%92.63% 89.03% 85.48%92.63% 89.03% 85.48%98.00% 97.00% 96.00%92.63% 89.03% 85.48%92.63% 89.03% 85.48%98.00% 97.00% 96.00%92.63% 89.03% 85.48%92.63% 89.03% 85.48%98.00% 97.00% 96.00%92.63% 89.03% 85.48%92.63% 89.03% 85.48%98.00% 97.00% 96.00%92.63% 89.03% 85.48%92.63% 89.03% 85.48%98.00% 97.00% 96.00%92.63% 89.03% 85.48%92.63% 89.03% 85.48%98.00% 97.00% 96.00%92.63% 89.03% 85.48%92.63% 89.03% 85.48%98.00% 97.00% 96.00%92.63% 89.03% 85.48%92.63% 89.03% 85.48%98.00% 97.00% 96.00%92.63% 89.03% 85.48%92.63% 89.03% 85.48%98.00% 97.00% 96.00%92.63% 89.03% 85.48%92.63% 89.03% 85.48%98.00% 97.00% 96.00%92.63% 89.03% 85.48%92.63% 89.03% 85.48%98.00% 97.00% 96.00%92.63% 89.03% 85.48%92.63% 89.03% 85.48%98.00% 97.00% 96.00%92.63% 89.03% 85.48%92.63% 89.03% 85.48%
20 days every18 months
30 days every18 months
40 days every18 months

Type UnitDesignScenarioPre-Construction costs:Project Development (locally incurred costs) AUDmProject Development (overseas incurred costs) USDmRegulatory + licensing + public enquiry AUDmo Annual phasing profile (Pre-Construction period)Year 1Year 2Year 3Year 4Year 5Year 6Year 7Construction costsNuclear power plant:Capital costs (ex interest) overseas incurred USD per kW netCapital costs (ex interest) locally incurred AUD per kW neto Annual phasing profile (Construction period)Year 1Year 2Year 3Year 4Year 5Year 6Year 7Year 8Mid-life refurbishmentRefit Cost USDmIn yearRefurbishment period YearsYear 30Year 31Infrastructure costs- Base Case infrastructure cost (greenfield) AUDmRoads infrastructure (greenfield) AUDmRail/port infrastructure (greenfield) AUDmCooling water AUDmRaw water supply pipeline - 0km AUDmLocal network connection infrastructure AUDmHVAC transmission - T line upgrade/ replacement 50km AUDmHVAC transmission - substation addition/ upgrade AUDmHVDC 1600MW - LCC converter stations and AC substations AUDmHVDC 1600MW - Heywood Victoria 800km HVDC transmission line toVictoria 500kV system
AUDm
BASE AUDmMarginal Loss Factor:Base MLFOperational costs:O&M fixed (overseas incurred costs) USD per MW per
annumO&M fixed (locally incurred costs) AUD per MW per
annumInsurance (overseas incurred costs) USD per MW per
annumSpent fuel disposal funding USD per MWhPlant Decommissioning Cost (overseas incurred) USDmPlant Decommissioning Cost (locally incurred) AUDmSystem spinning reserve costs AUDm per annum
Transmission connection & use of system - fixed charge AUDm per annum
BWR BWR BWRESBWR ESBWR ESBWR
Low Central High
154 308 61631 63 12639 65 97
See drop down See drop down See drop down5% 5% 5%10% 10% 10%15% 15% 15%30% 30% 15%40% 40% 15%0% 0% 20%0% 0% 20%
2870 3090 34103150 3390 3750
See drop down See drop down See drop down17% 17% 15%22% 16% 3%38% 33% 11%23% 27% 19%
7% 22%18%12%
N/A N/A N/AN/A N/A N/A
0 0 00% 0% 0%0% 0% 0%
34.1 42.6 63.590 100 1300 0 00 0 0
10 10 1090 100 120220 244 3300 0 00 0 0
444.1 496.6 653.5
0.99 0.98 0.96
44,800 56,000 67,200
76,800 96,100 115,300
15,900 17,100 18,900
2.50 3.75 5.00460 575 6900 0 0
9.750 14.625 19.500
5.50 6.10 7.30

WSP | Parsons BrinckerhoffFebruary 2016
Project No 2265048A-STC-REP-004 Rev1Final ReportNuclear Fuel Cycle Royal Commission
: LARGE PHWR – ACR1000

Type UnitDesignScenarioRegional Market Interconnection:Fuel:Fuel price USD/MWh of net
outputTiming:Total Pre-Construction Period (including pre-licensing /approvals,licensing & public enquiry)
Years
Construction Period YearsRefit interval YearsPlant Operating Period YearsSpent Fuel Cool Down Period YearsDecommissioning Period YearsTechnical:Net Generation Capacity per Reactor MWPlant Configuration (number of reactors) #Net Generation Capacity MWIn Station Usage MWEfficiency profile Flat (no degradation)Availability profileYear 1Year 2Year 3Year 4Year 5Year 6Year 7Year 8Year 9Year 10Year 11Year 12Year 13Year 14Year 15Year 16Year 17Year 18Year 19Year 20Year 21Year 22Year 23Year 24Year 25Year 26Year 27Year 28Year 29Year 30Year 31Year 32Year 33Year 34Year 35Year 36Year 37Year 38Year 39Year 40Year 41Year 42Year 43Year 44Year 45Year 46Year 47Year 48Year 49Year 50Year 51Year 52Year 53Year 54Year 55Year 56Year 57Year 58Year 59Year 60Refuelling cycle
PHWR (Large) PHWR (Large) PHWR (Large)ACR1000 ACR1000 ACR1000
Low Central HighSA SA SA
6.1 7.6 9.1
5 5 7
4 5 730 30 3060 60 6060 60 605 7 10
1200 1200 12001 1 1
1200 1200 12000 0 0
Flat (no degradation)Flat (no degradation)Flat (no degradation)See drop down See drop down See drop down
97.00% 96.00% 95.00%97.00% 96.00% 95.00%89.03% 85.48% 81.99%97.00% 96.00% 95.00%97.00% 96.00% 95.00%89.03% 85.48% 81.99%97.00% 96.00% 95.00%97.00% 96.00% 95.00%89.03% 85.48% 81.99%97.00% 96.00% 95.00%97.00% 96.00% 95.00%89.03% 85.48% 81.99%97.00% 96.00% 95.00%97.00% 96.00% 95.00%89.03% 85.48% 81.99%97.00% 96.00% 95.00%97.00% 96.00% 95.00%89.03% 85.48% 81.99%97.00% 96.00% 95.00%97.00% 96.00% 95.00%89.03% 85.48% 81.99%97.00% 96.00% 95.00%97.00% 96.00% 95.00%89.03% 85.48% 81.99%97.00% 96.00% 95.00%97.00% 96.00% 95.00%89.03% 85.48% 81.99%97.00% 96.00% 95.00%0.00% 0.00% 0.00%0.00% 0.00% 0.00%97.00% 96.00% 95.00%97.00% 96.00% 95.00%89.03% 85.48% 81.99%97.00% 96.00% 95.00%97.00% 96.00% 95.00%89.03% 85.48% 81.99%97.00% 96.00% 95.00%97.00% 96.00% 95.00%89.03% 85.48% 81.99%97.00% 96.00% 95.00%97.00% 96.00% 95.00%89.03% 85.48% 81.99%97.00% 96.00% 95.00%97.00% 96.00% 95.00%89.03% 85.48% 81.99%97.00% 96.00% 95.00%97.00% 96.00% 95.00%89.03% 85.48% 81.99%97.00% 96.00% 95.00%97.00% 96.00% 95.00%89.03% 85.48% 81.99%97.00% 96.00% 95.00%97.00% 96.00% 95.00%89.03% 85.48% 81.99%97.00% 96.00% 95.00%97.00% 96.00% 95.00%89.03% 85.48% 81.99%97.00% 96.00% 95.00%97.00% 96.00% 95.00%89.03% 85.48% 81.99%
Continuous on-load
Continuous on-load
Continuous on-load
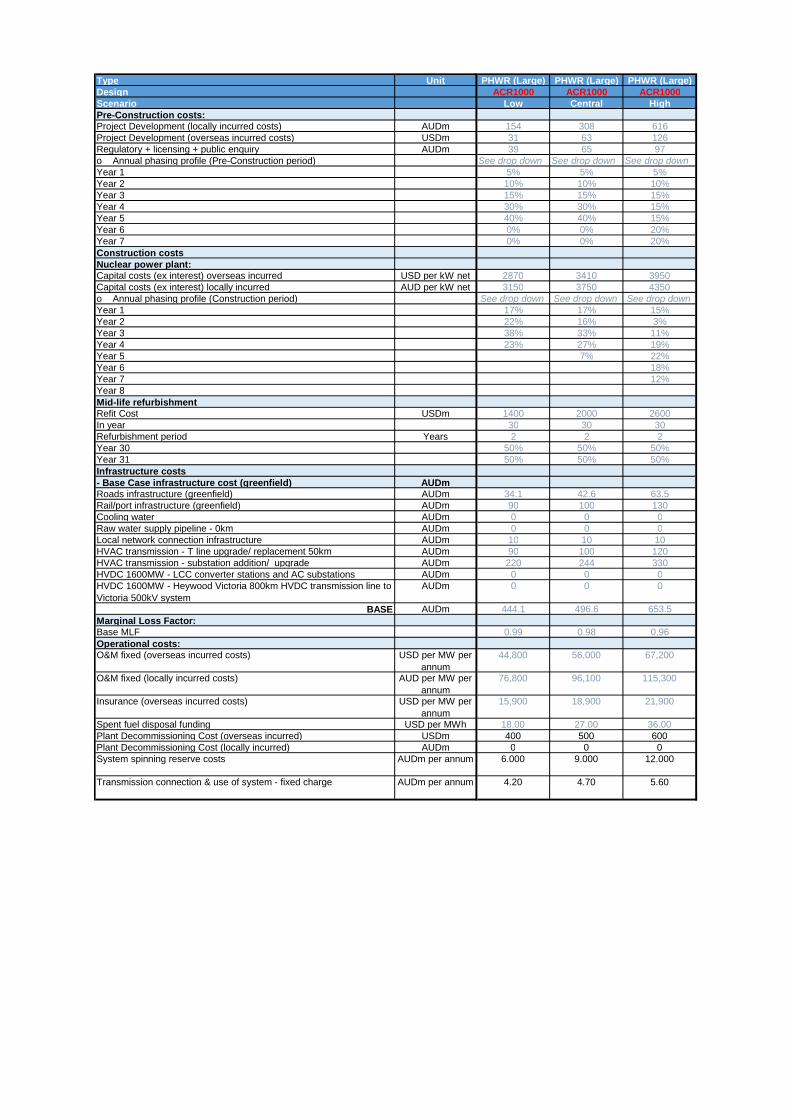
Type UnitDesignScenarioPre-Construction costs:Project Development (locally incurred costs) AUDmProject Development (overseas incurred costs) USDmRegulatory + licensing + public enquiry AUDmo Annual phasing profile (Pre-Construction period)Year 1Year 2Year 3Year 4Year 5Year 6Year 7Construction costsNuclear power plant:Capital costs (ex interest) overseas incurred USD per kW netCapital costs (ex interest) locally incurred AUD per kW neto Annual phasing profile (Construction period)Year 1Year 2Year 3Year 4Year 5Year 6Year 7Year 8Mid-life refurbishmentRefit Cost USDmIn yearRefurbishment period YearsYear 30Year 31Infrastructure costs- Base Case infrastructure cost (greenfield) AUDmRoads infrastructure (greenfield) AUDmRail/port infrastructure (greenfield) AUDmCooling water AUDmRaw water supply pipeline - 0km AUDmLocal network connection infrastructure AUDmHVAC transmission - T line upgrade/ replacement 50km AUDmHVAC transmission - substation addition/ upgrade AUDmHVDC 1600MW - LCC converter stations and AC substations AUDmHVDC 1600MW - Heywood Victoria 800km HVDC transmission line toVictoria 500kV system
AUDm
BASE AUDmMarginal Loss Factor:Base MLFOperational costs:O&M fixed (overseas incurred costs) USD per MW per
annumO&M fixed (locally incurred costs) AUD per MW per
annumInsurance (overseas incurred costs) USD per MW per
annumSpent fuel disposal funding USD per MWhPlant Decommissioning Cost (overseas incurred) USDmPlant Decommissioning Cost (locally incurred) AUDmSystem spinning reserve costs AUDm per annum
Transmission connection & use of system - fixed charge AUDm per annum
PHWR (Large) PHWR (Large) PHWR (Large)ACR1000 ACR1000 ACR1000
Low Central High
154 308 61631 63 12639 65 97
See drop down See drop down See drop down5% 5% 5%10% 10% 10%15% 15% 15%30% 30% 15%40% 40% 15%0% 0% 20%0% 0% 20%
2870 3410 39503150 3750 4350
See drop down See drop down See drop down17% 17% 15%22% 16% 3%38% 33% 11%23% 27% 19%
7% 22%18%12%
1400 2000 260030 30 302 2 2
50% 50% 50%50% 50% 50%
34.1 42.6 63.590 100 1300 0 00 0 0
10 10 1090 100 120220 244 3300 0 00 0 0
444.1 496.6 653.5
0.99 0.98 0.96
44,800 56,000 67,200
76,800 96,100 115,300
15,900 18,900 21,900
18.00 27.00 36.00400 500 6000 0 0
6.000 9.000 12.000
4.20 4.70 5.60

WSP | Parsons BrinckerhoffFebruary 2016
Project No 2265048A-STC-REP-004 Rev1Final ReportNuclear Fuel Cycle Royal Commission
: SMALL PHWR – EC6

Type UnitDesignScenarioRegional Market Interconnection:Fuel:Fuel price USD/MWh of net
outputTiming:Total Pre-Construction Period (including pre-licensing /approvals,licensing & public enquiry)
Years
Construction Period YearsRefit interval YearsPlant Operating Period YearsSpent Fuel Cool Down Period YearsDecommissioning Period YearsTechnical:Net Generation Capacity per Reactor MWPlant Configuration (number of reactors) #Net Generation Capacity MWIn Station Usage MWEfficiency profile Flat (no degradation)Availability profileYear 1Year 2Year 3Year 4Year 5Year 6Year 7Year 8Year 9Year 10Year 11Year 12Year 13Year 14Year 15Year 16Year 17Year 18Year 19Year 20Year 21Year 22Year 23Year 24Year 25Year 26Year 27Year 28Year 29Year 30Year 31Year 32Year 33Year 34Year 35Year 36Year 37Year 38Year 39Year 40Year 41Year 42Year 43Year 44Year 45Year 46Year 47Year 48Year 49Year 50Year 51Year 52Year 53Year 54Year 55Year 56Year 57Year 58Year 59Year 60Refuelling cycle
PHWR (Small) PHWR (Small) PHWR (Small)EC6 EC6 EC6Low Central HighSA SA SA
6.1 7.6 9.1
5 5 7
4 5 730 30 3060 60 6060 60 605 7 10
740 740 7401 1 1
740 740 7400 0 0
Flat (no degradation)Flat (no degradation)Flat (no degradation)See drop down See drop down See drop down
97.00% 96.00% 95.00%97.00% 96.00% 95.00%89.03% 85.48% 81.99%97.00% 96.00% 95.00%97.00% 96.00% 95.00%89.03% 85.48% 81.99%97.00% 96.00% 95.00%97.00% 96.00% 95.00%89.03% 85.48% 81.99%97.00% 96.00% 95.00%97.00% 96.00% 95.00%89.03% 85.48% 81.99%97.00% 96.00% 95.00%97.00% 96.00% 95.00%89.03% 85.48% 81.99%97.00% 96.00% 95.00%97.00% 96.00% 95.00%89.03% 85.48% 81.99%97.00% 96.00% 95.00%97.00% 96.00% 95.00%89.03% 85.48% 81.99%97.00% 96.00% 95.00%97.00% 96.00% 95.00%89.03% 85.48% 81.99%97.00% 96.00% 95.00%97.00% 96.00% 95.00%89.03% 85.48% 81.99%97.00% 96.00% 95.00%0.00% 0.00% 0.00%0.00% 0.00% 0.00%97.00% 96.00% 95.00%97.00% 96.00% 95.00%89.03% 85.48% 81.99%97.00% 96.00% 95.00%97.00% 96.00% 95.00%89.03% 85.48% 81.99%97.00% 96.00% 95.00%97.00% 96.00% 95.00%89.03% 85.48% 81.99%97.00% 96.00% 95.00%97.00% 96.00% 95.00%89.03% 85.48% 81.99%97.00% 96.00% 95.00%97.00% 96.00% 95.00%89.03% 85.48% 81.99%97.00% 96.00% 95.00%97.00% 96.00% 95.00%89.03% 85.48% 81.99%97.00% 96.00% 95.00%97.00% 96.00% 95.00%89.03% 85.48% 81.99%97.00% 96.00% 95.00%97.00% 96.00% 95.00%89.03% 85.48% 81.99%97.00% 96.00% 95.00%97.00% 96.00% 95.00%89.03% 85.48% 81.99%97.00% 96.00% 95.00%97.00% 96.00% 95.00%89.03% 85.48% 81.99%
Continuous on-load
Continuous on-load
Continuous on-load
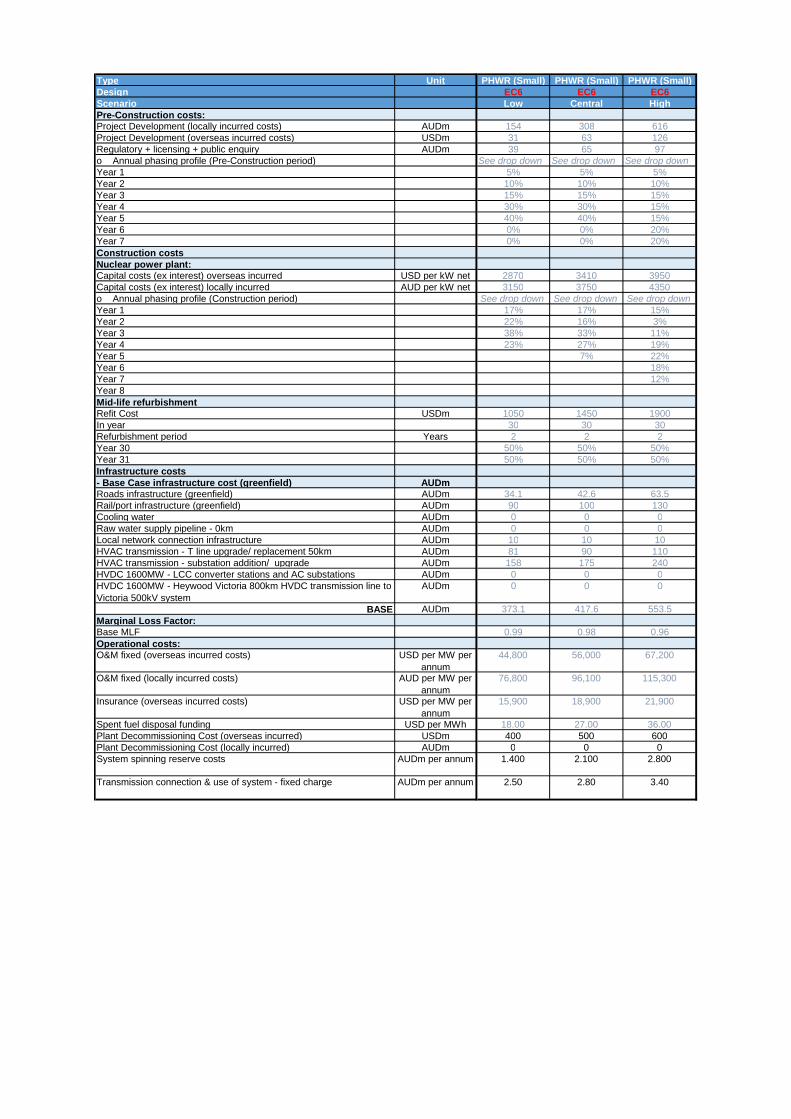
Type UnitDesignScenarioPre-Construction costs:Project Development (locally incurred costs) AUDmProject Development (overseas incurred costs) USDmRegulatory + licensing + public enquiry AUDmo Annual phasing profile (Pre-Construction period)Year 1Year 2Year 3Year 4Year 5Year 6Year 7Construction costsNuclear power plant:Capital costs (ex interest) overseas incurred USD per kW netCapital costs (ex interest) locally incurred AUD per kW neto Annual phasing profile (Construction period)Year 1Year 2Year 3Year 4Year 5Year 6Year 7Year 8Mid-life refurbishmentRefit Cost USDmIn yearRefurbishment period YearsYear 30Year 31Infrastructure costs- Base Case infrastructure cost (greenfield) AUDmRoads infrastructure (greenfield) AUDmRail/port infrastructure (greenfield) AUDmCooling water AUDmRaw water supply pipeline - 0km AUDmLocal network connection infrastructure AUDmHVAC transmission - T line upgrade/ replacement 50km AUDmHVAC transmission - substation addition/ upgrade AUDmHVDC 1600MW - LCC converter stations and AC substations AUDmHVDC 1600MW - Heywood Victoria 800km HVDC transmission line toVictoria 500kV system
AUDm
BASE AUDmMarginal Loss Factor:Base MLFOperational costs:O&M fixed (overseas incurred costs) USD per MW per
annumO&M fixed (locally incurred costs) AUD per MW per
annumInsurance (overseas incurred costs) USD per MW per
annumSpent fuel disposal funding USD per MWhPlant Decommissioning Cost (overseas incurred) USDmPlant Decommissioning Cost (locally incurred) AUDmSystem spinning reserve costs AUDm per annum
Transmission connection & use of system - fixed charge AUDm per annum
PHWR (Small) PHWR (Small) PHWR (Small)EC6 EC6 EC6Low Central High
154 308 61631 63 12639 65 97
See drop down See drop down See drop down5% 5% 5%10% 10% 10%15% 15% 15%30% 30% 15%40% 40% 15%0% 0% 20%0% 0% 20%
2870 3410 39503150 3750 4350
See drop down See drop down See drop down17% 17% 15%22% 16% 3%38% 33% 11%23% 27% 19%
7% 22%18%12%
1050 1450 190030 30 302 2 2
50% 50% 50%50% 50% 50%
34.1 42.6 63.590 100 1300 0 00 0 0
10 10 1081 90 110158 175 2400 0 00 0 0
373.1 417.6 553.5
0.99 0.98 0.96
44,800 56,000 67,200
76,800 96,100 115,300
15,900 18,900 21,900
18.00 27.00 36.00400 500 6000 0 0
1.400 2.100 2.800
2.50 2.80 3.40

WSP | Parsons BrinckerhoffFebruary 2016
Project No 2265048A-STC-REP-004 Rev1Final ReportNuclear Fuel Cycle Royal Commission
: LARGE SMR - MPOWER

Type UnitDesignScenarioRegional Market Interconnection:Fuel:Fuel price USD/MWh of net
outputTiming:Total Pre-Construction Period (including pre-licensing /approvals,licensing & public enquiry)
Years
Construction Period YearsRefit interval YearsPlant Operating Period YearsSpent Fuel Cool Down Period YearsDecommissioning Period YearsTechnical:Net Generation Capacity per Reactor MWPlant Configuration (number of reactors) #Net Generation Capacity MWIn Station Usage MWEfficiency profile Flat (no degradation)Availability profileYear 1Year 2Year 3Year 4Year 5Year 6Year 7Year 8Year 9Year 10Year 11Year 12Year 13Year 14Year 15Year 16Year 17Year 18Year 19Year 20Year 21Year 22Year 23Year 24Year 25Year 26Year 27Year 28Year 29Year 30Year 31Year 32Year 33Year 34Year 35Year 36Year 37Year 38Year 39Year 40Year 41Year 42Year 43Year 44Year 45Year 46Year 47Year 48Year 49Year 50Year 51Year 52Year 53Year 54Year 55Year 56Year 57Year 58Year 59Year 60Refuelling cycle
SMR (Large) SMR (Large) SMR (Large)mPower mPower mPower
Low Central HighSA SA SA
7.3 9.1 10.9
5 5 7
2 3 4Not applicable Not applicable Not applicable
60 60 6060 60 605 7 10
180 180 1802 2 2
360 360 3600 0 0
Flat (no degradation)Flat (no degradation)Flat (no degradation)See drop down See drop down See drop down
98.04% 96.99% 95.93%98.04% 96.99% 95.93%95.36% 93.01% 90.67%95.36% 93.01% 90.67%98.04% 96.99% 95.93%98.04% 96.99% 95.93%95.36% 93.01% 90.67%95.36% 93.01% 90.67%98.04% 96.99% 95.93%98.04% 96.99% 95.93%95.36% 93.01% 90.67%95.36% 93.01% 90.67%98.04% 96.99% 95.93%98.04% 96.99% 95.93%95.36% 93.01% 90.67%95.36% 93.01% 90.67%98.04% 96.99% 95.93%98.04% 96.99% 95.93%95.36% 93.01% 90.67%95.36% 93.01% 90.67%98.04% 96.99% 95.93%98.04% 96.99% 95.93%95.36% 93.01% 90.67%95.36% 93.01% 90.67%98.04% 96.99% 95.93%98.04% 96.99% 95.93%95.36% 93.01% 90.67%95.36% 93.01% 90.67%98.04% 96.99% 95.93%98.04% 96.99% 95.93%95.36% 93.01% 90.67%95.36% 93.01% 90.67%98.04% 96.99% 95.93%98.04% 96.99% 95.93%95.36% 93.01% 90.67%95.36% 93.01% 90.67%98.04% 96.99% 95.93%98.04% 96.99% 95.93%95.36% 93.01% 90.67%95.36% 93.01% 90.67%98.04% 96.99% 95.93%98.04% 96.99% 95.93%95.36% 93.01% 90.67%95.36% 93.01% 90.67%98.04% 96.99% 95.93%98.04% 96.99% 95.93%95.36% 93.01% 90.67%95.36% 93.01% 90.67%98.04% 96.99% 95.93%98.04% 96.99% 95.93%95.36% 93.01% 90.67%95.36% 93.01% 90.67%98.04% 96.99% 95.93%98.04% 96.99% 95.93%95.36% 93.01% 90.67%95.36% 93.01% 90.67%98.04% 96.99% 95.93%98.04% 96.99% 95.93%95.36% 93.01% 90.67%95.36% 93.01% 90.67%
20 days every 4years
30 days every 4years
40 days every 4years

Type UnitDesignScenarioPre-Construction costs:Project Development (locally incurred costs) AUDmProject Development (overseas incurred costs) USDmRegulatory + licensing + public enquiry AUDmo Annual phasing profile (Pre-Construction period)Year 1Year 2Year 3Year 4Year 5Year 6Year 7Construction costsNuclear power plant:Capital costs (ex interest) overseas incurred USD per kW netCapital costs (ex interest) locally incurred AUD per kW neto Annual phasing profile (Construction period)Year 1Year 2Year 3Year 4Year 5Year 6Year 7Year 8Mid-life refurbishmentRefit Cost USDmIn yearRefurbishment period YearsYear 30Year 31Infrastructure costs- Base Case infrastructure cost (greenfield) AUDmRoads infrastructure (greenfield) AUDmRail/port infrastructure (greenfield) AUDmCooling water AUDmRaw water supply pipeline - 0km AUDmLocal network connection infrastructure AUDmHVAC transmission - T line upgrade/ replacement 50km AUDmHVAC transmission - substation addition/ upgrade AUDmHVDC 1600MW - LCC converter stations and AC substations AUDmHVDC 1600MW - Heywood Victoria 800km HVDC transmission line toVictoria 500kV system
AUDm
BASE AUDmMarginal Loss Factor:Base MLFOperational costs:O&M fixed (overseas incurred costs) USD per MW per
annumO&M fixed (locally incurred costs) AUD per MW per
annumInsurance (overseas incurred costs) USD per MW per
annumSpent fuel disposal funding USD per MWhPlant Decommissioning Cost (overseas incurred) USDmPlant Decommissioning Cost (locally incurred) AUDmSystem spinning reserve costs AUDm per annum
Transmission connection & use of system - fixed charge AUDm per annum
SMR (Large) SMR (Large) SMR (Large)mPower mPower mPower
Low Central High
154 308 61631 63 12639 65 97
See drop down See drop down See drop down5% 5% 5%10% 10% 10%15% 15% 15%30% 30% 15%40% 40% 15%0% 0% 20%0% 0% 20%
3020 3550 42602700 3180 3820
See drop down See drop down See drop down35% 25% 19%65% 52% 29%
23% 40%12%
N/A N/A N/AN/A N/A N/A
0 0 00% 0% 0%0% 0% 0%
34.1 42.6 63.5120.5 150.6 199.1130.7 145.7 207.8
0 0 010 10 1040 45 5442 47 640 0 00 0 0
377.3 440.9 598.4
0.975 0.975 0.975
39,100 48,900 58,600
84,300 105,400 126,500
15,300 18,000 21,600
3.00 4.50 6.00200 250 3000 0 0
0.000 0.000 0.000
0.60 0.70 0.80

WSP | Parsons BrinckerhoffFebruary 2016
Project No 2265048A-STC-REP-004 Rev1Final ReportNuclear Fuel Cycle Royal Commission
: SMALL SMR - NUSCALE
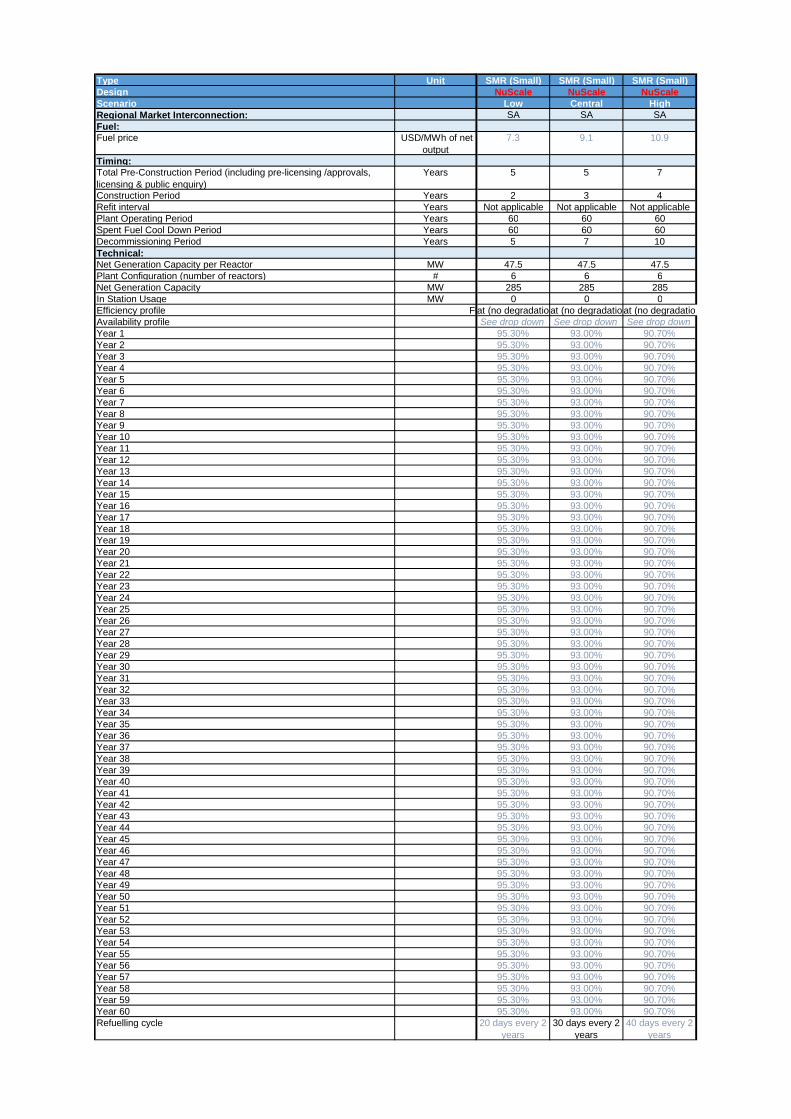
Type UnitDesignScenarioRegional Market Interconnection:Fuel:Fuel price USD/MWh of net
outputTiming:Total Pre-Construction Period (including pre-licensing /approvals,licensing & public enquiry)
Years
Construction Period YearsRefit interval YearsPlant Operating Period YearsSpent Fuel Cool Down Period YearsDecommissioning Period YearsTechnical:Net Generation Capacity per Reactor MWPlant Configuration (number of reactors) #Net Generation Capacity MWIn Station Usage MWEfficiency profile Flat (no degradation)Availability profileYear 1Year 2Year 3Year 4Year 5Year 6Year 7Year 8Year 9Year 10Year 11Year 12Year 13Year 14Year 15Year 16Year 17Year 18Year 19Year 20Year 21Year 22Year 23Year 24Year 25Year 26Year 27Year 28Year 29Year 30Year 31Year 32Year 33Year 34Year 35Year 36Year 37Year 38Year 39Year 40Year 41Year 42Year 43Year 44Year 45Year 46Year 47Year 48Year 49Year 50Year 51Year 52Year 53Year 54Year 55Year 56Year 57Year 58Year 59Year 60Refuelling cycle
SMR (Small) SMR (Small) SMR (Small)NuScale NuScale NuScale
Low Central HighSA SA SA
7.3 9.1 10.9
5 5 7
2 3 4Not applicable Not applicable Not applicable
60 60 6060 60 605 7 10
47.5 47.5 47.56 6 6
285 285 2850 0 0
Flat (no degradation)Flat (no degradation)Flat (no degradation)See drop down See drop down See drop down
95.30% 93.00% 90.70%95.30% 93.00% 90.70%95.30% 93.00% 90.70%95.30% 93.00% 90.70%95.30% 93.00% 90.70%95.30% 93.00% 90.70%95.30% 93.00% 90.70%95.30% 93.00% 90.70%95.30% 93.00% 90.70%95.30% 93.00% 90.70%95.30% 93.00% 90.70%95.30% 93.00% 90.70%95.30% 93.00% 90.70%95.30% 93.00% 90.70%95.30% 93.00% 90.70%95.30% 93.00% 90.70%95.30% 93.00% 90.70%95.30% 93.00% 90.70%95.30% 93.00% 90.70%95.30% 93.00% 90.70%95.30% 93.00% 90.70%95.30% 93.00% 90.70%95.30% 93.00% 90.70%95.30% 93.00% 90.70%95.30% 93.00% 90.70%95.30% 93.00% 90.70%95.30% 93.00% 90.70%95.30% 93.00% 90.70%95.30% 93.00% 90.70%95.30% 93.00% 90.70%95.30% 93.00% 90.70%95.30% 93.00% 90.70%95.30% 93.00% 90.70%95.30% 93.00% 90.70%95.30% 93.00% 90.70%95.30% 93.00% 90.70%95.30% 93.00% 90.70%95.30% 93.00% 90.70%95.30% 93.00% 90.70%95.30% 93.00% 90.70%95.30% 93.00% 90.70%95.30% 93.00% 90.70%95.30% 93.00% 90.70%95.30% 93.00% 90.70%95.30% 93.00% 90.70%95.30% 93.00% 90.70%95.30% 93.00% 90.70%95.30% 93.00% 90.70%95.30% 93.00% 90.70%95.30% 93.00% 90.70%95.30% 93.00% 90.70%95.30% 93.00% 90.70%95.30% 93.00% 90.70%95.30% 93.00% 90.70%95.30% 93.00% 90.70%95.30% 93.00% 90.70%95.30% 93.00% 90.70%95.30% 93.00% 90.70%95.30% 93.00% 90.70%95.30% 93.00% 90.70%
20 days every 2years
30 days every 2years
40 days every 2years

Type UnitDesignScenarioPre-Construction costs:Project Development (locally incurred costs) AUDmProject Development (overseas incurred costs) USDmRegulatory + licensing + public enquiry AUDmo Annual phasing profile (Pre-Construction period)Year 1Year 2Year 3Year 4Year 5Year 6Year 7Construction costsNuclear power plant:Capital costs (ex interest) overseas incurred USD per kW netCapital costs (ex interest) locally incurred AUD per kW neto Annual phasing profile (Construction period)Year 1Year 2Year 3Year 4Year 5Year 6Year 7Year 8Mid-life refurbishmentRefit Cost USDmIn yearRefurbishment period YearsYear 30Year 31Infrastructure costs- Base Case infrastructure cost (greenfield) AUDmRoads infrastructure (greenfield) AUDmRail/port infrastructure (greenfield) AUDmCooling water AUDmRaw water supply pipeline - 0km AUDmLocal network connection infrastructure AUDmHVAC transmission - T line upgrade/ replacement 50km AUDmHVAC transmission - substation addition/ upgrade AUDmHVDC 1600MW - LCC converter stations and AC substations AUDmHVDC 1600MW - Heywood Victoria 800km HVDC transmission line toVictoria 500kV system
AUDm
BASE AUDmMarginal Loss Factor:Base MLFOperational costs:O&M fixed (overseas incurred costs) USD per MW per
annumO&M fixed (locally incurred costs) AUD per MW per
annumInsurance (overseas incurred costs) USD per MW per
annumSpent fuel disposal funding USD per MWhPlant Decommissioning Cost (overseas incurred) USDmPlant Decommissioning Cost (locally incurred) AUDmSystem spinning reserve costs AUDm per annum
Transmission connection & use of system - fixed charge AUDm per annum
SMR (Small) SMR (Small) SMR (Small)NuScale NuScale NuScale
Low Central High
154 308 61631 63 12639 65 97
See drop down See drop down See drop down5% 5% 5%10% 10% 10%15% 15% 15%30% 30% 15%40% 40% 15%0% 0% 20%0% 0% 20%
3310 3910 46802970 3500 4190
See drop down See drop down See drop down35% 25% 19%65% 52% 29%
23% 40%12%
N/A N/A N/AN/A N/A N/A
0 0 00% 0% 0%0% 0% 0%
34.1 42.6 63.5120.5 150.6 199.1117.1 144.3 206.4
0 0 010 10 1040 45 5442 47 640 0 00 0 0
363.7 439.5 597
0.975 0.975 0.975
39,100 48,900 58,600
84,300 105,400 126,500
16,800 19,800 23,700
3.00 4.50 6.00200 250 3000 0 0
0.000 0.000 0.000
0.60 0.70 0.80

Appendix BWEIGHTED AVERAGE COST OF CAPITAL CALCULATION
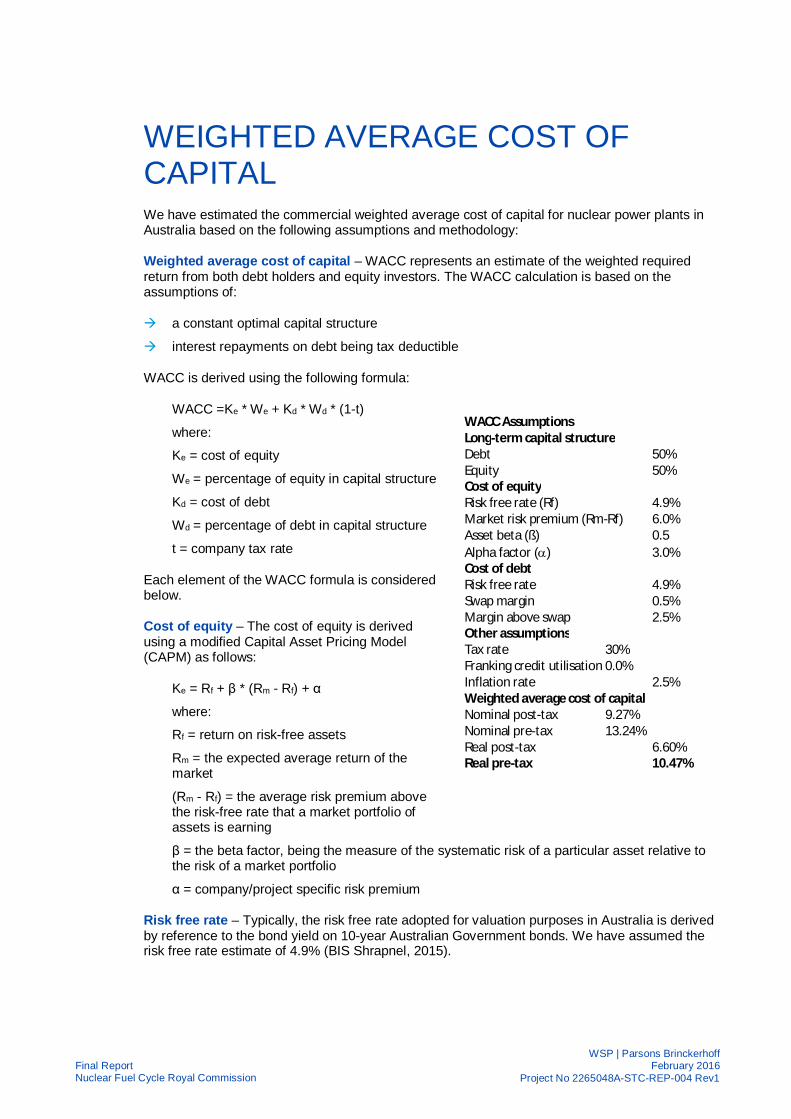
WSP | Parsons BrinckerhoffFebruary 2016
Project No 2265048A-STC-REP-004 Rev1Final ReportNuclear Fuel Cycle Royal Commission
WEIGHTED AVERAGE COST OFCAPITALWe have estimated the commercial weighted average cost of capital for nuclear power plants inAustralia based on the following assumptions and methodology:
Weighted average cost of capital – WACC represents an estimate of the weighted requiredreturn from both debt holders and equity investors. The WACC calculation is based on theassumptions of:
à a constant optimal capital structure
à interest repayments on debt being tax deductible
WACC is derived using the following formula:
WACC =Ke * We + Kd * Wd * (1-t)
where:
Ke = cost of equity
We = percentage of equity in capital structure
Kd = cost of debt
Wd = percentage of debt in capital structure
t = company tax rate
Each element of the WACC formula is consideredbelow.
Cost of equity – The cost of equity is derivedusing a modified Capital Asset Pricing Model(CAPM) as follows:
Ke = Rf + β * (Rm - Rf) + α
where:
Rf = return on risk-free assets
Rm = the expected average return of themarket
(Rm - Rf) = the average risk premium abovethe risk-free rate that a market portfolio ofassets is earning
β = the beta factor, being the measure of the systematic risk of a particular asset relative tothe risk of a market portfolio
α = company/project specific risk premium
Risk free rate – Typically, the risk free rate adopted for valuation purposes in Australia is derivedby reference to the bond yield on 10-year Australian Government bonds. We have assumed therisk free rate estimate of 4.9% (BIS Shrapnel, 2015).
WACC AssumptionsLong-term capital structureDebt 50%Equity 50%Cost of equityRisk free rate (Rf) 4.9%Market risk premium (Rm-Rf) 6.0%Asset beta (ß) 0.5Alpha factor (a) 3.0%Cost of debtRisk free rate 4.9%Swap margin 0.5%Margin above swap 2.5%Other assumptionsTax rate 30%Franking credit utilisation 0.0%Inflation rate 2.5%Weighted average cost of capitalNominal post-tax 9.27%Nominal pre-tax 13.24%Real post-tax 6.60%Real pre-tax 10.47%

WSP | Parsons BrinckerhoffFebruary 2016
Project No 2265048A-STC-REP-004 Rev1Final ReportNuclear Fuel Cycle Royal Commission
Market risk premium – The market risk premium reflects the excess return that a market portfolioof assets generates over the risk free rate. The market risk premium is generally determined withreference to market observations over a long period of time, and is therefore relatively stable.Based on the adopted approach to long-term estimates of the MRP and the risk-free rate, theMRP of 6% is regarded as an appropriate assumption for the long-term investment climate inAustralia.
Beta – The beta of a company reflects the volatility of the historic cash flows generated by thecompany. It is a historic measure against the returns of the market portfolio and in general, as thevolatility of a firm’s cash flows increases, so does the beta.
In determining an appropriate beta, we have analysed the betas of comparable listed companiesoperating nuclear power plants in OECD countries. An assumed asset beta of 0.5 represents anaverage beta for comparable companies in our analysis.
Alpha – We have adopted a project specific risk premium of 3% which reflects the investorperception of higher risks associated with nuclear power generation sector.
Gearing and cost of debt – Gearing level and cost of debt assumptions are based on theassumed risk profile of the cash flows, including long-term revenue certainty and our observationsof energy/infrastructure financing transactions in the current Australian capital markets.
Tax rate – We have applied a company tax rate of 30% percent.
We have calculated the post-tax nominal WACC based on the above assumptions. We have thenconverted the calculated post-tax nominal WACC into a pre-tax real WACC to be used as adiscount rate in the calculation of LCOE and LPOE.

Appendix CCASHFLOW OUTPUTS FOR CGE MODELLING INPUTS

WSP | Parsons BrinckerhoffFebruary 2016
Project No 2265048A-STC-REP-004 Rev1Final ReportNuclear Fuel Cycle Royal Commission

Year 1 Year 2 Year 3 Year 4 Year 5 Year 6 Year 7 Year 8 Year 9 Year 10 Year 11 Year 12 Year 13 Year 14 Year 15 Year 16PWR - 1 x AP1000 Unit TOTAL Jun-13 Jun-14 Jun-15 Jun-16 Jun-17 Jun-18 Jun-19 Jun-20 Jun-21 Jun-22 Jun-23 Jun-24 Jun-25 Jun-26 Jun-27 Jun-28
Nuclear Power PlantFunding source Inputs will be identical to Scenario 2
SA Govt except for very minor costs e.g. financeCwth Govt and professional feesIndustry - Private Investment (AUS)Industry - Foreign Investment
Sales - Domestic
Inputs sourced from South Australian businesses or operating expensesAccommodation and services A$m 0 0 0 0 0 0 0 0 0.68 1.39 2.13 4.37 5.97 66.6 64.5 138.47Civil construction A$m 0 0 0 0 0 0 0 0 4.58 9.4 14.45 29.61 40.47 140.61 136.17 292.35Construction services A$m 0 0 0 0 0 0 0 0 1.83 3.76 5.78 11.84 16.19 163.16 158.01 339.23Finance A$m 0 0 0 0 0 0 0 0 0.19 0.38 0.59 1.21 1.65 2.63 2.54 5.46Insurance A$m 0 0 0 0 0 0 0 0 0.12 0.25 0.38 0.79 1.07 3.35 3.25 6.97Material Supplies A$m 0 0 0 0 0 0 0 0 2.34 4.79 7.37 15.11 20.65 142.26 137.78 295.8Professional services A$m 0 0 0 0 0 0 0 0 5.94 12.18 18.72 38.37 52.44 10.26 9.94 21.34Reactor A$m 0 0 0 0 0 0 0 0 0 0 0 0 0 8.49 8.22 17.66Specialised Equipment A$m 0 0 0 0 0 0 0 0 0 0 0 0 0 76.18 73.78 158.39Staff costs A$m 0 0 0 0 0 0 0 0 0 0 0 0 0 0 0 0Transport A$m 0 0 0 0 0 0 0 0 0.8 1.64 2.53 5.18 7.08 17.37 16.82 36.12Utility charges A$m 0 0 0 0 0 0 0 0 0 0 0 0 0 0 0 0Waste and decom charges A$m 0 0 0 0 0 0 0 0 0 0 0 0 0 0 0 0
Inputs sourced from Other States businessesAccommodation and services A$m 0 0 0 0 0 0 0 0 0.29 0.59 0.91 1.87 2.56 16.98 16.45 35.31Civil construction A$m 0 0 0 0 0 0 0 0 1.96 4.03 6.19 12.69 17.34 60.2 58.3 125.16Construction services A$m 0 0 0 0 0 0 0 0 0.79 1.61 2.48 5.08 6.94 75.78 73.39 157.56Finance A$m 0 0 0 0 0 0 0 0 0.19 0.38 0.59 1.21 1.65 2.62 2.54 5.45Insurance A$m 0 0 0 0 0 0 0 0 0.12 0.25 0.38 0.79 1.07 3.35 3.24 6.96Material Supplies A$m 0 0 0 0 0 0 0 0 0 0 0 0 0 75.87 73.48 157.76Professional services A$m 0 0 0 0 0 0 0 0 2.02 4.14 6.36 13.05 17.83 7.04 6.81 14.63Reactor A$m 0 0 0 0 0 0 0 0 0 0 0 0 0 8.48 8.21 17.63Specialised Equipment A$m 0 0 0 0 0 0 0 0 0 0 0 0 0 76.08 73.68 158.18Staff costs A$m 0 0 0 0 0 0 0 0 0 0 0 0 0 0 0 0Transport A$m 0 0 0 0 0 0 0 0 0.34 0.7 1.08 2.22 3.03 12 11.62 24.95Utility charges A$m 0 0 0 0 0 0 0 0 0 0 0 0 0 0 0 0Waste and decom charges A$m 0 0 0 0 0 0 0 0 0 0 0 0 0 0 0 0

PWR - 1 x AP1000 Unit
Nuclear Power PlantFunding source
SA GovtCwth GovtIndustry - Private Investment (AUS)Industry - Foreign Investment
Sales - Domestic
Inputs sourced from South Australian businesses or operating expensesAccommodation and services A$mCivil construction A$mConstruction services A$mFinance A$mInsurance A$mMaterial Supplies A$mProfessional services A$mReactor A$mSpecialised Equipment A$mStaff costs A$mTransport A$mUtility charges A$mWaste and decom charges A$m
Inputs sourced from Other States businessesAccommodation and services A$mCivil construction A$mConstruction services A$mFinance A$mInsurance A$mMaterial Supplies A$mProfessional services A$mReactor A$mSpecialised Equipment A$mStaff costs A$mTransport A$mUtility charges A$mWaste and decom charges A$m
Year 17 Year 18 Year 19 Year 20 Year 21 Year 22 Year 23 Year 24 Year 25 Year 26 Year 27 Year 28 Year 29 Year 30 Year 31 Year 32Jun-29 Jun-30 Jun-31 Jun-32 Jun-33 Jun-34 Jun-35 Jun-36 Jun-37 Jun-38 Jun-39 Jun-40 Jun-41 Jun-42 Jun-43 Jun-44
117.82 30.96 0 0 0 0 0 0 0 0 0 0 0 0 0 0248.75 65.37 0 0 0 0 0 0 0 0 0 0 0 0 0 0288.64 75.85 0 0 0 0 0 0 0 0 0 0 0 0 0 0
4.65 1.22 0 0 0 0 0 0 0 0 0 0 0 0 0 05.93 1.56 9.61 9.94 10.31 10.73 11.1 11.51 11.98 12.39 12.85 13.38 13.82 14.33 14.92 15.41
251.68 66.14 10.35 10.7 11.1 11.55 11.95 12.4 12.9 13.34 13.84 14.41 14.88 15.43 16.07 16.5918.16 4.77 19.31 19.98 20.72 21.56 22.3 23.14 24.08 24.9 25.82 26.88 27.77 28.8 29.99 30.9615.02 3.95 0 0 0 0 0 0 0 0 0 0 0 0 0 0
134.77 35.41 19.2 19.86 20.6 21.44 22.17 23 23.94 24.75 25.67 26.73 27.61 28.63 29.81 30.780 0 75.44 78.06 80.97 84.25 87.13 90.39 94.09 97.26 100.89 105.04 108.51 112.52 117.16 120.97
30.73 8.08 0 0 0 0 0 0 0 0 0 0 0 0 0 00 0 39.67 41.04 42.57 44.3 45.81 47.53 49.47 51.14 53.05 55.23 57.05 59.16 61.6 63.60 0 46 44.22 45.4 49.79 47.88 49.18 53.92 51.87 53.27 58.38 56.15 57.65 63.15 60.75
30.05 7.9 0 0 0 0 0 0 0 0 0 0 0 0 0 0106.5 27.99 0 0 0 0 0 0 0 0 0 0 0 0 0 0
134.06 35.23 0 0 0 0 0 0 0 0 0 0 0 0 0 04.64 1.22 0 0 0 0 0 0 0 0 0 0 0 0 0 05.92 1.56 9.61 9.94 10.31 10.73 11.1 11.51 11.98 12.39 12.85 13.38 13.82 14.33 14.92 15.41
134.23 35.27 2.59 2.68 2.78 2.89 2.99 3.1 3.23 3.33 3.46 3.6 3.72 3.86 4.02 4.1512.45 3.27 15.45 15.98 16.58 17.25 17.84 18.51 19.27 19.92 20.66 21.51 22.22 23.04 23.99 24.77
15 3.94 0 0 0 0 0 0 0 0 0 0 0 0 0 0134.59 35.37 19.2 19.86 20.6 21.44 22.17 23 23.94 24.75 25.67 26.73 27.61 28.63 29.81 30.78
0 0 0 0 0 0 0 0 0 0 0 0 0 0 0 021.23 5.58 0 0 0 0 0 0 0 0 0 0 0 0 0 0
0 0 0 0 0 0 0 0 0 0 0 0 0 0 0 00 0 39.41 37.4 38.33 42.43 40.27 41.29 45.71 43.38 44.46 49.21 46.68 47.83 52.92 50.19

PWR - 1 x AP1000 Unit
Nuclear Power PlantFunding source
SA GovtCwth GovtIndustry - Private Investment (AUS)Industry - Foreign Investment
Sales - Domestic
Inputs sourced from South Australian businesses or operating expensesAccommodation and services A$mCivil construction A$mConstruction services A$mFinance A$mInsurance A$mMaterial Supplies A$mProfessional services A$mReactor A$mSpecialised Equipment A$mStaff costs A$mTransport A$mUtility charges A$mWaste and decom charges A$m
Inputs sourced from Other States businessesAccommodation and services A$mCivil construction A$mConstruction services A$mFinance A$mInsurance A$mMaterial Supplies A$mProfessional services A$mReactor A$mSpecialised Equipment A$mStaff costs A$mTransport A$mUtility charges A$mWaste and decom charges A$m
Year 33 Year 34 Year 35 Year 36 Year 37 Year 38 Year 39 Year 40 Year 41 Year 42 Year 43 Year 44 Year 45 Year 46 Year 47 Year 48Jun-45 Jun-46 Jun-47 Jun-48 Jun-49 Jun-50 Jun-51 Jun-52 Jun-53 Jun-54 Jun-55 Jun-56 Jun-57 Jun-58 Jun-59 Jun-60
0 0 0 0 0 0 0 0 0 0 0 0 0 0 0 00 0 0 0 0 0 0 0 0 0 0 0 0 0 0 00 0 0 0 0 0 0 0 0 0 0 0 0 0 0 00 0 0 0 0 0 0 0 0 0 0 0 0 0 0 0
15.98 16.65 17.19 17.83 18.58 19.17 19.88 20.73 21.38 22.18 23.12 23.85 24.73 25.79 26.59 27.5817.21 17.93 18.51 19.2 20.01 20.65 21.41 22.32 23.03 23.88 24.9 25.68 26.63 27.78 28.64 29.6932.11 33.46 34.54 35.83 37.34 38.53 39.96 41.66 42.98 44.57 46.47 47.93 49.7 51.84 53.44 55.42
0 0 0 0 0 0 0 0 0 0 0 0 0 0 0 031.93 33.26 34.34 35.62 37.12 38.31 39.73 41.42 42.73 44.31 46.2 47.65 49.41 51.54 53.13 55.1
125.47 130.72 134.96 139.97 145.87 150.55 156.13 162.76 167.91 174.13 181.57 187.26 194.18 202.53 208.8 216.520 0 0 0 0 0 0 0 0 0 0 0 0 0 0 0
65.97 68.73 70.96 73.6 76.7 79.16 82.09 85.58 88.29 91.56 95.47 98.46 102.1 106.49 109.79 113.8462.4 68.37 65.83 67.62 74.07 71.35 73.29 80.26 77.34 79.45 86.98 83.85 86.14 94.28 90.92 93.41
0 0 0 0 0 0 0 0 0 0 0 0 0 0 0 00 0 0 0 0 0 0 0 0 0 0 0 0 0 0 00 0 0 0 0 0 0 0 0 0 0 0 0 0 0 00 0 0 0 0 0 0 0 0 0 0 0 0 0 0 0
15.98 16.65 17.19 17.83 18.58 19.17 19.88 20.73 21.38 22.18 23.12 23.85 24.73 25.79 26.59 27.584.3 4.48 4.63 4.8 5 5.16 5.35 5.58 5.76 5.97 6.23 6.42 6.66 6.94 7.16 7.42
25.69 26.77 27.63 28.66 29.87 30.83 31.97 33.33 34.38 35.66 37.18 38.34 39.76 41.47 42.76 44.330 0 0 0 0 0 0 0 0 0 0 0 0 0 0 0
31.93 33.26 34.34 35.62 37.12 38.31 39.73 41.42 42.73 44.31 46.2 47.65 49.41 51.54 53.13 55.10 0 0 0 0 0 0 0 0 0 0 0 0 0 0 00 0 0 0 0 0 0 0 0 0 0 0 0 0 0 00 0 0 0 0 0 0 0 0 0 0 0 0 0 0 0
51.45 56.96 54.05 55.4 61.33 58.21 59.66 66.05 62.68 64.25 71.13 67.5 69.19 76.6 72.69 74.51

Year 1 Year 2 Year 3 Year 4 Year 5 Year 6 Year 7 Year 8 Year 9 Year 10 Year 11 Year 12 Year 13 Year 14 Year 15 Year 16PWR - 1 x AP1000 Unit TOTAL Jun-13 Jun-14 Jun-15 Jun-16 Jun-17 Jun-18 Jun-19 Jun-20 Jun-21 Jun-22 Jun-23 Jun-24 Jun-25 Jun-26 Jun-27 Jun-28Inputs sourced imports or import expenses
Accommodation and services A$m 0 0 0 0 0 0 0 0 0.2 0.41 0.63 1.31 1.78 20.82 20.13 43.17Civil construction A$m 0 0 0 0 0 0 0 0 0 0 0 0 0 0 0 0Construction services A$m 0 0 0 0 0 0 0 0 0.54 1.11 1.72 3.54 4.83 61.82 59.79 128.19Finance A$m 0 0 0 0 0 0 0 0 0.46 0.95 1.47 3.04 4.14 21.67 20.96 44.93Insurance A$m 0 0 0 0 0 0 0 0 0.3 0.62 0.96 1.97 2.69 22.03 21.31 45.69Material Supplies A$m 0 0 0 0 0 0 0 0 0 0 0 0 0 27.15 26.26 56.3Professional services A$m 0 0 0 0 0 0 0 0 3.22 6.64 10.3 21.21 28.93 179.64 173.74 372.54Reactor A$m 0 0 0 0 0 0 0 0 0 0 0 0 0 332.77 321.84 690.08Specialised Equipment A$m 0 0 0 0 0 0 0 0 0 0 0 0 0 333.29 322.34 691.15Staff costs A$m 0 0 0 0 0 0 0 0 0 0 0 0 0 0 0 0Transport A$m 0 0 0 0 0 0 0 0 0.1 0.22 0.33 0.69 0.94 23.62 22.84 48.97Utility charges A$m 0 0 0 0 0 0 0 0 0 0 0 0 0 0 0 0Waste and decom charges A$m 0 0 0 0 0 0 0 0 0 0 0 0 0 0 0 0
Surplus uranium mining industryProfits
TOTAL EXPENSES & PROFITSNuclear fuel A$m 0 0 0 0 0 0 0 0 0 0 0 0 0 0 0 0TOTAL OPEX A$m 0 0 0 0 0 0 0 0 0 0 0 0 0 0 0 0TOTAL CAPEX A$m 0 0 0 0 0 0 0 0 27.02 55.43 85.36 175.14 239.24 1992.11 1927.95 4136.4
Number of persons employedWages paidType of plant NPP - PWR - AP1000
Plant / unit capacity Please state capacity, indicate whether it is net (at station gate) or gross. Please indicate if there is more than 1 unit considered by power stationMW 1125Number of units Please specify number of units (reactors) if relevantno 1Auxiliary load Own plant / unit consumptionMW 0Commissioning year Commissioning year or schedule in case of multiple plants / unitsYear 2030Capital cost Assumed capital cost per installed capacity$/kW 7,402.99Variable O&M Variable operating and maintenance cost$/MWh 0.00Fixed O&M Fixed operating and maintenance cost$/MW/year 191,035Thermal efficiency Plant efficiency or heat rate (sent-out HHV)%, GJ/MWh N/AAvailability Average plant availability% 91.70%

PWR - 1 x AP1000 UnitInputs sourced imports or import expenses
Accommodation and services A$mCivil construction A$mConstruction services A$mFinance A$mInsurance A$mMaterial Supplies A$mProfessional services A$mReactor A$mSpecialised Equipment A$mStaff costs A$mTransport A$mUtility charges A$mWaste and decom charges A$m
Surplus uranium mining industryProfits
TOTAL EXPENSES & PROFITSNuclear fuel A$mTOTAL OPEX A$mTOTAL CAPEX A$m
Number of persons employedWages paidType of plant
Plant / unit capacity Please state capacity, indicate whether it is net (at station gate) or gross. Please indicate if there is more than 1 unit considered by power stationNumber of units Please specify number of units (reactors) if relevantAuxiliary load Own plant / unit consumptionCommissioning year Commissioning year or schedule in case of multiple plants / unitsCapital cost Assumed capital cost per installed capacityVariable O&M Variable operating and maintenance costFixed O&M Fixed operating and maintenance costThermal efficiency Plant efficiency or heat rate (sent-out HHV)Availability Average plant availability
Year 17 Year 18 Year 19 Year 20 Year 21 Year 22 Year 23 Year 24 Year 25 Year 26 Year 27 Year 28 Year 29 Year 30 Year 31 Year 32Jun-29 Jun-30 Jun-31 Jun-32 Jun-33 Jun-34 Jun-35 Jun-36 Jun-37 Jun-38 Jun-39 Jun-40 Jun-41 Jun-42 Jun-43 Jun-44
36.7 9.64 0 0 0 0 0 0 0 0 0 0 0 0 0 00 0 0 0 0 0 0 0 0 0 0 0 0 0 0 0
108.99 28.63 0 0 0 0 0 0 0 0 0 0 0 0 0 038.2 10.03 0 0 0 0 0 0 0 0 0 0 0 0 0 0
38.84 10.2 31.14 32.22 33.42 34.76 35.94 37.28 38.79 40.1 41.6 43.3 44.72 46.36 48.27 49.8347.87 12.57 0 0 0 0 0 0 0 0 0 0 0 0 0 0
316.74 83.19 4.17 4.32 4.48 4.66 4.82 4.99 5.2 5.37 5.57 5.8 5.99 6.21 6.47 6.68586.73 154.1 103.71 107.3 111.28 115.76 119.68 124.13 129.18 133.52 138.52 144.2 148.92 154.39 160.73 165.93587.64 154.34 62.23 64.38 66.77 69.46 71.81 74.48 77.51 80.11 83.11 86.52 89.35 92.63 96.44 99.56
0 0 0 0 0 0 0 0 0 0 0 0 0 0 0 041.64 10.94 0 0 0 0 0 0 0 0 0 0 0 0 0 0
0 0 0 0 0 0 0 0 0 0 0 0 0 0 0 00 0 0 0 0 0 0 0 0 0 0 0 0 0 0 0
0 0 144.15 135.6 138.97 155.18 146.01 149.69 167.17 157.27 161.2 179.98 169.24 173.38 193.53 181.930 0 507.09 517.88 536.21 562.99 574.96 595.43 625.21 638.51 661.28 694.28 708.83 733.8 770.27 786.35
3518.2 924.25 0 0 0 0 0 0 0 0 0 0 0 0 0 0

PWR - 1 x AP1000 UnitInputs sourced imports or import expenses
Accommodation and services A$mCivil construction A$mConstruction services A$mFinance A$mInsurance A$mMaterial Supplies A$mProfessional services A$mReactor A$mSpecialised Equipment A$mStaff costs A$mTransport A$mUtility charges A$mWaste and decom charges A$m
Surplus uranium mining industryProfits
TOTAL EXPENSES & PROFITSNuclear fuel A$mTOTAL OPEX A$mTOTAL CAPEX A$m
Number of persons employedWages paidType of plant
Plant / unit capacity Please state capacity, indicate whether it is net (at station gate) or gross. Please indicate if there is more than 1 unit considered by power stationNumber of units Please specify number of units (reactors) if relevantAuxiliary load Own plant / unit consumptionCommissioning year Commissioning year or schedule in case of multiple plants / unitsCapital cost Assumed capital cost per installed capacityVariable O&M Variable operating and maintenance costFixed O&M Fixed operating and maintenance costThermal efficiency Plant efficiency or heat rate (sent-out HHV)Availability Average plant availability
Year 33 Year 34 Year 35 Year 36 Year 37 Year 38 Year 39 Year 40 Year 41 Year 42 Year 43 Year 44 Year 45 Year 46 Year 47 Year 48Jun-45 Jun-46 Jun-47 Jun-48 Jun-49 Jun-50 Jun-51 Jun-52 Jun-53 Jun-54 Jun-55 Jun-56 Jun-57 Jun-58 Jun-59 Jun-60
0 0 0 0 0 0 0 0 0 0 0 0 0 0 0 00 0 0 0 0 0 0 0 0 0 0 0 0 0 0 00 0 0 0 0 0 0 0 0 0 0 0 0 0 0 00 0 0 0 0 0 0 0 0 0 0 0 0 0 0 0
51.69 53.88 55.65 57.74 60.21 62.17 64.48 67.21 69.34 71.91 74.98 77.33 80.19 83.64 86.23 89.420 0 0 0 0 0 0 0 0 0 0 0 0 0 0 0
6.93 7.22 7.46 7.74 8.07 8.33 8.64 9.01 9.29 9.63 10.05 10.36 10.74 11.21 11.55 11.98172.12 179.41 185.32 192.29 200.51 207.04 214.71 223.83 230.92 239.47 249.7 257.52 267.04 278.52 287.15 297.76103.27 107.64 111.19 115.38 120.31 124.22 128.83 134.3 138.55 143.68 149.82 154.51 160.23 167.11 172.29 178.66
0 0 0 0 0 0 0 0 0 0 0 0 0 0 0 00 0 0 0 0 0 0 0 0 0 0 0 0 0 0 00 0 0 0 0 0 0 0 0 0 0 0 0 0 0 00 0 0 0 0 0 0 0 0 0 0 0 0 0 0 0
186.48 208.25 195.92 200.81 224.27 210.98 216.25 241.51 227.2 232.88 260.08 244.67 250.79 280.08 263.49 270.07814.41 855.38 873.79 905.11 950.68 971.15 1005.76 1056.16 1078.7 1117.13 1173.13 1198.17 1240.86 1303.07 1330.87 1378.31
0 0 0 0 0 0 0 0 0 0 0 0 0 0 0 0

Year 1 Year 2 Year 3 Year 4 Year 5 Year 6 Year 7 Year 8 Year 9 Year 10 Year 11 Year 12 Year 13 Year 14 Year 15 Year 16SMR - 6 x NuScale Unit Jun-13 Jun-14 Jun-15 Jun-16 Jun-17 Jun-18 Jun-19 Jun-20 Jun-21 Jun-22 Jun-23 Jun-24 Jun-25 Jun-26 Jun-27 Jun-28Funding source
SA GovtCwth GovtIndustry - Private Investment (AUS)Industry - Foreign Investment
Sales - Domestic
Inputs sourced from South Asutralian businesses or operating expensesAccomodation and services A$m 0 0 0 0 0 0 0 0 0.68 1.39 2.13 4.37 5.97 25.83 55.61 25.74Civil construction A$m 0 0 0 0 0 0 0 0 4.58 9.4 14.45 29.61 40.47 96.21 207.16 95.87Construction services A$m 0 0 0 0 0 0 0 0 1.83 3.76 5.78 11.84 16.19 57.27 123.32 57.07Finance A$m 0 0 0 0 0 0 0 0 0.19 0.38 0.59 1.21 1.65 0.83 1.78 0.82Insurance A$m 0 0 0 0 0 0 0 0 0.12 0.25 0.38 0.79 1.07 1.78 3.82 1.77Material Supplies A$m 0 0 0 0 0 0 0 0 2.34 4.79 7.37 15.11 20.65 77.35 166.55 77.08Professional services A$m 0 0 0 0 0 0 0 0 5.94 12.18 18.72 38.37 52.44 8.21 17.68 8.18Reactor A$m 0 0 0 0 0 0 0 0 0 0 0 0 0 4.66 10.03 4.64Specialised Equipment A$m 0 0 0 0 0 0 0 0 0 0 0 0 0 43.67 94.03 43.51Staff costs A$m 0 0 0 0 0 0 0 0 0 0 0 0 0 0 0 0Transport A$m 0 0 0 0 0 0 0 0 0.8 1.64 2.53 5.18 7.08 8.71 18.75 8.68Utility charges A$m 0 0 0 0 0 0 0 0 0 0 0 0 0 0 0 0Waste and decom charges A$m 0 0 0 0 0 0 0 0 0 0 0 0 0 0 0 0
Inputs sourced from Other States businessesAccomodation and services A$m 0 0 0 0 0 0 0 0 0.29 0.59 0.91 1.87 2.56 6.41 13.8 6.39Civil construction A$m 0 0 0 0 0 0 0 0 1.96 4.03 6.19 12.69 17.34 39.05 84.08 38.91Construction services A$m 0 0 0 0 0 0 0 0 0.79 1.61 2.48 5.08 6.94 24.19 52.08 24.1Finance A$m 0 0 0 0 0 0 0 0 0.19 0.38 0.59 1.21 1.65 0.75 1.62 0.75Insurance A$m 0 0 0 0 0 0 0 0 0.12 0.25 0.38 0.79 1.07 1.7 3.67 1.7Material Supplies A$m 0 0 0 0 0 0 0 0 0 0 0 0 0 27.18 58.52 27.08Professional services A$m 0 0 0 0 0 0 0 0 2.02 4.14 6.36 13.05 17.83 3.85 8.29 3.83Reactor A$m 0 0 0 0 0 0 0 0 0 0 0 0 0 4.24 9.14 4.23Specialised Equipment A$m 0 0 0 0 0 0 0 0 0 0 0 0 0 39.8 85.69 39.66Staff costs A$m 0 0 0 0 0 0 0 0 0 0 0 0 0 0 0 0Transport A$m 0 0 0 0 0 0 0 0 0.34 0.7 1.08 2.22 3.03 5.63 12.12 5.61Utility charges A$m 0 0 0 0 0 0 0 0 0 0 0 0 0 0 0 0Waste and decom charges A$m 0 0 0 0 0 0 0 0 0 0 0 0 0 0 0 0

SMR - 6 x NuScale UnitFunding source
SA GovtCwth GovtIndustry - Private Investment (AUS)Industry - Foreign Investment
Sales - Domestic
Inputs sourced from South Asutralian businesses or operating expensesAccomodation and services A$mCivil construction A$mConstruction services A$mFinance A$mInsurance A$mMaterial Supplies A$mProfessional services A$mReactor A$mSpecialised Equipment A$mStaff costs A$mTransport A$mUtility charges A$mWaste and decom charges A$m
Inputs sourced from Other States businessesAccomodation and services A$mCivil construction A$mConstruction services A$mFinance A$mInsurance A$mMaterial Supplies A$mProfessional services A$mReactor A$mSpecialised Equipment A$mStaff costs A$mTransport A$mUtility charges A$mWaste and decom charges A$m
Year 17 Year 18 Year 19 Year 20 Year 21 Year 22 Year 23 Year 24 Year 25 Year 26 Year 27 Year 28 Year 29 Year 30 Year 31 Year 32Jun-29 Jun-30 Jun-31 Jun-32 Jun-33 Jun-34 Jun-35 Jun-36 Jun-37 Jun-38 Jun-39 Jun-40 Jun-41 Jun-42 Jun-43 Jun-44
0 0 0 0 0 0 0 0 0 0 0 0 0 0 0 00 0 0 0 0 0 0 0 0 0 0 0 0 0 0 00 0 0 0 0 0 0 0 0 0 0 0 0 0 0 00 0 0 0 0 0 0 0 0 0 0 0 0 0 0 0
2.29 2.37 2.46 2.55 2.65 2.75 2.86 2.96 3.08 3.19 3.31 3.44 3.56 3.7 3.84 3.982.46 2.55 2.65 2.75 2.85 2.96 3.07 3.19 3.31 3.44 3.57 3.7 3.84 3.98 4.13 4.284.59 4.77 4.95 5.13 5.33 5.53 5.74 5.96 6.18 6.41 6.65 6.9 7.16 7.43 7.71 7.99
0 0 0 0 0 0 0 0 0 0 0 0 0 0 0 04.57 4.74 4.92 5.1 5.3 5.5 5.7 5.92 6.14 6.38 6.62 6.86 7.12 7.39 7.66 7.95
17.94 18.62 19.33 20.06 20.81 21.6 22.42 23.27 24.15 25.06 26 26.98 27.99 29.03 30.11 31.230 0 0 0 0 0 0 0 0 0 0 0 0 0 0 0
9.43 9.79 10.16 10.55 10.94 11.36 11.79 12.23 12.7 13.17 13.67 14.18 14.71 15.26 15.83 16.4213.27 13.62 13.98 14.35 14.73 15.12 15.52 15.94 16.36 16.8 17.25 17.7 18.17 18.64 19.13 19.63
0 0 0 0 0 0 0 0 0 0 0 0 0 0 0 00 0 0 0 0 0 0 0 0 0 0 0 0 0 0 00 0 0 0 0 0 0 0 0 0 0 0 0 0 0 00 0 0 0 0 0 0 0 0 0 0 0 0 0 0 0
2.29 2.37 2.46 2.55 2.65 2.75 2.86 2.96 3.08 3.19 3.31 3.44 3.56 3.7 3.84 3.980.62 0.64 0.66 0.69 0.71 0.74 0.77 0.8 0.83 0.86 0.89 0.92 0.96 1 1.03 1.073.67 3.81 3.96 4.11 4.26 4.42 4.59 4.76 4.94 5.13 5.32 5.52 5.73 5.94 6.17 6.4
0 0 0 0 0 0 0 0 0 0 0 0 0 0 0 04.57 4.74 4.92 5.1 5.3 5.5 5.7 5.92 6.14 6.38 6.62 6.86 7.12 7.39 7.66 7.95
0 0 0 0 0 0 0 0 0 0 0 0 0 0 0 00 0 0 0 0 0 0 0 0 0 0 0 0 0 0 00 0 0 0 0 0 0 0 0 0 0 0 0 0 0 0
11.7 11.99 12.29 12.6 12.91 13.23 13.56 13.91 14.25 14.61 14.98 15.35 15.72 16.11 16.51 16.91

SMR - 6 x NuScale UnitFunding source
SA GovtCwth GovtIndustry - Private Investment (AUS)Industry - Foreign Investment
Sales - Domestic
Inputs sourced from South Asutralian businesses or operating expensesAccomodation and services A$mCivil construction A$mConstruction services A$mFinance A$mInsurance A$mMaterial Supplies A$mProfessional services A$mReactor A$mSpecialised Equipment A$mStaff costs A$mTransport A$mUtility charges A$mWaste and decom charges A$m
Inputs sourced from Other States businessesAccomodation and services A$mCivil construction A$mConstruction services A$mFinance A$mInsurance A$mMaterial Supplies A$mProfessional services A$mReactor A$mSpecialised Equipment A$mStaff costs A$mTransport A$mUtility charges A$mWaste and decom charges A$m
Year 33 Year 34 Year 35 Year 36 Year 37 Year 38 Year 39 Year 40 Year 41 Year 42 Year 43 Year 44 Year 45 Year 46 Year 47 Year 48Jun-45 Jun-46 Jun-47 Jun-48 Jun-49 Jun-50 Jun-51 Jun-52 Jun-53 Jun-54 Jun-55 Jun-56 Jun-57 Jun-58 Jun-59 Jun-60
0 0 0 0 0 0 0 0 0 0 0 0 0 0 0 00 0 0 0 0 0 0 0 0 0 0 0 0 0 0 00 0 0 0 0 0 0 0 0 0 0 0 0 0 0 00 0 0 0 0 0 0 0 0 0 0 0 0 0 0 0
4.13 4.28 4.44 4.61 4.78 4.96 5.15 5.34 5.54 5.75 5.96 6.18 6.41 6.65 6.9 7.164.44 4.61 4.78 4.96 5.15 5.34 5.54 5.75 5.96 6.19 6.42 6.66 6.91 7.16 7.43 7.718.29 8.61 8.93 9.26 9.61 9.97 10.34 10.73 11.13 11.55 11.98 12.43 12.89 13.37 13.87 14.39
0 0 0 0 0 0 0 0 0 0 0 0 0 0 0 08.25 8.56 8.88 9.21 9.55 9.91 10.28 10.67 11.07 11.48 11.91 12.35 12.81 13.29 13.79 14.3
32.41 33.62 34.88 36.19 37.55 38.95 40.41 41.92 43.49 45.12 46.8 48.55 50.36 52.24 54.18 56.20 0 0 0 0 0 0 0 0 0 0 0 0 0 0 0
17.04 17.68 18.34 19.03 19.74 20.48 21.25 22.04 22.87 23.72 24.61 25.53 26.48 27.47 28.49 29.5520.16 20.7 21.25 21.82 22.41 23.01 23.63 24.26 24.91 25.58 26.27 26.98 27.7 28.45 29.22 30.01
0 0 0 0 0 0 0 0 0 0 0 0 0 0 0 00 0 0 0 0 0 0 0 0 0 0 0 0 0 0 00 0 0 0 0 0 0 0 0 0 0 0 0 0 0 00 0 0 0 0 0 0 0 0 0 0 0 0 0 0 0
4.13 4.28 4.44 4.61 4.78 4.96 5.15 5.34 5.54 5.75 5.96 6.18 6.41 6.65 6.9 7.161.11 1.15 1.2 1.24 1.29 1.34 1.39 1.44 1.49 1.55 1.6 1.66 1.73 1.79 1.86 1.936.64 6.88 7.14 7.41 7.69 7.98 8.27 8.58 8.91 9.24 9.58 9.94 10.31 10.7 11.09 11.51
0 0 0 0 0 0 0 0 0 0 0 0 0 0 0 08.25 8.56 8.88 9.21 9.55 9.91 10.28 10.67 11.07 11.48 11.91 12.35 12.81 13.29 13.79 14.3
0 0 0 0 0 0 0 0 0 0 0 0 0 0 0 00 0 0 0 0 0 0 0 0 0 0 0 0 0 0 00 0 0 0 0 0 0 0 0 0 0 0 0 0 0 0
17.33 17.76 18.21 18.66 19.13 19.61 20.1 20.6 21.12 21.64 22.18 22.74 23.31 23.89 24.49 25.1

Year 1 Year 2 Year 3 Year 4 Year 5 Year 6 Year 7 Year 8 Year 9 Year 10 Year 11 Year 12 Year 13 Year 14 Year 15 Year 16SMR - 6 x NuScale Unit Jun-13 Jun-14 Jun-15 Jun-16 Jun-17 Jun-18 Jun-19 Jun-20 Jun-21 Jun-22 Jun-23 Jun-24 Jun-25 Jun-26 Jun-27 Jun-28Inputs sourced imports or import expenses
Accomodation and services A$m 0 0 0 0 0 0 0 0 0.2 0.41 0.63 1.31 1.78 7.2 15.48 7.15Civil construction A$m 0 0 0 0 0 0 0 0 0 0 0 0 0 0 0 0Construction services A$m 0 0 0 0 0 0 0 0 0.54 1.11 1.72 3.54 4.83 13.76 29.59 13.67Finance A$m 0 0 0 0 0 0 0 0 0.46 0.95 1.47 3.04 4.14 6.56 14.11 6.52Insurance A$m 0 0 0 0 0 0 0 0 0.3 0.62 0.96 1.97 2.69 7.04 15.13 6.99Material Supplies A$m 0 0 0 0 0 0 0 0 0 0 0 0 0 6.29 13.52 6.25Professional services A$m 0 0 0 0 0 0 0 0 3.22 6.64 10.3 21.21 28.93 81.33 174.88 80.83Reactor A$m 0 0 0 0 0 0 0 0 0 0 0 0 0 175.56 377.49 174.47Specialised Equipment A$m 0 0 0 0 0 0 0 0 0 0 0 0 0 176.17 378.82 175.09Staff costs A$m 0 0 0 0 0 0 0 0 0 0 0 0 0 0 0 0Transport A$m 0 0 0 0 0 0 0 0 0.1 0.22 0.33 0.69 0.94 11.58 24.89 11.51Utility charges A$m 0 0 0 0 0 0 0 0 0 0 0 0 0 0 0 0Waste and decom charges A$m 0 0 0 0 0 0 0 0 0 0 0 0 0 0 0 0
Surplus uramium mining industryProfits
TOTAL EXPENSES & PROFITSNuclear fuel A$m 0 0 0 0 0 0 0 0 0 0 0 0 0 0 0 0TOTAL OPEX A$m 0 0 0 0 0 0 0 0 0 0 0 0 0 0 0 0TOTAL CAPEX A$m 0 0 0 0 0 0 0 0 27.02 55.43 85.36 175.14 239.24 962.78 2071.64 958.1
Number of persons employedWages paidType of plant
Plant / unit capacity MW 285 / 47.5Number of units no 6Auxiliary load MW 0Commissioning year Year 2028Capital cost $/kW 8,577.92Variable O&M $/MWh 0Fixed O&M $/MW/year 194,621Thermal efficiency %, GJ/MWh N/AAvailability % 93.00%
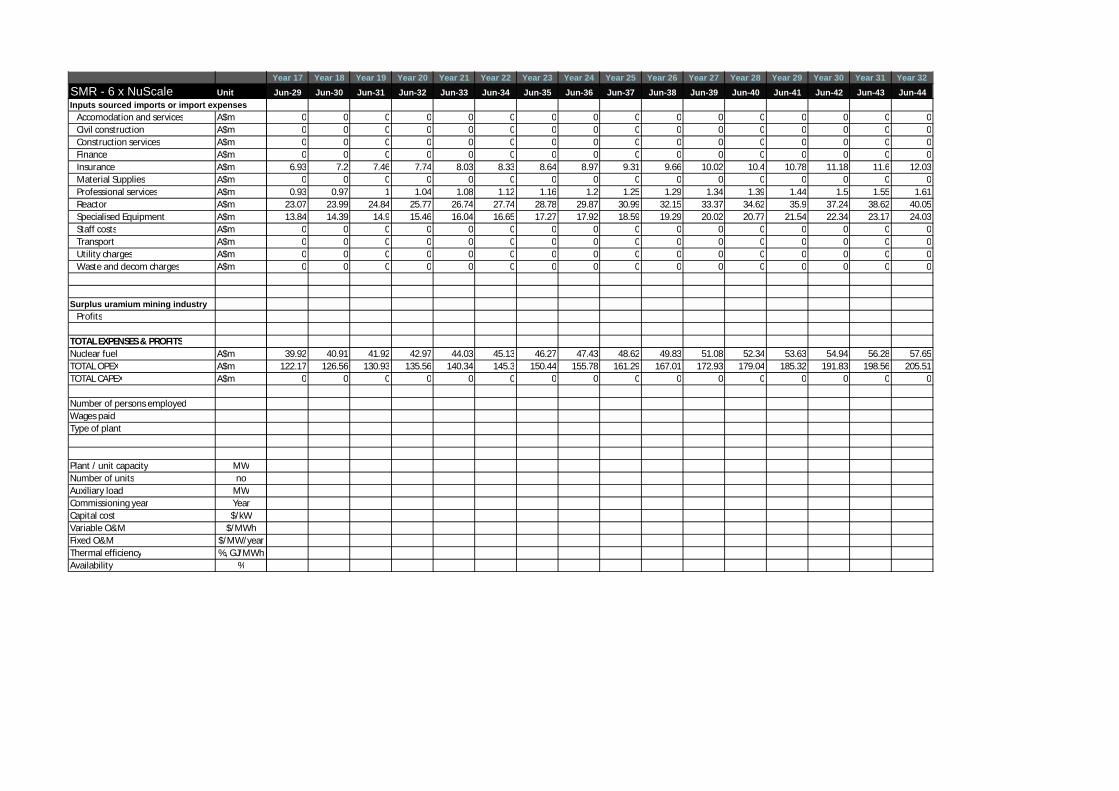
SMR - 6 x NuScale UnitInputs sourced imports or import expenses
Accomodation and services A$mCivil construction A$mConstruction services A$mFinance A$mInsurance A$mMaterial Supplies A$mProfessional services A$mReactor A$mSpecialised Equipment A$mStaff costs A$mTransport A$mUtility charges A$mWaste and decom charges A$m
Surplus uramium mining industryProfits
TOTAL EXPENSES & PROFITSNuclear fuel A$mTOTAL OPEX A$mTOTAL CAPEX A$m
Number of persons employedWages paidType of plant
Plant / unit capacity MWNumber of units noAuxiliary load MWCommissioning year YearCapital cost $/kWVariable O&M $/MWhFixed O&M $/MW/yearThermal efficiency %, GJ/MWhAvailability %
Year 17 Year 18 Year 19 Year 20 Year 21 Year 22 Year 23 Year 24 Year 25 Year 26 Year 27 Year 28 Year 29 Year 30 Year 31 Year 32Jun-29 Jun-30 Jun-31 Jun-32 Jun-33 Jun-34 Jun-35 Jun-36 Jun-37 Jun-38 Jun-39 Jun-40 Jun-41 Jun-42 Jun-43 Jun-44
0 0 0 0 0 0 0 0 0 0 0 0 0 0 0 00 0 0 0 0 0 0 0 0 0 0 0 0 0 0 00 0 0 0 0 0 0 0 0 0 0 0 0 0 0 00 0 0 0 0 0 0 0 0 0 0 0 0 0 0 0
6.93 7.2 7.46 7.74 8.03 8.33 8.64 8.97 9.31 9.66 10.02 10.4 10.78 11.18 11.6 12.030 0 0 0 0 0 0 0 0 0 0 0 0 0 0 0
0.93 0.97 1 1.04 1.08 1.12 1.16 1.2 1.25 1.29 1.34 1.39 1.44 1.5 1.55 1.6123.07 23.99 24.84 25.77 26.74 27.74 28.78 29.87 30.99 32.15 33.37 34.62 35.9 37.24 38.62 40.0513.84 14.39 14.9 15.46 16.04 16.65 17.27 17.92 18.59 19.29 20.02 20.77 21.54 22.34 23.17 24.03
0 0 0 0 0 0 0 0 0 0 0 0 0 0 0 00 0 0 0 0 0 0 0 0 0 0 0 0 0 0 00 0 0 0 0 0 0 0 0 0 0 0 0 0 0 00 0 0 0 0 0 0 0 0 0 0 0 0 0 0 0
39.92 40.91 41.92 42.97 44.03 45.13 46.27 47.43 48.62 49.83 51.08 52.34 53.63 54.94 56.28 57.65122.17 126.56 130.93 135.56 140.34 145.3 150.44 155.78 161.29 167.01 172.93 179.04 185.32 191.83 198.56 205.51
0 0 0 0 0 0 0 0 0 0 0 0 0 0 0 0

SMR - 6 x NuScale UnitInputs sourced imports or import expenses
Accomodation and services A$mCivil construction A$mConstruction services A$mFinance A$mInsurance A$mMaterial Supplies A$mProfessional services A$mReactor A$mSpecialised Equipment A$mStaff costs A$mTransport A$mUtility charges A$mWaste and decom charges A$m
Surplus uramium mining industryProfits
TOTAL EXPENSES & PROFITSNuclear fuel A$mTOTAL OPEX A$mTOTAL CAPEX A$m
Number of persons employedWages paidType of plant
Plant / unit capacity MWNumber of units noAuxiliary load MWCommissioning year YearCapital cost $/kWVariable O&M $/MWhFixed O&M $/MW/yearThermal efficiency %, GJ/MWhAvailability %
Year 33 Year 34 Year 35 Year 36 Year 37 Year 38 Year 39 Year 40 Year 41 Year 42 Year 43 Year 44 Year 45 Year 46 Year 47 Year 48Jun-45 Jun-46 Jun-47 Jun-48 Jun-49 Jun-50 Jun-51 Jun-52 Jun-53 Jun-54 Jun-55 Jun-56 Jun-57 Jun-58 Jun-59 Jun-60
0 0 0 0 0 0 0 0 0 0 0 0 0 0 0 00 0 0 0 0 0 0 0 0 0 0 0 0 0 0 00 0 0 0 0 0 0 0 0 0 0 0 0 0 0 00 0 0 0 0 0 0 0 0 0 0 0 0 0 0 0
12.48 12.95 13.45 13.96 14.49 15.04 15.6 16.18 16.79 17.42 18.07 18.74 19.44 20.17 20.92 21.70 0 0 0 0 0 0 0 0 0 0 0 0 0 0 0
1.67 1.74 1.8 1.87 1.94 2.01 2.09 2.17 2.25 2.33 2.42 2.51 2.6 2.7 2.8 2.9141.56 43.14 44.78 46.48 48.25 50.08 51.95 53.89 55.91 58 60.16 62.41 64.74 67.15 69.65 72.2524.94 25.88 26.87 27.89 28.95 30.05 31.17 32.34 33.55 34.8 36.1 37.45 38.84 40.29 41.79 43.35
0 0 0 0 0 0 0 0 0 0 0 0 0 0 0 00 0 0 0 0 0 0 0 0 0 0 0 0 0 0 00 0 0 0 0 0 0 0 0 0 0 0 0 0 0 00 0 0 0 0 0 0 0 0 0 0 0 0 0 0 0
59.09 60.57 62.08 63.63 65.22 66.85 68.52 70.24 71.99 73.79 75.64 77.53 79.47 81.45 83.49 85.58212.82 220.4 228.27 236.42 244.87 253.6 262.61 271.92 281.59 291.59 301.93 312.66 323.76 335.27 347.18 359.51
0 0 0 0 0 0 0 0 0 0 0 0 0 0 0 0


