22
Part 1 What happened to world food prices and why? The State of Agricultural Commodity Markets 2009 8

Part 1 What happened to world food prices and why?
The State of Agricultural Commodity Markets 2009 8

The State of Agricultural Commodity Markets 2009 9
World food price inflation in 2007–08
T he upturn in international food prices that began in 2006 escalated into a surge of food price inflation around
the world, increasing food insecurity, leading to violent protests and even raising fears about international security. Africa was perhaps hardest hit, but the problem was global. Reports of the impact of high food prices on the poor across many developing countries led to calls for international action to reverse the slide towards increased poverty and malnutrition. Food aid agencies such as the World Food Programme (WFP) encountered difficulties in meeting the higher costs of purchasing food for distribution and appealed for additional funds.
The FAO food price index1 rose by 7 percent in 2006 and 27 percent in 2007, and that increase persisted and accelerated in the first half of 2008. Since then, prices have fallen steadily but remain above their longer-term trend levels. For 2008, the FAO food price index still averaged 24 percent above 2007 and 57 percent above 2006.
Looking at prices in real terms (deflated by the World Bank’s Manufactures Unit Value Index [MUV]), the increases are still significant. Real prices have shown a steady long-run downward trend punctuated by typically short-lived price spikes. There is some suggestion of a flattening out since the late 1980s with a gradual recovery beginning in 2000 before the sharp increase in 2006 – the average annual growth rate of 1.3 percent for the period 2000–05 has jumped to 15 percent since 2006.
What difference do exchange rates make?
A proportion of these price increases can be attributed to the depreciation of the
1 The FAO food price index is a trade weighted
Laspeyres index of international quotations
expressed in US dollar prices for 55 food commodities
(see www.fao.org/worldfoodsituation/
FoodPricesIndex).
Evolution of FAO food price indices
Index (1998–2000 = 100)
0
50
100
150
200
250
200820052000Source: FAO.
19951990198519801975197019651961
FAO extended food price index
FAO extended real food price index
FAO food price index adjusted for changes in exchange rates
Index (1998–2000 = 100)
0
50
100
150
200
250
200820052000
Sources: FAO and IMF.
Note: the Special Drawing Right (SDR) is a basket of major currencies (euro, sterling, yen and the US dollar) defined by the International Monetary Fund (IMF); the CFA franc is the currency used in 14 African economies and whose value is tied to the euro.
19951990198519801975197019651961FAO food price indexFAO food price index adjusted for changes in US$–SDR exchange ratesFAO food price index adjusted for changes in US$–CFA franc exchange rates
US dollar, in which international prices tend to be denominated. Expressed in other currencies, the increases are less dramatic and within the range of historical variation, but they are still substantial.
The relationship between the currency and commodity prices is a complicating factor in assessing agricultural commodity price increases. It also has implications for how different countries
are affected by the changes. The extent to which international price increases translated to domestic consumer and producer price increases in different countries depended on their US dollar exchange rate as well as a variety of other factors, such as import tariffs, infrastructure and market structures, that determine the degree of price transmission. Because most commodity

Wha
t hap
pene
d to
wor
ld fo
od p
rices
and
why
?
The State of Agricultural Commodity Markets 2009 10
prices are commonly expressed in US dollars, depreciation in the value of the US dollar reduces the cost of commodities for countries whose currencies are stronger than the US dollar, resulting in a cushioning of food price increases to a greater or lesser extent. However, for countries whose local currencies are pegged to or are weaker than the US dollar, depreciation in the US dollar increases the cost of procuring food. More than 30 developing countries peg their currency to the US dollar.
Did the prices of all agricultural commodities increase in the same way?
While almost all agricultural product prices increased at least in nominal terms, the rate of increase varied significantly
from one commodity to another. In particular, international prices of basic foods, such as cereals, oilseeds and dairy products, increased far more dramatically than the prices of tropical products, such as coffee and cocoa, and raw materials, such as cotton or rubber. Therefore, developing countries dependent on exports of these latter products found that while their export earnings might have been increasing this was at a slower rate than the cost of their food imports. As many developing countries are net food importers, this imposed a serious balance of payments problem.
What was different about the 2007–08 food price increases?
The leap in food prices was in sharp contrast to the secular downward trend
Evolution of monthly FAO price indices for basic food commodity groups
Index (2002–04 = 100)
Source: FAO.
50
100
150
200
250
300
2008200620042002200019981996199419921990
SugarMeat
Cereals OilsDairy
Evolution of prices for tropical export crops
Price
Source: FAO.Note: Rice and wheat prices in US$/tonne; cocoa and coffee prices in US cents/pound.
Rice CoffeeWheat Cocoa
0
200
400
600
800
2008200620042002200019981996199419921990

The State of Agricultural Commodity Markets 2009 11
and the prolonged slump in commodity prices from 1995 to 2002, which even prompted calls for the revival of international commodity agreements. For some analysts, the increases signalled the end of the long-term decline in real agricultural commodity prices, with The Economist (2007) announcing “the end of cheap food”. Others saw the beginnings of a potential world food crisis. It is an interesting question whether these sharp increases are fundamentally different from earlier price spikes and whether the long-term decline in real prices could have come to a halt, signalling a fundamental change in agricultural commodity market behaviour. High-price events, like low-price events, are not rare occurrences in agricultural markets, although high prices often tend to be short-lived compared with low prices, which persist for longer periods. What has distinguished this episode was the concurrence of the hike in world prices of not just a few but of nearly all major food and feed commodities and the possibility that the prices may remain high after the effects of short-term shocks dissipate.
The price boom was also accompanied by much higher price volatility2 than in the past, especially in the cereals and oilseeds sectors, highlighting the greater uncertainty in the markets. In the first four months of 2008, volatility in wheat and rice prices approached record highs (volatility in wheat prices was twice the level of the previous year while rice price volatility was five times higher). The increase in volatility was not confined to cereals – vegetable oils, livestock products and sugar all witnessed much larger price swings than in the recent past. High volatility means uncertainty, which complicates decision-making for buyers
and sellers. Greater uncertainty limits opportunities for producers to access credit markets and tends to result in the adoption of low-risk production technologies at the expense of innovation and entrepreneurship. In addition, the wider and more unpredictable the price changes in a commodity are, the greater is the possibility of realizing large gains by speculating on future price movements of that commodity. Thus, volatility can attract significant speculative activity, which in turn can initiate a vicious cycle of destabilizing cash prices. At the national level, many developing countries are still highly dependent on primary commodities, either in their exports or imports. While sharp price spikes can be a temporary boon to an exporter’s
economy, they can also heighten the cost of importing foodstuffs and agricultural inputs. At the same time, large fluctuations in prices can have a destabilizing effect on real exchange rates of countries, putting a severe strain on their economy and hampering their efforts to reduce poverty.
How does the 2007–08 high-price episode compare with past crises?
A look at past price behaviour can indicate how different the recent high food price episode was. As can be seen from the graphs (see page 9), one price peak in particular stands out – the so-called world food crisis of the 1970s. There are some similarities with that situation. Weather
2 Volatility measures how much the price of a
commodity fluctuates over a given time frame using
the standard deviation of prices. Wide price
fluctuations over a short period constitute “high
volatility”.
The world food crisis of the 1970s
In the two decades prior to the crisis of the
1970s, cereal output in developing countries
rose by 80 percent. The “green revolution”
led to large gains in productivity and
harvested land areas expanded. However, in
1972, bad weather hit crops across the globe
and world food production dropped for the
first time in 20 years, down 33 million tonnes
at a time when the world needed an extra
24 million tonnes to meet the needs of a
rapidly rising population. In the following
year, a new supply shock played its part in
fuelling higher agricultural prices – oil prices
quadrupled. This posed a real threat to the
green revolution, whose success was heavily
dependent on pesticides, herbicides and
nitrogen-based fertilizer applications, all of
which are derived from petroleum. After
paying for their oil import bills, many
developing countries had little left to buy the
chemicals and nutrients that their high-yield,
intensive farming required. In 1974, the world
anxiously awaited much-needed abundant
harvests in richer nations in order to
replenish stocks and diffuse the growing
price crisis. However, Canada, the former
Soviet Union, the United States of America
and much of Asia gathered poor crops in that
year as a result of bad weather. At the end of
that year, world cereal reserves had reached
a 22-year low, equal to sufficient supplies for
about 26 days, compared with 95 days in
1961. To make matters worse, the United
States Government banned the exportation
of 10 million tonnes of grain (mostly to the
former Soviet Union), fearing that such a
massive sale would compound domestic
food price inflation. After peaking in 1974,
prices of most foodstuffs remained
consistently high up until the early 1980s.
Official estimates of the number of deaths as
a direct result of the world food crisis of the
1970s have not been made but, using
deviations from trend mortality rates during
the crisis period, unofficial estimates put the
figure somewhere around 5 million people
(The Oil Drum, 2009).
Sources: FAO; and Time, 1974.

Wha
t hap
pene
d to
wor
ld fo
od p
rices
and
why
?
The State of Agricultural Commodity Markets 2009 12
and crude oil price shocks resulted in contractions in food production in the wake of rising food demand brought about by rapid population growth in developing countries. Even export restrictions featured, in the same vein as this time, as measures to contain domestic inflation. However, one big difference is that while the 1970s crisis was caused by supply-side shocks, demand factors (notably biofuel demand) were key to the 2007–08 episode and may have longer-lasting effects.
At the peak of the 1970s crisis, international quotations of rice and wheat rose to US$542 and US$180 per tonne, respectively. It would be tempting to conclude that, as prices in early 2008 far exceeded those witnessed in the 1970s, the world was facing a similar crisis. However, the purchasing power of the
US dollar today is fundamentally different from what it was in the 1970s. Looking at prices in real terms, a drastically different picture is revealed. At 2000 prices and exchange rates, for example, the cost of one tonne of rice in 1974 stood at well over four times the average over the first four months of 2008.
The end of “cheap food”?
Soaring food prices came as a shock partly because consumers throughout the world had become accustomed to the notion of so-called “cheap food”. Up until 2006, the real cost of the global food basket had fallen by almost one-half in the previous 30 years, with prices of many foodstuffs falling on average by 2–3 percent per year in real terms. Technological advances greatly reduced the cost of producing foodstuffs and this, together with widespread subsidies in countries of the Organisation for Economic Co-operation and Development (OECD) that rendered more efficient and cheaper production elsewhere unprofitable, entrenched the role of a few countries in supplying the world with food. This supply-driven agricultural paradigm sent real prices spiralling downward on a trend lasting for decades. Added to this, changes in the market and policy setting have been instrumental in reducing stock levels and have led to far more planned dependence on imports to meet food needs. Put together, these developments have resulted in a significant role for major exporting countries to supply international markets as needed. Therefore, it is not surprising that when production shortages occur in such countries, particularly in consecutive years, global supplies are stretched and the ensuing market tightness is manifest in both higher prices and higher volatility. This was precisely the case in the run-up to the recent price surge. Against this backdrop, the world’s growing demand for agricultural commodities, driven by rising global incomes and population and then expansion in biofuel production, left major exporters with little opportunity to replenish stocks.
Extreme price volatility for several commodities was another factor prompting fears of a wide-scale crisis. In a period of rising and protracted price
Agricultural commodity price spikes
A price spike is a pronounced sharp
increase in price above the trend value. For
practical purposes, a price spike can be
identified as an annual percentage change
that is more than two standard deviations
of the price in the five years preceding the
year that the percentage change is
calculated from. Using this definition, it is
possible to identify the years in which high-
price events for basic food commodities
(using the FAO food price index) occurred
during the 1961–2008 period. Checking
each year’s percentage change against
twice the standard deviation calculated as:
four distinct periods can be identified
where prices exhibited significant
increases: 1972–74, 1988, 1995 and the
current period. The only price events in
consecutive years are those that occurred
in the first and the last periods: three years
in a row in the first (1972, 1973 and 1974);
and two years in the last (2007 and 2008).
However, when the same methodology is
applied to the prices expressed in real
terms, only four years appear to have been
significant price event years: 1973, 1974,
2007 and 2008.

The State of Agricultural Commodity Markets 2009 13
Annual food prices, in nominal and real US$ terms, 1957–2008
Note: Real prices refer to nominal prices adjusted for changes in US Producer Price Index (2000 = 100).
Sources: Cocoa (ICCO); coffee (ICO); cotton (COTLOOK A Index 1–3/32”); maize (US No. 2, yellow, US Gulf); rice (white rice, Thai 100% B second grade, f.o.b. Bangkok); soybeans (US No. 1, yellow, US Gulf); sugar (ISA); tea (total tea, Mombasa auction prices); Wheat (US No. 2, soft red winter wheat, US Gulf); beef (Argentina, frozen beef cuts, export unit value); butter (Oceania, indicative export prices, f.o.b.); pig meat (USA, pork, frozen product, export unit value); poultry meat (USA, broiler cuts, export unit value); rape oil (Dutch, f.o.b. ex-mill); Soya oil (f.o.b. ex-mill).
Wheat Maize Rice Soybeans
US$
Bulk commodities NOMINAL PRICES
US$
US$
200
400
600
0800908070570
500
1 000
1 500
080090807057
US$
Soybean oil Palm oil Rapeseed oil
Vegetable oils
US$
0
500
1 000
1 500
0800908070570
500
1 000
1 500
2 000
2 500
080090807057
US$
Livestock commodities
Poultry Pig meat Beef Butter
US$
0
50
100
150
200
0
100
200
300
US$
080090807057 080090807057
Sugar and beverages
REAL PRICES
Cocoa Coffee Tea Sugar
0
200
400
600
800
0800908070570
500
1 000
1 500
2 000
080090807057
0

Wha
t hap
pene
d to
wor
ld fo
od p
rices
and
why
?
The State of Agricultural Commodity Markets 2009 14
volatility, it is quite difficult to distinguish between market instability and fundamentally higher price levels. Again, uncertainty as to just what was happening on international food markets added to fears of an impending crisis.
Does the recent high-price episode reflect a reversal in the trend of falling real prices or is it the case that the world was experiencing yet another spike, albeit a rather large one? Periods of excessive market turbulence do not necessarily result in a fundamental, permanent shift in the trajectory of prices. When they do so, economists describe the event as a “structural break”. Econometric techniques can be used to detect these structural breaks in agricultural commodity prices. Applying these techniques, even the price peaks for many foodstuffs in the crisis of the 1970s did not manifest themselves as structural breaks. After the worst of the crisis passed, prices simply resumed their preceding trend.
It is difficult to draw any firm conclusions regarding the recent price spike from the evidence to date, and econometric tests have so far failed to detect a structural break. Therefore, in order to answer the question as to whether the recent high-price episode is consistent with past commodity price behaviour of sharp but short-lived peaks and prolonged slumps or represents a break with past behaviour patterns, it is necessary to explore the nature of the apparent causes. Many different factors have been cited as responsible: production shortfalls, low stock levels, oil prices, biofuel demand,
growing incomes in emerging economies, depreciation of the US dollar and speculation. While it is difficult to determine their individual contributions quantitatively, some of these factors could have a persistent effect on the average level of prices. There are some features of the current situation, notably the historically low stock levels for cereals and strong demand for biofuels, that suggest that, in spite of the downward adjustments from the peak of early 2008, the recent high prices may well not be short-lived but could persist for some years.
After the rise, the fall – food prices now
Prices for most agricultural commodities have fallen significantly from the peaks reached in the first half of 2008. World grain prices have fallen by 50 percent and prices for other basic foods have followed. However, prices remain high by historical standards and are still above their 2007 levels. At the national level in many countries, but especially in Africa, prices remain substantially above 2007 levels. In some cases, the peaks in international prices reached in the first half of 2008 are still working their way through national markets.
FAO food price indices
Index (2002–04 = 100)
Source: FAO.
110
140
170
200
230
2008
2007
20062005
DNOSAJJMAMFJ
Food commodity price indices, 2007–2008
Index (2002–04 = 100)
Source: FAO.
100
150
200
250
300
350
DNOSAJJMAMFJD
DairyOils and fats
Cereals
Sugar
Meat

The State of Agricultural Commodity Markets 2009 15
A nalysts and commentators have emphasized different explanations for the leap in food
prices. The most popular is increased demand for certain agricultural products as feedstocks for biofuel production, particularly maize for ethanol. Record oil prices and environmental concerns strengthened interest in alternative energy
sources and policy measures in the United States of America, and the European Union (EU) encouraged the expansion of biofuel production. High oil prices also had a direct impact on the costs of agricultural production and prices. A third popular explanation is rapid economic growth in certain emerging economies, notably China and India, increasing
demand for food, especially for livestock products, which generated increased cereal and oilseed demand for feed. These explanations focus on “new” drivers in international agricultural commodity markets and suggest the possibility of a fundamental change in the behaviour of agricultural commodity prices and continuing high prices. “Traditional” explanations (see box on page 16) of high prices are also relevant – supply reductions as a result of drought in major exporters and the lowest cereal stock levels for more than 30 years. Various other complicating factors have also been cited as at least partial explanations of the high food prices. These include an inflow of speculative funds into agricultural commodity futures markets as the global financial downturn weakened more usual bond and equity markets. Once world prices began to rise significantly, the market and policy responses this provoked added to the inflationary pressure, e.g. hoarding against expectations of further price rises, and export restrictions.
In practice, all these factors contributed to pushing up food prices. It was the combination of them that was crucial. These were the immediate triggers of increasing food prices but were set against the background of the longer-term problems facing developing country agriculture – slowing growth in yields, lack of investment, declining share of agriculture in development aid, and declining funds for research and development – which not only exacerbated the food insecurity problem but also made it even more difficult for developing countries to deal with.
Production shortfalls and low stocks
Traditional explanations for food price variability emphasize the importance of exogenous shocks to agricultural supply, notably as a result of the weather.
Why did food prices increase so much?
Evolution of wheat ending stocks and stock-to-use ratios
Million tonnes Percentage
Source: FAO.Ending stocks Stock-to-use ratio
0
100
200
300
400
07/0805/0603/0401/0299/0097/9895/9693/9491/9289/9087/8885/8683/8481/8279/80
15
25
35
45
5
Evolution of coarse grains ending stocks and stock-to-use ratios
Million tonnes Percentage
Source: FAO.Ending stocks Stock-to-use ratio
07/0805/0603/0401/0299/0097/9895/9693/9491/9289/9087/8885/8683/8481/8279/800
100
200
300
400
0
9
18
27
36

Wha
t hap
pene
d to
wor
ld fo
od p
rices
and
why
?
The State of Agricultural Commodity Markets 2009 16
How are agricultural commodity prices determined?
Agricultural commodity prices are
determined by a combination of the
so-called market fundamentals of
demand and supply and exogenous
shocks related to factors such as the
weather. In spite of intense research,
there are still differences of opinion
about the nature of price trends and
variability, and it is not straightforward,
except in hindsight, to distinguish
between normal variability and a change
in trend.
It is important to delineate those
factors driving demand and supply that
produce the underlying trends in prices
and those that cause variability around
those trends. Long-run changes in food
demand are primarily the result of
population and income growth, but they
are also influenced by relative price
changes and the evolution of dietary
patterns. Demand for agricultural raw
materials such as rubber is related to
economic growth more generally. Long-
run expansion in supply is primarily
driven by technological progress, which
reduces costs. In the past, technological
progress reduced costs and induced
supply expansion at a faster rate than
population and income growth
expanded demand, leading to a long-
run relative decline in agricultural
commodity prices. Recent
circumstances may have been different
in that demand growth, as a result of
income growth in emerging economies
and biofuel demand, may run ahead of
supply expansion, so leading to price
increases. Supply expansion may be
constrained in the short term by the cost
and availability of key inputs and other
supply-side problems, and in the longer
term by the availability of land and water
resources, labour and climate change.
Volatility in prices stems from supply
and demand shocks. In the short run,
supply and demand for agricultural
products are inelastic and do not
respond much to price changes, so
supply and demand shocks can
produce wide swings in prices. Supply
shocks are perhaps most important
because of the dependence of
agricultural production on the weather,
although demand shocks can be
important too, especially for certain raw
materials. The impact of shocks in
demand and supply on prices can be
cushioned by the possibility of running
down or adding to stocks. Therefore,
the level of stocks in relation to demand
is an important factor in commodity
prices. If the “stock-to-use” ratio is low
because stocks are low or demand is
high or both, there will be upward
pressure on prices. Markets and prices
for agricultural commodities do not
adjust immediately to supply or demand
shocks. The effects of shocks tend to be
less persistent when they are supply
shocks – owing to bad weather for
example – and more persistent in the
case of demand shocks.
Prices of different commodities are
linked through possible substitution or
complementarity in consumption or
production. These lead to “cross”
effects of price changes from one
commodity to another. For example,
higher prices for maize will lead
producers to grow more maize at the
expense of other crops, reducing their
supply and raising their prices; or
increasing demand for livestock
products will lead to increased feed
demand and prices for cereals and
oilseeds.
Worldimport demand
Initial stocksDomestic production
Factors affecting agricultural commodity prices
Source: FAO.* SPS/NTBs: Agreement on the Application of Sanitary and Phytosanitary Measures/non-tariff barriers.
Domestic demandexporting country
Human consumption
FeedIndustrial useFinal stocks
Initial stocksDomestic production
Domestic demandimporting country
Human consumption
FeedIndustrial useFinal stocks
Worldexport supply
PopulationIncomeTastePrices of complementary productsPrices of competitive productsDemand for meatPrices of other feedsOil pricesDomestic policies... etc.
Worldprice formation
P
Q
Price formationin importing country
P
Q
Input costsDomestic policiesWeatherPricesUtilization in previous year... etc.
DutiesExchange rates
Input costsPolicies
WeatherTechnology
Commodity pricesUtilization
previous year
DutiesExchange ratesSPS/NTBs*
PopulationIncome
TastePrices of
complementary productsPrices of
competitive products... etc.
Oil pricesPolicies
Technology... etc.
Demand for meatPrices of other feeds
... etc.
Exports
Imports
Price formation in exporting country
P
Q
+
+
The State of Agricultural Commodity Markets 2009 17
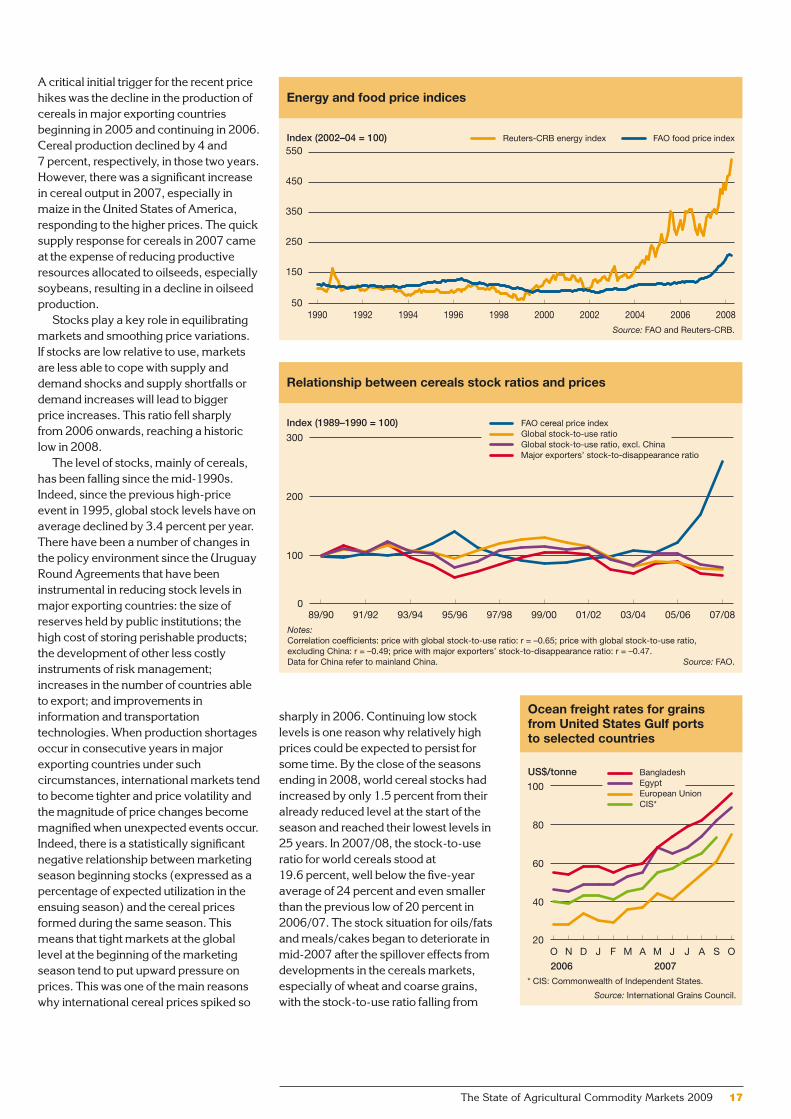
A critical initial trigger for the recent price hikes was the decline in the production of cereals in major exporting countries beginning in 2005 and continuing in 2006. Cereal production declined by 4 and 7 percent, respectively, in those two years. However, there was a significant increase in cereal output in 2007, especially in maize in the United States of America, responding to the higher prices. The quick supply response for cereals in 2007 came at the expense of reducing productive resources allocated to oilseeds, especially soybeans, resulting in a decline in oilseed production.
Stocks play a key role in equilibrating markets and smoothing price variations. If stocks are low relative to use, markets are less able to cope with supply and demand shocks and supply shortfalls or demand increases will lead to bigger price increases. This ratio fell sharply from 2006 onwards, reaching a historic low in 2008.
The level of stocks, mainly of cereals, has been falling since the mid-1990s. Indeed, since the previous high-price event in 1995, global stock levels have on average declined by 3.4 percent per year. There have been a number of changes in the policy environment since the Uruguay Round Agreements that have been instrumental in reducing stock levels in major exporting countries: the size of reserves held by public institutions; the high cost of storing perishable products; the development of other less costly instruments of risk management; increases in the number of countries able to export; and improvements in information and transportation technologies. When production shortages occur in consecutive years in major exporting countries under such circumstances, international markets tend to become tighter and price volatility and the magnitude of price changes become magnified when unexpected events occur. Indeed, there is a statistically significant negative relationship between marketing season beginning stocks (expressed as a percentage of expected utilization in the ensuing season) and the cereal prices formed during the same season. This means that tight markets at the global level at the beginning of the marketing season tend to put upward pressure on prices. This was one of the main reasons why international cereal prices spiked so
Energy and food price indices
Index (2002–04 = 100)
Source: FAO and Reuters-CRB.
Reuters-CRB energy index FAO food price index
50
150
250
350
450
550
2008200620042002200019981996199419921990
Relationship between cereals stock ratios and prices
Index (1989–1990 = 100)
Source: FAO.
Notes: Correlation coefficients: price with global stock-to-use ratio: r = –0.65; price with global stock-to-use ratio, excluding China: r = –0.49; price with major exporters’ stock-to-disappearance ratio: r = –0.47.Data for China refer to mainland China.
FAO cereal price indexGlobal stock-to-use ratioGlobal stock-to-use ratio, excl. ChinaMajor exporters’ stock-to-disappearance ratio
0
100
200
300
07/0805/0603/0401/0299/0097/9895/9693/9491/9289/90
Ocean freight rates for grains from United States Gulf ports to selected countries
US$/tonne
Source: International Grains Council.
* CIS: Commonwealth of Independent States.
20
40
60
80
100
OSAJJMAMFJDNO
2006 2007
BangladeshEgypt
CIS*European Union
sharply in 2006. Continuing low stock levels is one reason why relatively high prices could be expected to persist for some time. By the close of the seasons ending in 2008, world cereal stocks had increased by only 1.5 percent from their already reduced level at the start of the season and reached their lowest levels in 25 years. In 2007/08, the stock-to-use ratio for world cereals stood at 19.6 percent, well below the five-year average of 24 percent and even smaller than the previous low of 20 percent in 2006/07. The stock situation for oils/fats and meals/cakes began to deteriorate in mid-2007 after the spillover effects from developments in the cereals markets, especially of wheat and coarse grains, with the stock-to-use ratio falling from

Wha
t hap
pene
d to
wor
ld fo
od p
rices
and
why
?
The State of Agricultural Commodity Markets 2009 18
World cereal food and feed utilization
Million tonnes
Source: FAO.
650
750
850
950
1 050
07/0805/0603/0401/0299/0097/98
Food use
Feed use
Cereal utilization in China plus India and the rest of the world
Million tonnes
Source: FAO.
Notes: Data for China refer to mainland China. Utilization is the sum of food, animal feed, seed use, industrial use and waste.
0
500
1 000
1 500
2 000
07050095908580
Rest of the world
China plus India
Cereals used for food in China plus India and the rest of the world
Million tonnes
Source: FAO.
Note: Data for China refer to mainland China.
Rest of the world
China plus India
200
300
400
500
600
700
07050095908580
Net imports of cereals by China and India
Million tonnes
Source: FAO.
Note: Data for China refer to mainland China.
-20
-10
0
10
20
07050095908580
China
India
Cereal utilization and net trade in China
Million tonnes Million tonnes
Source: FAO.
Note: Data for China refer to mainland China.
-5
0
5
10
15
20
07/0805/0603/0401/0299/0097/98
0
100
200
300
400
Net
expo
rts
Net
imp
ort
s
Utilization(right axis)
Net trade(left axis)
Cereal utilization and net trade in India
Million tonnes Million tonnes
Source: FAO.
Utilization(right axis)
Net trade(left axis)
-3
0
3
6
9
12
15
07/0805/0603/0401/0299/0097/98
0
50
100
150
200
250
Net
exp
ort
sN
etim
po
rts

The State of Agricultural Commodity Markets 2009 19
13 to 11 percent for oils/fats and from 17 to 11 percent for meals/cakes by the end of the 2007/08 season.
Putting food and feed in perspective – China and India
The increase in world population requires higher food production if consumption requirements are to be met. Increasing incomes generally also lead to changes in diets, often reflected in stronger demand for higher-value foods (such as livestock products) as opposed to starchy staples (such as wheat). Because these changes are gradual, it is not correct to consider them as an underlying cause for any sudden price increase such as the one experienced recently. Therefore, the widely accepted notion that rising demand in countries such as China and India, the two most populous countries with rapid population and income growth, is a reason for soaring food prices warrants re-examination.
The importance of growth in demand from China and India as a shaper of world food markets and prices has been highlighted in a recent study by the
International Food Policy Research Institute (IFPRI, 2008). This argues that rapid economic growth in certain developing economies has pushed up middle-class consumers’ purchasing power and this has increased demand for livestock products such as meat and milk and, hence, demand for feedgrains.
Emerging economies, particularly China and India, are certainly playing an important role in global agricultural commodity demand and supply. However, the high commodity prices of 2007 and 2008 do not seem to have originated in these emerging markets. Cereal use in China and India has in fact been growing more slowly than in the rest of the world.
Cereal imports by China and India have been trending downwards since 1980, by about 4 percent per year, from an annual average of about 14 million tonnes in the early 1980s to roughly 6 million tonnes in the past three years.
This means that the growth in cereal feed demand in these two countries, at least until recently, has been met mainly from domestic sources. Moreover, while China has become a major importer of oilseeds, vegetable oils and livestock products, the country’s overall agricultural trade balance has remained largely positive in most years since the mid-1990s. The long-term development in the trade position of India also goes contrary to the belief that it is one of the drivers of increasing food prices in world markets. India has been a major exporter of food. In most years between 1995 and 2007, it exported more wheat, rice and meat than it imported. Even India’s relatively large imports of vegetable oils need to be considered in the context of equally large exports of oilcakes. In fact, in the case of both China and India, there is no evidence of a sudden increase in imports of oilseeds, meals and oils to indicate that they have contributed to their price hike, which began in mid-2007 after the spike in the prices of grains (maize in particular)
a year earlier. China and India have not been the cause of the sudden price spike in the oils complex, but this does not downplay their role nor that of changing consumption patterns in general on developments in food markets both in the past and in the future.
What about biofuels?
Demand for certain agricultural commodities as feedstocks for biofuels can mean fewer productive resources used in the production of food crops. Biofuel production may reduce the availability of food commodities on the market because “effective” demand for grains, sugar or oils and other basic food staples as feedstock for fuel production could outbid that for food where the prices of oil and feedstocks favour biofuel production. This new source of demand has been playing an important role in influencing prices. Among all major food and feed commodities, additional demand for maize (a feedstock for the production of ethanol) and rapeseed (a feedstock for the production of biodiesel) have had the strongest impact on prices. For example, out of the increase of nearly 40 million tonnes in total world maize use in 2007, almost 30 million tonnes were absorbed by ethanol plants alone. Most of this expansion occurred in the United States of America, the world’s largest producer and exporter of maize. In the United States of America, maize utilized to produce ethanol represented around 30 percent of its total domestic use. This contributed to the steep rise in international maize prices observed since the beginning of 2007. The intensity of the price reaction was also related to the fast pace (mostly within 2–3 years) at which this new demand materialized and to its concentration in the United States of America (more than 90 percent), a major exporter of maize. Globally, some 12 percent of total world maize utilization was used for ethanol in 2007, compared
Maize utilization and exports in the United States of America
Million tonnes
Source: FAO.
Other uses Exports
Feed use Ethanol use
0
100
200
300
400
07/0806/0705/0604/0503/04

Wha
t hap
pene
d to
wor
ld fo
od p
rices
and
why
?
The State of Agricultural Commodity Markets 2009 20
with 60 percent for animal feed. In the EU, the biodiesel sector is estimated to have absorbed about 60 percent of member states’ rapeseed oil output in 2007, amounting to about 25 percent of global production and 70 percent of global trade in the commodity in that year.
The issue is not limited to how much of each crop may be used for biofuels rather than for food and feed, but how much of planting area could be diverted from producing other crops to those used as feedstock for the production of biofuels. Already, high maize prices since mid-2006 encouraged farmers in the United States of America to plant more maize in 2007. Maize plantings increased by nearly 18 percent. This increase was only made possible by the reduction in soybean and wheat areas. The expansion in maize plantings combined with favourable weather resulted in a bumper maize harvest in 2007, enabling the United States of America to meet both domestic demand, including that from its growing ethanol sector, as well as to export. However, this apparent success in maize disguised another important development – reduced wheat and soybean plantings and, therefore, their production. This was one reason for their sharp price increases. However, had production in Australia not suffered from another year of drought and outputs in the EU and Ukraine not been hampered by the unfavourable weather, it is conceivable to assume that grain prices would not have increased by as much as they did.
This chain reaction somewhat repeated itself in 2008, but this time in reverse order. Farmers in the United States of America cut back on their maize plantings in favour of soybeans because of their higher relative prices. Strong soybean prices gave rise to a substantial increase in soybean planted area in the United States of America for the 2008/09 marketing season. This trend is confirmed by the soybean–maize price ratio in the futures market. From a historical perspective, whenever the ratio approaches two, as a rule of thumb soybeans are favoured over maize, resulting in a shift of planting area from maize to soybeans. As this ratio fell in 2006/07, farmers drastically increased maize plantings. However, with the ratio well above two in the 2007/08 season, farmers expanded soybean plantings
instead. Increases in soybean plantings were a positive development for the soybean market but left the maize market precariously balanced. In view of the new United States Energy Bill, the demand for maize by the ethanol sector is expected to continue to rise. If production of maize were to decline in 2009, it would be difficult to picture how the United States of America could meet all demand (food, feed, fuel and exports) without a significant drawdown on its own maize stocks during the 2009/10 season. The market will be closely watched for indications of this eventuality. In these periods of market tightness, maize prices could firm, with a strong possibility of spillover to other major food and feed crops.
With the exception of ethanol production from sugar cane in Brazil, production of biofuels is currently not economically viable without subsidies or other forms of policy support. The production costs per litre of biofuel are by far the lowest for Brazilian sugar-cane ethanol, which is the only biofuel that is consistently priced below its fossil-fuel equivalent. Brazilian biodiesel from soybeans and United States ethanol from maize have the next lowest net production costs, but in both cases costs exceed the market price of fossil fuels. European biodiesel production costs are more than double those for Brazilian ethanol, reflecting higher feedstock and processing costs. According to the Global Subsidies Initiative, the United States of America spent US$5.8 billion on biofuel subsidies in 2006 while the EU spent US$4.7 billion. These policy interventions encouraged the rush to liquid biofuels and, hence, increased demand for certain agricultural products as feedstocks. One motivation for such support – the claimed environmental benefits of biofuels over fossil fuels – is now being questioned as evidence emerges that reductions in greenhouse gas emissions are less than originally assumed for certain types of biofuels. However, while support for biofuels remains in place, the additional demand for the agricultural products involved will continue to shore up their prices, with spillover effects on prices in other agricultural markets.
Much depends on oil prices. The higher that oil prices are, the more economically viable biofuel production becomes and
The State of Agricultural Commodity Markets 2009 21
the more agricultural products are demanded as feedstocks. When oil prices reach a level where biofuels become competitive, demand by the energy market for agricultural products as feedstocks increases and this new demand pushes up agricultural prices. Thus, agricultural and energy markets become linked in a new way. As energy markets are huge relative to agricultural markets, demand from the biofuel sector could in principle absorb any additional production of crops usable as feedstocks so the energy market would effectively set a floor price for the agricultural products. It would also set a ceiling on agricultural product prices at the point where they have risen so much that biofuel production is no longer competitive. It would be energy demands rather than food demands that would set agricultural product prices and agricultural product prices would be tied to energy prices. Clearly, this would be a major departure from how agricultural product prices have been determined in the past.
What is the role of speculation?
Recent discussions of high food prices have included a growing interest in the possible effects of speculators and institutional investors – “non-commercial traders” – buying into agricultural commodities on futures markets as returns on other assets have become less attractive. There has been some concern that speculation has contributed to increasing food prices. The downturn in the global properties and securities markets resulted in an inflow of funds into agricultural commodity futures markets looking for profits, both from traditional institutions such as hedge funds and pension funds and from newer commodity-linked and exchange-traded funds. Global trading activity in futures and options combined has more than doubled in the last five years. In the first nine months of 2007, this activity grew by
Typically, commodity exchange markets
provide risk management tools such as
futures and options to enable market
participants like farmers, processors,
producers or traders – “commercial
traders” – to hedge against the risk of price
fluctuations in the future. These markets also
assist in the discovery of prices and thus
provide a measure of predictability in
ascertaining future prices. Another market
activity is speculation, undertaken mainly by
speculators or investors – “non-commercial
traders”. This involves making profits by
speculating on future movements in the price
of an asset or a commodity.
Speculation is important for the efficient
functioning of markets because it brings
liquidity into the market and helps farmers
and other participants to offset their
exposure to future price fluctuations in the
physical commodity markets. However,
speculation can sometimes play a perverse
role in markets. For example, excessive
levels of speculation can lead to sudden or
unreasonable fluctuations or unwarranted
changes (in one particular direction) in
commodity prices. This may occur when an
increasing share of open interests (number of
outstanding futures contracts) is held by
investors interested in gaining from future
price movements with little regard to the
fundamentals of commodity demand and
supply. Thus, the impact of excessive
speculation is counterproductive to futures
markets because the risk of price volatility is
a fundamental condition that these markets
attempt to address. In addition, excessive
speculation in agricultural commodity
markets may transmit inappropriate market
signals to agricultural producers, leading to
inefficient allocation of resources.
The level of speculative activity could be
controlled by regulating commodity markets.
One way is through limiting the number of
futures contracts that one participant, other
than a participant eligible for hedge
exemption, can hold, thereby limiting the
ability of a single participant to influence the
market. However, this is risky as excessive
regulation may drive speculators out of the
market, depriving it of liquidity.
Speculation on agricultural commodity markets
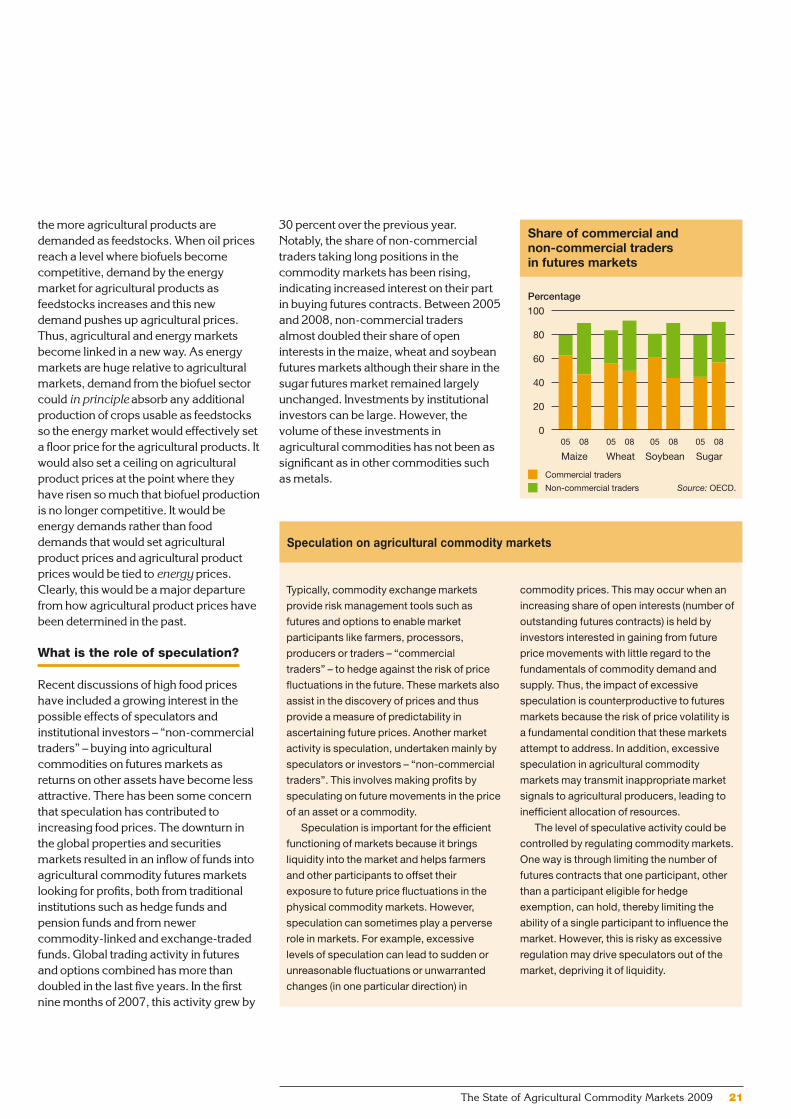
30 percent over the previous year. Notably, the share of non-commercial traders taking long positions in the commodity markets has been rising, indicating increased interest on their part in buying futures contracts. Between 2005 and 2008, non-commercial traders almost doubled their share of open interests in the maize, wheat and soybean futures markets although their share in the sugar futures market remained largely unchanged. Investments by institutional investors can be large. However, the volume of these investments in agricultural commodities has not been as significant as in other commodities such as metals.
Share of commercial and non-commercial traders in futures markets
Percentage
Source: OECD.
0
20
40
60
80
100
0805080508050805
Commercial traders
Non-commercial traders
Maize Wheat Soybean Sugar

Wha
t hap
pene
d to
wor
ld fo
od p
rices
and
why
?
The State of Agricultural Commodity Markets 2009 22
The increase in the shares of non-commercial traders in maize, wheat and soybean markets coincided with the increase in prices of these commodities in the physical markets. This high level of speculative activity in agricultural commodity markets in the last few years has led some analysts to connect the increases in food prices with increased speculation. However, it is not clear whether speculation on agricultural commodities was driving prices higher or was attracted by prices that were increasing anyway. A recent study by the International Monetary Fund (IMF) concluded that in general it was the high prices that were encouraging inflows of investment funds into futures markets for agricultural commodities. This question of causality requires further research. Large inflows of funds could provide a further explanation at least for the persistence of high food prices and their apparently increased volatility. Again, further research is needed. In the meantime, the role, if any, of financial investors in influencing food prices is a matter of concern to the extent that some countries have even considered additional regulation.
No single explanation for soaring food prices
The sharp jump in the US dollar prices of food, which peaked in the first half of 2008, can be characterized as the most significant spike since the 1970s. The reason for this development was supply and demand imbalances in many of the major commodity markets, notably cereals and oilseeds. It is primarily on the demand side that plausible explanations for the food price hike can be found. The principal drivers of increasing prices on the supply side tend to be short-lived and are related to production shortfalls and to policy measures such as restrictive export policies by major traders. On the demand side, factors contributing to the recent rise in world food prices are few. Unlike with supply, changes on the demand side are in general neither rapid nor unexpected. This is because, aside from the emerging biofuel factor, the main drivers of demand in food markets are population and income growth. In most cases, these two fundamental variables manifest a gradual (and expected) upward demand
progression and, in this way, allow for supply to adjust. The situation during the recent high-price period does not depart from this trend in that neither food nor feed demand exhibited any sudden or unexpected increase that would have merited the kind of price rises witnessed by markets. Speculation and inflows of investment funds are more likely to have followed the increasing prices than to have caused them. Only the rapid expansion in demand for biofuel feedstocks marks a major departure from past experience. However, biofuel demand alone cannot explain the extent of the price increases in 2007 and early 2008. Record oil prices have increased interest in biofuel development but have also had a major impact in their own right by driving up production and transport costs. Upward pressure on prices has been reinforced also from the demand side by fears that prices might go even higher and by increased demand for stocks. The sharp increase in food prices on world markets cannot be attributed to any one single factor. Each one of those causes commonly cited cannot of itself explain the pattern and extent of recent price movements. It is their coincidence and combination that accounts for the dramatic changes. While disentangling their separate effects is problematic, the evidence does point to biofuel demand and oil prices as the principal drivers.
Some broad indication of the relative impacts on food prices of the various factors can be gleaned from simulations with the OECD–FAO Aglink-Cosimo model of world agricultural markets. This model is used to generate market projections over the medium term on the basis of assumptions concerning the future values of key variables affecting markets and prices.3 Varying these assumptions and comparing the resulting
3 Aglink-Cosimo is a partial equilibrium model, a joint
project of FAO and the OECD. These scenarios are
described in more detail in OECD–FAO Agricultural
Outlook 2008–2017 (OECD–FAO, 2008). Aglink-
Cosimo provides a comprehensive dynamic economic
and policy-specific representation of 58 of the world’s
major producing and trading countries and regions for
the main temperate-zone commodities as well as rice,
sugar and palm oil. Ethanol and biodiesel are also now
included. As most models of this type, the model is
driven by elasticities, technical parameters and policy
variables.

The State of Agricultural Commodity Markets 2009 23
projections gives an indication of the strength of each influence. The five key assumptions examined were: (i) biofuel use of grains and oilseeds; (ii) petroleum prices; (iii) income growth in major developing economies: Brazil, China, India, Indonesia and South Africa (EE5); (iv) the exchange rate of the US dollar relative to the currencies of all other countries; and (v) crop yields.
For coarse grains and vegetable oil, the price outlook would be most affected if biofuel production were to remain constant at 2007 levels. Changes in demand for these commodities as feedstocks for biofuel production are a source of uncertainty irrespective of whether the cause is an oil price change, a change in biofuel support policies or a new technological development that leads processors to buy different feedstocks. Holding biofuel production constant at its 2007 level results in a 12-percent decline in the 2017 projected prices for coarse grains and around 15 percent in the projected price of vegetable oil. The second scenario shows that wheat, coarse grains and vegetable oil price projections are all highly sensitive to petroleum-price assumptions and would be a further 8–10 percent lower if oil prices fell to their 2007 level. The reduced gross domestic product (GDP) growth scenario produces wheat and coarse grains prices that are only modestly (1–2 percent) below the baseline. For
vegetable oils, reflecting presumably a much higher income elasticity of the demand and a greater influence of the five countries in world trade, the simulated price difference exceeds 10 percent. A fourth scenario simulating a stronger US dollar raises prices in domestic currency terms in exporting countries, providing greater incentives to increase supplies. At the same time, a stronger US dollar reduces the import demand in importing countries. The combination of greater export supply and weaker import demand puts additional downward pressure on world prices. By 2017, wheat, coarse grain and vegetable oil prices would all be some 5 percent below the corresponding baseline projection. The scenario under which cereals and oilseeds yields are assumed to be 5 percent higher leads to projected wheat and maize prices for 2017 that are 6 and 8 percent lower, respectively, than the corresponding baseline value, but make little difference to projected vegetable oil prices.
Why have prices fallen?
The sharp fall in international food prices since July 2008 has reversed their equally sharp rise up to that point and pushed them back towards their 2007 levels. The underlying causes of the reversal are a mixture of supply and demand factors. High prices have encouraged an
Sensitivity of projected world prices to changes in five key assumptions, percentage difference from baseline values, 2017
Percentage
Sources: FAO and OECD.
-50
-40
-30
-20
-10
0
Vegetable oilMaizeWheat
Scenario 1: Biofuel production constant at 2007 level
Scenario 2: Scenario 1 and oil price constant at 2007 level (US$72)
Scenario 3: Scenario 2 and lower income growth in EE5* countries (half annual growth rate)
Scenario 4: Scenario 3 and exchange rate over inflation held constant at 2005 level
Scenario 5: Scenario 4 and yields for wheat, oilseeds and coarse grains 5% higher than over the projection period
* EE5: Brazil, China, India, Indonesia and South Africa.
Cereal production in 2007 and 2008
Million tonnes
Source: FAO.
* BIC: Brazil, India and China (mainland).
2007 estimate 2008 forecast
400
600
800
1 000
1 200
1 400
11.0%
0.9%
-1.6%
Developedcountries
Developingcountries
Developingcountriesexcluding
BIC*
expansion in global production of cereals. However, this supply response has been concentrated mostly in the developed countries and, among developing countries, Brazil, China and India. With the exception of these three, cereal production actually fell between 2007 and 2008 in developing countries. Therefore, it is clear that high food prices were not an opportunity seized by the majority of poor farmers in developing countries – their supply response was limited in 2007 and virtually zero in 2008. Falling food prices have little to do with increasing global supplies. The explanation lies more in terms of slowing demand as the financial
Cereal production in developing and developed countries
Million tonnes
Source: FAO.* Forecast.
300
500
700
900
1 100
1 300
08*050095908580757065
Developingcountries
Developedcountries
Wha
t hap
pene
d to
wor
ld fo
od p
rices
and
why
?
The State of Agricultural Commodity Markets 2009 24
crisis and emerging global recession have reduced economic activity and oil prices have tumbled. The declining demand has been having most impact, at least initially, on the markets and prices of agricultural raw materials such as rubber, but food prices are also being affected.
While falling food prices are good news for consumers, they should not be taken as implying that the global food system’s problems are solved. Most of the critical factors that underlay the high-price
episode and the resulting threat to food security remain. Developing country food production has not seen any significant increase and weaker price incentives will not encourage further expansion of production elsewhere. Global cereal stocks are still low with the stock-to-use ratios for cereals in 2008/09 below their five-year average. Although oil prices have fallen drastically, biofuel demand remains strong as feedstock prices have fallen and new ethanol production
The global economy is expected to grow by
only 2 percent in 2009 compared with
3.8 percent in 2008. Evidence of global
recession has accumulated with projected
growth in major developed economies
reduced to zero or even negative. The
financial crisis and, more significantly, the
global recession have obviously contributed
to the dramatic fall in agricultural commodity
prices. However, it is difficult to separate the
impacts of the crisis and recession from the
expected market adjustments to apparent
overshooting of prices upwards in 2007 and
the first half of 2008. Agricultural markets
and prices will be affected on both the
demand side and the supply side, not only
through reduction in economic growth rates
and demand but also through exchange rate
changes, changes in the availability and cost
of credit and changes in the availability of
other external funding, including aid.
However, the reduction in global economic
growth will be the major influence on
agricultural commodity markets and
developing country agricultural prospects in
the near future.
The impacts on demand for commodities
will be negative. Experience of previous
recessions suggests that demand for, and
prices of, raw materials such as natural
rubber and fibres will be hardest and fastest
hit, followed by livestock products for which
income elasticities are relatively higher. The
impact on basic foods such as cereals may
be less, as consumption levels are defended
and demand is maintained. Developing
countries dependent on exports of raw
materials and tropical products will face
balance of payments problems in the
absence of a similar or stronger decrease in
the cost of food imports on which many also
depend. The prevailing uncertainty and
consequent negative market expectations
are likely to dampen overall demand further.
Hopes that commodity demand and prices
might be sustained by continuing high
growth rates in China and India and other
rapidly growing economies in the developing
world now look less tenable as their
projected growth has been revised
downwards. Availability of credit and liquidity
is constraining agricultural trade, adding to
the downward pressure on international
prices but also reducing trade volumes.
Falling oil prices will compound downward
pressure on prices for commodities usable
as feedstocks in biofuel production.
However, the net effect will depend on their
price movements relative to oil and the
extent of biofuel policy support.
Lower prices in general are good news for
consumers but will affect incentives for
producers to make the investments needed
to achieve greater food security in the
medium and long term. With incentives for
producers reduced, some cutback in
production might be expected, also reducing
scope for rebuilding grain stocks. Whether
falling prices are really good news for
consumers depends on what happens to
incomes, which will fall along with
employment in the event of worldwide
recession. Many developing countries are
also highly dependent on remittances, so
downturns in the developed economies
could have an indirect impact on domestic
demand in developing countries as
employment and incomes of migrant
workers fall. Remittances also provide funds
for investment, including in agriculture.
The financial crisis, recession and agricultural commodity prices

The State of Agricultural Commodity Markets 2009 25
capacity comes on line. The impact of falling oil prices on agricultural prices is complicated. Lower oil prices reduce energy and fertilizer costs but will compound the downward pressure on prices of those commodities usable as feedstocks as biofuel becomes less competitive. The net effect will depend on the relative price movements between oil and feedstocks, notably maize.
What about the medium term?
The fall in food prices on international markets has been sharp but prices remain substantially above their average of the last five years. The big question is whether prices will fall further or remain at these historically high levels. Prices fell in the second half of 2008 as dramatically as they increased in the first half. In either case, some overshooting is likely, reflecting the much-increased volatility, so it is difficult to distinguish an adjustment to a new trend. However, some of the factors cited as explanations for high prices suggest that they will persist, against the
pattern of past commodity price behaviours where price spikes have been short-lived and followed by prolonged slumps. More generally, as noted above, with the significant exception of oil prices, the factors that contributed to high food prices remain unchanged. Supplies have not increased substantially and stocks remain low.
The OECD–FAO Agriculture Outlook 2008–2017 (OECD–FAO, 2008) indicated that both nominal and real agriculture commodity prices would fall from the record levels reached in early 2008 but would remain higher over the next decade compared with the previous one. This decline has already begun, but more rapidly than expected as a result of the financial crisis and the downturn in the world economy. How long that decline will continue will depend on the speed of recovery from the recession. However, the Outlook argues that among the prime factors in the latest price spike – droughts in key grain-producing regions, increased biofuel feedstock demand, high oil prices, US dollar depreciation and a changing demand structure for commodities, all in
the context of low stocks – some have permanent elements that are expected to sustain higher prices over the next ten years. In particular, the Outlook pointed to biofuel demand and oil prices. While globally, and in absolute terms, food and feed remain the largest sources of demand growth in agriculture, there is now a fast-growing demand for feedstock by the bioenergy sector. Biofuel demand is the largest source of new demand in decades and is seen as a strong factor underpinning the upward shift in agricultural commodity prices. Biofuels have forged a new link between agricultural product prices and oil prices, which also has the potential to break the pattern of long-run decline in real agricultural commodity prices, at least in the medium term.
Medium-term projections for selected commodity prices
US$/tonne
Wheat
US$/tonne
Maize
US$/tonne
Rice
Source: OECD–FAO, 2008.Nominal price Real price
0
100
200
300
400
2017200719970
50
100
150
200
2017200719970
100
200
300
400
201720071997

Wha
t hap
pene
d to
wor
ld fo
od p
rices
and
why
?
The State of Agricultural Commodity Markets 2009 26
The impacts of rising food prices on consumers4
T he impact of high food prices is obviously most severe for the poor who rely on purchased food. For
the poor in developing countries, food can account for at least 50 percent and up to 70–80 percent of their budget. Thus, higher prices affect not only their food consumption in terms of quantity and quality, but also their spending in general. The most visible indicator of this negative impact was the social unrest and rioting that erupted around the world triggered by soaring food prices. The disturbances were mostly concentrated in urban areas. These are the areas where dependence on imported food and exposure to international food prices is probably highest and consumers feel the brunt of the impact of soaring food prices. However, the rural poor are also affected even though their connections to international food markets might be weaker. The impact of higher food prices on the poor depends crucially on whether they are net food sellers, in which case the impact could in principle be positive, or net food buyers, in which case the impact is unequivocally negative. The evidence suggests that most households in the developing world and especially the poor are net buyers of food, and this holds even for rural households that are mostly engaged in agriculture. Whether urban or rural, it is the poorest of the poor who spend the largest share of their income on food and who have no access to assets such as land who suffer most. Female-headed households figure disproportionately on both counts, so the negative impacts of high food prices also have a gender dimension that needs to be addressed in policy responses.
Faced with sharply rising food prices, poor households had to adjust their food
consumption patterns. Households are reported to have reduced their food intake or to have attempted to maintain it by reducing their spending on more expensive foods and other non-food items. Among the poorest population groups, per capita cereal consumption may even rise in spite of increasing prices as consumers shift to a cereals-based diet away from more expensive and higher-quality food groups, including meat, dairy products and vegetables. In spite of the soaring prices in global commodity markets (in particular of tradable staples such as wheat, rice and maize), the most recent data on the food use of these key commodities illustrate the resilience of per capita consumption. This trend is the same for most low-income countries, including those with high levels of undernourishment. However, there are also instances of consumers returning to more traditional foods as the costs of preferred but imported cereals increased.
Rising food prices fuel inflation
Rising food prices contribute to the overall rate of inflation in most countries, including developed countries. Changes in food prices are an important component of the general rate of inflation, as measured by the consumer price index (CPI). This is a weighted average of the changes in the prices of a representative fixed basket of goods, including food, and with the weights reflecting the importance of each good in the typical household budget. The greater the share of food in the household budget, the more rising food prices fuel general inflation. For most developed countries, food expenditure shares range between 10 and 20 percent. In developing countries, the share of food expenditure in household budgets is much higher, absorbing more than half of family income in countries such as Bangladesh, Haiti, Kenya and Malawi.
The impacts of high food prices
4 See The State of Food Insecurity in the World 2008
(FAO, 2008a) for a detailed discussion of these
impacts.
The State of Agricultural Commodity Markets 2009 27
In addition to imposing a heavy burden on the cost of living, rising food prices can have further indirect effects on inflation if they prompt pay increases – higher wage demands have been at the core of several protests. An inflation-targeting central bank might have to curb inflationary pressure from higher food prices when the effect on non-food prices is significant, and this would mean raising interest rates. This has become a growing tendency in developing countries, but higher interest rates would undermine the much-needed investment in sectors that provide a path out of poverty for vulnerable countries, especially the agriculture sector.
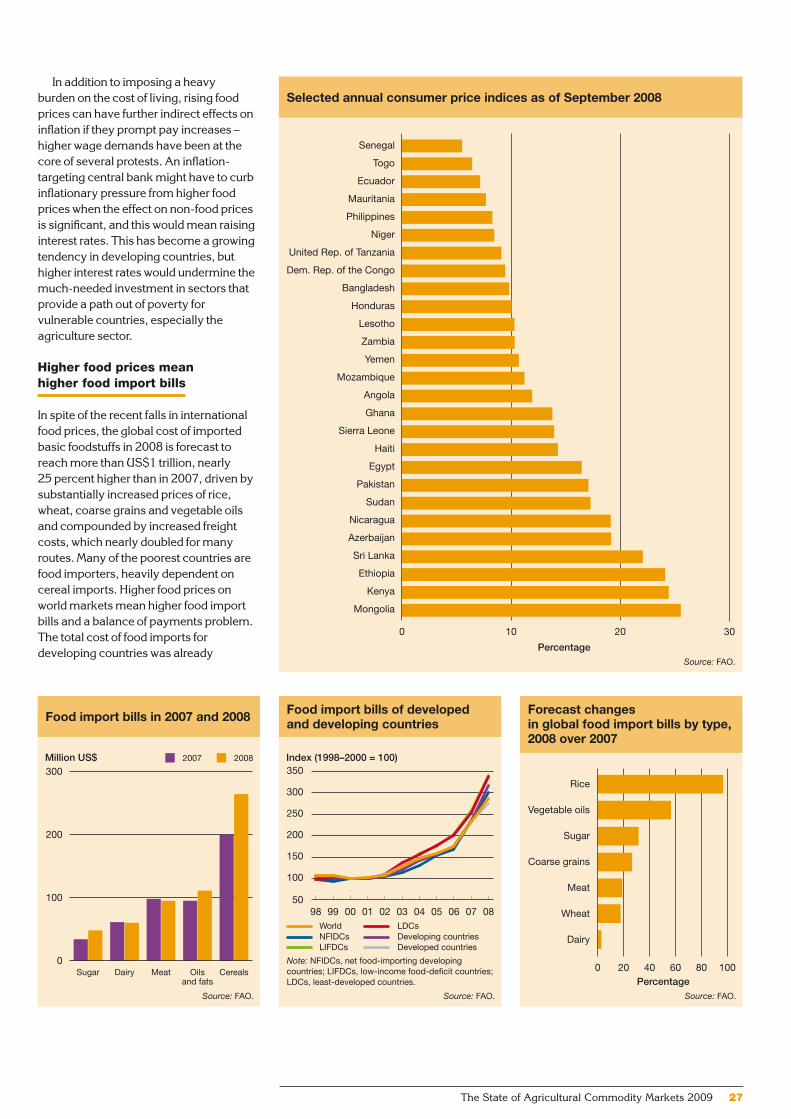
Higher food prices mean higher food import bills
In spite of the recent falls in international food prices, the global cost of imported basic foodstuffs in 2008 is forecast to reach more than US$1 trillion, nearly 25 percent higher than in 2007, driven by substantially increased prices of rice, wheat, coarse grains and vegetable oils and compounded by increased freight costs, which nearly doubled for many routes. Many of the poorest countries are food importers, heavily dependent on cereal imports. Higher food prices on world markets mean higher food import bills and a balance of payments problem. The total cost of food imports for developing countries was already
Selected annual consumer price indices as of September 2008
PercentageSource: FAO.
0 10 20 30
Senegal
Togo
Ecuador
Mauritania
Philippines
Niger
United Rep. of Tanzania
Dem. Rep. of the Congo
Bangladesh
Honduras
Lesotho
Zambia
Yemen
Mozambique
Angola
Ghana
Sierra Leone
Haiti
Egypt
Pakistan
Sudan
Nicaragua
Azerbaijan
Sri Lanka
Ethiopia
Kenya
Mongolia
Food import bills in 2007 and 2008
Million US$
Source: FAO.
0
100
200
300
CerealsOilsand fats
MeatDairySugar
2007 2008
Food import bills of developed and developing countries
Index (1998–2000 = 100)
Source: FAO.
Note: NFIDCs, net food-importing developing countries; LIFDCs, low-income food-deficit countries; LDCs, least-developed countries.
LIFDCsNFIDCsWorld
Developed countriesDeveloping countriesLDCs
50
100
150
200
250
300
350
0807060504030201009998
Forecast changes in global food import bills by type, 2008 over 2007
PercentageSource: FAO.
0 20 40 60 80 100
Rice
Vegetable oils
Sugar
Coarse grains
Meat
Wheat
Dairy

Wha
t hap
pene
d to
wor
ld fo
od p
rices
and
why
?
The State of Agricultural Commodity Markets 2009 28
33 percent higher in 2007 than in 2006, and annual food import bills for low-income food-deficit countries (LIFDCs) are now more than double their 2000 level.
At the national level, the impact of high commodity prices depends, among other things, on whether a country is an
importer or an exporter, what it imports or exports, its trade policy and its exchange rate policy. LIFDCs dependent on increasingly costly cereal imports (in some cases for up to 80 percent of dietary energy supplies) and on exports of tropical products or agricultural raw materials, for which prices have increased
Forecast changes in food import bills of selected LIFDCs, 2008 over 2007
PercentageSource: FAO.
0 20 40 60 80
United Rep. of Tanzania
Lesotho
Eritrea
Nicaragua
Swaziland
Togo
Dem. Rep. of the Congo
Honduras
Angola
Bangladesh
Yemen
Guinea
Mauritania
Somalia
Haiti
Zambia
Cameroon
Gambia
Mozambique
Côte d’Ivoire
Senegal
Benin
Pakistan
Liberia
Kenya
Zimbabwe
Guinea-Bissau
Niger

The State of Agricultural Commodity Markets 2009 29
less, and with currencies linked to or depreciating against the US dollar are the most vulnerable. The situation of countries that in addition are food-insecure (in the sense of more than 30 percent of the population being undernourished) and net fuel importers is obviously extremely precarious. There are more than 20 developing countries with these characteristics, at least 16 of them in Africa.
It is apparent that the most vulnerable countries bore the highest burden of the increasing cost of imported food, with total expenditures by LIFDCs some 35 percent higher in 2008 than in 2007 – the largest annual increase on record. Compared with other developing countries, LIFDCs already tend to have significantly greater current account deficits as a percentage of their GDPs, spend a much greater share of the value of their merchandise exports to import food and have lower income per head.5 The
majority of LIFDCs have witnessed a decline in the value of their currencies against the US dollar, which has further increased the cost of their food imports. These countries find themselves under economic pressure from all sides.
In addition, the financial crisis could have serious implications for food security in many developing countries. The tight credit situation may restrict access by poor countries to finance, thus limiting their ability to import food. LIFDCs in particular can have difficulty financing their cereal import needs through debt and may face increased fiscal pressure.
Consumers lose but do producers gain?
Clearly, the impact of high food prices on consumers is unequivocally negative. However, in principle, high prices should have been good news for farmers around the world. Higher food prices stand to improve the incentives for those producing the particular products concerned. In principle, higher food
prices increase the funds available to producers for investment, leading to increased agricultural growth and poverty reduction. In this sense, higher food prices might be considered an opportunity – at least for windfall gains for some. Access to means of production and assets such as land is a critical factor in determining who reaps the benefits of higher food prices. Large landholders will benefit most. Households highly specialized in agriculture are also likely winners, although these constitute a rather small proportion of the population, relative to the rest. However, will producers respond by increasing supply? It appears that the high food prices have not been an opportunity for most developing country farmers and a supply response has not materialized. As noted above, in spite of enormous increases in prices, developing countries increased their cereal production by less than one percent in 2008 and production actually decreased in the vast majority of them. The hoped-for supply response simply failed to materialize. Understanding the reasons for this and, hence, what needs to be done to promote supply response are crucial strategic and policy issues. These are addressed in detail in Part 2 of this report.Vulnerability of LIFDCs according to risk factors
Percentage
Source: FAO.Note: Differences in group means: * = significant at 5% level; ** = not statistically significant; *** = significant at 10% level.
Other developing countries LIFDCs
-10 0 10 20 30 40 50
Current accountbalance/GDP*
Commercial foodimport bill/GDP**
Commercial foodimport bill/merchandise
exports***
Import dependence(calorie basis)*
5 On average, LIFDCs had significantly lower annual
GDP per capita (US$2 213) compared with other
developing countries (US$7 453) in the period 2000–04.


