Project Number: 46389-001 December 2015 Republic of the Union of Myanmar: Institutional Strengthening of National Energy Management Committee in Energy Policy and Planning (Financed by the Japan Fund for Poverty Reduction and the Technical Assistance Special Fund) Part 11 of 16 – Chapter E: Long-Term Optimal Fuel Mix (Vol. 2 of 3: Liquids and Gaseous Fuels Strategy) Prepared by TA 8356-MYA, Intelligent Energy Systems (IES), Consulting Firm For the Oil & Gas Planning Department of the Ministry of Electricity & Energy This consultant’s report does not necessarily reflect the views of ADB or the Government conce rned, and ADB and the Government cannot be held liable for its contents. All the views expressed herein may not be incorporated into the proprosed project’s design. Technical Assistance Consultant’s Report
Transcript
Project Number: 46389-001 December 2015
Republic of the Union of Myanmar: Institutional Strengthening of National Energy Management Committee in Energy Policy and Planning
(Financed by the Japan Fund for Poverty Reduction and the
Technical Assistance Special Fund)
Part 11 of 16 – Chapter E: Long-Term
Optimal Fuel Mix (Vol. 2 of 3: Liquids and
Gaseous Fuels Strategy)
Prepared by TA 8356-MYA, Intelligent Energy Systems (IES), Consulting Firm
For the Oil & Gas Planning Department of the Ministry of Electricity & Energy
This consultant’s report does not necessarily reflect the views of ADB or the Government concerned, and
ADB and the Government cannot be held liable for its contents. All the views expressed herein may not be
incorporated into the proprosed project’s design.
Technical Assistance Consultant’s Report
Asian Development Bank
December 2015
Myanmar Energy Master Plan
The Government of the Republic of the Union of Myanmar
National Energy Management Committee
Project Number: TA No. 8356-MYA
FINAL REPORT
MYANMAR ENERGY MASTER PLAN
Prepared for
The Asian Development Bank
and
The Myanmar Ministry of Energy
Prepared by
in association with
December 2015
ADB TA 8356 Myanmar Energy Master Plan Final Report
AUTHORS
Michael Emmerton
Stuart Thorncraft
Sakari Oksanen
U Myint Soe
Kyi Kyi Hlaing
Yi Yi Thein
U Myat Khin
Project Number: TA No. 8356-MYA
FINAL REPORT
MYANMAR ENERGY MASTER PLAN
LONG-TERM OPTIMAL FUEL MIX
Prepared for
The Asian Development Bank
and
The Myanmar Ministry of Energy
Prepared by
in association with
Project Number: TA No. 8356-MYA
FINAL REPORT
LIQUID & GASEOUS FUEL STRATEGY
Prepared for
The Asian Development Bank
and
The Myanmar Ministry of Energy
Prepared by
in association with
ADB TA 8356-MYA Myanmar Energy Master Plan Final Report
545
ABBREVIATIONS
ADB – Asian Development Bank
ASEAN – Association of Southeast Asian Nations
CSO – Central Statistics Organisation
EIA – U.S. Energy Information Administration
FAO – Food and Agriculture Organization
FAME – Fatty Acid Methyl Ester
GDP – Gross Domestic Product
GoM – Government of the Republic of the Union of
Myanmar
LNG – Liquefied Natural Gas
MOE – Ministry of Energy
MPE – Myanmar Petroleum Enterprise
PRC – People’s Republic of China
USD – United States Dollar
UNITS OF MEASURE
IG – Imperial Gallon
km – Kilometre
l – Litre
mcm – Million Cubic Meters
bbl – Barrels
bcm – Billion Cubic Meters
boe – Barrels of Oil Equivalent
bopd – Barrels of Oil Per Day
mmbbl – Million Barrels
mtoe – Million tons of Oil Equivalent
CONVERSION FACTORS
1 litre = 0.22 Imperial Gallon
1 km = 0.62137 mile
1 barrel = 159 litres or 35 imperial gallons
1 ha = 2.47105 acre
1 km2 = 100 ha
ADB TA 8356-MYA Myanmar Energy Master Plan Final Report
546
CONTENTS
I. LIQUID & GASEOUS FUEL STRATEGY 547
A. Introduction 547
B. Liquid & Gaseous Fuel Strategy 547
II. PETROLEUM FUELS 550
C. Introduction 550
D. Investment in a Small Size Refinery 552
E. Conclusion 562
III. NATURAL GAS 563
F. Introduction 563
G. Power Sector Consumption 563
H. Refinery 564
I. Fertilizer 565
J. Industry, Commercial, Household Sector 565
K. Natural Gas Supply – Demand Balance 566
L. Natural Gas Supply Risk Mitigation Strategy 570
IV. BIOFUELS 571
M. Introduction 571
N. Biodiesel 572
O. Bioethanol 576
P. Conclusion 580
ADB TA 8356-MYA Myanmar Energy Master Plan Final Report
547
I. LIQUID & GASEOUS FUEL STRATEGY
A. Introduction
1. Myanmar’s economy is expected to grow at a rate of 7.1%, which will result in an increase in the demand for liquid fuels – a demand which is currently covered mainly with imported hydrocarbons. Covering the liquid fuel needs of a growing economy with imports would negatively affect Myanmar’s trade balance in the future – identification of local alternatives is therefore wise. Some possibilities for initiating local production of liquid and gaseous fuels are presented in this report.
2. The Republic of the Union of Myanmar possesses large resources of natural gas. It plays a significant role in the country’s energy mix: in recent years natural gas accounted for 45% of the total primary energy production. At home the natural gas was mainly used for electricity production and industrial purposes, whereas the largest part of the gas produced in Myanmar was given for export. Myanmar’s proven petroleum gas reserve lies between 6 and 32 times the energy value of proven oil reserves, according to whether the Ministry of Energy or US Energy assessments are correct. Pending further discoveries of oil, it is only Myanmar’s petroleum gas that can be considered to be a strategic resource – it is in demand internationally, whereas locally gas could potentially be allocated to pharmaceutical and chemical industry processes, to fertilizer production, to the production of refined petroleum products, to power production, for passenger vehicles, and as a cooking fuel as economic development takes place. In recent years the Government has considered the possibility to establish an LNG terminal to supplement indigenous natural gas supplies.
3. Biodiesel / bioethanol production in Myanmar is currently limited to only a few production facilities. Existing bioethanol facilities have more or less stopped production due to lack of subsidies and no information indicating new facilities being under construction was found. Only pilot scale biodiesel facilities have been built in Myanmar, which are producing small amounts of biodiesel for use by agricultural machinery. Approximately ten years ago Myanmar began an ambitious biofuel implementation program with a plan to plant a total of 3.5 million hectares of jatropha curcas trees. The program was unsuccessful failing to live up to the expectations of making Myanmar self-sufficient as far as the demand for diesel goes. The estimated yield of the jatropha trees planted as part of the program is not available, but considering that several reports have claimed that jatropha plantations covered an area of approximately 2 million hectares, the trees seem to have offered a significant source of non-edible oil that could be used for the production of biodiesel
B. Liquid & Gaseous Fuel Strategy
4. Refined Oil Products. The first step in defining the strategy for liquid fuels is to identify what should be done with the country’s existing refinery capacity. Three small refineries are currently in operation in Myanmar, but all three are old and their operating efficiency is low. Even if The Myanmar Petroleum Enterprise decides to upgrade at least one of the existing refineries, the throughput will not be sufficient to cover the increasing demand; hence the strategy for liquid fuels must be based on construction of new capacity and / or by importing. For the imports there are initial plans for a new import terminal, which could at a later stage support a new local refinery. However, it is believed that a small scale coastal refinery may not be economically feasible under the competitive pressure from large, world class refineries in the Middle East, India and Southeast Asia.
ADB TA 8356-MYA Myanmar Energy Master Plan Final Report
548
5. Myanmar has the right to use 50 000 bbl/day of the transfer capacity of the Sino-Burma pipeline, which could be used as a feedstock for a potential new refinery. Locating a refinery inland, adjacent to the pipeline, could result in a competitive advantage as production would be close to consumption which would in turn reduce transportation costs.
6. Accordingly it is recommended to undertake a detailed feasibility study for a new inland oil refinery. The concept is based on the development of a small, low complexity inland oil refinery that is powered by residual heavy distillates (supplemented by a small coal-fired power plant using Myanmar coal). The strategic advantage of this approach is that a low complexity refinery does not require a supply of natural gas. The sizing of the refinery at 50,000 bpd is consistent with Myanmar’s quota of Arab heavy sour oil, furthermore, the liquid fuel demand of the transport sector requires a balanced production of gasoline and diesel fuel which leads to efficient refinery operation. The economic feasibility of this proposal is largely based on the inland location of the refinery (at the pipeline) with associated low cost to transport fuel to consumers. Intangible benefits relate to the tradition of refining in Myanmar through the three existing refineries; refining provides the domestic industry sector with added depth, supporting the existence of a downstream industry. On the other hand a small refinery will no supply all of Myanmar’s highly refined petroleum product needs – while the transport and industry sector needs can be satisfied, imports of diesel fuel will be required to meet the demands of agriculture up to 25% of total by 2030.
7. Natural Gas. The projection for gas supply – demand shows that the outlook is tight. The following supply – demand projection shows that the M3 gas field will be needed to meet demand. If there is any delay to the development of the field would result in a sustained supply shortfall from 2018.
Figure I-1: Projections for Natural Gas Supply & Demand by Sector
Source: Consultant’s analysis
ADB TA 8356-MYA Myanmar Energy Master Plan Final Report
549
Figure I-2: Projection for Gas Supply (JICA 2014)
Source: JICA (2014)
8. There is an opportunity to manage the risks that natural gas supplies do not develop as anticipated. If required, fuel imports can be used to supplement the supply to the transportation and agriculture sectors to release the capacity required to serve the industry and power sectors. Nevertheless, ahead of the development of firm supplies of natural gas, it is considered as a prudent practice to minimize the use of natural gas in the power sector in favor of allocation to industry.
9. Moreover a local refinery can be designed to minimize gas consumption. Power at peak times could be provided by additional storage hydropower or gas / oil plants mainly powered by oil to conserve gas. A fertilizer plant appears to be uneconomic and gas will be saved by importing urea. An LNG terminal would deliver gas at international prices but would be expensive for Myanmar, particularly for the power sector. Moreover the development of an LNG terminal would take at least 5 years. In the recent past it was considered that the M3 field would commence operation in 2019 but recent developments in Thailand and the depressed international prices for oil and gas is expected to result in an indefinite delay. It is recommended that the development of an LNG terminal is considered in conjunction with the timing of the M3 field, and in the meantime a detailed study of industry need for gas is undertaken complete with a Willingness-to-Pay assessment to establish the viability of high-price LNG imports (and therefore the viability of an LNG terminal).
10. In summary, gas could be reserved for industry and the power sector. Other demands could be met by alternative means. The decision to pursue alternatives, such as an LNG terminal, can be decided as a matter of government policy as the natural gas supply – demand balance unfolds in the coming years.
11. Biofuels. In future diesel and gasoline production could be supplemented by production of biodiesel from oily plants and of bioethanol from starchy crops. Considering the large surface area
ADB TA 8356-MYA Myanmar Energy Master Plan Final Report
550
and good growing conditions in Myanmar, liquid fuels produced from renewable feedstock could play a significant role in the supply of transportation fuels.
12. Other crops could also be utilized for the production of biodiesel, but the first step recommended to be taken is to identify the current state of the planted jatropha trees and the means that are available for improving the yield from these trees. Afterwards the focus should be shifted on harvesting methods and defining how the seeds are best processed into biodiesel and whether this should be conducted in large facilities or on a community level.
13. Use of bioethanol should also be considered. Sugarcane, whether used as whole or only in the form of molasses seems to present the most cost-effective way of producing bioethanol utilizing first generation production technology. The concept of blend wall, meaning in essence that approximately 10 % bioethanol can be blended with gasoline without the need for updating the vehicle fleet is coming less important as flex-fuel vehicles, either new one or retrofits, have proved a low-cost solution to pursue consumer side interest in bioethanol fuel.
14. Both biodiesel and bioethanol seem economically feasible for Myanmar. A biofuel policy with set mixing targets for 2020 and 2030 is recommended. Assuming a 10 % target for both diesel and gasoline by 2020, and 20 % target by 2030, transport de-carbonisation case can be developed. Alternative scenarios are discussed in this report, namely a base case, a small inland refinery case, and domestic biofuel case, and their impacts to the supply side of liquid fuels until 2030 in Myanmar.
II. PETROLEUM FUELS
C. Introduction
15. Myanmar’s liquid fuel production capacity is insufficient for satisfying the growing demand for liquid fuels in the transportation sector. However, increased dependence on imported petroleum products poses a risk to national fuel security and is a burden on the nation’s trade balance.
16. The expansion of a local refinery has been under consideration of the government. The cost and benefits of such an expansion are discussed in detail. The possibility to supplement the current oil based liquid fuel system with biodiesel and bioethanol to satisfy transport demands is also discussed. However, the demand for liquid fuels outside of the transport and industry sectors is not considered. The agriculture sector demand for diesel is expected to grow, to support farm mechanization, but this demand is relatively uncertain compared to that of the transport and industry sectors. Again, biodiesel and bioethanol could be attractive alternatives to petroleum products for agriculture, due to the close proximity of the feedstock, otherwise the agriculture sector could be supplied by imported fuels until the trend towards agricultural mechanization is better established.
17. A concept for increasing Myanmar’s oil refining capacity is introduced. The concept is based on a relatively small inland refinery with feedstock sourced from the Sino-Burma pipeline. The expected competitive advantage of the refinery against some of the large scale refineries located at Southeast Asia lies in its inland location, which minimizes the costs related to transportation of the refined products to the local inland market. The size of the refinery is dictated by the quota of 50 000 barrels per day (bbl/day) Myanmar has for the Sino-Burma pipeline. The concept of an inland refinery based on crude in the Sino-Burma pipeline has been criticized for its choice of crude, which is ultimately determined by the Chinese off-taker. Local crude is of different quality, and can be
ADB TA 8356-MYA Myanmar Energy Master Plan Final Report
551
utilized only partly in the contemplated concept. Therefore, an alternative idea of having crude receiving terminal at the coastal area of Myanmar, and a possible local refinery at a later stage attached to it, which would be able to process a mixture of imported and domestically sourced crude oil. Whilst an import terminal may be needed for Myanmar’s continuing need to import petroleum products, it is believed that it would be difficult for a finery of relatively modest capacity in international standards to find competitive advantage against new Middle Eastern, Indian and Southeast Asian refineries, many of which represent large scale, cost competitive refinery concepts and latest technology, but there could be a clear location based advantage for an inland refinery, which, however, needs to be proven by thorough feasibility analysis.
Table II-1: Myanmar Petroleum Fuel Sales Projection (in boe/day)
18. Information presented in Table II-1 is also presented in Figure II-2 to highlight the expected increase in demand for liquid fuels in Myanmar.
Figure II-2: Demand of Petroleum Fuels in Myanmar
19. Considering that the combined demand for diesel and gasoline in Myanmar is currently about 30 000 bbl/day (not including illegal imports), and that only the Thanbyakan refinery is capable of producing diesel and gasoline at 10 000 bbl combined per day, without a significant increase in
ADB TA 8356-MYA Myanmar Energy Master Plan Final Report
552
local refining capacity Myanmar will become increasingly dependent on imported petroleum products with attendant fuel security concerns.
20. So as to further elaborate the issues surrounding fuel security, the Consultant has developed a new oil refinery concept for Myanmar, the merits of which concept, however, need to be analysed by a more comprehensive feasibility analysis. The concept is discussed in the following sections.
21. Options for Oil Refinery Investment. Three options have been identified for development of the oil refinery sector in Myanmar. The identified options are:-
1. To invest in a small inland refinery by the Sino-Burma pipeline to cover the growing need for
transportation fuels at the inland market;
2. To invest in a medium sized refinery to cover the need for transportation fuels in the whole
country;
3. To invest in oil refining sector and build a globally competitive oil refinery producing high
quality liquid transportation fuels to cover the domestic demand and to be exported to the
Asia Pacific petroleum product markets.
22. Small Size Refinery. Out of the three identified alternatives, the first one seems most attractive. It could be realized by lowest capital investment and its inland location would offer competitive advantage as both the feedstock from the Sino-Burma pipeline as well as the target market would be in the close proximity of the refinery. A small refinery size would also fit well with Myanmar’s quota of 50 000 bbl/day from the Sino-Burma pipeline.
23. Middle and Large Size Refinery. Due to Myanmar’s limited oil quota (50 000 bbl/day) to the Sino-Burma oil pipeline, middle or large size refinery cannot be considered to be built inland. A coastal refinery would not have the advantage of being in the middle of the country where there is direct access to the transportation fuel market of Myanmar’s second largest city Mandalay. Middle and large size refineries would need significant quantities of natural gas for cracking of heavy distillates as the demands for refinery residues and heavy products are not expected to experience large scale growth. As the availability of natural gas is unclear, building a middle or large sized refinery might require constructing an unloading terminal for liquefied natural gas (LNG). An LNG terminal would not only significantly increase the investment cost but due to the high LNG price at the Asia Pacific market, it would also increase the refinery’s operating costs remarkably. A middle size refinery could be an attractive proposition in the event that domestic natural gas production was to grow, or other sources of natural gas could be secured below the market price for LNG. However, according to what is known at the present time, both middle and large size refineries appear to be unattractive under the current circumstances; therefore this report only develops the option of investing in a small scale refinery.
D. Investment in a Small Size Refinery
24. A small size refinery would enjoy a competitive advantage against refineries located in neighbouring countries, such as the new Paradip Refinery in India. The advantage would be gained in the lower transportation cost of both the feedstock and of the refined products to consumers More than half of Myanmar’s population lives in landlocked states and regions and of the 12 major cities only four – Sittwe, Yangon, Pathein and Mawlamyaing – have direct access to or are located very close to the sea (see Table II-3 and Figure II-4). If transportation fuels were also in future mostly imported e.g. from the Paradip Refinery, it would be necessary to unload fuel at the major port cities, then to transport by road, river barge or by rail to the landlocked regions and cities.
ADB TA 8356-MYA Myanmar Energy Master Plan Final Report
553
25. The refinery would mostly use the Arab Heavy Blend (Heavy, Sour) available from the Sino-Burma pipeline as a feedstock, supplemented by small quantities of the local heavy sweet crude sourced from local onshore oil fields. Freight costs and quality differences between the condensate produced at the offshore oil and gas fields and the Arab Heavy Blend suggest that it could be more cost-effective to export the condensate to neighbouring coastal refineries than transporting it to a domestic inland refinery.
26. The sea freight cost for supplying the fuel from Paradip Refinery to coastal cities like Sittwe and Yangon would be approximately 1.5 – 2.5 $ per barrel. Furthermore, the freight cost for transporting the fuel from Sittwe e.g. to Mandalay Region would add another 2.5 – 3.5 $ per barrel. If production is located in close proximity to consumption, a significant competitive advantage would be gained according to reduced freight costs. Another item that must be considered is the economy of scale. A large refinery such as Paradip (300 000 bbl/day) benefits from reduced operating costs. The difference in operating costs between a large scale and a small scale refinery is around 1 – 2 $ per barrel depending on the complexity of the smaller refinery.
ADB TA 8356-MYA Myanmar Energy Master Plan Final Report
554
Figure II-4: The Sino-Burma Pipeline1
27. Three different scenarios for the estimated freight costs are shown in Table II-5. The scenarios are chosen based on the distance of the demand from the inland refinery (short, medium and long distance). As can be seen from Table II-5, a small inland refinery would face serious competition when it comes to the transportation fuel market of Myanmar’s coastal cities. Yangon International Airport would for example most likely continue to import jet fuel even in the case a small domestic refinery was built.
28. Note that the freight cost of crude oil from the Middle East to the deep water port at Kyaukpyu
1 Landlocked and coastal regions are indicated with a purple colour, the approximate location of the Sino-Burma pipeline with red.
ADB TA 8356-MYA Myanmar Energy Master Plan Final Report
555
were not taken into account in calculations presented in Table II-5; it was assumed that the freight cost of crude oil would be approximately the same to all refineries in neighbour countries.
Table II-5: Freight Cost Comparison2
All figures in $ per
boe
Average Distribution Cost of
Transportation Fuels to Inland
Consumers
Average Distribution Cost of
Transportation Fuels to
Consumers at Coastal Regions
Pipeline
Transportation
Cost of Crude Oil
in Myanmar
Truck
& Rail Sea Total
Truck &
Rail Sea Total Total
Large Neighboring
Coastal Refinery
$2.50 $1.50 $4.00 $1.00 $1.50 $2.50 $0.00
$3.25 $2.00 $5.25 $1.75 $2.00 $3.75 $0.00
$4.00 $2.50 $6.50 $2.50 $2.50 $5.00 $0.00
Small Domestic
Refinery in Mandalay
$1.00 $0.00 $1.00 $2.50 $0.00 $2.50 $0.30
$1.75 $0.00 $1.75 $3.25 $0.00 $3.25 $0.60
$2.50 $0.00 $2.50 $4.00 $0.00 $4.00 $0.90
Distribution Cost
Difference
To Inland Consumers To Consumers at Coastal Cities
$2.70 -$0.30
$2.90 -$0.10
$3.10 $0.10
29. According to Table II-5, a small domestic inland refinery would have a clear freight cost advantage against its competitors in Myanmar’s inland transportation fuel markets. Based on the population spread presented in Table II-3, inland transport fuel sales can be assumed to account for approximately 60 % of the total sales. According to the demand prognosis (Table II-1) Myanmar’s total gasoline, diesel and jet fuel consumption in 2030 would be around 81 000 boe/day and assuming that consumption would increase evenly in inland and coastal regions, the total inland consumption in 2030 would be 48 500 boe/day.
2 The table presents three cases: best, average and worse depending on the distance between the inland refinery and the point of demand – the reduction in revenue in pipeline tariff is assumed to be $0.3 for the best case and $0.9 for the worst case.
ADB TA 8356-MYA Myanmar Energy Master Plan Final Report
556
30. One of the main uncertainties of the presented small inland refinery business case is the tariff revenue that Myanmar gets for transporting oil to the People’s Republic of China (PRC) along the Sino-Burma pipeline. In the calculation presented in Table II-5 it was presumed that PRC pays Myanmar a transportation fee for each barrel they receive and that the operating margin Myanmar receives for oil transportation would be 0.3 $, 0.6 $ or 0.9 $ per barrel. The pipeline transportation tariff rate could have a major impact on the profitability of the refinery since oil used at the refinery would reduce the income from oil transport to PRC.
31. In addition to the competitive advantage that an inland refinery could have against other refineries it is important to understand the total refinery margin. Refine margin is the difference in total price of the products that a refinery sells minus the price of the feedstock. The total operating margin per barrel is calculated by deducting the operational costs from the refining margin. In general a more complex refinery has a higher refining margin and a higher investment cost. More complex refineries are capable of using cheaper heavier oil blends with higher sulphur content whereas simpler refineries have to buy lighter oil blends with lower sulphur content. The most common crude oil blends and their characteristics are shown in the Figure II-6.
Figure II-6: Characteristics of Crude Oil Blend
Source: EIA (2014)
ADB TA 8356-MYA Myanmar Energy Master Plan Final Report
557
32. There are numerous variations for how the oil refining process could be designed. Each oil refining process has different functions and yield profiles which directly affect the refining and operating margins. One way of simplifying numerous different oil refinery processes is to sort them into four generalized categories according to their process complexity as presented in Table II-7.
Table II-7: Generalized Process Complexity Categories
33. Since the goal is to achieve maximum production of high quality transportation fuels, and the main feedstock is assumed to be heavy and sour (Arab Heavy) from the Sino-Burma pipeline, for a satisfactory refining margin to be achieved a small inland refinery must have intermediate or high process complexity. A hydrocracking refinery using heavy and sour feedstock produces significantly more middle distillates (diesel and jet fuel) than a catalytic cracking refinery.
34. An example of the product slate received from different refinery configurations is shown in Table II-8. It should be emphasized that today’s modern hydrocracking and deep conversion refineries are relatively flexible giving the refiners control over the proportion of middle and light distillates that are produced. In Table II-9, the differences in the product slate are converted into sales according to the average market prices at New York and Rotterdam between October 1, 2013 and September 30, 2014. It can be seen that with crude prices of the same period exceeding 100 $/bbl hydro-skimming and catalytic cracking type of refineries are not feasible, and many of such types have not been developed anymore except under special circumstances.
35. It has to be noted that the prices of the residue and heavy products have significant differences depending on their location. Furthermore, the refinery configurations given in Table II-8 and Table II-9 have been generalized and the exact product slate in the residue and heavy products category is also depended on the exact production line configuration of the refinery within the given generalized refinery configurations. For example a deep conversion refinery can have a fluid coking unit that, as a residue, produces low energy content gas that cannot be sold outside the refinery but can easily be burned in process furnaces. Alternatively a refinery can have a delayed coking unit that produces coal-like petroleum coke as a residue that can either be sold or used in a circulated fluidized bed boiler for refinery’s steam and electricity production.
ADB TA 8356-MYA Myanmar Energy Master Plan Final Report
558
Table II-8: Examples of the Product Slates by Refinery Configuration
Product Hydro skimming Catalytic
Cracking Hydrocracking
Deep
Conversion
Gases (Propane, Butane etc.) 3 % 2 % 2 % 2 %
Light Distillates 14 % 32 % 18 % 18 %
Middle Distillates 29 % 27 % 58 % 65 %
Heavy Products 27 % 19 % 14 % 11 %
Residue 27 % 18 % 8 % 4 %
Table II-9: Example of Oil Product Sales by Refinery Configuration
Total Price per Barrel of Oil $85.33 $93.49 $106.96 $111.53
36. An oil refinery consumes a significant amount of energy in process furnaces and in form of steam and electricity. In addition to energy consumption, a hydrocracking process requires also significant quantities of hydrogen. The lack of natural gas for domestic consumption in Myanmar means that the refinery’s energy supply and production configuration cannot be standard, as natural gas is often the main source for steam and electricity generation and in most cases it is also the most important source of the hydrogen used by the hydrocracking unit. For the small inland refinery, the energy supply could be based on a combination of coal, refinery residue and petroleum coke from the delayed coking unit. The investment cost of a combined heat and power plant burning solid fuel with a high sulphur content, would be significantly higher than the cost to build an ordinary combined cycle gas turbine power plant, but the power plant investment could be made in co-operation with a local power generation company and the power plant could in addition to the refinery’s energy needs also generate electricity to the national power grid.
37. For a hydrocracking unit with capacity between 15,000 and 20,000 barrels per day about 45,000 – 60,000 cubic meters of natural gas per day would be needed for hydrogen production. The exact amount of natural gas consumption depends on the feedstock and the desired product slate.
ADB TA 8356-MYA Myanmar Energy Master Plan Final Report
559
Production of light distillates such as gasoline requires more hydrogen than the production of middle distillates such as jet fuel, diesel and heating oil. Since it is unlikely that there is enough natural gas for a hydrocracking unit, the ideal configuration of a small inland refinery could be based on a catalytic cracking design with a delayed coking or vis-breaking unit. In principle this configuration could operate without any natural gas, instead steam and electricity could be produced by using the refinery residues, coal and petroleum coke. A refinery with catalytic cracking and delayed coking configuration (no hydrocracking) would produce more low value refinery residue and heavy products but the deficit in natural gas supply means that the demand for the refinery residue and heavy products would be stable.
38. An example of the potential production capacity of a refinery designed to use Arab heavy sour oil, is presented in Table II-10. A process schematic of the envisaged refinery is given as Figure II-11.
Table II-10: Refinery Process Capacity
Production Unit Capacity (bbl/day)
Atmospheric Distillation 50 000 – 60 000
Vacuum Distillation 20 000 – 25 000
Delayed Coker or Visbreaker 8 000 – 9 000
Fluid Catalytic Cracker 20 000 – 25 000
Naphtha Hydrotreater 10 000 – 14 000
Catalytic Reformer 10 000 – 14 000
Kero/Jet Reformer 4 000 – 5 000
Diesel Hydrotreater 10 000 – 12 000
Alkylation Unit 5 500 – 7 000
Isomerizer 8 000 – 10 000
ADB TA 8356-MYA Myanmar Energy Master Plan Final Report
560
Figure II-11: Schematic of Concept Refinery Process
ADB TA 8356-MYA Myanmar Energy Master Plan Final Report
561
39. Due to the high share of residue and heavy products produced by a catalytic cracking refinery, the optimal throughput capacity could be more than 50 000 barrels per day. A feedstock capacity of 50 000 barrels per day would yield approximately 35 000 boe per day in transportation fuels even if in addition to the catalytic cracking unit a delayed coking or vis-breaking unit were to be added. Additionally, refinery downtime would reduce the total yield by 8 – 10 % which means that the total transportation fuel output would be about 20 % lower than the predicted inland consumption in 2030 (40 500 boe per day). However, due to the relatively low refinery complexity and the possibility for outsourcing the steam and electricity production, the total investment cost of the small inland refinery with catalytic cracking and delayed coking or vis-breaking could be under 1 200 million US dollars even if the feedstock capacity were to be slightly increased.
40. Figure II-12 and Figure II-13 present the total production of diesel and gasoline compared to the estimated demand (as presented in Table II-3). The demand presented is the estimated total demand, so it can be assumed that part of the local production deficit will be balanced by imports especially to the coastal regions. Figure II-12 shows the diesel demand of the transport sector by a green line. As all of the gasoline demand is for transport sector, one can observe from the graphs that the conceptual 50 000 bbl/d refinery would cover most of domestic transport sector fuel demand. If liquid biofuels were to be introduced to the supply portfolio, Myanmar could achieve almost full fuel independence for at least the first years of refinery operation.
Figure II-12: Estimated Diesel Demand & Production
Source: Consultant’s analysis
41. In the future, once the technologies for producing renewable transportation fuels in the form of biodiesel and bioethanol become more advanced and therefore more cost competitive, the production of the new refinery can be supplemented with a construction of both biodiesel as well as bioethanol production facilities to further improve Myanmar’s supply security. The size of the facilities producing renewable transportation fuels should be determined, once the final configuration of the small refinery is known. Considering the current demand forecasts, there seems to be a larger need for a facility producing bioethanol that could be blended with gasoline to reduce the supply deficit. It would be wise to locate the possible biodiesel and bioethanol production facilities closer to coastal regions to achieve a good nationwide balance between supply and demand. Biodiesel and bioethanol are discussed in more detail in Section VII.
ADB TA 8356-MYA Myanmar Energy Master Plan Final Report
562
Figure II-13: Estimated Gasoline Demand & Production
Source: Consultant’s analysis
42. Feasibility of the Small Inland Refinery. The feasibility of an investment in a small inland refinery is mainly dependent on the heavy product consumption and energy supply of the envisaged inland refinery, as well as future investments in oil refineries in neighboring countries. Even though the small inland refinery will benefit from lower freight costs and from the relatively low price of the Arab Heavy Blend oil, the refinery complexity will remain moderate until a cost effective natural gas supply can be made available. Energy supply (steam and electricity) often accounts up to 40 % of the refinery’s operating expenses and so the cost of the energy supply largely determines the net benefits case.
43. The most effective way to organize the energy supply of the refinery would be a large scale power plant based on circulated fluidized bed boiler that would be able to utilize refinery residues and coal and, in addition to supplying energy to the refinery, could sell electricity to the grid.
44. Feasibility is also affected by the development of competition from the refineries producing in neighbouring countries and willing to sell to Myanmar. This risk appears to be small. Apart from the Paradip Refinery in India, which is expected to start operation in 2015, there are no new large scale refineries under construction. It is anticipated that the Paradip Refinery’s production will be mostly sold at the Indian domestic transportation fuel market.
E. Conclusion
45. Myanmar’s economy is expected to grow at a rate of 7.1%, which will result in an increase in the demand for liquid fuels – a demand which is currently covered mainly with imported hydrocarbons. Covering the liquid fuel needs of the growing economy with imports would negatively affect Myanmar’s trade balance in the future – identification of local alternatives is therefore wise. Some possibilities for initiating local production of both fossil and renewable based liquid fuels were presented in this report.
46. The first step in defining the strategy for liquid fuels is to identify what should be done with the
ADB TA 8356-MYA Myanmar Energy Master Plan Final Report
563
country’s existing refinery capacity. Three small refineries are currently in operation in Myanmar, but all three are old and their operating efficiency is low. Even if The Myanmar Petroleum Enterprise decides to upgrade at least one of the existing refineries, the throughput will not be sufficient to cover the increasing demand; hence the strategy for liquid fuels must be based on construction of new capacity and / or by importing. For the imports there are initial plans for a new import terminal, which could at a later stage support a new local refinery. However, it is believed that a small scale coastal refinery may not be economically feasible under the competitive pressure from large, world class refineries in the Middle East, India and Southeast Asia.
47. Myanmar has the right to use 50 000 bbl/day of the transfer capacity of the Sino-Burma pipeline, which could be used as a feedstock for a potential new refinery. Locating the refinery inland, adjacent to the pipeline, could result in a competitive advantage as production would be close to consumption which would in turn reduce transportation costs. According it is recommended to undertake a detailed feasibility study for a new refinery.
III. NATURAL GAS
F. Introduction
48. Myanmar’s natural gas is in demand internationally whereas locally, Myanmar’s natural gas could potentially be allocated to fertilizer production, as a fuel for the production of refined petroleum products, to industry, to the power sector. LPG could also be produced and used as a cooking fuel.
49. At the present time Myanmar’s proven reserves of gas are insufficient to meet the projected demands of all sectors of the economy. Given the relationship between GDP growth and natural gas supply, it is considered that Myanmar’s natural gas should be allocated to export, to fertilizer production and to industry.
G. Power Sector Consumption
50. There is a role for gas in power generation, potentially supplemented by liquid fuels. The existing (and under construction/development) capacity for gas based power will be about 1 700 MW within a few years, which would consume over 200 MMCFD when simultaneously in operation. Given the relative uncertainty surrounding hydropower development with storage capacity, as reserve capacity needs increase to 2030, and if gas would be used to meet this capacity need, then total gas consumption could reach as high as 1 000 MMCFD. This requirement for gas may not be able to be met through a future domestic gas quota but could instead be met by imported LNG or by light fuel oils. However, the cost of LNG exceeds 18 $/MMBtu and this means that LNG would be a very expensive solution for power generation. In principle however, power generation could comprise a gas plant capacity of less than 10% in 2030 if light fuel oil was used to fuel fast-acting reserve capacity plant. In this case, the total annual gas consumption by the power sector would be very modest; in 2020 only 18 BCF and in 2030 only 31 BCF. When the existing gas contracts governing domestic quotas expire it may be feasible to negotiate for a higher quota, or new gas fields may be discovered, but in the meantime, it is considered prudent to plan the expansion of the power sector to minimize the consumption of gas to ensure that industry needs are met.
ADB TA 8356-MYA Myanmar Energy Master Plan Final Report
564
H. Refinery
51. A 50 000 bblpd hydro-cracking refinery would require around 10 000 MMCF of natural gas to produce hydrogen and to power the refinery. This gas requirement can be much reduced by using an alternative refinery design that does not require hydrogen, and one that is powered using heavy distillates.
52. The oil supplied to the refinery will have fractions that are gaseous (condensates) and gas will be produced, some of which can be used for power production and some which can be sold to consumers for profit. Table III-1 provides an estimate of the quantities of refined oil products that would be produced by a vis-breaking 50 000 bblpd refinery, expressed in energy terms. Table III-2 provides an estimate of the gas and residue fuels that could be used to power a vis-breaking refinery, along with the residual quantities that could be sold to consumers. The residues are of sufficient quantity to power a 100 MW power plant; the residues could be stored and called upon to power reserve gas / oil plant, or the refinery power plant could be over-sized and the additional 100 MW capacity could be used to supply consumers living in the vicinity of the refinery.
Table III-1: Energy Content of Refined Oil Products (50 000 bbld)
Product Share Thermal Value
Total Energy
Content
(MJ/Day)
Gases 2% 50 6,439,500
Light Distillates 37% 46 110,308,635
Middle Distillates 29% 42 79,180,092
Heavy Products 17% 37 40,723,398
Residue 15% 35 33,807,375
Total 270,459,000
Table III-2: Vis-breaking Refinery Power Production
Fuel
Used for
Energy
Production
(MJ/Day)
Sold to
Consumers
(MJ/Day)
Used for Energy
Production
(barrels per day)
Sold to Consumers
(barrels per day)
Gas 3,219,750 3,219,750 450 450
Residue 7,511,130 26,296,245 1,250 4,375
ADB TA 8356-MYA Myanmar Energy Master Plan Final Report
565
I. Fertilizer
53. As discussed in the Agriculture Sector demand report, the use of fertilizer in Myanmar has fallen to around 10 kg per hectare. Agricultural experts Naing and Kingsbury found that a fertilizer load of 80 kg per hectare produced significantly increased yields of all major crops including rice.
54. A standard production run for a modern fertilizer plant is 1 725 metric tons per day. This equates to around 600 000 tons of fertilizer per annum. Myanmar has around 17 million hectares which means that the standard production run output would provide for around 35 kg per hectare. For the purpose of evaluation of the economics of a standard fertilizer plant, a urea production equivalent to 35 kg per hectare has been assumed. A 70 – 80 kg per hectare production could be achieved with two standard run fertilizer plants, each located in the north and south of the country.
55. Table III-3 presents an outline calculation for a standard run fertilizer plant. The plant would produce 1 000 mt of ammonia per day before adding water for conversion to 1 725 mt of urea. The natural gas requirement would be 31 mmcfd or 10 200 mmcf per annum. The investment cost would be $ 1.2 billion.
56. An economic evaluation has been conducted with the objective of determining the price of natural gas that would result in a competitive cost for locally-produced urea. The economic discounting rate (real) has been assumed as 6 % and the life of the fertilizer plant as 20 years.
57. The economic evaluation shows that the price of natural gas would need to be set at no more than $ 6 per MMBtu if a local fertilizer plant was to be cost competitive against an international price for urea of around $ 350 per mt. The gas price appears to be too low if an economic value of $ 18 per MMBtu is considered as an opportunity cost, or if the government’s current subsidized price of $ 11.2 per MMBtu is considered. Therefore it is assumed that fertilizer would be imported rather than manufactured locally.
J. Industry, Commercial, Household Sector
58. Industry uses natural gas for processes that require fine control of heat, e.g. petrochemical production. The commercial sector uses LPG for cooking, primarily in restaurants. There is also production required for household use for cooking. LPG is being imported and could continue to be imported while natural gas is in short supply and demanded by industry.
ADB TA 8356-MYA Myanmar Energy Master Plan Final Report
566
K. Natural Gas Supply – Demand Balance
59. The natural gas supply-demand balance takes into account the estimated production of the operation gas fields, based on domestic needs, and known and likely development of new gas fields.
60. The Aung Thein Kha (M3) field has been planned to start production in 2019. However, in early 2015, the new Thai government indicated that Thailand’s dependence on Myanmar for natural gas has reached a comfortable limit and further purchases may not be in Thailand’s strategic interest. This announcement, coupled with depressed international prices for oil and gas, has led to public announcements by PTT Thailand that the development of the M3 field may be indefinitely delayed. The production of other new fields are speculative, e.g. the announced find of an Indian company in Block A6 (Phyithar discovery) was not accompanied by an estimate for the commencement operation date.
61. Figure III-1 presents a gas supply – demand balance projection developed by JICA under their Electricity Masterplan. The projection includes the M3 field and other fields identified by JICA in the course of their study in 2014.
Figure III-1: Projection for Gas Supply (JICA 2014)
Source: JICA 2014
ADB TA 8356-MYA Myanmar Energy Master Plan Final Report
567
Figure III-2: Projections for Natural Gas Supply & Allocation
Source: JICA 2014, Consultant’s analysis
62. Figure III-2 provides a projection according to the worst case where the M3 and other fields are indefinitely delayed. The planning assumption capacity trajectory represents a capacity half way between JICA’s projection in Figure III-1 and the worst case trajectory. The sector demands are based on the electricity growth scenario developed in ADICAs Electricity Expansion plan and the refinery development of Section II above. Fertilizer production need for gas is included to understand the relationship between demand and available capacity. Whilst the planning assumption capacity trajectory could be considered as likely, in practice it is considered prudent to minimize gas consumption. This issue is further discussed below in terms of risk mitigation.
63. Unless natural gas development and consumption is managed through policy means, there is a real potential for significant shortages of gas within 10 years. In the past MOE has negotiated with gas suppliers from Thailand for additional gas supply to Myanmar. Also, as a separate development, MOEP has explored the possibility to purchase LNG. The principal options available therefore include demand-side measures, such as limiting gas supply to sectors outside power generation sector, or giving the industry sector high priority and the power sector priority for peaking generation needs. Policy measures could be used to shift from gas to liquid fuels in these sectors.
64. On the supply side, there is a relatively high certainty of new, feasible gas finds, although their timing is uncertain, as well as the possibility to import gas as LNG. It has been reported that Yadana gas field operator has claimed ability to sell additional gas, but the offer is of course subject to commercial negotiation. Careful assessment of the issue and evaluation of various measures is needed in order to find an optimal way forward. However, planners for electricity system expansion cannot consider any new gas-based power plants to be built prior to 2020 – and even thereafter; inclusion of any substantial amount of gas-based power capacity should be subject to identifying
ADB TA 8356-MYA Myanmar Energy Master Plan Final Report
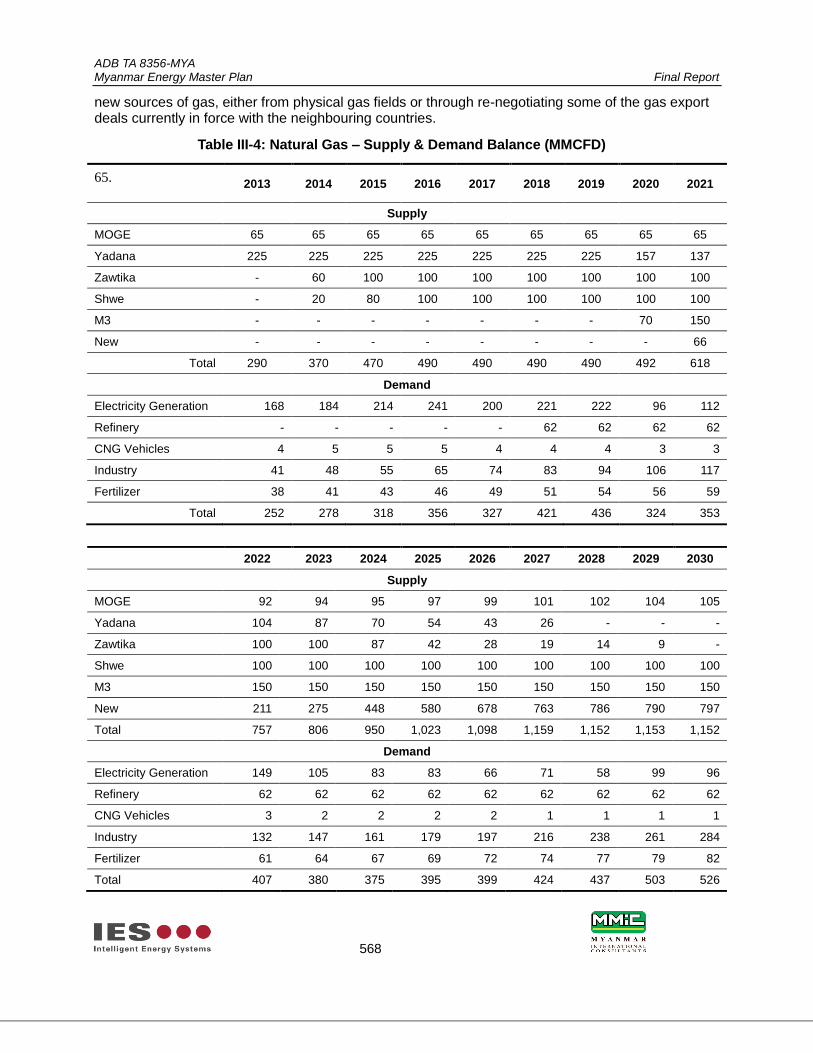
568
new sources of gas, either from physical gas fields or through re-negotiating some of the gas export deals currently in force with the neighbouring countries.
Table III-4: Natural Gas – Supply & Demand Balance (MMCFD)
ADB TA 8356-MYA Myanmar Energy Master Plan Final Report
569
66. LNG. With regard to the identified shortage of natural gas in the short run, MOEP has deliberated a Feasibility Study on the LNG receiving facilities in Myanmar, which was completed in March 2014. The study suggested location of the Floating Storage Regasification Units (FSRU) 80 km to south from the Yangon estuary where the sea depth is around 15m (satisfactory for the LNG carrier). There are three alternatives of gas pipeline landfall location; all consider gas as receiving terminal the South Dagon Junction. MOGE plans to extend the gas pipeline from South Dagon Junction to Thilawa SEZ. The purchase of the LNG was considered from LNG portfolio suppliers.
67. Specifications of the considered facilities were as follows:
FSRU storage capacity: 173,000 m3
Regasification capacity: 120 mmscfd x 4 units (1 unit is spare)
Gas pipeline length: 80 km (offshore), 50 km (onshore)
Size of gas pipeline: 24 inch
Design of jetty: Cross jetty
Expected timing: 53 months from the design to LNG supply,
including EPC 33 months
68. The feasibility study estimated the required capital costs of the facility as follows:
FSRU: 278 MUSD
Jetty: 82 MUSD
Offshore gas pipelines: 154 MUSD
Consulting fee: 15 MUSD
Interest during construction, etc.: 69 MUSD
Tax: 25.2 MUSD
Total: 624 MUSD
69. Financial analysis of the project showed good results with expected LNG price of 14 USD/MMbtu. The expected electricity tariff with LNG fuel were set at 11.3 c/kWh, which together with LNG facility cost of 0.8 c/kWh, would have resulted in electricity generation cost of 12.1 c/kWh.
70. Before the feasibility study, the MOEP had already started activities on the LNG development and related infrastructure. A tender invitation was announced in 2013 with a specification of 150 to 200 mmscfd of LNG supplied before March 2014, and 500-600 mmcfd after 2014 for the next 5 to 10 years period. In August 2013 MOEP selected 14 bidders qualified for the LNG purchase. YESB (Yangon Electricity Supply Board) has evaluated them and submitted the report to MOEP, which was further submitted to NEMC (National Energy Management Committee). NEMC has since then suspended the evaluation reports. The main challenge with the LNG project was considered the selection of the location of the FSRU. A commercial offer has also been submitted thereafter to the government, which indicated a price of approximately 18 $/mmbtu for the gas supplied from the LNG facility.
71. Realization of the LNG project is not clear at the moment. If there is a decision to realize this project, it will take a few years until its commissioned and the LNG supply begun. Also upgrade and rehabilitation of GT to GTCC requires some years for implementation. Therefore the use of liquid fuel such as light oil, crude oil and heavy fuel oil, rather than natural gas, will be needed by any thermal capacity that is developed in Myanmar to meet the short term power demand. The LNG options would be an expensive one for the electricity generation sector, and it would require
ADB TA 8356-MYA Myanmar Energy Master Plan Final Report
570
approximately five years to develop to production, and therefore other solutions should be identified and firmed up if gas based power generation is proposed.
L. Natural Gas Supply Risk Mitigation Strategy
72. There is an opportunity to manage the risks that natural gas supplies does not develop as anticipated. If required, fuel substitution can first be made in the transportation and agriculture sectors to release the capacity required to serve the industry and power sectors. However, the decision to develop these sectors may come ahead of the development of firm supplies of natural gas, in which case it can be considered as a prudent practice to minimize the use of natural gas in the power sector and for fertilizer production in favor of allocation to industry.
Table III-5: Gas Supply Risk Mitigation circa 2019
MMCF MMCFD Comment
Refinery 22,630 62 Hydro-cracking refinery needs hydrogen and
usually powered with natural gas power plant
Power 81,030 222 EMP estimate
Fertilizer 20,552 56 Standard-run production plant 1 725 mtpd
Industry 38,623 106 EMP estimate
Total ~165,000 ~548
Available gas ~150,000 ~411 Yadana, Yetagun, Shwe, Zawtika
Potential to Reduce Gas Consumption
Refinery (7,500) (21) Power the refinery using liquid fuels (30 – 40 MW)
Power sector (30,250) (83) Increase hydropower, gas / oil plant
Fertilizer (10,000) (27) Import fertilizer
Total (50,000) (137)
Source: Consultant’s analysis
73. Clearly the gas supply – demand outlook is tight. However, the refinery design can be modified to minimize gas consumption. In principle the use of gas for power generation could be replaced by oil or storage hydropower capacity for deployment at times of peak demand. A fertilizer plant appears to be uneconomic and gas could be saved by importing urea. The M3 gas field will ease the situation considerably, through an increase in capacity, however the delay in the development of the field means that a prudent approach is indicated.
74. In summary, gas could be reserved for industry and the power sector. Other demands could be met by alternative means. The decision to pursue alternatives can be decided as a matter of government policy as the natural gas supply – demand balance unfolds in the coming years.
ADB TA 8356-MYA Myanmar Energy Master Plan Final Report
571
IV. Biofuels
M. Introduction
75. Increasing use of biofuel in diesel engines is tried and tested in many markets including in Myanmar. Most current passenger cars and truck diesel vehicles are today B7 capable. The compatibility of large engines and heavy-duty vehicles with higher blends is better than for light duty vehicles. It has been estimated that about 80 % of the trucks can run safely on B30. Therefore the introduction of 5 to 10 % of biodiesel does not require specific actions or issues to be resolved but fuel suppliers can increase the level of biodiesel (Fatty Acid Methyl Ester – FAME in accordance with international EN 14214 standard, or so called advanced biodiesels with properties almost
76. Biofuel consumption is a key indicator in many countries of the deployment of renewable energy in the transport sector. Fuel ethanol already accounts for nearly 10 % of the gasoline market in the USA and a major share in Brazil. Current European fuel standards allow up to 7 volume% in diesel fuel (the most common type of biodiesel, B7) and 10 volume% of ethanol (E10).
77. Biofuel consumption is a key indicator in many countries of the deployment of renewable energy in the transport sector. Fuel ethanol already accounts for nearly 10 % of the gasoline market in the USA and a major share in Brazil. Current European fuel standards allow up to 7 volume% in diesel fuel (the most common type of biodiesel, B7) and 10 volume% of ethanol (E10).
78. Myanmar is well positioned to adopt progressive policies towards renewable fuels. The country is endowed by suitable natural resources and has already entered into several experiments for domestic biofuels production. At the same time new technologies have been developed allowing the country to step in to applying the second generation refining technologies, which allow a wider range of feedstock especially for ethanol production. At the same time car manufacturers around the world are increasingly adapting their products to allow use of higher mixing ratios of biofuels.
79. Biofuels considered for potential production in Myanmar include the following:-
a) Biodiesel – a diesel fuel obtained from non-edible oil plants (e.g. jatropha, rubber seeds
and edible oilseed crops (palm oil, coconut, rapeseed and soybean), through a chemical
reaction process. Like bioethanol, also biodiesel can be used as a fuel either alone or
blended with petroleum diesel (e.g. B20 consists of 20 % biodiesel and 80 % petroleum
diesel);
b) Bioethanol – a substitute for gasoline produced from sugar- and starch-based crops such
as sugarcane, cassava, paddy rice, or maize. Bioethanol could be used as a fuel either
alone or blended with gasoline (e.g. E10 consists of 10 % ethanol and 90 % gasoline).
80. About ten years ago the Government of Myanmar introduced a biofuel implementation program with an aim to minimize the country’s dependence on imported liquid fuels. The program was based on an ambitious plan of mass cultivating approximately 200 000 ha of jatropha curcas in each state and division. The program included plans for blending bioethanol with conventional gasoline, for establishing small scale processing plants in rural areas, and for implementing projects on biofuel production with the assistance of the FAO and ASEAN countries.
81. However, as there are currently no facilities capable of producing biodiesel or bioethanol in large scale and to the extent outlined by the Government of Myanmar at the time the biofuel implementation program was initiated, then it seems fair to conclude that the biofuel implementation
ADB TA 8356-MYA Myanmar Energy Master Plan Final Report
572
program has thus far been unsuccessful.
82. It is understood that the cornerstone of the biofuel implementation plan – cultivation of jatropha – failed due to poor planning and execution, and as the planted jatropha plants did not deliver the yields expected, the ambitious biodiesel program was eventually discarded by the Myanmar Government. Today the production of biodiesel is limited to local level facilities producing biodiesel mainly to be used by agricultural machinery.
83. For the time being, no support scheme has been identified for the production of biodiesel or bioethanol, which seemingly directly reflects the lack of new initiatives by the private sector.
84. Despite the unsuccessful implementation of the biofuel program, which is not rare because the global experience of domestic biofuel schemes is rather mixed, it should be kept in mind that Myanmar holds significant potential for liquid biofuels and they should therefore not be excluded from country’s energy mix. It is recommended that the lessons learned from the biofuel program and from the cultivation of jatropha trees are thoroughly reviewed and taken into consideration in any possible future project.
85. The following two sections, present more information regarding biodiesel and bioethanol, including some indicative calculations related to the investment cost for selected production facility configurations and consequent pre-feasibilities of domestic biofuel production.
N. Biodiesel
86. Increasing use of biofuel in diesel engines is tried and tested in many markets including in Myanmar. Most current passenger cars and truck diesel vehicles are today B7 capable. The compatibility of large engines and heavy-duty vehicles with higher blends is better than for light duty vehicles. It has been estimated that about 80 % of the trucks can run safely on B30. Therefore the introduction of 5 to 10 % of biodiesel does not require specific actions or issues to be resolved but fuel suppliers can increase the level of biodiesel (Fatty Acid Methyl Ester – FAME in accordance with international EN 14214 standard, or so called advanced biodiesels with properties almost equal to petroleum diesel) without causing vehicle compatibility problems or requiring modifications to fuel distribution, and without significant consumer involvement.
87. Biodiesel can be produced from a myriad of different plants that can be roughly divided into edible and non-edible crops. The use of edible crops for biodiesel production is controversial, as this could impact food prices and in some cases also worsen mal-nutrition in developing countries. Edible crops that could be considered for biodiesel production include oil palm, coconut, groundnut, soybean, sesame etc. Some non-edible crops that could be considered for biodiesel production include jatropha curcas, castor oil plant and rubber trees. So called third generation sources of biodiesel such as algae are currently under development. This paper focuses mainly on the use of jatropha seeds for production of biodiesel due to the fact that the number of jatropha trees in Myanmar is assumed to be significant as a result of the national effort to plant jatropha trees between 2006 and 2008.
88. Jatropha growing has potentially many benefits. It can be intercropped with many other cash crops such as coffee, sugarcane and vegetables with the Jatropha offering both fertilizer and protection against livestock. Jatropha needs at least 600 mm of rain annually to thrive but it can survive three years of drought by dropping its leaves. Jatropha is excellent at preventing soil erosion, and the leaves it drops act as a soil enriching mulch.
89. The oil content of jatropha seeds is between 36 and 38 %. The plant starts to bear fruit in 4 – 5 years after planting and economic yields start from the fifth year. The seeds of jatropha are
ADB TA 8356-MYA Myanmar Energy Master Plan Final Report
573
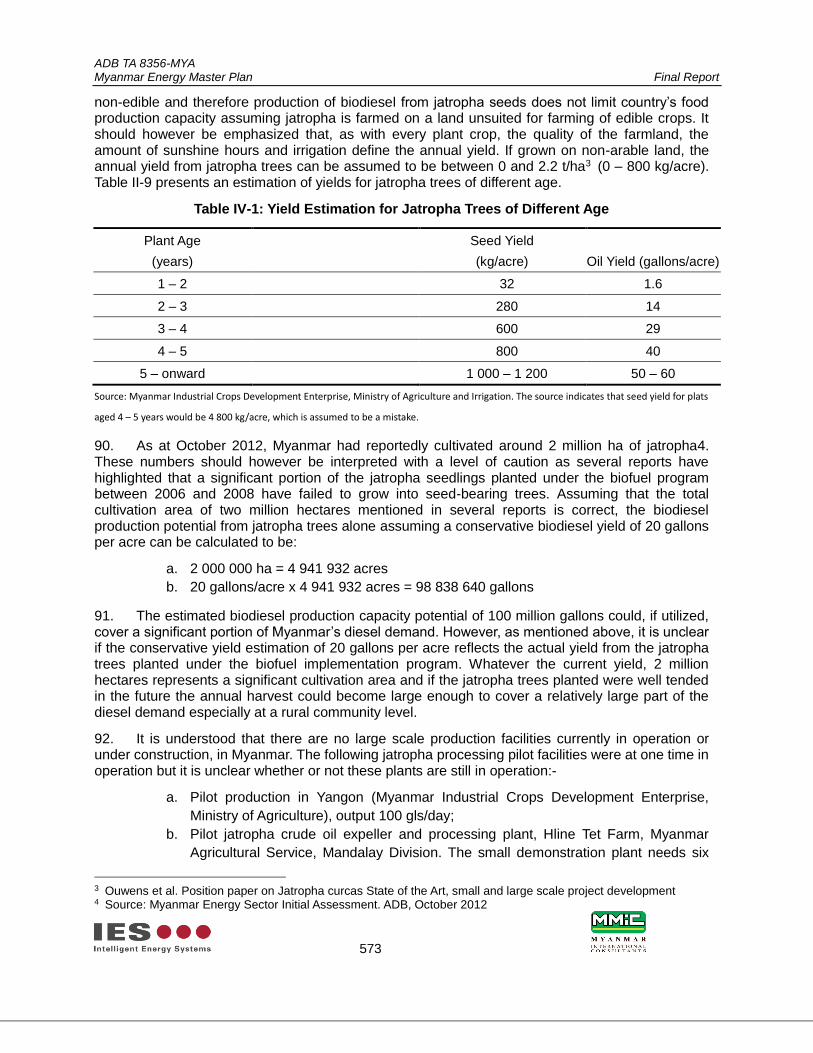
non-edible and therefore production of biodiesel from jatropha seeds does not limit country’s food production capacity assuming jatropha is farmed on a land unsuited for farming of edible crops. It should however be emphasized that, as with every plant crop, the quality of the farmland, the amount of sunshine hours and irrigation define the annual yield. If grown on non-arable land, the annual yield from jatropha trees can be assumed to be between 0 and 2.2 t/ha3 (0 – 800 kg/acre). Table II-9 presents an estimation of yields for jatropha trees of different age.
Table IV-1: Yield Estimation for Jatropha Trees of Different Age
Plant Age
(years)
Seed Yield
(kg/acre) Oil Yield (gallons/acre)
1 – 2 32 1.6
2 – 3 280 14
3 – 4 600 29
4 – 5 800 40
5 – onward 1 000 – 1 200 50 – 60
Source: Myanmar Industrial Crops Development Enterprise, Ministry of Agriculture and Irrigation. The source indicates that seed yield for plats
aged 4 – 5 years would be 4 800 kg/acre, which is assumed to be a mistake.
90. As at October 2012, Myanmar had reportedly cultivated around 2 million ha of jatropha4. These numbers should however be interpreted with a level of caution as several reports have highlighted that a significant portion of the jatropha seedlings planted under the biofuel program between 2006 and 2008 have failed to grow into seed-bearing trees. Assuming that the total cultivation area of two million hectares mentioned in several reports is correct, the biodiesel production potential from jatropha trees alone assuming a conservative biodiesel yield of 20 gallons per acre can be calculated to be:
a. 2 000 000 ha = 4 941 932 acres
b. 20 gallons/acre x 4 941 932 acres = 98 838 640 gallons
91. The estimated biodiesel production capacity potential of 100 million gallons could, if utilized, cover a significant portion of Myanmar’s diesel demand. However, as mentioned above, it is unclear if the conservative yield estimation of 20 gallons per acre reflects the actual yield from the jatropha trees planted under the biofuel implementation program. Whatever the current yield, 2 million hectares represents a significant cultivation area and if the jatropha trees planted were well tended in the future the annual harvest could become large enough to cover a relatively large part of the diesel demand especially at a rural community level.
92. It is understood that there are no large scale production facilities currently in operation or under construction, in Myanmar. The following jatropha processing pilot facilities were at one time in operation but it is unclear whether or not these plants are still in operation:-
a. Pilot production in Yangon (Myanmar Industrial Crops Development Enterprise,
Ministry of Agriculture), output 100 gls/day;
b. Pilot jatropha crude oil expeller and processing plant, Hline Tet Farm, Myanmar
Agricultural Service, Mandalay Division. The small demonstration plant needs six
3 Ouwens et al. Position paper on Jatropha curcas State of the Art, small and large scale project development 4 Source: Myanmar Energy Sector Initial Assessment. ADB, October 2012
ADB TA 8356-MYA Myanmar Energy Master Plan Final Report
574
hours to refine 100 liters of jatropha crude oil to 97 liters of refined biodiesel and cost
ca. 50,000 USD;
c. North-eastern Military Command, Lashio, Shan State; refines 240 gals of jatropha
crude oil per day. Estimated cost was 10 million kyats (circa 2008); and
d. Jatropha and Rubber Plantation in Man Pan Project (Hill 5), Lashio, Shan State.
93. Table IV-2 presents an outline calculation for two different sized jatropha based biodiesel production facilities assuming oil content of 37 % in the jatropha seeds, a yield extraction efficiency of 92 % and a loss of 2 % in the trans-esterification process. The press cake that is a by-product of the oil extraction process could be used for the production of the process steam needed for the process.
Table IV-2: Conceptual Jatropha Based Biodiesel Refinery
Plant Capacity
10 000 t/a 100 000 t/a
Biodiesel 3 336 t/a 33 359 t/a
Steam 5 000 MWh/a 50 000 MWh/a
Electricity 1 000 MWh/a 10 000 MWh/a
Investment Cost 1.5 MUSD 8.0 MUSD
94. Assuming Myanmar adopted an objective of increasing use of biofuels so that diesel fuel sold in the country consisted on average of 20 % biodiesel and 80 % petroleum diesel, the impacts of such policy can be estimated as follows:-
The cost of jatropha seeds is the single most important cost factor in jatropha based biodiesel
production representing 75 to 90 % of the production cost. There is no direct cost reference from
Myanmar available to the Consultant, but international references from Africa, India and
South-East Asia indicate that the price paid to the farmers have ranged between 120 to 170 $/ton
whilst the price of the output oil ranges from 400 to 700 $/ton (September 2014). Feedstock cost
of 170 $/ton (146,000 Kyat/ton) is therefore assumed.
The cost of steam generation is estimated only based on the capital cost of a solid-fuel boiler
plant at 12 $/MWh(th) (11,700 Kyat/MWh(th)) and electricity purchase price at 95 $/MWh (93
Kyat/kWh, representing economic long run marginal cost including generation and T&D). The
operating costs are estimated at 3 % and 2.5 % of CAPEX for the smaller and larger facility,
respectively.
The economic cost of petroleum diesel is assumed on basis on international fuel prices. For
estimation purposes the diesel cost is set at 0.73 $/liter corresponding approximately to crude
price of 100 $/bbl. The current pump price of diesel in Myanmar including transport and
distributions cost is about 0.91 $/liter (890 Kyat/liter, 4,154/Kyat/gallon).
Petroleum diesel has net heat value of 42 MJ/kg, density of 0.8 kg/liter, and CO2 emission factor
of 73.6 g/MJ, i.e. 2.51 kg/liter.
Economic discounting rate (real) is assumed at 6 % and life of the refinery at 20 years.
95. With these assumptions for the two above plant capacities the cost of domestic biodiesel is in the range of 0.47 and 0.5 $/liter (584 to 628 $/ton), on average 0.48 $/liter. Therefore blending ratio of 20 % would results in net savings of 0.25 $ per liter of diesel. Having B20 policy would
ADB TA 8356-MYA Myanmar Energy Master Plan Final Report
575
subsequently result in savings of $713 million calculated as a present value of the annual costs for 15 years until 2030. For the most part this saving would also contribute to the national trade balance as much of the transport fuels are is currently imported. Totally 11.9 million tons of CO2 emissions would be reduced. If valued at 30 $/ton of CO2 further economic savings of $ 357 million can be achieved.
96. B20 policy would result in the increase of biodiesel demand from 290 to 413 million litres, ie. 64 to 91 million gallons from year 2016 to 2030. This would require correspondingly that the about 2 million hectares (4.9 million acres), which was targeted in the mid-2000’s, would need to be brought again under active jatropha cultivation by 2030.
97. The above calculation is only for demonstrating that policy encouraging production and use of biodiesel remains desirable and seems economically and technically feasible for Myanmar. The calculation itself is highly sensitive to (i) feedstock price and (ii) reference price of petroleum diesel. Furthermore, the mixing policy would cause some economic cost on the consumer side, which is difficult to quantify, such as slightly increased operation and maintenance cost of the vehicle fleet in the event shift to B20 level be rapid and based on existing engines and fuel qualities. However, technological development work of car manufacturers is addressing these maintenance issues and selecting new materials more suited to biodiesel use than the current ones. Fast development is happening also on the production side, where different second and third generation biodiesel production methods are already entering the business.
98. The referenced diesel price corresponds roughly to crude price of 100 $ per barrel. With prices of 70 $ and 130 $ per barrel, the referenced international diesel price could be estimated at 0.51 and 0.95 $/liter respectively. With the lower level, the refinery price of biodiesel would roughly match the international diesel cost, whereas with the higher level, the present value of savings in the country’s fuel bill until 2030 would increase to $1.3 billion.
99. As mentioned earlier, international experience on developing jatropha based biofuel businesses is mixed, and many pilot schemes have failed. Assuming seed yield of 1 to 1.2 tons per acre, one acre generates 150 to 180 dollars annual income to the farmer per acre. As the sown land of most Myanmar farmers is 5 acres and less, introducing a less-income generating crops, such as jatropha, among the traditional cash crops, which provide substantially higher income, would be difficult. For jatropha cultivation, large scale specialized private agricultural companies, who also have an interest in the upstream side of the business, in production and selling biodiesel, would probably provide a more suited business model than small farmer or community based cultivation. Large private corporations should, however, address the problems encountered in the past with land allocation practices. Biofuels are still contested in many countries due to uncertainties surrounding positive environmental and social benefits, concerns about potentially negative impacts, and the manner with which land is acquired for these projects.
100. As significant amounts of jatropha trees have already been planted around Myanmar, it is recommended that it is considered, how the seeds of the jatropha trees could best be used for biodiesel production. If nothing is done, it seems possible that the significant national push for promoting the jatropha has been in vain and the planted trees might wither away. A recommended first step would be to identify the current state of the planted jatropha trees, the most suitable regions for cultivating jatropha, and the means that are available for improving the yield from the planted trees. Afterwards the focus should be shifted to harvesting methods and defining how the seeds are best processed into biodiesel and whether this should be conducted in large facilities or on a community level. Private sector driven and environmentally and socially sustainable business model for jatropha cultivation and processing should be developed.
ADB TA 8356-MYA Myanmar Energy Master Plan Final Report
576
O. Bioethanol
101. The drive towards sustainable economy has caused the governments around the world introduce ambitious policies and mandatory targets for renewable fuels. This has brought ethanol to the fuel markets. The US and Brazil together represent around 90 % of the ethanol produced and consumed in the world. In Brazil, ethanol can be used as a standalone biofuel in over half of the country's light vehicle fleet. This is because of the widespread introduction of flex-fuel cars, which can run on either gasoline or ethanol or any mixture of the both. The additional price of a flex-fuel-vehicle currently ranges from zero to about $ 2,000 per vehicle depending on the manufacturer and model. This would allow the consumer side also in Myanmar follow the extending provision of ethanol.
102. Currently, commercial bioethanol is produced by first generation (1G) technology from sugars found in arable crops, which can easily be extracted using conventional technology. The second generation (2G) technologies use non-food ligno-cellulosic biomasses such as bamboo and are on the threshold of commercialization. First generation sources of bioethanol in Myanmar include crops such as sugarcane, cassava, maize, sweet potato, yam, sorghum and rice. Second generation bioethanol could be produced from non-food parts of crops already under cultivation such as stems, leaves and husks of maize and sugarcane as well as stems, leaves and husks of non-food crops such as jatropha.
103. First generation bioethanol is produced by fermenting plant-derived sugars to ethanol in processes similar to those used for making alcoholic beverages such as wine. Second generation bioethanol production is more complicated; as an example the sugars in ligno-cellulosic biomasses are locked within a fibrous matrix and are therefore not readily available for extraction. An important consideration related to the use of bioethanol blended with gasoline is the so-called “blend wall” i.e. blending more that 10 % of ethanol with gasoline requires the use of flex-fuel vehicles as car manufacturers are claiming that blends higher than 10 % have the potential to damage conventional vehicle engines. However, as mentioned earlier and by referencing Brazil experience, the flex-fuel vehicle is already today in the market allowing up to 85 % ethanol content. Modifications to fuel distribution infrastructure could also be needed if more than 10 % of bioethanol is blended into gasoline as RE85 or similar ethanol products would need to be provided dedicated pumps.
104. The current production capacity of bioethanol in Myanmar is based on first generation biomass, especially sugarcane and maize. In the future, production of bioethanol utilizing the second generation technology for extraction of bioethanol e.g. from the non-oily parts of the jatropha tree could be considered assuming the technology becomes more accessible.
105. Since 2002, the Myanmar Chemical Engineers Group (MCE) has constructed four plants for 99.5 % ethanol production in Mandalay, Sagaing and Bago; their total capacity is 1.95 million gallons/year5. The Myanmar Economic Cooperation has furthermore built two large bioethanol plants with combined capacity of 1.8 million gallons/year6. Commercial production started at these plants in 2008. A private company Great Wall Food Stuff Industry has also built an ethanol plant (3 700 gals/day) based on sugarcane.
106. The Consultant has not come across any information indicating that any bioethanol production facilities have been established since 2008. Furthermore, the Consultant has discovered that the existing facilities are no longer producing bioethanol due to lack of legal support and subsidies.
5 Source: Myanmar Energy Sector Initial Assessment. ADB, October 2012 6 Source: Myanmar Energy Sector Initial Assessment. ADB, October 2012
ADB TA 8356-MYA Myanmar Energy Master Plan Final Report
577
107. As to maize based ethanol production, in Table IV-3 below, an outline calculation is presented for two different size bioethanol production facilities with an assumed moisture content of 13.5 %, starch content of 70 % of dry matter and ethanol yield of 50 % of the inherent starch. Similar or slightly higher yields could be expected if polished rice was used instead of maize.
Table IV-3: Conceptual Maize Based Ethanol Refinery
108. Cassava could also be considered as a suitable feedstock for bioethanol production due to its high starch content. The following Table IV-4 presents an outline calculation for two different size production facilities based on cassava assuming a dry matter content of 25 %, starch content of 80 % of the dry matter and finally ethanol yield of 50 % of the inherent starch in cassava.
Table IV-4: Conceptual Cassava Based Ethanol Refinery
Plant Capacity
200 000 t/a 400 000 t/a
Ethanol production 20 000 t/a 40 000 t/a
5.6 Million gallons/a 11.1 Million gallons/a
Steam 25 000 MWh/a 50 000 MWh/a
Electricity 8 000 MWh/a 15 000 MWh/a
Investment costs 20 MUSD 35 MUSD
109. A similar outline calculation as presented for maize and for cassava is presented for two facility sizes for both molasses as well as for sugarcane (sugarcane juice + molasses) in in Table IV-5 and Table IV-6 below. For calculation on molasses a sucrose content of 50 % and ethanol from sucrose efficiency of 50 % are assumed.
Table IV-5: Conceptual Molasses Based Ethanol Refinery
Plant Capacity
50 000 t/a 100 000 t/a
Ethanol production 12 500 t/a 25 000 t/a
3.5 Million gallons/a 7.0 Million gallons/a
Steam 15 000 MWh/a 30 000 MWh/a
Electricity 3 000 MWh/a 6 000 MWh/a
ADB TA 8356-MYA Myanmar Energy Master Plan Final Report
578
Investment costs 8 MUSD 12 MUSD
Table IV-6: Conceptual Sugarcane Based Ethanol Refinery
Plant Capacity
300 000 t/a 1 000 000 t/a
Ethanol production 15 500 t/a 51 000 t/a
4.3 Million gallons/a 14.3 Million gallons/a
Steam 15 000 MWh/a 50 000 MWh/a
Electricity 4 000 MWh/a 12 000 MWh/a
Investment costs 12 MUSD 25 MUSD
110. If sugarcane was to be used, process steam and electricity could be generated by combustion bagasse, which is a byproduct of the sugarcane production. In the future, bagasse could also be used as a feedstock for bioethanol production in a second generation bioethanol plant. As can be seen from the tables above, sugarcane can be considered as the most advantageous feedstock for the production of first generation bioethanol in Myanmar, especially on a larger scale. As with all first generation biofuels, if the production capacity of sugarcane based bioethanol is increased, it must be ensured that this does not result in shortages in food supply.
111. It is also recommended to study the ongoing second generation bioethanol projects (1 in Brazil, 1 in Italy, 3 in the USA). If a cost-competitive way for producing bioethanol from ligno-cellulosic materials becomes available, Myanmar could base its bioethanol production on more sustainable feedstocks such as maize and jatropha stover.
112. Assuming Myanmar adopted objective of shifting to a mixing standard so that all gasoline sold in the country would be replaced totally by gasohol consisting of 10 % ethanol and 90 % regular gasoline, the impacts of such policy are estimated in the following by reviewing two feedstock as an example, (i) sugarcane and (ii) maize.
113. The cost of feedstock is again the most important cost factor. At the moment, the sugar industry in Myanmar has experienced rapidly rising feedstock cost. Whilst sugarcane ton was sold at 13,500 kyat in 2007-2008, it was sold at 30,000 kyat in 2012-2013 (31 $/ton). The current level may not sustain as the sugar mills compete against globally competitive prices. There are 18 sugar mills in the country and all of them have a capacity at or below 2,000 tons of cane per day (TCD) whereas a competitive facility size can be estimated at around 10,000 TCD. The two fuel refineries of Table IV-6 represent approximately 1000 and 3000 TCD capacities.
ADB TA 8356-MYA Myanmar Energy Master Plan Final Report
579
Figure IV-1: Cane Intake Prices as Compared to Thailand and India
Source: Sun Thein, Myanmar Agriculture Sector at a Glance and its Evolution: Opportunities and Challenges, paper presented to “Investing in Sustainable Agriculture in Myanmar” Yangon, July 2014
114. Maize is an internationally traded commodity. International maize price averaged about 194 $/ton (IMF Commodity Prices) during the second and third quarters of 2014. Farmers in India sell maize at around 134 $/ton (800-840 rupees per 100 kg). Therefore, the reference price is set for the calculation at 150 $/ton (146,000 Kyat/ton).
115. The reference price for gasoline corresponding to about 100 $/bbl of crude oil price, is 0.68 $/liter. The current pump price of gasoline in Myanmar is about 1.08 $/liter (1,050 Kyat/liter, 4,770 Kyat/gallon). International ethanol prices, e.g. as quoted in Chicago or Rotterdam, vary more regionally than prices of petroleum products. The international reference price for ethanol is assumed at 0.71 $/liter, which roughly represents an average of Chicago and Rotterdam price levels.
116. Gasoline and ethanol have different fuel properties and therefore a 10 % renewable target would correspond to a volume consumption, which is not divided 90/10 in liters as in E10. Gasoline has net heating value of 42.4 MJ/kg and density of 0.75 kg/liter. Its CO2 emission factor is 73.6 g/MJ equal to 2.33 kg/liter. Ethanol has net heating value of 27.0 MJ/kg, density of 0.79 kg/liter, and no CO2 emissions if feedstock is cultivated sustainably and/or provided from excess production.
117. The 10 % mixing ratio here is assumed in terms of fuel heating value. Because ethanol has lower heating value, mixing results in higher volume of fuel consumed than without mixing. However, several studies have shown that due to higher octane value of ethanol, this relationship is not directly proportional to heating values only, but some fuel volume is saved because of efficiency gains in vehicle engine combustion due to ethanol’s octane value. When these relationships are summed up, a 10 % mixing ratio is estimated to result to a liter of regular gasoline to be replaced by 4.1 % higher volume of gasohol. With 10 % renewable energy target, the mix therefore has 85.8 % gasoline and 14.2 % ethanol when expressed in liters.
118. The maize based plant concepts provide ethanol costs of 0.53 $/liter whereas sugarcane based refining produces ethanol at 0.55 to 0.58 $/liter, both below the international reference prices
ADB TA 8356-MYA Myanmar Energy Master Plan Final Report
580
for gasoline and ethanol.7 Because resulting ethanol prices are near to each other, 0.56 $/liter is assumed as the common price for locally produced ethanol. The contemplated biofuel policy would therefore result in a small net cost of $123 million to the economy calculated as a present value of the annual costs for 15 years until 2030. Totally 5.9 million tons of CO2 emissions would be reduced. The implicit cost of CO2 reduction would be 38 $/ton. Changes to the net impact to the economy remain small even if the crude price assumptions are let to change ± 30 $/bbl.
119. The results of bioethanol policy would be more modest than those of biodiesel policy. Production of domestic biodiesel seems already now more economical that diesel imports, whereas local ethanol is of slightly higher cost than gasoline. It should also be noted that the underlying demand forecast for gasoline is less than that for diesel and the assumed blending ratio is smaller.
120. The 10 % renewable energy in gasoline policy would result to some 286 million liters (63 million gallons) of ethanol consumed in 2030, which, if all would be produced from sugarcane, would require 4.4 million tons of sugarcane to be delivered for biofuel production. Today the total sown acres for sugarcane are 180,000 hectares with an average yield of 6.58 tons per hectare.8 Therefore 670,000 hectares would be needed for biofuels if fuel ethanol production depended solely on sugarcane. This calls for having a wider feedstock base and introduction of second generation ethanol production technologies, which can utilize agricultural waste such as leaves and stalks of maize, excess bagasse and ordinary straw from rice and wheat farming.
P. Conclusion
121. In future diesel and gasoline production could be supplemented by production of biodiesel from oily plants and of bioethanol from starchy crops. Considering the large surface area and good growing conditions in Myanmar, liquid fuels produced from renewable feedstock could play a significant role in the supply of transportation fuels.
122. Biodiesel / bioethanol production in Myanmar is currently limited to only a few production facilities. Existing bioethanol facilities have more or less stopped production due to lack of subsidies and no information indicating new facilities being under construction was found. Only pilot scale biodiesel facilities have been built in Myanmar, which are producing small amounts of biodiesel for use by agricultural machinery.
123. Approximately ten years ago Myanmar began an ambitious biofuel implementation program with a plan to plant a total of 3.5 million hectares of jatropha curcas trees. The program was unsuccessful failing to live up to the expectations of making Myanmar self-sufficient as far as the demand for diesel goes. It is unclear, what is the estimated yield of the jatropha trees planted as part of the program, but considering that several reports have claimed that jatropha plantations cover an area of approximately 2 million hectares, the trees seem to offer a significant source of non-edible oil that could be used for the production of biodiesel. Other crops could also be utilized for the production of biodiesel, but the first step recommended to be taken is to identify the current state of the planted jatropha trees and the means that are available for improving the yield from these trees. Afterwards the focus should be shifted on harvesting methods and defining how the seeds are best processed into biodiesel and whether this should be conducted in large facilities or on a community level.
7 It is understood that there exists business cases where an ethanol refinery would have revenues from side products such as fodder for animal feed. It is further realized that with second generation technologies ethanol can be produced from side products and agriwaste at very low feedstock price. These aspects were ignored for the simplicity of calculating the example. 8 Crop Summary in Myanmar, by Issares Thumrongthunyawong, www.bangkokbank.com.
ADB TA 8356-MYA Myanmar Energy Master Plan Final Report
581
124. Use of bioethanol should also be considered. Sugarcane, whether used as whole or only in the form of molasses seems to present the most cost-effective way of producing bioethanol utilizing first generation production technology. The concept of blend wall, meaning in essence that approximately 10 % bioethanol can be blended with gasoline without the need for updating the vehicle fleet is coming less important as flex-fuel vehicles, either new one or retrofits, have proved a low-cost solution to pursue consumer side interest in bioethanol fuel.
125. Both biodiesel and bioethanol seem economically feasible for Myanmar. A biofuel policy with set mixing targets for 2020 and 2030 is recommended. Assuming a 10 % target for both diesel and gasoline by 2020, and 20 % target by 2030, transport de-carbonisation case can be developed. Table IV-7 below summarizes cases discussed in this report, namely base case, a small inland refinery case, and domestic biofuel case, and their impacts to the supply side of liquid fuels until 2030 in Myanmar.
ADB TA 8356-MYA Myanmar Energy Master Plan Final Report
582
Table IV-7: Liquid Fuels under Different De-Carbonization Regimes
ktoe Gasoline Diesel Renewables
Year Demand Refinery Decarbonization Case Demand Refinery Decarbonization Case Share