1 Northfield Electric Department Integrated Resource Plan 2015 - 2034 Part 2 – Transmission and Distribution Presented to the Vermont Public Service Board July 17, 2015 Submitted by: Vermont Public Power Supply Authority
Transcript
1
Northfield Electric Department
Integrated Resource Plan
2015 - 2034
Part 2 – Transmission and Distribution
Presented to the Vermont Public Service Board
July 17, 2015
Submitted by:
Vermont Public Power Supply Authority
2
Northfield Electric Department
2015 Integrated Resource Plan
Transmission and Distribution Section
INTRODUCTION
This component of the Integrated Resource Plan (“IRP”) of the Northfield
Electric Department (“NED”) addresses the transmission and distribution
components of NED’s electric system. Consistent with collaboration between
NED, Vermont Public Power Supply Authority (“VPPSA”) and the Vermont
Public Service Department (“PSD”), the format of this Transmission and
Distribution (“T&D”) section of the IRP follows the key topics contained within
the addendum to the PSD’s 2011 Vermont Electric Plan.
NED serves approximately 1,850 electric customers in Northfield, Berlin, and Moretown in Central Vermont. There are approximately 400 streetlights.
NED’s summer and winter demands are about equal in magnitude with recorded peak demands of approximately 5,000 kW in both winter and summer. Annual energy sales for 2014 were 29,570,021 kWh, and NED’s annual load factor for 2014 was 67.7%. NED is connected to the transmission system of Green Mountain Power Corporation (“GMP”) from Berlin and Irasville. NED’s load was stable for the period 2010 through 2014, but there is considerable uncertainty in the load growth forecast for 2015 through 2020. NED did not experience the predicted 2.6% growth in the prior period; however, there are three potentially substantial projects within the service territory through 2020. These projects include a new academic building and the potential for an additional residence hall on the south end of campus at Norwich University (“NU”), and a substantial expansion at Cabot Hosiery’s manufacturing facility.
3
SERVICE TERRITORY
NORTHFIELD ELECTRIC DEPARTMENT
Northfield Electric
Department Service
Territory
*Note: Village of Northfield
Electric Department became
Northfield Electric Department on
July 1, 2014.
4
NORTHFIELD ELECTRIC DEPARTMENT
SYSTEM OVERVIEW
Northfield-owned Generation:
Although NED does not own any generation resources, a privately-owned hydro facility on the Dog River at Nantanna produces about 675 MWh per year. The facility is licensed by FERC (#6757). The facility is connected to feeder 54G2 at pole # 165205.
Transmission System:
NED owns a 34.5kV sub-transmission line, wholly located within its service
territory, consisting of 1 mile of 337MCM AAC conductor between the Norwich
Total 2,259 2,212 2,231 2,223 29,487,750 29,357,949 29,333,588 29,570,021
Y/Y -2% 1% 0% 0% 0% 1%
Number of Retail Customers Retail Sales (kWh)
2011 2012 2013 2014
Peak Demand kW 5,154 4,973 5,167 5,105
Peak Demand Date 07/22/11 01/16/12 12/09/13 01/22/14
Peak Demand Hour 12 18 18 18
Annual System Peak Demand
5
The distribution system consists of 39 miles of distribution line divided into
four (4) distribution feeders in a cross-shaped configuration running generally
north-south, and east-west from the center of town out of the King Street
substation. The two longest feeders, north and south from the substation,
contain pole-mounted reclosers located at approximately their midpoint for
sectionalizing those feeders. Most of the NU load is served by a substation
located on campus that is fed by a 34.5kV sub-transmission line from the King
Street substation. NED converted the majority of the system to 12.47kV in
1999, and only a small section of 4.16kV distribution remains west of the
Northfield Commons fed from a step-down transformer at the bottom of Terry
Hill. Conversion to 12.47kV has reduced line losses and improved overall
service quality for NED customers. Power factor correction capacitors have
been installed on each of the four King Street substation distribution feeders.
Substation name and description:
NED operates two substation facilities at this time – King Street and Norwich. The substation located at NU is radially fed from the King Street substation via the 34.5kV sub-transmission line. Each substation is briefly described below.
NORTHFIELD SUBSTATIONS
King Street Substation - #54
The King Street substation is the main substation, and supplies the load to both the 12.47kV distribution system and to the NU substation via the 34.5kV sub-transmission line. This substation was upgraded with a new 7.5 MVA transformer in June 2008.
Reclosers at the substation protect the four 12.47kV distribution feeders and the 34.5kV sub-transmission line. The feeder recloser information appears below.
Feeder Voltage Manufacturer Model Control
54G1 14.4kV Cooper VWE Form 6
54G2 14.4kV Cooper VWE Form 6
54G3 14.4kV Cooper VWE Form 6
54G4 14.4kV Cooper VWE Form 6
3357 34.5kV Cooper VWVE 38X Form 6
6
The 54G4 recloser was replaced in March 2009 and the remaining 12.47kV feeder reclosers were replaced in December 2011 with Cooper VWE reclosers and Form 6 controls.
King Street Substation - #54
Norwich Substation - #55
The Norwich substation provides power to the NU campus. It is radially fed via
the 34.5 kV sub-transmission line (3357 line) from the King Street Substation.
The transformer was upgraded from 1.5 MVA to 5.0 MVA during a complete
rebuild of the substation in October 2008. There are two distribution feeders
owned by NU from this substation – the NU campus feeder 55G1 protected by a
Cooper VWE recloser, and the VT National Guard Training Center protected by
SMD-20 fuses.
Norwich Substation - #55
7
Circuit Description:
Circuit Name Description Length
(Miles)1
# Customers
by Circuit
Outages by
Circuit 2014
54G1
North to Northfield Falls,
Berlin, and Moretown, includes
Cabot Hosiery, 12.47kV
10 506 4
54G2
West to Vine Street and Garvey
Hill, includes public schools,
12.47kV
3 303 1
54G3
East to Turkey Hill and west of
the railroad tracks near the
Common, 12.47kV. Also
includes the remaining section
of 4.16kV line.
14 447 10
54G4
South to Depot Square and
South Northfield, includes
some of NU load, 12.47kV
12 548
10
1 Estimated from circuit maps
8
A One-Line Diagram of Utility System:
The following are one-line diagrams of the transmission system (the 3357 line),
the King Street substation - #54, and the Norwich substation - #55.
ONE-LINE DIAGRAM OF TRANSMISSION SYSTEM (3357 LINE)
9
ONE-LINE DIAGRAM OF KING STREET SUBSTATION - #54
10
ONE-LINE DIAGRAM OF NORWICH SUBSTATION LINE DIAGRAM OF NORWICH SUBSTATION
LINE DIAGRAM OF NORWICH SUBSTATION - #55
11
The IRP should contain a detailed description of how and when the utility
evaluates individual T&D circuits to identify the optimum economic and
engineering configuration for each circuit, while meeting appropriate
reliability and safety criteria.
Distribution System
NED has a compact service territory as a result of being a small, municipal-
owned electric utility, and has benefitted from several major system
improvements over the past 15 years. NED evaluates T&D circuits when
significant increases in customer loads are proposed that would affect the
power quality. GMP performs load studies for NED to support analysis for
responding to Ability To Serve requests. In most cases, the system capacity is
capable of supporting modest load growth within the service territory. When
the load studies indicate that the load increase will have an adverse affect on
power quality, several options for modifications to the existing circuit to handle
the increased load are proposed. The proposed solutions are evaluated for
technical feasibility, cost, reliability, and safety, and the optimum solution is
selected for implementation.
NED collects data from a variety of sources for use in prioritizing system
improvements. These sources include:
• Observations of GMP employees in the course of their contract work on the NED system;
• Load data provided by GMP from its SCADA equipment in the King Street substation;
• Observations of NED employees when reading meters;
• Act 250 requests; and
• System reliability data.
The data reported in the Rule 4.900 - overall assessment of system reliability -
report is analyzed on an annual basis to assess critical reliability issues. A
project weighting spreadsheet from GMP is used to inform decisions for system
improvements.
Transmission System
The capacity of the 3357 sub-transmission line to the Norwich substation is
adequate to supply the NU campus. No action is planned.
Efficiency
12
NED is committed to providing efficient electric servstrategy for improving system efficiency involves monitoring actual losses, and implementing system improvements to reduce system losses. These strategies are discussed briefly below.
Actual System Losses
NED calculates distribution metered system boundary retail sales. The calculation is done on an annual of unbilled energy resulting from meter reading cycles not corresponding the system boundary load as 2.36% of the metered system
The plot of system losses versus year (below) and voltage upgrade in 1999 significantly reduced system losses. The substation transformers at King Street and in 2008. Capacitor banks were added to the system in 2009 for power factor correction and voltage support.
Line Loss Reduction
The principal strategies for reducing line losses are system voltage upgrade and power factor correction, both of which have been implemented
0.00%
1.00%
2.00%
3.00%
4.00%
5.00%
6.00%
7.00%
8.00%
9.00%
19981999200020012002
Pe
rce
nta
ge
of
Bo
un
da
ry L
oa
dis committed to providing efficient electric service to its customers.
strategy for improving system efficiency involves monitoring actual system improvements to reduce system losses. These
strategies are discussed briefly below.
distribution system losses as the difference between theboundary load at its interconnections to GMP and
. The calculation is done on an annual basis to minimize the impact of unbilled energy resulting from meter reading cycles not corresponding
load measurements. NED’s system losses were6% of the metered system boundary load in 2014.
m losses versus year (below) shows that the reand voltage upgrade in 1999 significantly reduced system losses. The substation transformers at King Street and NU were replaced with larger units in 2008. Capacitor banks were added to the system in 2009 for power factor correction and voltage support.
The principal strategies for reducing line losses are system voltage upgrade and , both of which have been implemented.
200220032004200520062007200820092010201120122013
Year
System Losses
customers. NED’s strategy for improving system efficiency involves monitoring actual system
system improvements to reduce system losses. These
as the difference between the load at its interconnections to GMP and system
basis to minimize the impact of unbilled energy resulting from meter reading cycles not corresponding with
system losses were calculated
shows that the re-conductoring and voltage upgrade in 1999 significantly reduced system losses. The
were replaced with larger units in 2008. Capacitor banks were added to the system in 2009 for power factor
The principal strategies for reducing line losses are system voltage upgrade and
20132014
13
System Voltage Conversion
In 1999, the distribution system voltage was upgraded to 12.47kV. There is only a small section of 4.16kV distribution remaining within the service territory at Terry Hill and Dole Hill that is routed through the woods. A project has been initiated to evaluate upgrading that section to 12.47kV.
LED Streetlighting
In the summer of 2014, NED replaced all of the existing HPS streetlight fixtures
with LED fixtures at the request of the Northfield Selectboard in an effort to
reduce streetlighting costs. The town highway department reimbursed NED for
the stranded investment of the existing fixtures. Customer yard lights were not
replaced at that time. A program will be initiated to provide the opportunity for
customers to have an existing HPS fixture replaced with an LED unit.
Page A-10 T&D System Evaluation
1) The current power factor of the system, and any plans for power factor correction;
Power Factor Measurement and Correction
Capacitor banks were installed on each of the 12.47kV distribution feeders from the King Street substation in 2009. GMP Distribution Engineering determined the capacitance and optimum placement for each feeder based on load data. The capacitor bank information appears in the table below.
Feeder Bank Size Pole Number Location
54G1 450kVAR 161099 Doyon Road
54G2 150kVAR 160999 Maple Avenue
54G3 150kVAR 116191 Water Street
54G4 300kVAR 116341 S. Main Street
The average power factor for the distribution circuits from the King Street substation was calculated using half-hour load data of feeders 54G1 through 54G4, and 55 (NU substation sub-transmission). The data for 54G2 was adjusted to add in the 675MWh generated by the Nantanna hydro. The average power factor is 0.99 leading.
14
2) Distribution circuit configuration, phase balancing, voltage
upgrades where appropriate, and opportunities for feeder back-up;
Voltage upgrades
In 1999, the distribution system voltage was upgraded to 12.47kV. There is only a small section of 4.16kV distribution remaining within the service territory at Water Street Extension that is routed through the woods. A project has been initiated to evaluate upgrading that section to 12.47kV.
Feeder back-ups
Due to the cross-shaped pattern of the four (4) distribution feeders and the terrain of Northfield, there are limited options for feeder back-ups. Norwich will investigate options for feeder back-up designs in proximity of the King Street substation, as well as potential designs that would provide back-up capability from the Norwich substation.
3) Sub transmission and distribution system protection practices and
methodologies;
Protection Philosophy
The NED system is small and compact consisting of two distribution substations and a total of four (4) distribution feeders. Equipment protection is achieved through the use of fuses and reclosers. The substation transformers are protected by fuses on the 34.5kV primary side. Reclosers provide protection on the four distribution feeders, as well as the 34.5kV line to the NU substation. The remaining McGraw-Edison 15kV-class reclosers in the King Street substation were replaced in 2012 with Cooper VWE reclosers, and all reclosers have Form 6 controls that also provide the capability for under-frequency load shedding. There are two NU-owned feeders supplied by the NU substation. The campus feeder is protected by a Cooper VWE recloser with Form 6 control, and the transformer of the VT National Guard Training Center on the NU campus is protected with SMD-20 fuses.
Distribution feeder taps are fused, as are the distribution transformers. In 2009, GMP completed a fuse coordination study based on current loads to provide information relative to the appropriate size of
15
distribution fuses. It is possible that there exist fuses on the system that may not have been changed since the system voltage upgrade in 1999. Fuses sized for the old 4.16kV system will be of a higher current rating than required at 12.47kV and may lead to a protection coordination problem. Fuse information provided by the study will be used by line crews to randomly check installed fuses, and replace as necessary, during outage and maintenance work.
4) The utility’s planned or existing “smart grid” initiatives such as advanced metering infrastructure or distribution automation; Smart Grid
GMP currently monitors the loads and controls the reclosers and regulators at the King Street substation through its SCADA system. A SCADA remote terminal unit (“RTU”) was installed at the NU substation in 2013 through the Smart Grid Investment Grant (“SGIG”). A VELCO fiber build-out project will connect the NU and King Street substations with a fiber-optic link. Other SGIG-supported projects included replacing the SCADA battery backup bank and replacing the remaining three Type RE reclosers at the King Street substation. The new VWE reclosers that replace the Type RE devices also have Form 6 controls that provide additional control and monitoring capabilities including the capability to detect and respond to under-frequency load shedding incidents. Pole-mounted reclosers with SCADA capabilities were installed on feeders 54G1 and 54G4 to improve system reliability. These two feeders run north and south, respectively, from the King Street substation, and are the longest of the feeders. The pole-mounted reclosers coordinate with the substation reclosers, and sectionalize the long feeders. Due to the compact nature of the NED system, fault indicators may provide limited benefits to customers. However, NED will investigate costs and benefits of implementing fault indicators. In addition to participating through VPPSA in the Smart Grid collaboration and PSB docket 7307, NED is investigating the feasibility of implementing Advanced Metering Infrastructure (“AMI”) on the system using devices deployed by GMP, and using GMP as a service provider for capturing and maintaining customer usage data. GMP would provide access to NED’s customer data for billing and analysis purposes. Since GMP is contracted by NED for system operation and maintenance, integrating NED meter data to facilitate interaction with GMP’s outage management system would have the potential to improve quality of
16
service and for implementation of a Conservation Voltage Reduction program. NED is of course mindful of the many facets of the evolving grid, such as rapidly expanding net metering development, heat pump installations, and the advent of electric vehicles. Working with VPPSA, Efficiency Vermont, and other stakeholders, NED stays abreast of these developments and the strategies needed to maintain a safe, reliable, and economically viable distribution system. While definitions of “smart grid” vary even within the industry, NED is also mindful of the increasing importance of cybersecurity concerns, and the relationship of those concerns to technology selection and protection. While NED is not presently required to undertake NERC or NPCC registration, VPPSA is a registered entity, and NED’s membership of VPPSA provides NED with knowledge and insight regarding ongoing cybersecurity developments and risks. On a more local level, NED endeavors to purchase and protect its IT systems (with assistance from VPPSA as needed), in a manner intended to minimize security risks to the system and its ratepayers. NED remains mindful of the balance between the levels of cyber security risk protection and the associated costs to its ratepayers.
5) Re-conductor lines with lower loss conductors;
Conductor
NED replaced most of the overhead conductors with 1/0 AAC during the system upgrade in 1999. A small section of 4.16kV distribution remains within the service territory, and a project has been initiated to evaluate upgrading that section to 12.47kV.
6) Replacement of conventional transformers with higher efficiency transformers; Transformer Acquisition
Transformer failures create the primary need to purchase and install new transformers. GMP provides equipment and supplies for system restoration and maintenance. GMP reports that it uses a spreadsheet-based tool, developed in collaboration with the Public Service Department, to select lowest life-cycle cost equipment.
17
7) Conservation voltage regulation; Conservation Voltage Reduction
GMP monitors and controls the King Street substation through its SCADA system. NED does not currently implement conservation voltage regulation at its substations nor does it foresee doing so in the next few years until AMI is implemented that will provide load voltage information from customers at the end of the feeders.
8) Implementation of a distribution transformer load management (DTLM) or similar program (See Equipment Selection and Utilization Standards below); NED will collaborate with GMP to implement a DTLM program that is appropriate for its service territory.
9) A list of the locations of all substations that fall within the 100 and 500 year flood plains, and a plan for protection or relocation of these facilities.
Both substations are located outside of the 500 year flood plain. Neither
substation was affected by the floods of Tropical Storm Irene.
10) A current copy of the utility underground Damage Protection Plan
(DPP) (or provide a plan to develop and implement a DPP; if none exists). NED is currently drafting a Damage Protection Plan.
Discuss the utility’s process for selecting transmission and distribution
equipment (i.e., net present value of life cycle cost, evaluated on both a
societal and utility/ratepayer basis).
See Equipment section as well as Transformer Acquisition section
GMP generally does the design for new or upgrade projects and uses its
selection process for equipment.
18
Set out program to maintain optimal T&D efficiency. Report program
progress.
Reliability
System reliability is important to our customers and NED has a number of initiatives underway to improve reliability. Each of these initiatives is described below.
Animal Guards
NED experiences a few animal contact events each year so a strategy of installing animal guards on all new construction and line rebuilds has been implemented. NED believes that animal guards are a cost effective means of reducing animal contact and the associated service interruptions. GMP has been instructed to install animal guards where needed only in conjunction with other maintenance at that location.
Fault Indicators
NED does not currently use fault indicators since NED’s circuits are relatively
short and accessible. NED will conduct a cost/benefit analysis for the
implementation of fault indicators.
Pole Inspection
NED has marked poles in the system with a unique identifier that was
generated by GMP. Pole condition observations were recorded when the pole
was tagged and that information will be used to develop pole inspection lists.
Approximately 40% of the poles have been inspected by Osmose within the last
four years. NED is currently developing a plan for inspecting all poles on a 10-
year cycle.
NED does not use the NJUNS database since neither Trans-video nor TDS
Telecom use the database.
Equipment
NED is currently developing a maintenance program for its substation transformers, reclosers, switches, cutouts, and protective relays. The substation transformer in the King Street substation was new in 2008, and the substation transformer in the NU substation, which was formerly in service at King Street, was refurbished in 2008 prior to being placed in service after the substation rebuild. All four 15kV reclosers at the King Street substation have
19
been replaced with Cooper VWE reclosers with Form 6 control. The 35kV recloser was replaced in 2010. The King Street substation back-up battery bank was replaced in 2011. NED will have GMP sample and test the substation transformer oil on an annual basis for dissolved gases and evidence of degradation. GMP will be consulted regarding a maintenance schedule for the other station equipment.
NED does not currently have the ability to visually monitor its substation assets for safety and security purposes. It is anticipated that the VELCO fiber optic infrastructure to both the King Street and NU substations will provide the requisite bandwidth to support surveillance cameras to monitor those assets.
System Maintenance
NED contracts with GMP to provide system construction, maintenance, and
service restoration following outages. Much of the system hardware and
equipment has been replaced through system upgrades over the past 17 years.
Does the utility use the NJUNS database to track transfer of utilities and
dual pole removal?
NJUNS
NED does not use the NJUNS database because neither TDS Telecom
(telephone) nor Trans-video (cable TV) use the database. NED, TDS, and
Trans-video are all local utilities and can easily reach each other via a phone
call when necessary. This system has not proved to be problematic.
What is the utility’s philosophy regarding relocating cross-country lines
to road-side?
NED relocates cross-country lines to road-side when such relocation can be
done consistent with cost consideration and customer concerns in terms of
rights-of-way.
Describe vegetation management plan, per page A-13, and complete the
table on page A-14.
Explain why it's a “least cost program” including details on tree species ,
annual growth rates of these species, and vegetation techniques,
including when, where, and how herbicides are used.
Vegetative Management/Tree Trimming
20
NED has about 40 miles of total distribution and sub-transmission lines. NED
estimates about 5% of the lines run through fields that do not require tree
trimming. The remaining 95% of the lines require tree trimming. The following
table summarizes the amount of line trimmed and the cost of the trimming
over the past few years.
Total Miles Miles Needing Trimming Trimming Cycle
Sub-Transmission 0.9 miles 0.5 7 years
Distribution 39 miles 37 7 years
2012 2013 2014 2015 2016 2017
Amount
Budgeted
$50,000 $50,000 $50,000 $30,000 $25,000 $
Amount
Spent
$28,855 $23,374 $28,403 $22,408 as
of 6/19/15
x x
Miles
Trimmed
1.8
3.8
1.3
Significant tree trimming accompanied the voltage upgrade project in 1999,
and there was subsequently no formal trimming plan. NED launched an
aggressive tree-trimming initiative in 2008 to address an increasing number of
outages caused by tree contact as a result of the lack of systematic trimming.
Trimming progress is tracked by marking up a system map using billing
descriptions from Davey. NED has implemented a 7-year cycle program of 5
miles of distribution line trimming per year and trimming hot spots as
necessary.
Outage Statistics
NED tracks all outage statistics as part of its Service Quality Reliability Plan. These outage statistics allow us to examine causes by circuit and develop plans for the most cost effective reliability improvements. The following table summarizes SAIFI and CAIDI results for the past 10 years. The SQRP Report for 2014 and full outage reports are provided in the attachments to this report.
Analysis of SQRP reports for the past three years indicate that tree-related
outages and cutout failures continue to require attention. We have
implemented a robust tree-trimming strategy and a cost-effective cutout
replacement plan to address these two areas. A major outage that significantly
contributed to the increased SAIFI metric in 2014 was the failure of a regulator
in the King Street substation.
NED installed directional relays in the King Street substation through the SGIG
in early 2013 that work with the motor-operated interconnect switches to
sectionalize the sub-transmission circuit in collaboration with similar
equipment installed by GMP on its substations on that circuit. This equipment
has significantly improved system reliability and the SAIFI metric since 2013.
GMP performs service restoration work following outages for NED and outages
are reported by GMP to vtoutages.com. NED notifies customers of planned
outages either through a visit to the customer’s premises or via a telephone
call.
Utilities should monitor the # of tree-related outages as compared to the
total number of outages, and provide this information
2011 2012 2013 2014
Tree Related Outages 4 4 3 5
Total Outages 27 27 20 25
Tree-related outages as % of total outages 15% 15% 15% 20%
Storm/emergency procedures, such as securing contract crews, dispatch
center, participating in utility conference calls, updating vtoutages.com.
Unlike most other Vermont municipal electric utilities, NED does not have any
line crews. NED contracts with GMP for maintenance and outage restoration.
NED does not actively participate in the Northeast Public Power Association
(“NEPPA”) mutual aid system, since it does not have any line crew to
participate in mutual aid, and depends solely on GMP for restoration. NED
outages are entered into GMP’s Outage Management System, which in turn
feeds vtoutages.com. NED believes it is beneficial to inform the Public Service
Department if it is experiencing these types of outages.
3 Customer Average Interruption Duration Index
22
Previous T&D studies and plans for future studies.
NED commissioned a Distribution System Analysis, completed in 1994, by
Booth & Associates, Inc. of Raleigh, NC to evaluate the performance of the
distribution system and to propose system improvements. At the time of the
study, the system consisted of three (3) distribution substations and seven (7)
distribution feeders rated at 4.16kV. The Norwich and Center Village
substations were connected to the King Street substation with 34.5kV sub-
transmission lines. The primary supply to NED was, and continues to be, from
GMP’s 34.5kV sub-transmission system interconnection at the King Street
substation.
The recommendations resulting from the analysis were to:
• Convert the system from 4kV to 12kV.
• Replace the King Street substation.
• Reduce the number of circuits from seven (7) to four (4).
• Perform a sectionalizing study for operation of the 12kV system.
• Perform a capacitor placement and optimization study.
NED has implemented all of the recommendations of that report. The system
conversion to 12.47kV, reduction of the number of distribution feeders, and
rebuild of the King Street substation were completed in 1999. GMP provides
engineering services for determining the recloser settings in the substations. In
2008, a larger substation transformer was purchased and installed at the King
Street substation, and the Norwich substation was completely rebuilt using the
refurbished transformer from the King Street substation. GMP engineers
determined the power factor correction capacitor placements, and capacitors
were installed and placed in service on each of the four distribution circuits in
2009.
During the conversion, non-PCB distribution transformers were installed
throughout the system. In addition, substation equipment has been upgraded,
and non-PCB power factor correction capacitors have been installed. Only one
small section of the old 4.16kV system remains in service with possibly 10
transformers and its PCB-status should be verified. Testing requires de-
energizing and lifting the lid of older model transformers to take an oil sample.
23
It is located in a right-of-way through the woods to serve a small number of
customers. The step-down transformer feeding this section from the 12.47kV
system was recently replaced after a failure and NED does not plan to upgrade
nor relocate this section.
Most of the current NU load as well as new load resulting from campus
additions, is supplied by the NU substation. The entire campus load was
supplied by the 54G4 feeder in 2008 during the complete rebuild of the NU
substation. The NU system has an additional interconnect to the 54G4 line to
permit the entire campus to be fed from that feeder in the event that there is an
extended outage of the NU substation. However, with the recent addition of two
residence halls, and a proposed new academic building, the ability of the 54G4
feeder to support the campus load during future contingent events that would
remove the Norwich substation from service must be analyzed.
Fuse Coordination Study
GMP performed a fuse coordination study in 2009 based on current loads to provide information relative to the appropriate size of distribution fuses. It is possible that there exist fuses on the system that may not have been changed since the system voltage upgrade in 1999. Fuses sized for the old 4.16kV system will be of a higher current rating than required at 12.47kV and would lead to a protection coordination problem. Fuse information provided by the study will be used by line crews to randomly check, and replace when necessary, during outage and maintenance work.
24
The two images (above) show the older porcelain fuse cutout on the left, and a
new A.B. Chance polymer fuse cutout on the right.
GMP has recommended to NED implementing a project to systematically verify the fuse size and replace with the correct size, if necessary. Randomly replacing fuses may lead to a loss in protection coordination. Simultaneously, it is recommended to consider replacing porcelain fuse cutouts with polymer cutouts. Porcelain cutouts have been used for many years. These cutouts have frequently exhibited a failure of the cement bonding the metal elements to the porcelain body with a subsequent failure of the cutout. In the two photos (above), the left-hand image is of a porcelain cutout installed on the NED system and the right-hand image is of a new polymer cutout.
25
Historical Capital Projects over last 3 years (2012-2014):
Historical Capital Projects
2012
Installed pole-mounted reclosers on 54G1 and 54G4 feeders.
$ 91,1284
2013
Installed SCADA RTU in the NU substation; installed directional relays for use with existing motor-operated switches for sectionalizing the GMP sub-transmission line.
$ 84,391
2014
Realigned 54G4 feeder at East Street.
$ 47,256
Future Capital Projects for next 3 years (2015-2017):
Future Capital Projects
2015
Replacement of poles on Rt. 12A at the request of AOT due to a road widening project.
$ 40,000
2016
Deploy smart meters.
$ 300,000
2017
Realignment of Terry Hill circuit. $ 220,000
4 Project in 2012 and 2013 were reimbursed at 50% through the SGIG
Northfield Electric DepartmentRecord of Outages -- PSB Rule 4.900 Codes for type of outage:
Company Northfield Electric Department 1 Trees 6 Accidents
Calendar year 2012 2 Weather 7 Animals
Contact person Patrick Demasi 3 Company initiated outage 8 Power supplier
Phone number 802-485-7355 4 Equipment failure 9 Non-utility power supplier
Customers served 1,843 5 Operator error 10 Other
11 Unknown
Examples:
10-Jan 14:10 11-Jan 13:30 3G2 2 50 23.3 1,166.7
10-Jan 12:30 09-Jan 2:00 bad data 3G2 2 50
If indicated, System (if system outage) Calculated columns
Outage Start Outage end Illegal date or timeSubstation ID (if substation outage)Outage Customers Outage CustomerDay-month Hour:minute Day-month Hour:minut Please reenter data Circuit ID (if circuit outage) Code Out Duration Hours Out Comments
06-Jan 16:31 06-Jan 17:23 54G4 4 1 0.87 0.87 BROKEN CUT OUT AT TAG 116708, BAILEY RD
09-Aug 20:41 10-Aug 01:17 54G1 4 1 4.60 4.60 BAD TRANSFORMER ON DAVIS AND DICKINSON
21-Aug 13:32 21-Aug 15:27 54G4 1 1 1.92 1.92 TREE FELL ON SERVICE AND BROKE THE WIRE THEY HAVE NO POWER
05-Sep 07:52 05-Sep 09:05 54G3 4 8 1.22 9.73 HOCKMAN HILL, BROKEN CUT OUT
08-Sep 17:45 09-Sep 00:36 54G3 4 35 6.85 239.75 SANBORN: NO POWER
12-Sep 08:00 12-Sep 16:00 54G3 3 11 8.00 88.00 REPLACE A CULVERT FOR TOWN
18-Sep 11:23 18-Sep 12:58 54G1 4 90 1.58 142.50 cut out open: martin land:COXBROOK AND NORTHFIELD FALLS
20-Sep 17:16 20-Sep 18:57 54G4 10 1 1.68 1.68 DUMP TRUCK TOOK WIRE DOWN
25-Sep 18:10 25-Sep 19:33 54G2 4 92 1.38 127.27 LINE DOWN ON RABBIT PATH
27-Sep 09:27 27-Sep 10:38 54G4 7 108 1.18 127.80 CUTOUT OPEN AT 12S AND 12A DUE TO SQUIRREL CONTACT
23-Oct 16:00 23-Oct 19:00 54G1 4 40 3.00 120.00 CUTOUT BROKEN ON POLE 40, COX BROOK RD
12-Dec 10:06 12-Dec 12:08 54G3 4 145 2.03 294.83 CUTOUT OPEN AT THE BOTTOM OF CROSS ST
18-Dec 19:24 18-Dec 20:33 54G1 6 1 1.15 1.15 CAR ACCIDENT ON COX BROOK
Northfield Electric Department
This report is pursuant to PSB Rule 4.903B. It is to be submitted to the Public Service Board and
the Department of Public Service no later than 30 days after the end of the calendar year.
Electricity Outage Report -- PSB Rule 4.900Name of company Northfield Electric Department
Calendar year report covers 2012
Contact person Patrick Demasi
Phone number 802-485-7355
Number of customers 1,843
System average interruption frequency index (SAIFI) = 1.03Customers Out / Customers Served
Customer average interruption duration index (CAIDI) = 2.33Customer Hours Out / Customers Out
Outage cause Number of Total customer
Outages hours out
1 Trees 4 1,177
2 Weather 2 169
3 Company initiated outage 2 1,821
4 Equipment failure 13 1,072
5 Operator error 0 0
6 Accidents 1 1
7 Animals 4 187
8 Power supplier 0 0
9 Non-utility power supplier 0 0
10 Other 1 2
11 Unknown 0 0
Total 27 4,429
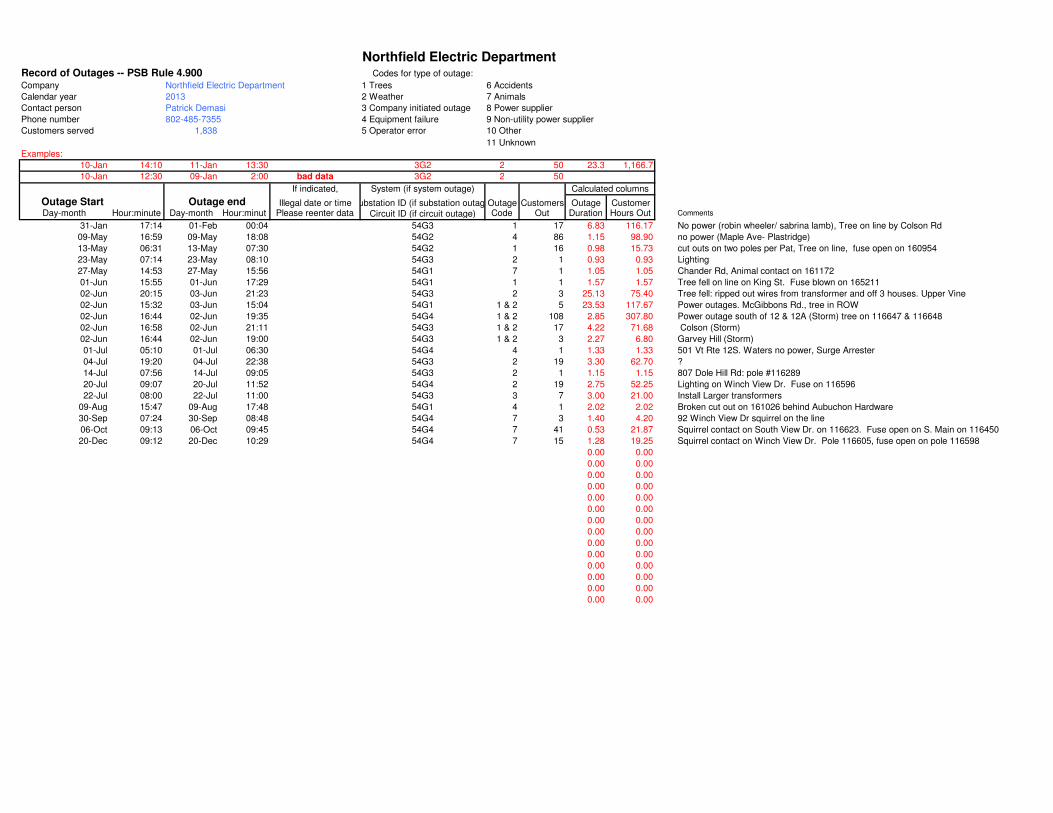
Northfield Electric DepartmentRecord of Outages -- PSB Rule 4.900 Codes for type of outage:
Company Northfield Electric Department 1 Trees 6 Accidents
Calendar year 2013 2 Weather 7 Animals
Contact person Patrick Demasi 3 Company initiated outage 8 Power supplier
Phone number 802-485-7355 4 Equipment failure 9 Non-utility power supplier
Customers served 1,838 5 Operator error 10 Other
11 Unknown
Examples:
10-Jan 14:10 11-Jan 13:30 3G2 2 50 23.3 1,166.7
10-Jan 12:30 09-Jan 2:00 bad data 3G2 2 50
If indicated, System (if system outage) Calculated columns
Outage Start Outage end Illegal date or timeSubstation ID (if substation outage)Outage Customers Outage CustomerDay-month Hour:minute Day-month Hour:minut Please reenter data Circuit ID (if circuit outage) Code Out Duration Hours Out Comments
31-Jan 17:14 01-Feb 00:04 54G3 1 17 6.83 116.17 No power (robin wheeler/ sabrina lamb), Tree on line by Colson Rd
09-May 16:59 09-May 18:08 54G2 4 86 1.15 98.90 no power (Maple Ave- Plastridge)
13-May 06:31 13-May 07:30 54G2 1 16 0.98 15.73 cut outs on two poles per Pat, Tree on line, fuse open on 160954
09-Aug 15:47 09-Aug 17:48 54G1 4 1 2.02 2.02 Broken cut out on 161026 behind Aubuchon Hardware
30-Sep 07:24 30-Sep 08:48 54G4 7 3 1.40 4.20 92 Winch View Dr squirrel on the line
06-Oct 09:13 06-Oct 09:45 54G4 7 41 0.53 21.87 Squirrel contact on South View Dr. on 116623. Fuse open on S. Main on 116450
20-Dec 09:12 20-Dec 10:29 54G4 7 15 1.28 19.25 Squirrel contact on Winch View Dr. Pole 116605, fuse open on pole 116598
0.00 0.00
0.00 0.00
0.00 0.00
0.00 0.00
0.00 0.00
0.00 0.00
0.00 0.00
0.00 0.00
0.00 0.00
0.00 0.00
0.00 0.00
0.00 0.00
0.00 0.00
0.00 0.00
Northfield Electric Department
This report is pursuant to PSB Rule 4.903B. It is to be submitted to the Public Service Board and
the Department of Public Service no later than 30 days after the end of the calendar year.
Electricity Outage Report -- PSB Rule 4.900Name of company Northfield Electric Department
Calendar year report covers 2013
Contact person Patrick Demasi
Phone number 802-485-7355
Number of customers 1,838
System average interruption frequency index (SAIFI) = 0.13Customers Out / Customers Served
Customer average interruption duration index (CAIDI) = 2.14Customer Hours Out / Customers Out
Outage cause Number of Total customer
Outages hours out
1 Trees 3 133
2 Weather 5 192
3 Company initiated outage 1 21
4 Equipment failure 3 102
5 Operator error 0 0
6 Accidents 0 0
7 Animals 4 46
8 Power supplier 0 0
9 Non-utility power supplier 0 0
10 Other 0 0
11 Unknown 0 0
Total 16 496
Northfield Electric DepartmentRecord of Outages -- PSB Rule 4.900 Codes for type of outage:
Company Northfield Electric Department 1 Trees 6 Accidents
Calendar year 2014 2 Weather 7 Animals
Contact person Patrick Demasi 3 Company initiated outage 8 Power supplier
Phone number 802-485-7355 4 Equipment failure 9 Non-utility power supplier
Customers served 1,834 5 Operator error 10 Other
11 Unknown
Examples:
10-Jan 14:10 11-Jan 13:30 3G2 2 50 23.3 1,166.7
10-Jan 12:30 09-Jan 2:00 bad data 3G2 2 50
If indicated, System (if system outage) Calculated columns
Outage Start Outage end Illegal date or timeSubstation ID (if substation outage)Outage Customers Outage CustomerDay-month Hour:minute Day-month Hour:minut Please reenter data Circuit ID (if circuit outage) Code Out Duration Hours Out Comments
22-Feb 12:00 24-Feb 13:25 54G1 4 1 49.42 49.42 Asseltine Farm, Tree branch hit Wire and opened cutout
January 23, 2015 Ms. Susan Hudson, Clerk Vermont Public Service Board 112 State Street Montpelier, VT 05620-2701 Dear Ms. Hudson: Enclosed is the outage report for the Northfield Electric Department (NED) for 2014.
During 2014, we continued our aggressive tree trimming which has shown to be very helpful in minimizing our outages due to trees. Our outages are attributed mainly to equipment failure and weather.
The system has been performing well and Green Mountain Power (GMP) continues to do our service work on a contract basis.
Please contact me should you have any questions. Sincerely, Douglas A. Reed Utility Office Manager ccs: Public Service Department Jeff Schulz, Town Manager