Page 1
PART-A ; Synthesis of Polyaniline (PANI) and PANI/c-SWCNT
composites for EMI Coatings
T. David, Jyotsna Kiran Mathad, T. Padmavathi, A. Vanaja
CSMST,National Aerospace Laboratories,Old Airport Road, Kodihalli,
Bangalore-560017
India
Abstract
Polyaniline (PANI) was synthesized by chemical oxidation process by using Ammonium per
sulphate (APS) as oxidizer and HCl as dopant. The effects of change in stoichiometric ratio
of monomer to oxidizer, addition time, reaction temperature and dopant concentration on the
electrical conductivity of PANI were studied in detail. The synthesis procedure was
optimized to yield the product with the best electrical conductivity. Maximum electrical
conductivity of 5.6 S/cm was achieved for pure PANI synthesized by following the optimized
procedure. Different PANI/c-SWCNT composites were prepared by optimized in-situ
polymerization procedure by varying the c-SWCNT loading and characterized for FTIR,
XRD, DSC, TGA, FESEM analysis and electrical conductivity. These studies revealed the
fact that formation of PANI coating over c-SWCNT during in-situ synthesis was responsible
for enhanced electrical conductivity. Maximum conductivity of 27.12 S/cm was realized for
20% c-SWCNT loaded PANI composite. To demonstrate the efficacy of in-situ method, 20%
c-SWCNT loaded PANI composite was prepared by ex-situ method and electrical
conductivity was evaluated. The results of these studies inferred that 20% c-SWCNT loaded
PANI composite synthesized by in-situ method was the most effective filler for developing
the polyurethane based coatings for EMI shielding applications. Development and
characterization of PANI/c-SWCNT composite filled polyurethane based coatings for EMI
shielding will be discussed separately as PART- B.
Page 2
INTRODUCTION
Electromagnetic interference (EMI) is a phenomenon where an undesired electromagnetic
induction generates signals in the nearby electronic circuits and there by affects the
performance of the electronic equipments. EMI is hazardous to health of human beings also.
Hence to ensure the best performance of the equipments and safety of human beings, EMI
shielding is essential [1-3]. A good shield for EMI should have either free electrons or
electric/magnetic dipoles which interact with electric and magnetic components of Electro
Magnetic Radiation and weaken its intensity. Metals are known to be good EMI shields. They
can be used as sheets/mesh. However, they suffer from corrosion susceptibility and weight
penalty [4-7]. Further, metal based coatings exhibit limited performance due to poor wear and
scratch resistance. Conventional polymer matrices with carbon based inclusions by virtue
of their light weight and corrosion resistance and electrical conductivity are best suited for
EMI shielding [8, 9]. Many studies reported that carbon nanotubes (CNT) enhanced the
electrical conductivity of the polymer matrices and there by improved the EMI shielding
effectiveness [10-12]. Recently use of intrinsically Conducting Polymers (ICPs) like
Polyaniline (PANI) [7], Polypyrrole (PPy) [13, 14] and Poly-p-phenylene-benzobisthiazole
(PBT) [15, 16] etc., as fillers to conventional polymers has been reported. However, the
enhancement of conductivity depends on the intrinsic conductivity, loading concentration,
degree of dispersion and extent of compatibility of the ICP with the host polymer. Generally
as ICPs have limited conductivity, higher loadings are required to achieve the required level
of electrical conductivity for shielding. Interestingly, when used as composite fillers in
combination with other conducting materials like metals and CNT, these ICPs result in
significant reduction in percolation thresh hold, increasing the conductivity there by effective
contribution to shielding performance [4]. Generally ICP/ CNTs composites are prepared
either by direct mixing of the two components or in-situ polymerization of the ICP monomer
in the presence of CNTs.
The present research work was aimed at two tasks Viz., Part A- synthesis of Poly
aniline(PANI) /c-SWCNT composite and Part B-Development and characterization of
PANI/c-SWCNT composite filled polyurethane based coatings using for EMI shielding .
This paper highlights the work carried out under PART –A i.e, the optimization of synthesis
procedure for PANI and their c-SWCNT composites to be used as fillers for polyurethane
based EMI coatings. Initially PANI was synthesized by chemical oxidation process by using
Page 3
Ammonium per sulphate (APS) as oxidizer and HCl as dopant. The effects of change in
stoichiometry of monomer oxidizer ratio, addition time, reaction temperature and dopant
concentration on the electrical conductivity of PANI were studied in detail. The procedure
was optimized to yield best electrical conductivity. Different PANI/c-SWCNT composites
were prepared by optimized in-situ polymerization procedure by varying the c-SWCNT
loading between 0-20 and their electrical conductivity was evaluated. PANI / c-SWCNT with
20%c-SWCNT loaded composite was prepared by ex situ method for comparative evaluation.
Due to the formation of PANI coating over c-SWCNT during in-situ synthesis, the
composites prepared by in-situ method exhibited higher electrical conductivity as compared
to the composites prepared ex-situ method. The formation of PANI coating was confirmed
by characterizing the in-situ prepared composites by FTIR, XRD, DSC, TGA and FESEM
analysis. The results of these studies were discussed in the following sections.
EXPERIMENTAL
Materials used
Aniline, Ammonium persulphate (APS) and HCl were purchased from SDFCL
chemicals, India. Aniline was vacuum distilled before use. Carboxylic Acid functionalized
single walled carbon nanotubes (c-SWCNT) were purchased from nanoshel, USA with 90%
purity. All other chemicals were used as received.
Synthesis of PANI and PANI/c-SWCNT composites (In-situ)
Aniline was taken in a round bottom flask with 1M of 100 ml HCl. Calculated amount
of Ammonium per sulphate (APS) was dissolved in the 1M of 100 ml HCl and added to the
aniline HCl mixture under stirring. The system was kept under vigorous stirring for 2hrs to
complete the polymerization. The color change from colorless to dark green indicates the
formation of PANI emeraldine salt. Then PANI was filtered and washed with 1M HCl and
distilled water till filtrate turn into the colorless solution. The filtered PANI was dried in
vacuum oven at 60° C for 24 hrs. This procedure was repeated by varying the stoichiometry
of monomer oxidizer ratio, addition time, reaction temperature and dopant concentration in
order to realize the PANI with best electrical conductivity. Table.1 presents the details of
parameter variation followed during the synthesis and the electrical conductivities realized
for PANI. The optimized PANI was labelled as PASC0. This optimized synthesis procedure
was followed to prepare PANI/c-SWCNT composites with varying percentages (1, 5, 10 and
Page 4
20) loading of c-SWCNT and labelled as PASC1, PASC5, PASC10 and PASC20
respectively.
Ex-situ
Ex-situ PANI/c-SWCNT composite was prepared by grinding the 20% Wt. c-
SWCNTs in the mortar with Pure PANI (PASC0). This composite was labelled as
EPASC20. This was prepared to compare the electrical conductivity values of in-situ and ex-
situ synthesized PANI/c-SWCNT composites.
Table.1 Optimization of Polyaniline by changing the different parameters of Temperature,
HCl concentration, Aniline APS ratio and Addition time
* Optimized conditions of PANI emeraldine salt.
Characterization
Electrical Conductivity was measured using keithley 6221 Current source meter and
2187Ananovoltmeter. Polyaniline pellet was prepared by pressing the PANI powder at 7 ton
Procedure
. No
Aniline/
APS
molar
ratio
Temperature
°c
Concentration
of HCl M
Addition Time Electrical
conductivity
S/cm
1 1:1.125 0 1 Drop by drop for 2 hrs 1.5
2 1:1.125 -5 1 Drop by drop for 2 hrs 4.1
3 1:1.125 RT 1 Drop by drop for 2 hrs 5.7*
4 1:1.125 RT 2 Drop by drop for 2 hrs 5.08
5 2:1.125 RT 1 Drop by drop for 2 hrs 2
6 1:2.25 RT 1 Drop by drop for 2 hrs 1
7 1:1.125 RT 1 Instant addition 0.2
Page 5
pressure using stain less steel dye. Vandur pou four probe method was used. Bruker Vector
22 was used for FTIR spectra in the wave-number range of 4000–400 cm-1. The FTIR
Specimens for analysis were prepared by grinding the powder sample with KBr powder
(weight ratio 1 : 99) and then the pressing of the mixture into tablets. Differential Scanning
Calorimetric (DSC) studies were performed on TA modal, USA from 40° C to 300° C at a
scan rate of 10° C per minute heat flow. Thermal stabilities of these samples were
characterized using TA (Universal V2.6D, USA) Thermogravimetric Analysis (TGA) in the
inert atmosphere. The samples were scanned between 40 to 800° C Temperature at the
heating rate of 20° C/min. Field Emission Scanning Electron Microscopy (FESEM-Carl
Zeiss, Supra 40 VP) was used to examine the morphology of the samples. The XRD analysis
was done with the help of Bruker D8 advanced diffractometer by using Cu Kα X-rays of
wave length 1.54A in 2θ range from 10 to 70.
RESULTS AND DISCUSSION
Optimization of polyaniline synthesis
Initially, PANI was synthesized as per the standard procedure reported elsewhere in
literature [17]. PANI synthesized according to the standard procedure exhibited electrical
conductivity of 1.5 S/cm. Later experiments were carried out under different conditions by
varying the reaction temperature, monomer to oxidizer, dopant concentration stoichiometry
and addition time of oxidiser to monomer. The electrical conductivity of PANI samples
synthesized by various experiments was measured and tabulated. From the table.1, it seen
that, room temperature reaction yielded the PANI with the highest electrical conductivity of
5.7 S/cm. Higher concentration of the HCl dopant resulted in reduction of electrical
conductivity of PANI5.7 S/cm to 5.08 S/cm. This could be due to the disorder of extended
conjugated structure of PANI caused by excess of protonic acid concentrations [18-21. In the
subsequent procedures, the monomer (Aniline) Vs oxidizer (APS) ratio was changed as listed
in the table1.When the monomer molar ratio was high, due to inadequate concentration, APS
could not oxidize aniline to complete the polymerization. As a consequence, decrease in
electrical conductivity from 5.7 S/cm to 2 S/cm was observed. In another condition, when
oxidizer molar ratio was high, further decrease in electrical conductivity (from 2 S/cm to 1
S/cm) was observed due to the complete oxidation of aniline as reported in the literature [22]
. It is also observed that the instant addition of oxidizer to the monomer resulted in drastic
Page 6
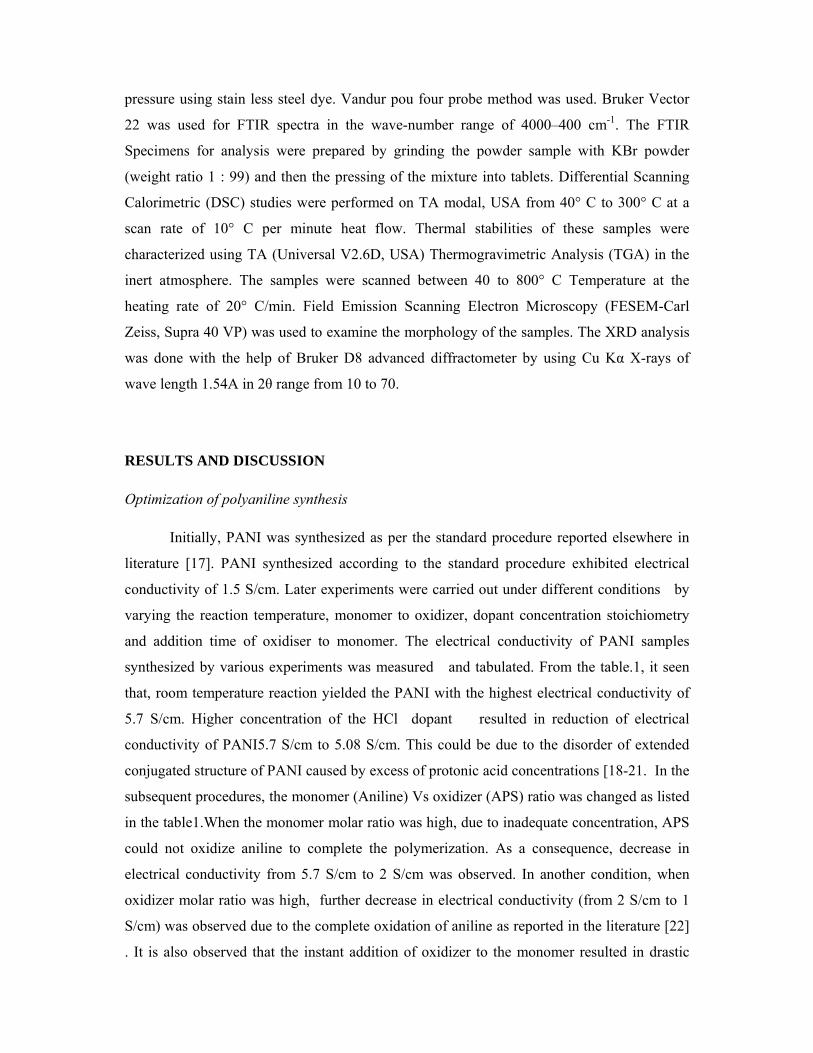
reduction in electrical conductivity (from 5.7 S/cm to 0.2 S/cm). From all these experiments,
it was concluded that room temperature reaction of Anilinile with approximately equal
molar ratio of monomer and oxidizer (1:125), with a drop wise addition of oxidizer to
monomer yielded the PANI emeraldine salt with highest conductivity. These optimum
conditions were followed for preparing the various PANI/ c-SWCNT composites by in-situ
synthesis. Scheme 1 represents the optimized procedure for PANI synthesis and scheme 2
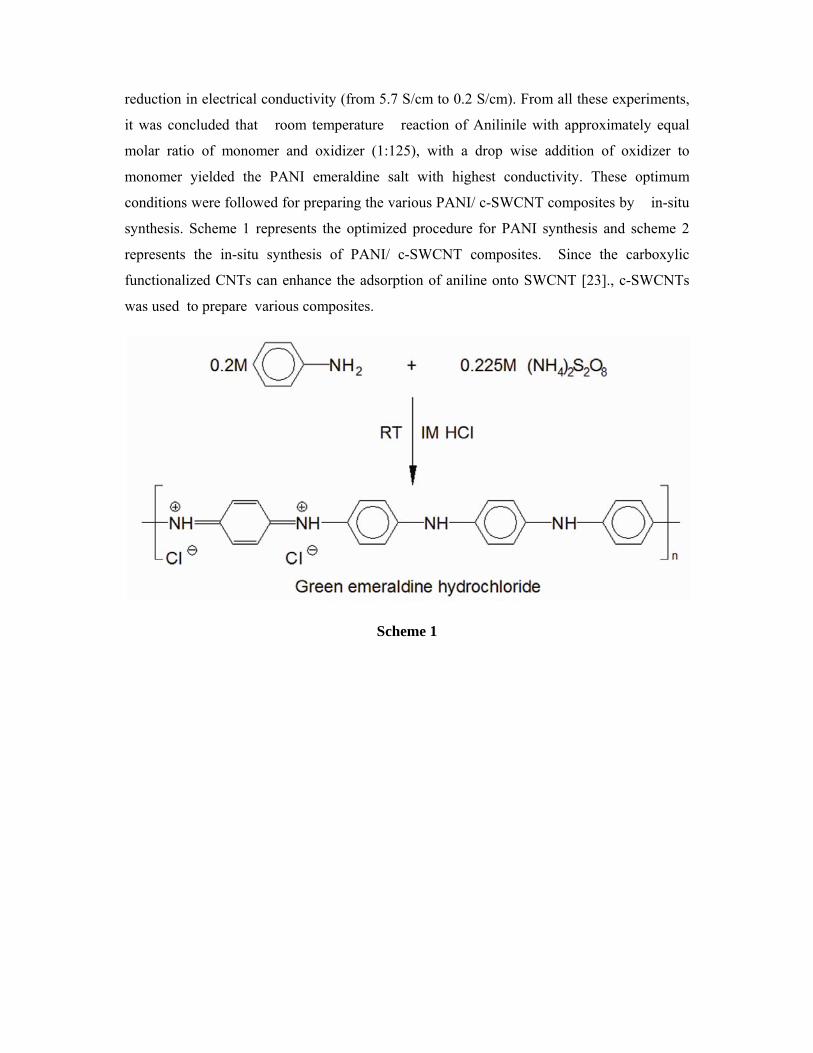
represents the in-situ synthesis of PANI/ c-SWCNT composites. Since the carboxylic
functionalized CNTs can enhance the adsorption of aniline onto SWCNT [23]., c-SWCNTs
was used to prepare various composites.
Scheme 1
Page 7
Scheme 2
Electrical conductivity for PANI/c-SWCNT composites
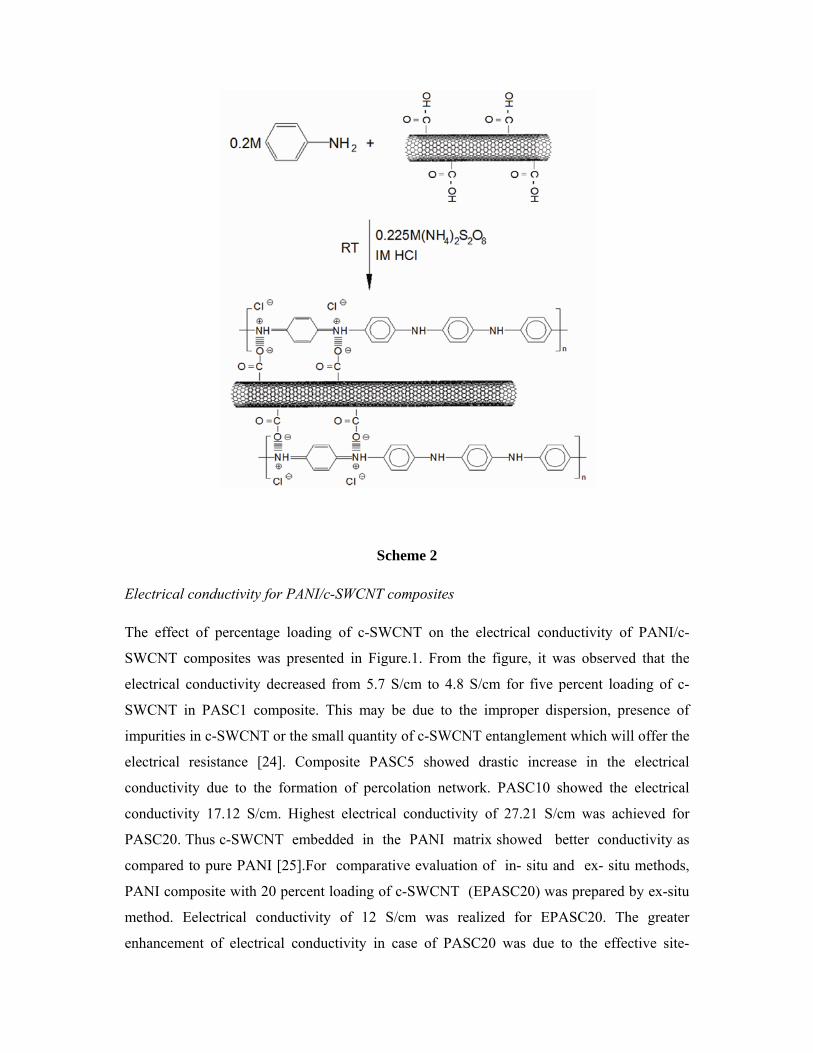
The effect of percentage loading of c-SWCNT on the electrical conductivity of PANI/c-
SWCNT composites was presented in Figure.1. From the figure, it was observed that the
electrical conductivity decreased from 5.7 S/cm to 4.8 S/cm for five percent loading of c-
SWCNT in PASC1 composite. This may be due to the improper dispersion, presence of
impurities in c-SWCNT or the small quantity of c-SWCNT entanglement which will offer the
electrical resistance [24]. Composite PASC5 showed drastic increase in the electrical
conductivity due to the formation of percolation network. PASC10 showed the electrical
conductivity 17.12 S/cm. Highest electrical conductivity of 27.21 S/cm was achieved for
PASC20. Thus c-SWCNT embedded in the PANI matrix showed better conductivity as
compared to pure PANI [25].For comparative evaluation of in- situ and ex- situ methods,
PANI composite with 20 percent loading of c-SWCNT (EPASC20) was prepared by ex-situ
method. Eelectrical conductivity of 12 S/cm was realized for EPASC20. The greater
enhancement of electrical conductivity in case of PASC20 was due to the effective site-
Page 8
selective interactions between the quinoid ring of the PANI and the c-SWCNTs and thus
forming a coating of PANI emeraldine salt over the c-SWCNT [26]. Also c-SWCNT serves
as “conducting bridge” connecting the PANI conducting domain. This accelerates charge
transfer processes between PANI and c-SWCNT and results in enhanced electronic properties
which were further supported by FTIR, XRD and FESEM studies.
Fig.1 Electrical conductivity graph of PANI with increasing content of c-SWCNT
FTIR Analysis
Formation of coating of PANI over c-SWCNT through the interactions between the quinoid
ring of the PANI and the c-SWCNTs was confirmed by FTIR analysis. Figure 2 shows the
FTIR spectra of pure polyaniline (PASC0), c-SWCNTs and PANI/c-SWCNT composites
with varying percentages of c-SWCNT.The peaks at 3434, 2923, 1563, 1488, 1294, 1232,
1118 and 798 cm-1 in pure PANI correspond to N-H stretching of secondary amine, NH+
stretching of amine, quinoide ring stretching (N=Q=N), benzoide ring stretching (N-Q-N),
C-N stretching, C-H stretching of quinoid ring and vibration frequency of benzene and
quinoid ring C-H respectively. The strong peak at 1118 cm-1 is considered to be a measure of
the delocalization of the electrons [27] hence accounts for the conductive nature of the
PANI. The c-SWCNT spectrum showed the peaks at 3440, 1708, and 1631 cm-1
corresponding to carboxylic acid functional group of c-SWCNT The peak at 1580 cm-1 is
Page 9
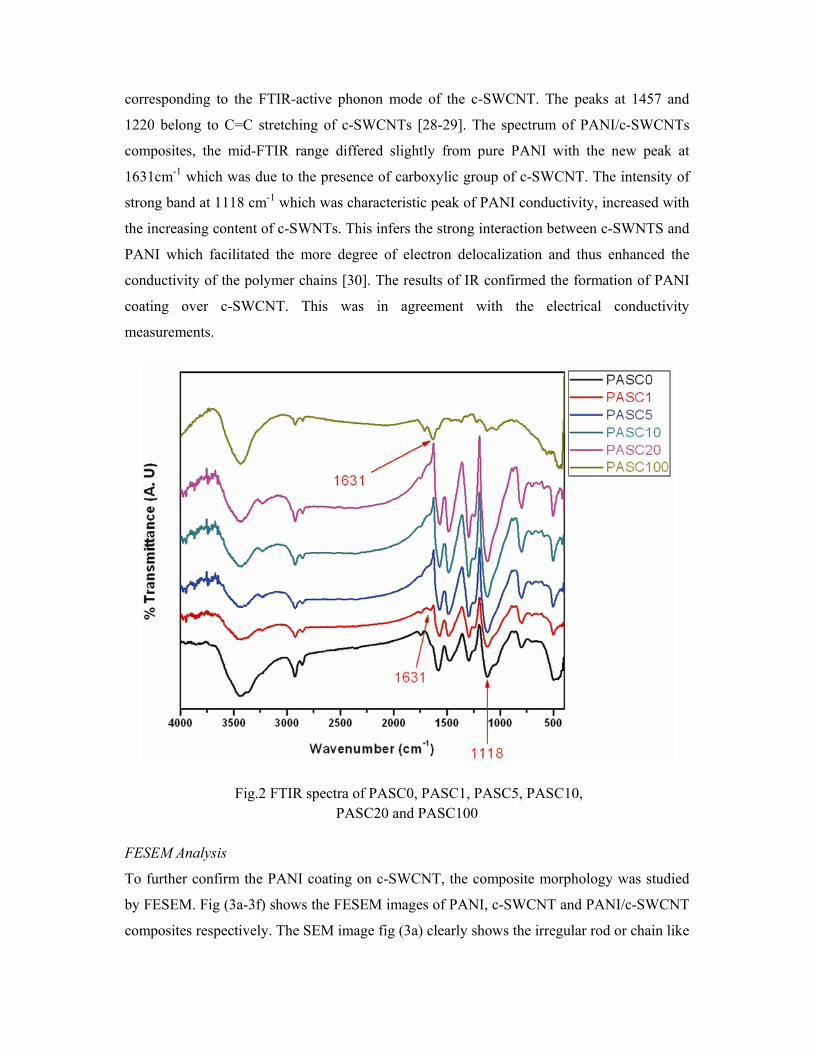
corresponding to the FTIR-active phonon mode of the c-SWCNT. The peaks at 1457 and
1220 belong to C=C stretching of c-SWCNTs [28-29]. The spectrum of PANI/c-SWCNTs
composites, the mid-FTIR range differed slightly from pure PANI with the new peak at
1631cm-1 which was due to the presence of carboxylic group of c-SWCNT. The intensity of
strong band at 1118 cm-1 which was characteristic peak of PANI conductivity, increased with
the increasing content of c-SWNTs. This infers the strong interaction between c-SWNTS and
PANI which facilitated the more degree of electron delocalization and thus enhanced the
conductivity of the polymer chains [30]. The results of IR confirmed the formation of PANI
coating over c-SWCNT. This was in agreement with the electrical conductivity
measurements.
Fig.2 FTIR spectra of PASC0, PASC1, PASC5, PASC10, PASC20 and PASC100
FESEM Analysis
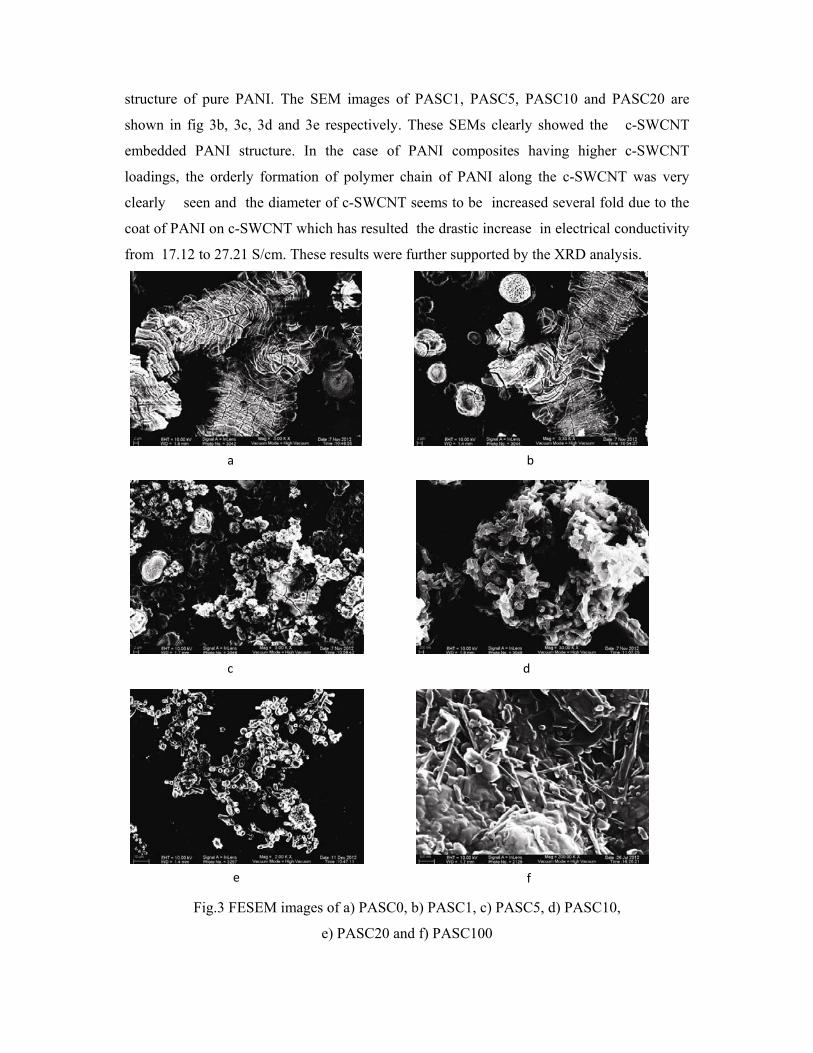
To further confirm the PANI coating on c-SWCNT, the composite morphology was studied
by FESEM. Fig (3a-3f) shows the FESEM images of PANI, c-SWCNT and PANI/c-SWCNT
composites respectively. The SEM image fig (3a) clearly shows the irregular rod or chain like
Page 10
structure of pure PANI. The SEM images of PASC1, PASC5, PASC10 and PASC20 are
shown in fig 3b, 3c, 3d and 3e respectively. These SEMs clearly showed the c-SWCNT
embedded PANI structure. In the case of PANI composites having higher c-SWCNT
loadings, the orderly formation of polymer chain of PANI along the c-SWCNT was very
clearly seen and the diameter of c-SWCNT seems to be increased several fold due to the
coat of PANI on c-SWCNT which has resulted the drastic increase in electrical conductivity
from 17.12 to 27.21 S/cm. These results were further supported by the XRD analysis.
Fig.3 FESEM images of a) PASC0, b) PASC1, c) PASC5, d) PASC10,
e) PASC20 and f) PASC100
a b
c d
e f
Page 11
XRD analysis
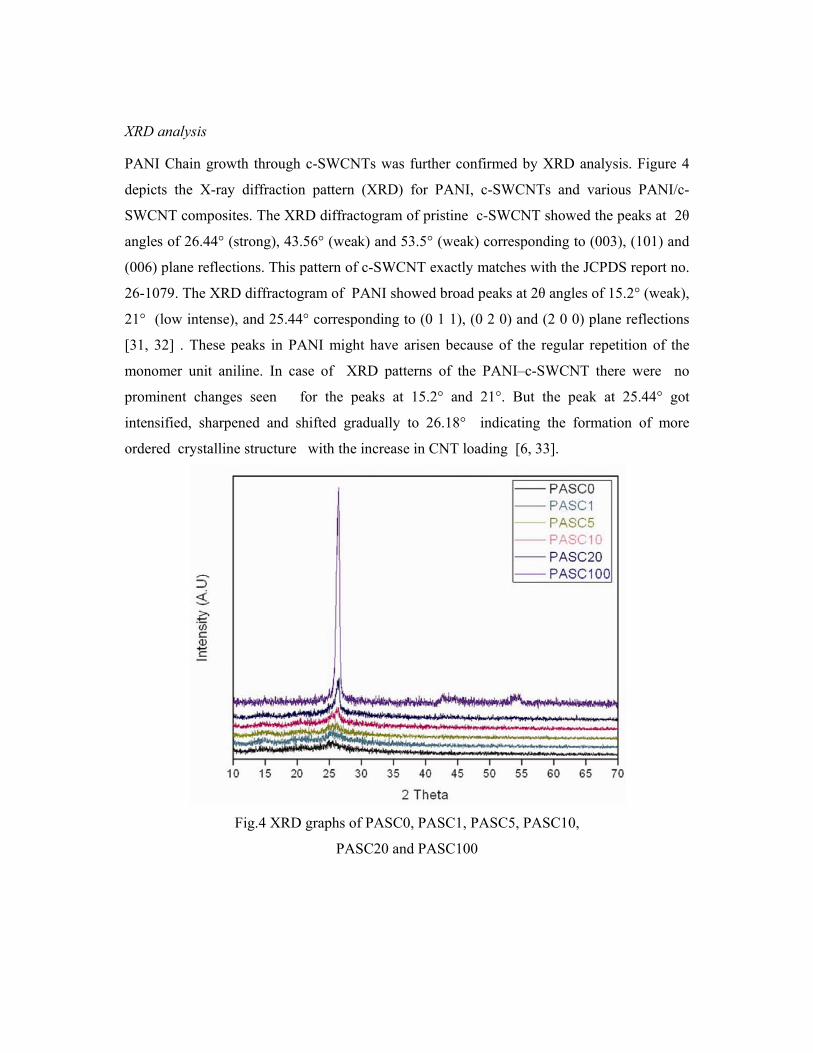
PANI Chain growth through c-SWCNTs was further confirmed by XRD analysis. Figure 4
depicts the X-ray diffraction pattern (XRD) for PANI, c-SWCNTs and various PANI/c-
SWCNT composites. The XRD diffractogram of pristine c-SWCNT showed the peaks at 2θ
angles of 26.44° (strong), 43.56° (weak) and 53.5° (weak) corresponding to (003), (101) and
(006) plane reflections. This pattern of c-SWCNT exactly matches with the JCPDS report no.
26-1079. The XRD diffractogram of PANI showed broad peaks at 2θ angles of 15.2° (weak),
21° (low intense), and 25.44° corresponding to (0 1 1), (0 2 0) and (2 0 0) plane reflections
[31, 32] . These peaks in PANI might have arisen because of the regular repetition of the
monomer unit aniline. In case of XRD patterns of the PANI–c-SWCNT there were no
prominent changes seen for the peaks at 15.2° and 21°. But the peak at 25.44° got
intensified, sharpened and shifted gradually to 26.18° indicating the formation of more
ordered crystalline structure with the increase in CNT loading [6, 33].
Fig.4 XRD graphs of PASC0, PASC1, PASC5, PASC10,
PASC20 and PASC100
Page 12
To confirm the above fact, the lattice space and crystal size of PANI, c-SWCNT and
PANI/c-SWCNT composites were estimated using the Bragg’s and Scherrer formulae
respectively.
nλ =2dsin θ ……………..1
Where n is an integer, λ is the wavelength of incident wave (1·5405 Å for Cu Kα), d is the
spacing between the planes in the atomic lattice and θ is the angle between the incident ray
and the scattering planes.
D = 0·9λ/ß cos θ …………… 2
Where λ is wavelength, ß is full width at half maximum (FWHM) of the diffraction peak, θ is
the Bragg diffraction angle and D is the crystal size.
The calculated crystal size and lattice space for PANI, c-SWCNT and PANI/c-SWCNT composites were tabulated in table 2.
Table 2 Crystal size and lattice space respective to their 2 theta of PANI, c-SWCNT and PANI/c-SWCNT composites
From the table 2, it was observed that FWHM was decreasing with increase in c-SWCNT
loading which means the most ordered state of PANI backbone (the smaller the value of
half-width to height, higher the order). The crystal size was also increased with increasing
content of c-SWCNT. This was a clear evidence of PANI coating formation on c-SWCNT.
Higher size of the crystal grain dramatically enhances the conductivity [34]. This was in
agreement with our electrical conductivity measurements.
Designation 2 θ FWHM Lattice Spacing (d)
A°
Crystallite Size (D)
A°
PASC0 25.44 0.8460 3.4968 1.6796
PASC1 25.62 0.7424 3.4732 1.9147
PASC5 25.8 0.5933 3.4483 2.3965
PASC10 25.96 0.5205 3.4283 2.7327
PASC20 26.18 0.3697 3.3996 3.8495
PASC100 26.42 0.2929 3.3698 4.8602
Page 13
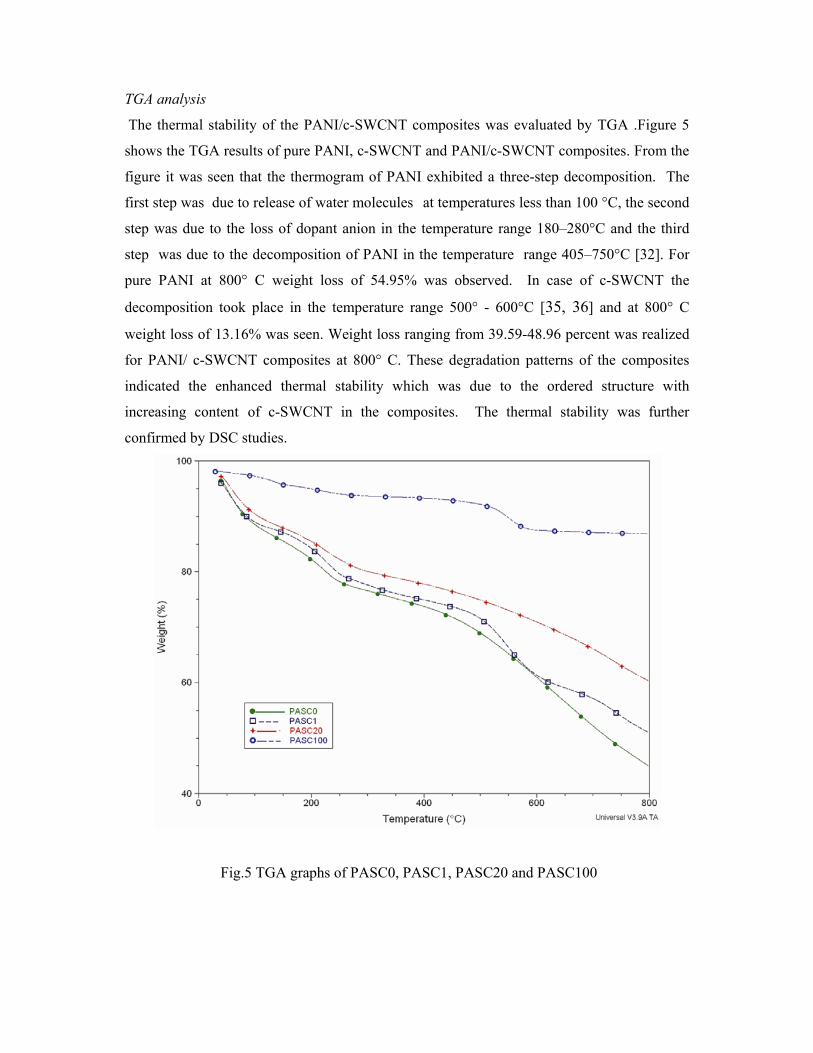
TGA analysis
The thermal stability of the PANI/c-SWCNT composites was evaluated by TGA .Figure 5
shows the TGA results of pure PANI, c-SWCNT and PANI/c-SWCNT composites. From the
figure it was seen that the thermogram of PANI exhibited a three-step decomposition. The
first step was due to release of water molecules at temperatures less than 100 °C, the second
step was due to the loss of dopant anion in the temperature range 180–280°C and the third
step was due to the decomposition of PANI in the temperature range 405–750°C [32]. For
pure PANI at 800° C weight loss of 54.95% was observed. In case of c-SWCNT the
decomposition took place in the temperature range 500° - 600°C [35, 36] and at 800° C
weight loss of 13.16% was seen. Weight loss ranging from 39.59-48.96 percent was realized
for PANI/ c-SWCNT composites at 800° C. These degradation patterns of the composites
indicated the enhanced thermal stability which was due to the ordered structure with
increasing content of c-SWCNT in the composites. The thermal stability was further
confirmed by DSC studies.
Fig.5 TGA graphs of PASC0, PASC1, PASC20 and PASC100
Page 14
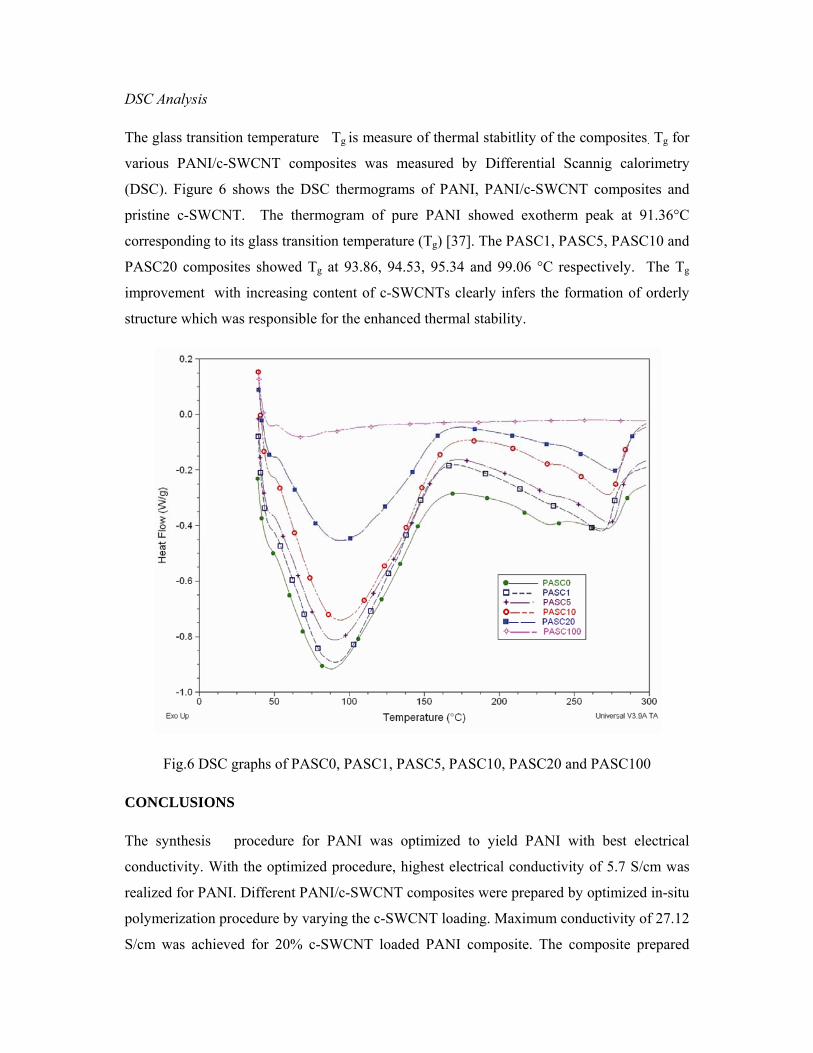
DSC Analysis
The glass transition temperature Tg is measure of thermal stabitlity of the composites. Tg for
various PANI/c-SWCNT composites was measured by Differential Scannig calorimetry
(DSC). Figure 6 shows the DSC thermograms of PANI, PANI/c-SWCNT composites and
pristine c-SWCNT. The thermogram of pure PANI showed exotherm peak at 91.36°C
corresponding to its glass transition temperature (Tg) [37]. The PASC1, PASC5, PASC10 and
PASC20 composites showed Tg at 93.86, 94.53, 95.34 and 99.06 °C respectively. The Tg
improvement with increasing content of c-SWCNTs clearly infers the formation of orderly
structure which was responsible for the enhanced thermal stability.
Fig.6 DSC graphs of PASC0, PASC1, PASC5, PASC10, PASC20 and PASC100
CONCLUSIONS
The synthesis procedure for PANI was optimized to yield PANI with best electrical
conductivity. With the optimized procedure, highest electrical conductivity of 5.7 S/cm was
realized for PANI. Different PANI/c-SWCNT composites were prepared by optimized in-situ
polymerization procedure by varying the c-SWCNT loading. Maximum conductivity of 27.12
S/cm was achieved for 20% c-SWCNT loaded PANI composite. The composite prepared
Page 15
with the same percentage of c-SWCNT loading by ex situ method exhibited the electrical
conductivity of 12 S/cm. The grater enhancement of electrical conductivity in case of in-situ
method was ascribed to PANI coating over c-SWCNT which was confirmed by FTIR,
FESEM and XRD analysis. Further, DSC and TGA data substantiated the improved thermal
stability in case of PANI/c-SWCNT composites. Among the various composites developed
PASC20 with highest electrical conductivity, ordered crystalline structure and thermal
stability was found to be the choicest of filler materials studied for developing poly
urethane based coating for EMI applications.
ACKNOWLEDGEMENT
The authors acknowledge the CSIR for funding the research work under 11th five year plan.
They also acknowledge the encouragement and support received from Mr. Shyamchetty,
Director NAL and Dr. Dayananda, Head, CSMST, NAL to carry out the research work.
Page 16
REFERENCES
1. F. S. Hung, F. Y. Hung and C. M. Chiang. Appl. Surf. Sci., 257 3733 (2011).
2. Y. Li, C. X. Chen, S. Zhang,Y. Ni, and J. Huang. Appl. Surf. Sci., 254 5766 (2008).
3. B. R. Kim, H. K. Lee,S. H. Park and H. K. Kim. Thin Solid Films. 519 3492 (2011).
4. J. Liang, Y. Wang, Y. Huang, Y. Ma, Z. Liu and J. Cai. Carbon 47 922 (2009).
5. B. Fugetsu, E. Sano, M. Sunada, Y. Sambongi, T. Shibuya and X. Wang. Carbon 46 1256 (2008).
6. P. Saini, V. Choudhary, B. P. Singh, R. B. Mathur and S. K. Dhawan. Mater. Chem.
Phys., 113 919 (2009).
7. P. Saini, V. Choudhary, K. N. Sood and S. K. Dhawan. J. Appl. Poly. Sci., 113 3146 (2009).
8. B. Kandasubramanian and M. Gilbert. Macromol. Symp., 221 185 (2005).
9. N. C. Das, D. Khastgir, T. K. Chaki and A. Chakraborty. J. Elast. Plas., 34 199
(2002).
10. L. Ning, Y. Huang, D. Feng, H. Xiaobo, L. Xiao, G. Hongjun, M. Yanfeng, L. Feifei,
C. Yongsheng and P. C. Eklund. NanoLett.,6 1141 (2006).
11. C. S. Zhang, Q. Q. Ni, S. Y. Fu, K. Kurashiki. Comp.Sci. Tech., 67 2973 (2007).
12. Y. J. Chen, N. D. Dung, Y. A. Li, M. C. Yip, W. K. Hsu and N. H. Tai. Dia. Rel.
Mate., 20 1183 (2011).
13. E. Hakansson, A. Amiet and A. Kaynak. Syn. Met., 156 917 (2006).
14. E. Hakansson, A. Amiet, S. Nahavandi and A. Kaynak . Euro. Poly. Journ., 43 205
(2007).
15. C. Chen and K. Naishadham. Conference Proceedings-IEEE SOUTHEASTCON. 1 38
(1990).
16. K. Naishadham and P. K. Kadaba. IEEE Trans. Microwave Theory Technol., 39 1158
(1991).
Page 17
17. T. M. Wu and Y. W. Lin. Polym., 47 3576 (2006).
18. A. Pron, F. Genoud,C. Menardo and M. Nechtschein. Synth. Met., 24 193 (1988).
19. Y. Cao,A. Andreatta, A. J. Heeger and P. Smith. Polymer, 30 2305 (1989).
20. P. P. Sengupta and B. Adhikari. Mater. Sci. Eng. A. 459 278 (2007).
21. I. Sapurina and J. Stejskal. Polym. Int., 57 1295 (2008).
22. N. Chandrakanthi and M. A. Careem. Polym. Bull., 45 113 (2000).
23. E. Bekyarova, B. Zhao, R. Sen, M. E. Itkis and R. C. Haddon. Prepr. Pap.-Am. Chem.
Soc., Div. Fuel Chem. 49 936 (2004).
24. E. N. Konyushenko, J. Stejska, M. Trchova, J. Hradil, J. Kovarova, J. Prokes, M.
Cieslar, J. Y. Hwang, K. H. Chen and I. Sapurina. Polym., 47 5715 (2006).
25. S. B. Kondawar, M. D. Deshpande and S. P. Agrawal. Int. J. Comp. Mate., 2 32
(2012).
26. W.K. Maser, A. M. Benito, M. A. Callejas, T. Seeger, M. T. Martinez, J. Schreiber, J.
Muszynski, O. Chauvet, Z. Osvath, A. A. Koos and L.P. Biro. Mate. Sci. Eng. C., 23
91 (2003)
27. J. C. Chiang and A. G. MacDiarmid. Synth. Met., 13 139 (1986).
28. S. Hussain, P. Jha, A. Chouksey, R. Raman, S. S. Islam, T. Islam, P. K. Choudhary
and Harsh. J. Mod. Phy., 2 538 (2011).
29. O. K. Park, T. Jeevananda, N. H. Kim, S. I. Kim and J. H. Lee. Scri. Mater., 60 551
(2009).
30. F. Yilmaz and Z. Kucukyavuz. J. Appl. Polym. Sci., 111 680 (2009).
31. H. K. Chaudhari and D. S. Kelkar. Polym. Int. 42 380 (1997).
Page 18
32. P. Gajendran and R. Saraswathi. Pure Appl. Chem., 80 2377 (2008).
33. S. Ghatak, G. Chakraborty, A. K. Meikap, T. Woods, R. Babu and W. J. Blau. J. Appl. Poly. Sci., 119 1016 (2011).
34. Q. Zhou, J. Wang, Y. Ma, C. Cong and F. Wang. Colloid. Polym. Sci., 285 405 (2007).
35. F. Li, Y. Wang, D. Wang and F. Wei. Carbon., 42 2375 (2004).
36. G. Ning, F. Wei, G. Luo and Y. Jin. Carbon., 43 1439 (2005).
37. C. H. Srinivas, D. Srinivasu, B. Kavitha, N. Narsimlu and K. S. Kumar. J. Appl. Phys., 1 12 (2012).


![Synthesis and Characterisation of Ionic Conductive ... S.pdf · trial processes [1]. Among the conducting polymers family, polyaniline (PANI) has been extensively ... which will also](https://static.documents.pub/doc/80x56/5f1fce5529b4412d2a6360ef/synthesis-and-characterisation-of-ionic-conductive-spdf-trial-processes-1.jpg)


