Built Environment Performance Plan 2016/17
1 | P a g e
Part B- Strategic Review of the Built Environment
1 Current Performance of the Built Environment ................................................................................ 4
1.1 Population Trends ................................................................................................................... 4
1.1.1 Migration .......................................................................................................................... 4
1.1.2 Population Pyramid ......................................................................................................... 4
......................................................................................................................................................... 6
1.2 Spatial Trends.......................................................................................................................... 6
1.2.1 Density and Deprivation .................................................................................................. 6
1.2.2 Environmental Challenges ............................................................................................... 7
2 Trends and Demand for Economic Infrastructure ........................................................................... 8
2.1 Economic Nodes ..................................................................................................................... 8
2.2 Transportation........................................................................................................................ 10
3 3. Trends and Demand for Basic Infrastructure ............................................................................ 11
3.1 Water ..................................................................................................................................... 12
3.2 Sewer ..................................................................................................................................... 15
3.3 Electricity ............................................................................................................................... 17
3.4 Roads and Storm water ......................................................................................................... 18
3.4.1 Maintenance .................................................................................................................. 20
3.4.2 Infrastructure Requirements .......................................................................................... 20
3.4.3 Backlogs ........................................................................................................................ 20
3.5 Waste Management .............................................................................................................. 21
4 Trends and Demand for Residential Infrastructure ....................................................................... 24
4.1 Residential Growth Trends .................................................................................................... 24
4.2 Public housing ....................................................................................................................... 26
........................................................................................................................................................... 26
4.3 Informal settlements .............................................................................................................. 27
4.4 Backyard units ....................................................................................................................... 28
4.5 Social Housing and Hostels ................................................................................................... 28
4.6 Meeting Residential Demand ................................................................................................ 28
4.6.1 Human and Social Development ................................................................................... 28
4.6.2 Economic Growth .......................................................................................................... 29
4.6.3 Environment and Services ............................................................................................. 29
4.6.4 Governance ................................................................................................................... 29
4.7 Land Requirements for Sustainable Human Settlements ..................................................... 32
4.8 Community Infrastructure Requirements ............................................................................... 34
4.8.1 Transportation Modal ..................................................................................................... 34
Built Environment Performance Plan 2016/17
2 | P a g e
4.9 Sustainable Development Requirements .............................................................................. 39
4.9.1 Development controls and supporting mechanisms in critical biodiversity areas ......... 40
5 Synthesis of key challenges within CoJ’s Built Environment ........................................................ 42
Figures
Figure 1: CoJ Population Pyramid ........................................................................................................... 5
Figure 2: Deprivation Map City of Johannesburg (with proposed social development projects) ............ 6
Figure 3: Density versus Deprivation in the City of Johannesburg ......................................................... 7
Figure 4: Location of Mixed Use Nodes in the City ................................................................................. 8
Figure 5: Location of Industrial Nodes within the City ............................................................................. 9
Figure 6 : Major Transportation Routes ................................................................................................. 10
Figure 7: City Deep Logistics Hub ......................................................................................................... 11
Figure 8: Bulk Water Assets – City of Johannesburg ............................................................................ 12
Figure 9: Water Program ....................................................................................................................... 14
Figure 10:City of Johannesburg’s sewer assets.................................................................................... 15
Figure 11: Sewer Program .................................................................................................................... 16
Figure 12: Bulk Assets of City Power .................................................................................................... 17
Figure 13 : Location of refurbishment projects required by City Power ................................................ 17
Figure 14: City Power – Required capital .............................................................................................. 18
Figure 15: Location of JRA road assets: traffic lights, bridges and traffic calming related assets ........ 19
Figure 16: Location of JRA storm water assets..................................................................................... 19
Figure 17: Stormwater/flooding hotspots for City of Johannesburg ...................................................... 21
Figure 18: Gravel road programme areas ............................................................................................. 21
Figure 19: New residential development within the City of Johannesburg by density, including
township applications ............................................................................................................................ 24
Figure 20: Location of settlements proposed in terms of the Provincial housing Programme .............. 25
Figure 21: Location of Informal Settlements within the City of Johannesburg ...................................... 26
Figure 22: Priority Areas per the Sustainable Human Settlements Urbanisation Plan (SHUSUP) ....... 31
Figure 23: Primary regional movement patterns ................................................................................... 35
Figure 24: Assumed future ridership per transport mode within the City of Johannesburg .................. 37
Figure 25: The Corridors of Freedom – (Turffontein Corridor; Perth-Empire Corridor and Louis Botha
Corridor .................................................................................................................................................. 37
Figure 26: CSIR Study – Access to Open Space .................................................................................. 39
Tables
Table 1: Extent of pipe line network within the City of Johannesburg by pipe size and material type .. 13
Table 2: Extent of other water related infrastructure within the City of Johannesburg ......................... 13
Table 3: Extent and type of Joburg Water’s wastewater pipelines........................................................ 16
Table 4: Extent of other sewer related infrastructure within the City of Johannesburg ......................... 16
Table 5: Roles and functions of the JRA ............................................................................................... 18
Table 6: JRA assets by region .............................................................................................................. 19
Table 7: JRA related City wide backlogs by programme ...................................................................... 20
Table 8: City of Johannesburg Landfill which fall under PIKITUP ......................................................... 22
Table 9: PIKITUP depot sites that facilitate waste collection in the City ............................................... 22
Table 10: Available airspace for operational PIKITUP landfills and expected lifespan of
aforementioned landfills ......................................................................................................................... 23
Table 11: Informal Settlements by Administrative Region .................................................................... 27
Table 12: Possible scenario for the provision of certain housing types for the City as per SHSUP ..... 31
Built Environment Performance Plan 2016/17
3 | P a g e
Table 13: Proposed standards for social facilities for Informal Settlements’ upgrades ........................ 32
Table 14: Land requirements for housing at different densities and erf sizes ....................................... 33
Table 15: Social Facility requirements .................................................................................................. 33
Table 16: Residential Requirements (by erf size and density), Social Facilities Requirements, open
space requirements and servitude requirements translated into hectares of land................................ 33
Built Environment Performance Plan 2016/17
4 | P a g e
Part B – STRATEGIC REVIEW OF THE BUILT
ENVIRONMENT
1 Current Performance of the Built Environment
1.1 Population Trends
According to Census 2011 data the City has a population of 4.4 million. The city’s population is
projected to increase at an annual growth rate of about 1.3 % per annum. Based on current trends, it
is anticipated that Johannesburg’s population will double within 50 years, shifting from the current 4.4
million people, to an expected 16.1 million people by 2030. Natural increase is an important
component of the increase of the City’s population and there are many other factors that contribute to
this growth.
1.1.1 Migration
Migration significantly influences the size and nature of Johannesburg’s population. Johannesburg
continues to be an important destination for both domestic and international migrants. South Africans
constitute the largest percentage of migrants within the City. However there is an increasing number of
immigrants from other African countries. Approximately 12% of Johannesburg’s population is deemed
to be foreign (UNISA 2010). The Majority of the migrants move to Johannesburg seeking employment
or to start their own businesses, both small and corporate. The nature of their stay varies from
permanent to temporary and their socio-economic status of varies from wealthy to poor. Many
economic and statistical indications are that majority of migrants are in low income category.
Over the past twenty years, HIV/AIDS related deaths have negatively affected projections for future
population growth. Since the roll out of anti-retroviral treatment, the mortality rate of HIV/AIDs related
illnesses has declined since 20042. However, the City still is still cognisant of the statistical implications
that South Africa continues to have one of the highest per capita HIV/AIDS global prevalence and
infection rates (UNISA 2010).
1.1.2 Population Pyramid
The population of Johannesburg comprises mainly of a young adult population that ranges from 20 –
34 years of age. The size of the school age population (i.e. persons aged 5-19 years) is about 20.5%
of the total population while the proportion of the working age population is approximately 2.6 million
(65% of the total population of the City). The percentage of the size of the elderly population (persons
aged 65 years and over) is about 5% of the total population and that of children (persons aged 0-15
years old) is about 26% of the total population of the City.
1 City of Johannesburg Consolidated Infrastructure Plan: Phase 1. 1 November 2013
Built Environment Performance Plan 2016/17
5 | P a g e
Figure 1: CoJ Population Pyramid
Another challenge facing South Africa as a whole, which is prevalent within the City of Johannesburg,
is the high socio-economic inequality. The Gini Coefficient, a measure of inequality within a given
society is estimated at 0.64 by Global Insight (2009). This indicates that the gap between the wealthy
and the poor within the City is very high. This inequality has a distinctive footprint which was mapped
as part of a study undertaken under the auspices of the Community Development Department (see
Figure 2). As seen from the map, the most deprived areas (areas shaded red) are located in the
formerly black township areas of Diepsloot, Ivory Park, Alexandra, Zandspruit, the Inner City, parts of
Soweto and the Greater Orange Farm. The more affluent areas in the City are located in the northern
suburb areas of Sandton, Randburg and Johannesburg South.
Built Environment Performance Plan 2016/17
6 | P a g e
1.2 Spatial Trends
The City’s population covers 1644 km2
density which ultimately means 2.676 persons per kilometre.
The low population density should be viewed within the context of a transport network that was
constructed for the private vehicles and past apartheid policies. The apartheid policies allocated race
groups to different locations within the City and this limited certain race groups’ to have access to
various resources and locations. In addition, low income housing development over the past twenty
years has largely been located on the periphery of the City.
1.2.1 Density and Deprivation
However, low residential densities are not evenly spread across the City. High densities and
overcrowding is typically in low-income townships, former black townships and in areas of the Inner
City such as Hillbrow. Low residential densities are found in former white townships and townships on
the western edge of the City. The correlation between high density and deprivation across the City is
illustrated in Figure 3.
Another socio-economic challenge for the City is the inequality within the formation of informal
settlements within various locations around the City. These are often in marginal locations, on land
that cannot be developed or is uninhabitable. A result of these spatial inequalities is that a significant
percentage of the poor’s resources are spent on paying for transport to access locations that have
many economic opportunities.
Figure 2: Deprivation Map City of Johannesburg (with proposed social development projects)
Built Environment Performance Plan 2016/17
7 | P a g e
1.2.2 Environmental Challenges
High levels of pressure are placed on the City’s already limited green infrastructure by the growing
population, established enterprise and industry and a consumerist culture. These factors have seen
the City being a major contributor to air pollution either directly (e.g. vehicle exhaust and industrial
emissions) or indirectly (e.g. use of electricity generated by coal-fired power stations). While
interventions have been undertaken to limit greenhouse gases into the atmosphere, many
interventions are long term and their results cannot be accounted for in the short term.
The various challenges faced by the City of a growing population, economic and spatial concerns
require strategic and collective approaches. In addressing unemployment and socio-economic
deprivations, entrepreneurs are supported through various interventions through Jozi@Work, business
hubs and development of market houses around the City. Investors are supporting the poor to access
opportunities; facilitating educational activities are key foci of the City. This focus on encouraging the
success of citizens is as important as the provision of local government services and is critical for the
long term financing of these assets, be it basic or community infrastructure.
Figure 3: Density versus Deprivation in the City of
Johannesburg
Built Environment Performance Plan 2016/17
8 | P a g e
2 Trends and Demand for Economic Infrastructure
The City has the largest economy in the country, contributing about 17% of the national GDP and
approximately 47% of Gauteng’s economy. The City’s economy is the main driver of national growth –
historically performing at 50% higher in growth rates relative to national growth. The City’s economy is
driven mainly by four economic sectors which are: (a) finance and business services, (b) community
services, (c) manufacturing and (d) trade. These four economic sectors collectively account for more
than 82% of economic activity within the City. These sectors also account for the highest levels of
formal and informal employment. The decline of certain economic nodes such as the Inner City, the
Randburg CBD and the Roodepoort CBD are indications of changes in the economic activities and
population movements within the City. As a result, there has been a significant growth of other
economic nodes such as Sandton, Rosebank, Sunninghill and Midrand over the years.
2.1 Economic Nodes
Formal Economic Activity within the City is concentrated in specific locations which the City terms
mixed use or industrial Nodes. A combination of retail, commercial, office, educational and high
density residential uses are located in mixed use nodes. The quality and function of the nodes varies
significantly across the City meeting the needs of the full range of socio-economic groupings within the
City. Ensuring that the public environment of these nodes is maintained and preventing urban decay is
a constant challenge. However these areas are critical for the on-going sustainability of the City’s
formal economy, and critical areas for public investment and intervention.
This significant formal economy must be viewed in the context of official unemployment figures of the
City which was approximately 25% in 2011. This is a 4.6% decrease from census data of 2001. The
Youth unemployment rate (school-leavers) is higher than the average unemployment rate at 35%,
which is a concern to the City.
Figure 4: Location of Mixed Use Nodes in the City
Built Environment Performance Plan 2016/17
9 | P a g e
There is significant pressure for new mixed use developments south of Midrand on the Farm Waterval,
adjacent to Lanseria Airport, the Farm Modderfontein and the Farm Frankenwald located east and
north of Alexandra. Over the past ten years there has been an emergence of mixed-use nodes in
areas of Soweto, Orange Farm, Diepsloot and Ivory Park.
The Inner City, also referred to as the Central Business District (CBD) remains a critical location for
economic development for both the formal and informal sectors. In the 1980s and 1990s, the CBD
experienced significant economic decline whereby many businesses relocated to the mixed use nodes
of the north of the City. In addition there was an influx of poorer migrants into areas of the CBD such
as Hillbrow. Through a combined effort by the government, the private sector and Non-Government
Organisations (NGOs), the economic decline of the CBD was reduced. However, changing socio-
economic circumstances, the extent of the CBD and the continued increase of residents within the
area requires on-going City intervention.
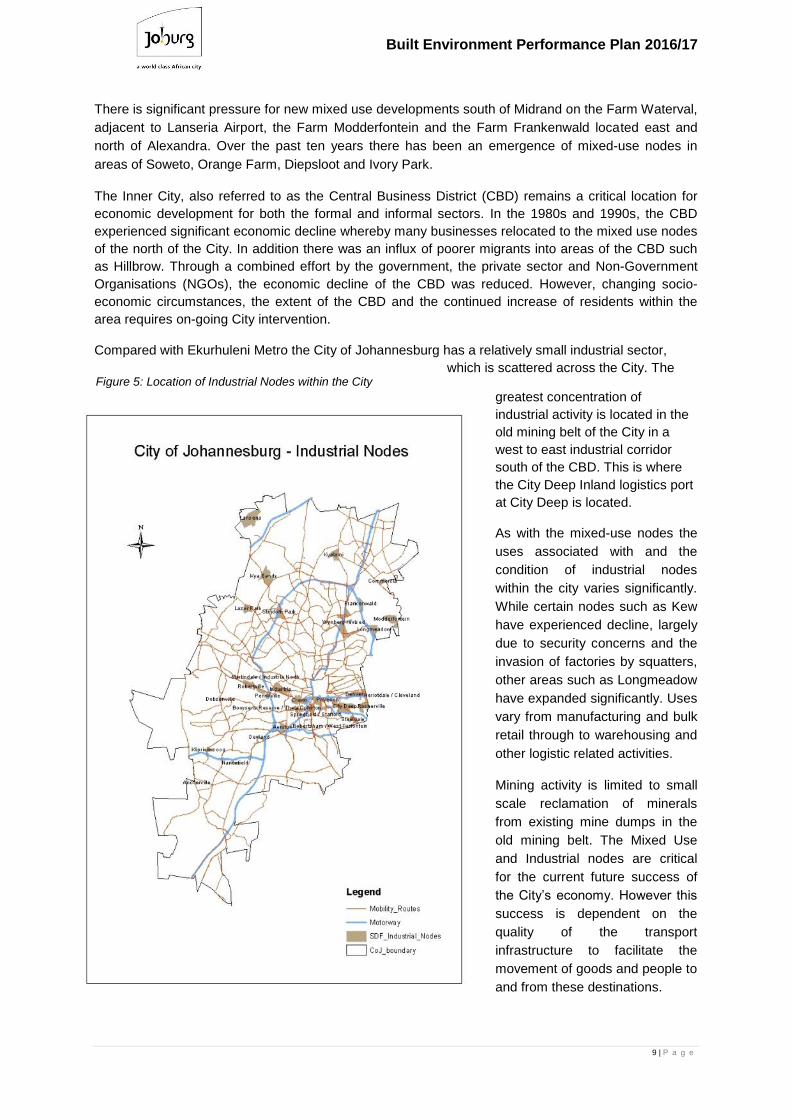
Compared with Ekurhuleni Metro the City of Johannesburg has a relatively small industrial sector,
which is scattered across the City. The
greatest concentration of
industrial activity is located in the
old mining belt of the City in a
west to east industrial corridor
south of the CBD. This is where
the City Deep Inland logistics port
at City Deep is located.
As with the mixed-use nodes the
uses associated with and the
condition of industrial nodes
within the city varies significantly.
While certain nodes such as Kew
have experienced decline, largely
due to security concerns and the
invasion of factories by squatters,
other areas such as Longmeadow
have expanded significantly. Uses
vary from manufacturing and bulk
retail through to warehousing and
other logistic related activities.
Mining activity is limited to small
scale reclamation of minerals
from existing mine dumps in the
old mining belt. The Mixed Use
and Industrial nodes are critical
for the current future success of
the City’s economy. However this
success is dependent on the
quality of the transport
infrastructure to facilitate the
movement of goods and people to
and from these destinations.
Figure 5: Location of Industrial Nodes within the City
Built Environment Performance Plan 2016/17
10 | P a g e
2.2 Transportation
For a City reliant on the motor vehicle, a high quality, well maintained, easily accessible freeway
system is critical for the success of the City. The City is responsible for two such routes namely the M1
and the M2. The rest of the freeway network which comprises the N1, N3, N12, and N17 is the
responsibility of SANRAL. In order to ensure the continued productivity of the City, the expansion of
the existing freeway network may need to be considered in the medium to long term. Another
important road network for the City is the K and PWV network maintained and constructed by Gauteng
Province. The failure of government to construct planned K and PWV routes in the north and north-
west of the City has contributed significantly to the traffic congestion in the north of the City.
Besides the road network, the
City does have a rail network
which has three components. The first is a freight component under the auspices of TRANSNET. The
rail freight network is limited to a
series of east-west railway lines in
the vicinity of City Deep and is
closely associated with the inland
logistics port. The second is a
heavily used passenger rail service
which runs trains from as far south
as Orange Farm to the CBD,
though the bulk of the service and
associated stations services
Soweto and is operated by PRASA.
PRASA is currently undertaking a
recapitalisation process that will see
the rolling stock and some of the
existing railway stations are being
upgraded to give rise for future
economic development in these
localities. The third component is
the Gautrain which is operated by
Bombela Consortium. The City of
Johannesburg has 5 stations
currently, with a sixth station
proposed for Modderfontein. The
network serves middle to upper
income users and has been partly
responsible for significant
redevelopment in Rosebank and
Sandton. The railway network has
also opened up alternative
commuter options to and from
Tshwane and Ekurhuleni Metros. Three phases for the Gautrain have been completed; further works
to connect Southern, Northern and Western parts of the City are still pending to fully integrate a
majority of the nodes. The support from the City is instrumental for these initiatives through insights of
storm-water management, environmental impact analysis and policing to avoid vandalism around the
stations and tracks.
While the Oliver Tambo International Airport is located in Ekurhuleni Metro it is a critical component of
the economic infrastructure of the City. The City welcomes the plans to facilitate the development of
Figure 6 : Major Transportation Routes
Built Environment Performance Plan 2016/17
11 | P a g e
an Aerotropolis at the Airport as this will benefit the entire City Region especially those mixed use
nodes accessed by the Gautrain. Lanseria is the second airport for the City. It is located in the
extreme north of the municipality. It has seen significant growth in domestic flights over the past ten
years. There are significant plans for enterprise development adjacent to the Airport. In support of the
increased demand around the Lanseria node, Joburg Water has invested R10,000,000.00 for the
development of the Waste water treatment plant for the 2015/16 financial year.
The Presidential Infrastructure Coordinating Commission identified a number of Strategic Integrated
Projects (SIPs) to support economic development and address service delivery. The importance of
Gauteng as a region which drives the national economy was highlighted specifically through SIP2 that
related to the Durban-Free State – Gauteng Logistics and Industrial Corridor. The aim of the SIP is to
strengthen logistics and transport corridor between SA’s main industrial hubs and Durban’s export and
import facilities. The City Deep Inland Port and its associated road and rail infrastructure represent
the City of Johannesburg's component in this industrial corridor. Currently the growth and functioning
of the Port is constrained by its geography and relatively low capacity of its existing bulk infrastructure.
Significant infrastructure investment is required to revitalise this critical locale within the City. The City
of Johannesburg cannot on its own fund the realisation of this project. It will require a coordinated
intervention by all stakeholders. In addition further sites for logistics hubs within Johannesburg should
be undertaken to facilitate expected growth resulting from the SIP2 initiative. The proximity and radius
of City Deep hub being within the Turffontein Corridor and the Inner City, is such that it will benefit
significantly from the infrastructure developments by JRA, Joburg Water and City Power. This will in
turn support the high capacity demand from the ports and the SIP2 initiatives.
3 Figure 7: City Deep Logistics Hub
Built Environment Performance Plan 2016/17
12 | P a g e
3. Trends and Demand for Basic Infrastructure
The above section (section 2) reviewed the infrastructure components that form the foundation for
current and future economic growth within the City. This section reviews the basic infrastructure
provided by the Municipality Owned Entities (MoEs), namely: water, sewer, electricity, local roads and
waste removal. Not only are these services pre-requisites for urban living, they also play an important
economic role. It is critical that these services are provided at a high standard and can be accessed by
a range of socio-economic groupings within the City and that the City is adequately remunerated for
these services.
The analysis below is drawn from the Consolidated Infrastructure Plan: Phase 1, which was
undertaken in 2013. The study focused on defining bulk infrastructure requirements for water, sewer,
electricity and roads based on an assessment of information provided by the relevant municipal owned
entities. Phase 2 of the Consolidated Infrastructure Plan is currently underway and will assess the
detailed connector infrastructure for the four services.
3.1 Water
Joburg Water supplies potable water to the residents across the City. The purified water is purchased
from the regional bulk supplier, Rand Water.
Bulk water assets are represented in Figure 8. Bulk water infrastructure is defined as pipelines (the
network illustrated on the map) and fixed
assets which is represented on the map as
dots and squares. The extent (km) and
nature (materials used) of the pipelines
used in the City is represented in Table 1.
The type, number and capacity of the fixed
assets is provided in Table 2.
The estimated current replacement cost of
the City’s water assets is estimated at
R18,437,402,103.00.
Joburg Water’s Business Plan indicates a
level of service backlog, with regards to
water, of 8 521 households, as at December
2015.
An annual growth rate of 3% has been
recorded in a previous 22-month monitoring
period. This increase in water consumption
has been modelled for the next 10 years
including two further scenarios based on the
2011 census customer profile: firstly, based
on an annual projected population growth
rate of 1.7%, and secondly, using the 1.7%
population growth rate but with a
progressive reduction in network leakages.
Thus, in the worst case scenario, a water
demand of around 720 000 Ml p.a. could be
Figure 8: Bulk Water Assets – City of Johannesburg
Built Environment Performance Plan 2016/17
13 | P a g e
expected by 2022, whilst it could be as low as 560 000 Ml p.a. if the annual growth is kept in line with
the demand associated with the expected population growth in addition to a reduction of unaccounted
for water from its present level of 39% to 25%.
WATER PIPELINES (M)
DIAMETER
(MM)
MATERIAL TOTAL
AC uPVC HDPE Steel Other
(MPVC,
GRP)
<100 379 218 2 292 179 416 871 117 355 0 3 205 624
≥100 <200 879 883 3 102 894 115 179 2 275 340 0 6 373 295
≥200 <300 161 679 651 396 11 088 150 501 0 974 664
≥300 <500 127 701 149 120 3 420 522 651 58 802 950
≥500 <700 42 326 35 291 1 493 226 372 498 305 980
≥700 <900 7 153 22 613 1 125 155 008 0 185 899
≥900 301 1 868 0 35 804 0 37 973
Total 1 598 261 6 255 361 549 176 3 483 031 556 11 886 385
ASSET/COMPONENT TYPE EXTENT UNIT CAPACITY
Reservoirs 88 Number 1 707 (Ml)
Water towers 34 Number 23.4 (Ml)
Pump stations 37 Number 9 471 (kW)
PRV stations 477 Number N/A
Valves 55 052 Number N/A
Hydrants 41 440 Number N/A
Meters 485 199 Number N/A
The CIP Phase 1 analyses the City’s future water projects in terms of capital projects and
refurbishment projects. Capital projects refer to projects which are required for water services to
address the growing water demand or replacement projects. Refurbishment projects form part of the
capital project list but have been identified separately. These projects have been identified by
considering assets with a remaining useable life of less than 20 years.
The capital projects required by the City and refurbishment Projects are illustrated in Figure 9. A full
list of water refurbishment projects with estimated budgets can be made available on request. From
the maps it is apparent that capital requirement is primarily in the north, west and south of the City,
while water refurbishment requirements are clustered in the northern central and southern areas.
Joburg Water has a sophisticated infrastructure asset management system by which existing assets
are maintained, upgraded, refurbished and ultimately replaced. This system relates to Joburg Water’s
work schedules.
Table 1: Extent of pipe line network within the City of Johannesburg by pipe size and material type
Table 2: Extent of other water related infrastructure within the City of
Johannesburg
Built Environment Performance Plan 2016/17
14 | P a g e
Figure 9: Water Program
Built Environment Performance Plan 2016/17
15 | P a g e
3.2 Sewer
Given a gravity based system the bulk sewer network follows the City’s valleys. Sewerage is treated
waste water treatment works under the jurisdiction of Joburg Water. The extent and nature of the
sewer pipe network and the fixed sewer related assets is illustrated in Figure 10 and Error! Reference
source not found.. The estimated current replacement cost of the City’s sewer assets is estimated at
R29 588 065 870.
The level of service backlog is approximately 78 823 households regarding access to sanitation as of
December 2015. About 52 054 households have individual access to Ventilated Improved Pit (VIP)
latrines.
Figure 10:City of Johannesburg’s sewer assets
Built Environment Performance Plan 2016/17
16 | P a g e
Table 3: Extent and type of Joburg Water’s wastewater pipelines
WASTEWATER PIPELINES (M)
DIAMETER
(MM)
MATERIAL TOTAL
AC Steel uPVC Concrete Clay HDPE Brick
<200 135 273 294 874 367 13 259 9 226 498 3 398 0 10 253 088
≥200 <300 10 708 2 069 74 248 3 630 408 253 849 0 499 756
≥300 <500 10 067 3 901 41 038 57 061 183 213 1 889 0 297 169
≥500 <700 2 716 1 665 3 074 71 960 4 267 544 0 84 225
≥700 <900 4 191 1 697 0 73 514 287 0 0 79 689
≥900 0 3 012 0 190 720 0 0 602 194 334
Total 162 955 12 637 992 727 410 143 9 822 517 6 680 602 11 408 262
ASSET/COMPONENT TYPE EXTENT UNIT CAPACITY
Wastewater treatment works 6 Number 1 118(Ml/d)
Pump stations 36 Number 4 227 (kW)
Manholes 229 613 Number N/A
Sewer connections 441 502 Number N/A
As with water, the future sewer projects are defined as either capital projects or refurbishment
projects. The location of capital projects and refurbishment projects are represented in Figure 11 .
Figure 11: Sewer Program
Table 4: Extent of other sewer related infrastructure within the City of Johannesburg
Built Environment Performance Plan 2016/17
17 | P a g e
3.3 Electricity
City Power is the municipal owned entity responsible for electricity distribution for a significant
proportion of the City. The bulk assets of the utility include sub-stations, load centres and reticulation,
these are illustrated in Figure 12. More detail relating to the MV and LV networks and associated point
infrastructure will be made available during the Phase II of the Consolidated Infrastructure Plan.
Eskom is responsible for electricity distribution in the north of the City, Soweto, and the greater
Orange Farm area as shown in Figure 13.
Through its 2012/3 master planning process City Power aligned its growth forecasts with the
settlement growth projections captured in the Spatial Development Framework (SDF), to ensure better
alignment of future electrical provision. The Master Plan also assessed the condition of existing City
Power assets. In terms of the master planning exercise, future refurbishment and capital projects were
identified (see Figure 13 and Figure 14). As seen in Figure 14 Refurbishment projects refer to the
renewal of sub-stations and associated assets based on condition assessment. These projects are
concentrated in the Roodepoort and Turffontein areas of the City.
According to Figure 14, there are more capital and/or new projects required by City Power in order to
facilitate the settlement growth of the City. These bulk infrastructure projects include sub-stations,
intake points, load centres, underground cables and overhead transmission lines. A full list of City
Power’s Capital and Refurbishment Projects is available on request.
Figure 12: Bulk Assets of City Power Figure 13 : Location of refurbishment projects required
by City Power
Built Environment Performance Plan 2016/17
18 | P a g e
3.4 Roads and Storm water
The Johannesburg Roads Agency (JRA) is responsible for roads, bridges, certain dams and storm
water within the City. The roles and functions of the JRA are defined in Table 5.
PRODUCT/SERVICE AREA INTERPRETATION
Traffic regulatory
infrastructure
Traffic signalling (robots)
Road markings
Road signs
Regulatory operating system
Road infrastructure Road reserves (footways or pavement, bridges, verge or
edge/border/grass pavement, culvert, guard rails, fencing and
billboards)
Infrastructure development and maintenance
Rail siding infrastructure Rail reserves (bridges, verge or edge/border/grass pavement,
culvert, guard rails and fencing)
Stormwater management Stormwater catchment development and maintenance.
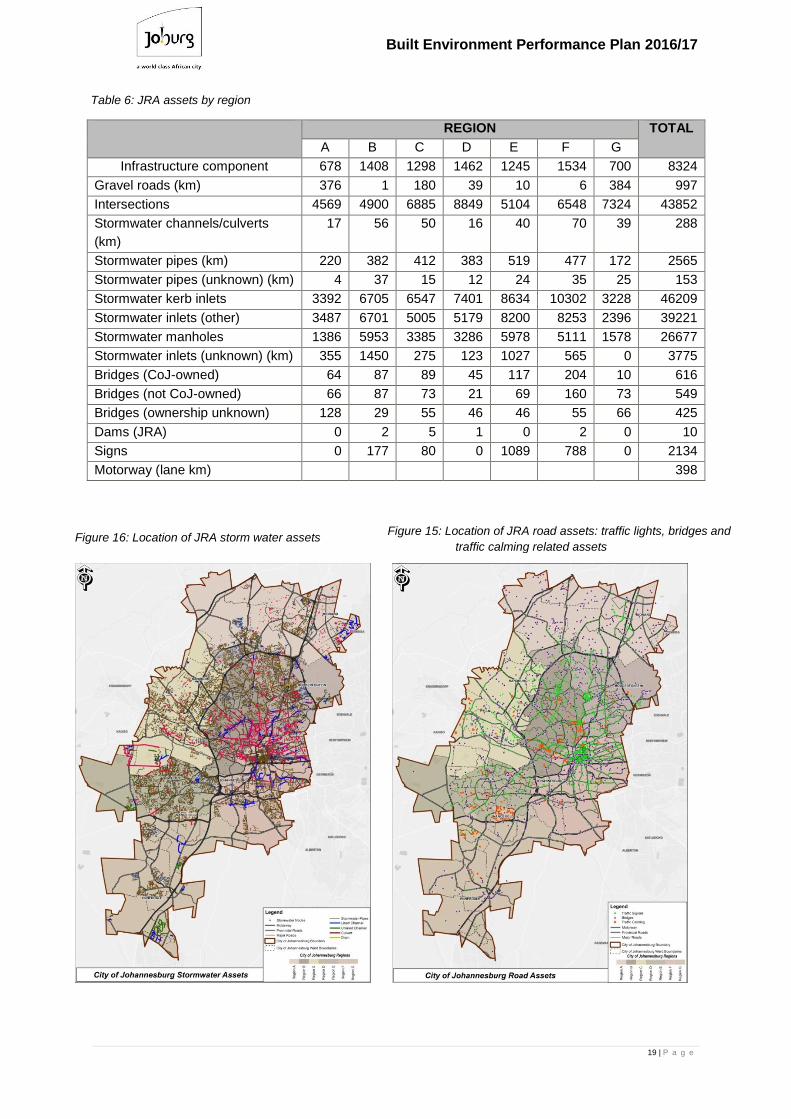
JRA has undertaken a 10 year master plan for its assets that will function as an infrastructure asset
management plan. Based on available information the Consolidated Infrastructure Plan defined JRA’s
assets by the City’s administrative regions (A-G) as captured in Figure 15.
Figure 14: City Power – Required capital
Table 5: Roles and functions of the JRA
Built Environment Performance Plan 2016/17
19 | P a g e
REGION TOTAL
A B C D E F G
Infrastructure component 678 1408 1298 1462 1245 1534 700 8324
Gravel roads (km) 376 1 180 39 10 6 384 997
Intersections 4569 4900 6885 8849 5104 6548 7324 43852
Stormwater channels/culverts
(km)
17 56 50 16 40 70 39 288
Stormwater pipes (km) 220 382 412 383 519 477 172 2565
Stormwater pipes (unknown) (km) 4 37 15 12 24 35 25 153
Stormwater kerb inlets 3392 6705 6547 7401 8634 10302 3228 46209
Stormwater inlets (other) 3487 6701 5005 5179 8200 8253 2396 39221
Stormwater manholes 1386 5953 3385 3286 5978 5111 1578 26677
Stormwater inlets (unknown) (km) 355 1450 275 123 1027 565 0 3775
Bridges (CoJ-owned) 64 87 89 45 117 204 10 616
Bridges (not CoJ-owned) 66 87 73 21 69 160 73 549
Bridges (ownership unknown) 128 29 55 46 46 55 66 425
Dams (JRA) 0 2 5 1 0 2 0 10
Signs 0 177 80 0 1089 788 0 2134
Motorway (lane km) 398
Figure 16: Location of JRA storm water assets
Figure 15: Location of JRA road assets: traffic lights, bridges and
traffic calming related assets
Table 6: JRA assets by region
Built Environment Performance Plan 2016/17
20 | P a g e
Location of traffic lights, bridges and traffic related assets is illustrated in Figure 15. The location of
stormwater related assets is represented by Figure 16.
3.4.1 Maintenance
According to the Consolidated Infrastructure Plan:
JRA has level 1 maintenance plans
JRA Depots have a systems application programming (SAP) system to manage operations
Footways and the road verge are maintained according to a management system of 1996.
JRA does not have sufficient budget to operate and maintain its existing assets.
The majority of road infrastructure is maintained primarily through inspections by officials and/or
through complaints from the public, which are programmed/ prioritised on the system for
implementation. This includes roads (surface), road signs and markings, storm water inlets (kerb
inlets), and roadside furniture and traffic signals.
3.4.2 Infrastructure Requirements
The CoJ road hierarchy project identified major road projects. These were projects for new roads or to
increase capacity of existing roads with the aim of addressing traffic congestion within the City. These
also include capital projects relating to bridges, road reconstruction, road resurfacing, storm-water
projects and operational capital projects were captured on the City’s Capital Investment Management
System.
3.4.3 Backlogs
A backlog that addresses poverty in the context of roads in the City of Johannesburg refers to the
tarring of gravel roads in former black townships and in low income township developments. These
areas are Ivory Park, Mining Belt, Greater Orange Farm Area and Diepsloot. The current backlog with
regard to gravel roads is just about 350 kilometres. The cost of funding this backlog is approximately
R1.2 billon and the estimated time that it would take to eradicate is dependent upon annual capital
budget allocations. Other road related backlogs and estimated funding requirements are captured in
Error! Reference source not found..
DESCRIPTION UNITS PERIOD TO
ERADICATE
ESTIMATED
COST
Gravel Roads programme
Upgrading of Gravel roads to surfaced (Prioritised
areas)
350 km Dependent on
budget
R 1.200
Billion
Roads Infrastructure programme
Road Reconstruction Dependent on
budget
R 520
million
Storm Water Management programme
Upgrade of storm water systems and catchments Dependent on
budget
R 900
million
Upgrade of storm water system improvements
based on level 4, 5 audits
Dependent on
budget
R 154
million
Table 7: JRA related City wide backlogs by programme
Built Environment Performance Plan 2016/17
21 | P a g e
Backlogs relating to stormwater (flooding) hotspots and gravel roads are illustrated in Figure 17 and
Figure 18 respectively. These backlog estimates are to be updated as and when new information
becomes available relating to the state of the assets.
Figure 18: Gravel road programme areas
3.5 Waste Management
Waste management within the City is the responsibility of the municipal owned entity PIKITUP.
PIKITUP’s assets include four operational landfill sites (see Table 8), depot’s which provide refuse
collection and disposal facilities (see Table 9), 42 garden refuse transfer sites and a composting site at
Panorama and a variety of vehicles to transport the refuse. In addition, there is a plant and equipment
associated with the waste management business. Some of PIKITUP’s capital budget goes to the
upgrading expansion of its fixed assets and the purchase of movable assets.
Bridges programme
Construction of pedestrian bridges 12 Dependent on
budget
R 84 million
TOTAL FUNDS REQUIRED R 3.194
Billion
Figure 17: Stormwater/flooding hotspots for City of
Johannesburg
Built Environment Performance Plan 2016/17
22 | P a g e
LANDFILL SITES STREET ADDRESS SUBURB
Goudkoppies (G:L:B-) Houthammer Road Devland
Marie Louise (G:L:B-) Dobsonville Road Roodepoort
Robinson Deep / Springfield (G:L:B-) Turffontein Road Turffontein
Ennerdale (G:M:B-) Old Lawley Road Lawley
Linbro Park - Closed 30 September 2006 Marlboro Drive Sandton
Panorama- Closed 2003 Hendrik Potgieter and Jim
Fouche Roads
Roodepoort
DEPOT STREET ADDRESS SUBURB
Avalon Calandula Street Klipspruit West
Central Camp Cnr Old Potch Road & Nicholas Street Diepkloof
Midrand Stand 142, 16th Road
Randjespark
Marlboro 9th Street Marlboro
Norwood Cnr Short & Pine Streets Orchards
Randburg Cnr Malibongwe Drive & Hans Schoeman
Streets
Randburg
Roodepoort 10 Granville Road, Lea Glen Roodepoort
Selby Cnr Village & Usher Streets Selby (Jhb CBD)
Southdale Cnr Side Road & Third Street
Southdale
Waterval Depot 2 Alberts Street Albertsville
Zondi Depot Cnr Koma and Elias Motsoaledi Zondi
PIKITUP is currently undertaking a change strategy that focuses on waste minimisation to alleviate
pressure from the existing landfills. Capital is being spent presently and in the foreseeable future on
mainstreaming the separation of waste at source, and to facilitate associated recycling and reuse
facilities and infrastructure. These initiatives will take up a greater percentage of the capital spend in
the short to medium term.
One of the challenges facing PIKITUP is that the existing landfills are fast reaching their expected
lifespan (see Table 10). Additional land is being sought for future landfills. PIKITUP is investigating the
potential of regional land to the north of the municipality. Assistance from relevant provincial and
national is requested to finalise these investigations and secure a site for such a facility.
Table 9: PIKITUP depot sites that facilitate waste collection in the City
Table 8: City of Johannesburg Landfill which fall under PIKITUP
Built Environment Performance Plan 2016/17
23 | P a g e
Ennerdale Marie Louise Goudkoppies Robinson Deep
Total airspace
(including cover)
per design
2,223,209m3 6,796,717 m
3 9,691,222 m
3 22,968,866 m
3
Consumed
airspace
972,963 m3 4,563,921 m
3 4,553,533 m
3 16,965,061m
3
Airspace available
for waste disposal
as of 2012
(including cover)
1,250,246 m3 2,232,796 m
3 5,137,689 m
3 6,003,805 m
3
Waste over
weighbridge p.a.
(May 2011-May
2012)
135,523 tonnes 442,967 tonnes 413,547 tonnes 509,366 tonnes
Projected landfill
lifespan (years)
13 years 6 years 16 years 17 years
End date April 2025 March 2018 January 2028 February 2029
Another area where future capital expenditure is to be located is in the purchase of portable builder
rubble crushers and the construction of permanent rubble crusher units. This is in order to use a
potential profitable means of addressing the challenge of illegal builders’ rubble dumping in the City,
which has reached epidemic proportions.
Purchase of waste vehicle (compactors), and plant and equipment for the landfill sites is becoming an
increasing burden on PIKITUP’s fiscus. Alternative solutions to this perennial problem are requested
from the responsible provincial and/ or national government.
Table 10: Available airspace for operational PIKITUP landfills and expected lifespan of aforementioned landfills
Built Environment Performance Plan 2016/17
24 | P a g e
Subdivisions
10 dwelling units per ha
10-40 dwelling units per ha
40-70 dwelling units per ha
70-120 dwelling units per ha
Township Applications Submitted
Regions
4 Trends and Demand for Residential Infrastructure
The City developed the Sustainable Human Settlements Urbanisation Plan (SHSUP) which highlights
and suggests proposals for existing and future residential development within the City.
4.1 Residential Growth Trends
Market forces, informal development pressures and government investment over the last two decades
resulted in distinct spatial trends in meeting the demand for residential development. These were:
Greenfields developments in the form of township establishments that, in the majority of
cases, take the form of low to medium density urban sprawl on the western and north-western
fringes of the urban area. These developments are both private (primarily town house
developments) and state driven (mostly RDP style housing projects) (see Figure 19).
Densification through subdivision and redevelopment of existing urban areas into medium to
high density residential stock. This trend has placed a burden on the existing infrastructure
capacity within these areas.
Figure 19: New residential development within the City of Johannesburg by density, including township applications
Built Environment Performance Plan 2016/17
25 | P a g e
The proliferation of informal settlements on the outskirts of the City. These trends of urban
sprawl and intermediate densification in areas that are not designed for, or serviced by a
public transport systems are not regarded as sustainable. Urban sprawl, however, has been
successfully curbed by the institution of an urban development boundary instituted by the
Spatial Development Framework. The proliferation of informal settlements has also resulted
in an equally unsustainable pattern, concentrating large enclaves of poverty at the extreme
fringes of the city. This pattern has resulted in vulnerable communities without adequate
access to existing urban opportunities, high transportation costs and very low-key local
economic activity. The high rate of urbanisation has also resulted in nodal areas like the Inner
City being transformed with slum conditions evident in some parts.
Figure 20: Location of settlements proposed in terms of the Provincial housing Programme
Built Environment Performance Plan 2016/17
26 | P a g e
(
(
(
(
(
(
(
(
(
(
(
(
Soweto
Lenasia
Midrand
Sandton
Lanseria
Fourways
Randburg
Diepsloot
Ivory Park
Roodepoort
Orange Farm
Johannesburg CBD
Motorway
Informal_Settlements
Regions_2012
CoJ_boundary
Ü
0 3 6 9 121.5
Kilometers
4.2 Public housing
Large scale government housing programmes (Figure 20) are still predominantly provided at the edge
of Johannesburg’s urban system. These are RDP style subsidised housing developments that are
scoring very low on the Sustainable Human Settlement Index. This trend entrenches the geography of
poverty and is in direct conflict with one of the fundamental growth principles of curbing the creation of
large enclaves of poverty. The impact of these projects should be considered within the context of the
Gauteng City Region, not necessarily from individual municipalities’ perspectives and far better
coordination should be facilitated by the Provincial Government to ensure a more integrated approach
to housing solutions. With the finalisation of the housing accreditation process the Provincial Housing
Programme will need to be reviewed.
Figure 21: Location of Informal Settlements within the City of Johannesburg
Built Environment Performance Plan 2016/17
27 | P a g e
4.3 Informal settlements
The Sustainable Human Settlement Urbanisation Plan (March 2012) compiled for the City’s Housing
Department, provides an overview of the spatial location and characteristics of informal settlements in
Johannesburg (also see Figure 21). It is estimated that currently the City has 252 informal settlements
with an estimated 164 939 informal structures. The CoJ informal settlement database identifies each
informal settlement by name and spatial referencing, and links the settlement to a dataset with
attributes (such as number of units, ownership, infrastructure, category – i.e. relocate, in-situ upgrade,
regularise, project linked).
A majority of the City’s informal settlements are in Region A, mainly around Diepsloot (25 000 units)
and Ivory Park (15 000 structures), as illustrated in Table 11. Regions B and F have the fewest informal
settlements, with less than 9 000 structures – these settlements are mostly well-located within the
urban structure, within the Inner City or close to railway stations, industrial areas and other amenities.
The informal settlements in Region C show a strong correlation with the western mining belt and
represent 38 032 units (23% of the City’s informal structures). Soweto (Region D) has a recorded
number of 26 settlements, totalling approximately 12 926 units. Most of these settlements are around
the railway lines in areas such as Kliptown. Alexandra in Region E still accommodates 16 informal
settlements, with the largest of them located along the Jukskei and its tributaries. Region G has about
85 settlements. More than 45 447 structures have been eradicated in this region by way of
formalisation processes over the last number of years.
Almost 64% of the households are subject to in-situ upgrades via existing projects or programmes
(specifically via the Alexandra Renewal Programme and Kliptown Regeneration initiatives). However,
from practical experience the yield reflected by the respective projects is frequently insufficient to cater
for the full needs and numbers of all households per settlement and an overflow needs to be budgeted
for. Similarly, issues relating to non-qualifiers in terms of subsidy administration also provide
challenges in relation to allocation of projected yields and number of households within settlements.
Table 11: Informal Settlements by Administrative Region
Built Environment Performance Plan 2016/17
28 | P a g e
4.4 Backyard units
Most of the City’s 320 652 backyard units are located in Region A (34%) and Region D (44%). In
some instances, there are twice as many backyard shacks as there are units in informal settlements in
the City. These are shacks constructed of metal, plastic or blocks that are on the same property as a
formal dwelling (often an RDP unit). Backyard units represent a far greater challenge to the
municipality due to the scale and the complexity of regulating the phenomenon. If managed properly
backyard shacks can realise a significant income for poor landowners and an important rental market
for migrants arriving to the City.
There is a definite correlation between backyard units and better located areas with infrastructure,
such as Alexandra, Ivory Park and Diepsloot, as well as Soweto, compared to Region G that only
accommodates 10% of all backyard units.
The spatial distribution of backyard units can be summarised as follows:
Region A: the backyard units are primarily located in Diepsloot, Ivory Park and the southern
parts of Rabie Ridge
In Region C, backyard structures have been recorded in Thulani, Bramfischerville, Sol
Plaatjies and Tshepisong
Soweto (Region D) has backyard units in all residential areas
Region F: The backyard units are more than double the number of units recorded in informal
settlements and are located in Berea towards the north and in the entire area between
Jeppestown and Malvern to the east along Jules Street and the railway line
Region G: The Deep South – Orange Farm/ Zakariyyah Park accommodates the densest
patterns of backyard units compared to areas like Ennerdale, Finetown and Lawley
4.5 Social Housing and Hostels
Most of the City’s social housing projects are well located in the Inner City or the Perth-Empire
Corridor of Freedom. The main implementing agents of social housing are JOSHCO, JHC and the
ARP and they have completed projects providing an estimated 5 483 units in 16 different projects.
There are very few social housing projects that form part of any large scale RDP housing projects.
There are 21 hostel projects underway in the City, representing a total of 15 114 units. Most of the
hostels are located in the Inner City and Soweto. With regards to rental demand, it is of interest to note
the information published by the Social Housing Foundation on the rental market in Gauteng, which
indicates that the City has the highest numbers of rented dwelling units in the province, which
represents about 31% of all households in the City.
4.6 Meeting Residential Demand
The key focus of the city is on creating a range of housing typologies and tenure options supported by
extended public transport infrastructure. Additionally, the construction and operation of appropriate
infrastructure and community facilities in these communities is critical to creating sustainable human
settlements. The City’s key policy position and requirements for meeting residential demand is
outlined in the Sustainable Human Settlement Urbanisation Plan of 2012 and can be summarised as
follows:
4.6.1 Human and Social Development
Built Environment Performance Plan 2016/17
29 | P a g e
A significant proportion of the subsidy-eligible population has the liquidity to invest in their
housing – just not enough to purchase a whole house therefore we need a diversity of housing
products that match the affordability profile of the population.
The provision of social facilities and infrastructure within new residential townships often lag
behind the construction of houses. However, the same information is required for bulk
infrastructure, along with a costing or cost benefit analysis of infrastructure provision. The
facilitation of public investment in bulk and social infrastructure and amenities needs to be
aligned with new housing settlements and those existing areas currently in need of re-
investment. The outcome of this investment will be an integrated environment improving the
overall quality of life for the City’s residents.
The City is characterised by periodic migration patterns. The spatial and social needs of the
target market need to be assessed and understood to be able to make appropriate decisions
relating to affordability of housing products, financial instruments and others.
4.6.2 Economic Growth
High levels of unemployment
and the informal development of backyard shacks as an income generator could well be due
to the impact of the segregation of “RDP type housing” from job opportunities and social
services.
A “better spatial location” relative to others in the City will not address the issues of job
availability and job creation in and of itself. This will require an upturn in economic activity
matching skills levels available with the opportunities created in different parts of the City.
A comprehensive strategy dealing with economic development, investment and job creation in
the City is a critical step towards bridging the gap regarding this issue and to achieve a
sustainable city in future.
4.6.3 Environment and Services
Acknowledgment the informal sector and the importance of the green economy in terms of job
creation, waste management systems, local economic development and urban regeneration.
Transportation corridors have a critical role to play in connecting different regions of the city
and linking the housing, economic and social components of the SHSUP. The City will need to
engage extensively with the Transport Department to consider and implement critical transport
linkages to unlock development potential where lacking in strategic areas, and to enhance the
functional integration between land use and transportation in the City.
The SHSUP emphasises the need to develop a well-researched process of land banking in
response to the Strategic Areas. It is also important to expand existing institutional structures
such as the City’s Joint Land Steering Committee in order to ensure that all public owned land
in the City is optimally utilised for purposes of providing housing and/or social services and
facilities, rather than making the land available to the private sector to develop for short term
profit purposes.
4.6.4 Governance
Existing housing programmes and their associated funding mechanisms remains a key
financial driver. The City will therefore need some financing arrangements that do not depend
solely on the existence of a national housing subsidy programme will be key in shifting the
focus and qualitative aspects of residence provision in the City.
Built Environment Performance Plan 2016/17
30 | P a g e
To implement the SHSUP effectively the boundaries of current policy will need to be tested
and will require a champion to support a new financing approach that draws in the
participation of the state, private and household sectors.
The City proposes the following adjustments to the current National Housing Subsidy Scheme
in order increase the efficiency and effectiveness of sustainable settlement:
– The affordability of the State and the affordability of the household should be bridged
through an arrangement of appropriately structured financial products to deliver adequate
housing.
– The scale of delivery of backyard rentals is unmatched by the public sector. The state will
need to financially or administratively support these efforts of citizens.
– Redevelopment and regeneration in strategic locations attracts the private sector to invest
in these areas. This requires the state’s investment in terms of infrastructure and social
amenities – resource strapped local government is unable to deliver at the scale and
speed required.
– Remove or otherwise address the resale restrictions currently applying to subsidised
housing - housing delivery occurs not only through the construction of new units, but also
through subdivisions, home improvements and extensions, and critically, the resale
market.
– Controls are required to ensure that the funding for subsidised housing as well as
necessary approvals from planning processes are obtained timeously.
It is acknowledged that the current housing funding mechanism has limited the development
of higher-density subsidised residential developments. In addition, development costs render
high-density mixed developments / redevelopments extremely challenging from a financial
perspective. Innovative financial mechanisms like extending the payback period for housing
bonds from 20 to 25 years (which would reduce the monthly instalment fee), or the
introduction of a tax break to projects which include medium to high density affordable housing
units similar to the tax benefits provided to developers as part of the Urban Renewal Tax
Incentive, could be introduced to make high density developments more affordable to the
poor, and financially viable to the private sector.
70% to 80% of residents fail to leverage the full financial benefits associated with capital
growth in house prices – and the associated downstream rateability benefits for the
municipality.
Historically, decisions relating to policy, strategy and delivery of housing have been mainly
around the cost and capital spent of the top structure and infrastructure. Costs should be
understood, defined and measured in terms of qualitative aspects relating to sustainable
human settlements in a broader sense.
A need exists to establish an institutional environment that allows the resale market to work at
the lower-end of the housing ladder which will assist in the “churn” and flow congruent with the
middle and higher end of the market. The City will need to consider whether it could utilise the
Sustainable Services Cluster as its institutional arm for the implementation of the SHSUP.
This cluster should form an oversight mechanism and framework for the SHSUP, and be
aligned with the GDS outcomes. In addition, the City’s Department of Human Settlements
must continue the process to obtain housing accreditation level 3 in order to receive direct
funding for the delivery of SHS.
The City must ensure the establishment of well-defined roles and responsibilities and
accountability in the delivery of sustainable human settlements. Multi-sector integration
across the entities and agencies responsible for policy formulation, planning and
implementation of sustainable human settlements would be critical.
The policy position relayed in SHSUP has a distinctive spatial rationale for future development of
residential development within the City. This is reflected in the following map (Figure 22) and
Built Environment Performance Plan 2016/17
31 | P a g e
accompanying description. Realisation of the Plan is dependent on the governance, infrastructure and
economic growth considerations being addressed.
Since the adoption of SHSUP, the public transport corridors (including the Corridors of Freedom)
have increased the number of routes within the City. This has shifted the areas of priority as defined
in Figure 22. However, the focus has also been on directing residential development to the Public
Transport Priority Network to the existing housing projects in order to complete infrastructure in place.
In addition, the redevelopment areas, the long term consolidation, infill areas as well as the
expansion of identified areas remain the policy of the human settlement department for the City.
The SHSUP has also provided tools and associated projections for the medium term provision of
housing typologies as illustrated in Table 12.
PROJECT TYPE
Infrustructure
Cost ( R )
Top Structure
Cost ( R ) Total Cost ( R )
% Cost Split
per Project
Type
UNITS TO BE
DELIVERED RDP Bonded Rental
Serviced Sites
Completed to
date
Units
CompleteSocial/Rental med and higher
density residential Totals 140900000 1540495000 1681395000 31 5111 250 550 4311
Mixed housing project Totals 710523400 2045451010 2755974410 51 36690 17289 8108 11293 5699 1505
RDP project Totals 97000000 709346250 806346250 15 22570 22570 0 0 24003 8019
Grand total 1159773400 4295292260 5455065660 100 64371 40109 8658 15604 29702 9524
% Split Housing Type 62 13 24
Figure 22: Priority Areas per the Sustainable Human Settlements Urbanisation Plan (SHUSUP)
Table 12: Possible scenario for the provision of certain housing types for the City as per SHSUP
Built Environment Performance Plan 2016/17
32 | P a g e
In terms of unit typology the outcome of these projects will be at about 62% of units will be RDP type
units, 24% will be medium to high density rental and social units and 13% will be bonded. In terms of
the allocation of funds 31% are allocated towards medium to high density rental and social units, 51%
towards mixed typology projects where a typical split of 50/25/25 for RDP/rental/bonded are
achieved. Only 15% of funds will be allocated to exclusively RDP projects. These funding allocations
are illustrated in Table 12.
The shift to more integrated higher density rental and social housing is gaining momentum as a
substantial amount of planning has been concluded to facilitate the development of such projects.
The Inner City and other well established nodes such as Randburg and Roodepoort CBD offer high
potential for affordable higher density residential and are key focus areas for redevelopment.
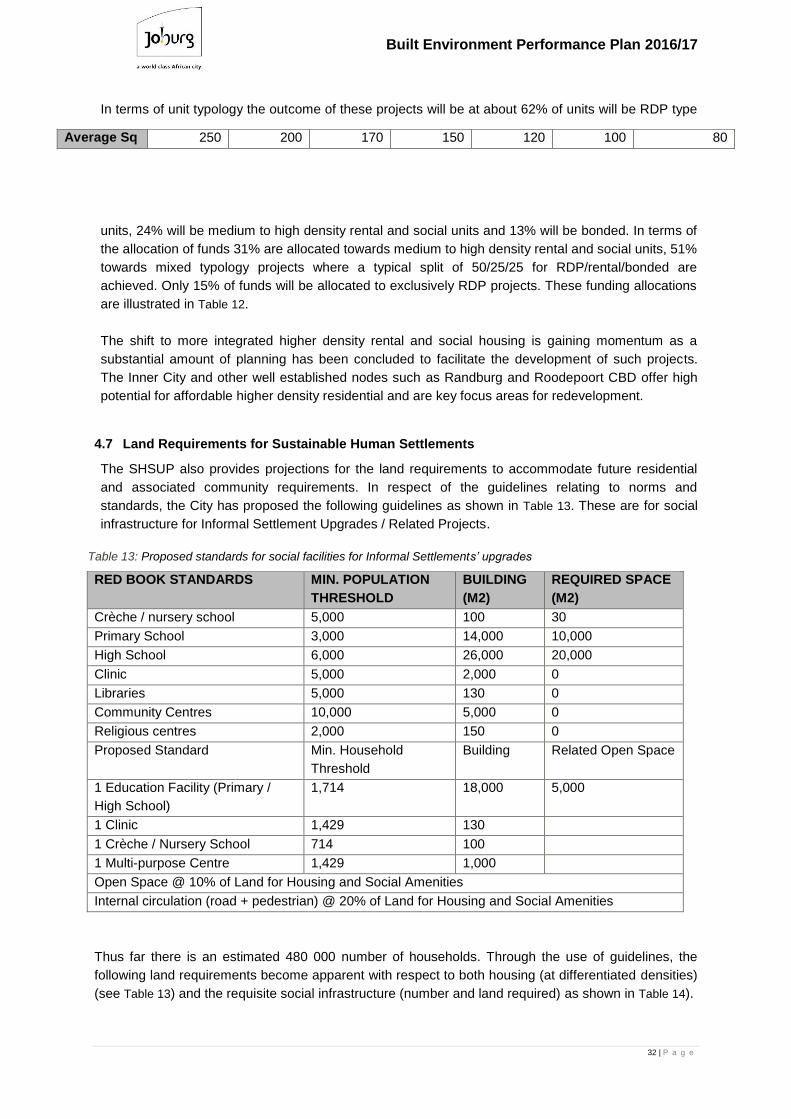
4.7 Land Requirements for Sustainable Human Settlements
The SHSUP also provides projections for the land requirements to accommodate future residential
and associated community requirements. In respect of the guidelines relating to norms and
standards, the City has proposed the following guidelines as shown in Table 13. These are for social
infrastructure for Informal Settlement Upgrades / Related Projects.
RED BOOK STANDARDS MIN. POPULATION
THRESHOLD
BUILDING
(M2)
REQUIRED SPACE
(M2)
Crèche / nursery school 5,000 100 30
Primary School 3,000 14,000 10,000
High School 6,000 26,000 20,000
Clinic 5,000 2,000 0
Libraries 5,000 130 0
Community Centres 10,000 5,000 0
Religious centres 2,000 150 0
Proposed Standard Min. Household
Threshold
Building Related Open Space
1 Education Facility (Primary /
High School)
1,714 18,000 5,000
1 Clinic 1,429 130
1 Crèche / Nursery School 714 100
1 Multi-purpose Centre 1,429 1,000
Open Space @ 10% of Land for Housing and Social Amenities
Internal circulation (road + pedestrian) @ 20% of Land for Housing and Social Amenities
Thus far there is an estimated 480 000 number of households. Through the use of guidelines, the
following land requirements become apparent with respect to both housing (at differentiated densities)
(see Table 13) and the requisite social infrastructure (number and land required) as shown in Table 14).
Average Sq 250 200 170 150 120 100 80
Table 13: Proposed standards for social facilities for Informal Settlements’ upgrades
Built Environment Performance Plan 2016/17
33 | P a g e
SOCIAL FACILITIES REQUIRED FACILITIES REQUIRED
ROUNDED SQ. METRES HECTARES
Education Facility (Primary / High School)
140 140 3,220,000 322
Clinic 168 168 21,840 2
Creche / Nursery School 336 336 33,600 3
Multi-purpose Centre 168 168 168,000 17
Sub-total for Social Amenities 812 812 3,443,440 344
Realising SHSUP land requirements is beyond the resources of the City. After a series of evaluations
via satellite photography (2009) and preliminary environmental assessments the City has earmarked
+/-140 portions of land (an extent of +/- 680 hectares) to support in-fill, Transit Orientated
Development densification for mixed-income / typology initiatives. Characteristically, these portions:
Are considered to be under-developed / vacant.
Are currently managed via the Johannesburg Property Company.
Have been reserved / protected from alienation via Mayoral Committee and Council Resolution
until detailed feasibilities have been completed.
Are within 1km of the emerging Bus Rapid Transit (BRT) and / or the existing rail station
infrastructure.
metres per Erf
Correlating Densities (Nett)
40 50 59 67 83 100 125
# of Resident Households
Hectares Required
240,000 6,000 4,800 4,080 3,600 2,880 2,400 1,920
Metres Sq Required
60,000,000 48,000,000 40,800,000 36,000,000 28,800,000 24,000,000 19,200,000
Table 14: Land requirements for housing at different densities and erf sizes
Table 15: Social Facility requirements
Table 16: Residential Requirements (by erf size and density), Social Facilities Requirements, open space
requirements and servitude requirements translated into hectares of land
Built Environment Performance Plan 2016/17
34 | P a g e
Have been provisionally screened and vetted by the Environment Department (noting that in
some cases, more detailed environmental assessments would be required).
To meet the land requirements for future residential development, the City will require the
cooperation of all public and private land owners.
4.8 Community Infrastructure Requirements
The development for social and community facilities targets the most deprived areas and where there
is a high population density. Apart from the Alexandra Renewal Programme, (ARP), there are
marginalised areas development programmes in Orange Farm, Diepsloot and the Greater Ivory Park
area. The intention of these programmes is to provide facilities and infrastructure in order to create
sustainable human settlements that are integrated with the rest of the urban system in order to realise
the vision of SHSUP. Where it is viable, options to provide multiple municipal services in one facility
will be implemented. Although these are the priority locations for social facility provision, there are
many areas in the City that require urgent upgrades to existing facilities.
Achieving sustainable human settlements is a long term process that will require substantial
resources. The limited ability of Council to afford and sustain the required capital investment for social
facilities is not enough to make a substantial difference over the next decade. A key concern remains
the provision of facilities by the Provincial Department in relation to the alignment and coordination of
resources and facilities. There are cases where little information is shared and prioritisation decisions
are made without consultation with the City.
A project to model the need and accessibility of social facilities and services was undertaken by the
DPSA and CSIR in 2012. Key findings of the research were that social facilities in Johannesburg were
in general ‘found to be well distributed although lacking in service capacity.’ Hence there is a need to
maximise the capacity of existing social facilities and to focus on improving the management of these
facilities. This is in order to provide quality services as emphasised in the research. Clustering of
services in a single facility was proposed as a means of promoting cost effective service provision.
Areas identified to have under provision of social facilities by the Study were ‘Soweto, Diepsloot, Ivory
Park, Alexandra, the Inner City, Orange Farm and Cosmo City. Specific social facility backlogs for the
City of Johannesburg were defined as follows in the research report:
Facility Type Quantity Required
Social Grant Payment Points 19 New Payment Points
Parks 200 proposed parks at a minimum size of 0.4 ha
Fire Stations 4 new stations Required
Libraries 3 new libraries required, and Expansions required to
5 existing facilities
The proposals made in the study will be included within the capital planning processes undertaken by
the relevant departments and Municipal Owned Entities within the City. It must be noted that the Study
focused on the existing urban footprint of the City and did not take into account future Greenfield
housing projects.
4.8.1 Transportation Modal
As discussed previously, a high capacity functioning transport infrastructure, either rail, road or air is
an economic and social priority for the City. An improved transport system provides sustainable
Built Environment Performance Plan 2016/17
35 | P a g e
employment opportunities for dispersed communities to locations that have a high economic activity.
This anchors future economic growth for mixed use and industrial nodes through the concept of transit
orientated development. The improvements in the transport modal shifts results in economic benefit
due to less time spent commuting, better connection of nodes and decrease in greenhouse gas
emissions within the City.
Figure 23: Primary regional movement patterns
Built Environment Performance Plan 2016/17
36 | P a g e
Johannesburg’s transport realities are characterised by two distinct features:
A great number of residents do not own private cars and thus travel by bus, rail or private
minibus taxis.
In contrast, middle-income residents are resolutely car-orientated, with an increase in travel
times of nearly 60% since 1980 due to traffic congestions and remoteness of work and
residential areas.
This has resulted in a transport system that includes the following:
Where land uses are designed for private vehicles
The previous public transport systems were inefficient and not designed to benefit the user
A hierarchical road network with numerous unconnected roads, loops and dead-ends
Compromised mobility along major arterials.
Figure 23 depicts the regional movement patterns and it is quite vivid that the Johannesburg Inner City
plays a central transportation role within the region. As well, a lot of movement is to the north
(Pretoria) and east of the city (Ekurhuleni), an indication of economic activity between these nodes.
Public transport is the most optimal investment to mitigate against increasing petrol prices, the cost of
maintaining road infrastructure and increasing air pollution. The City has introduced the Rea Vaya Bus
Rapid Transit system and the Gautrain high-speed rail link. These form the back bone of a future
urban public transport system. The potential of modal shifts present a number of opportunities for
economic development and improved city living.
Figure 24 is a representation of the assumed figures for passenger ridership (assuming that Phase 1
of the Rea Vaya BRT would carry 430 000 passengers per day). This assumption is modelled to
reflect the impact the move would have on private vehicle use, and the use of other modes of
transport.
Even if this assumption is ultimately realised, the graph demonstrates that private cars will remain
dominant for the foreseeable future. There are some indications from the rollout to date that further
reductions in private cars could be achieved through the full implementation of the Rea Vaya BRT.
However, when projecting to 2040, it is argued that significant increases in the use of bus and rail will
need to be actively targeted.
This will require a re-engineering of parts of the City to become public transport corridors where
economic activity, community services and residential developments service and are serviced by a
bus based public transport system. Where a broad range of socio-economic groups live and work
together. A public transport environment that serves the young, the old and those living with
disabilities. Such an initiative will require a long term investment in social, residential and economic
infrastructure associated with the identified corridors, combined with an on-going marketing campaign
to promote public transport and the corridors themselves. To this end the City has launched the
Corridors of Freedom initiative which is now at its implementation phase. The Corridors of Freedom
envisages a network of public transport corridors based on the Rea Vaya bus system and the Gautrain
Stations across the City (see Figure 25 ).
Built Environment Performance Plan 2016/17
37 | P a g e
Figure 24: Assumed future ridership per transport mode within the City of Johannesburg
Figure 25: The Corridors of Freedom – (Turffontein Corridor; Perth-Empire Corridor and Louis Botha Corridor
Built Environment Performance Plan 2016/17
38 | P a g e
The Corridors of Freedom will connect the former black townships of Diepsloot, Soweto and Alexandra
with the CBD and other major mixed use nodes. These strategic spatial nodes promote the Corridors
as locations for investment and residential densification. The Corridors of Freedom will be a mixed
land-use type dominated by high-density accommodation options, supported by office buildings, retail
development and opportunities for leisure and recreation.
The intention is that residents of the City will live closer to their workplace, stay and play without
having to use private motorised transport. It is envisaged that there will be safe, affordable and
convenient buses, cycling and pedestrian activity.
The new City skyline will consist of high-rise residential developments growing around the transit
nodes, gradually decreasing in height and density as it moves further away from the core. Social
infrastructure, schools, clinics, police stations and government offices will be strategically located to
support the growing population.
The key features of the Corridors of Freedom are:
Safe neighbourhoods designed for cycling and walking with sufficient facilities and attractive
streets
Safe complete streets with features to calm traffic, control vehicle traffic speeds and
discourage the use of private transport
Rich and poor, black and white living side by side - housing options provided cover a range of
housing types and prices including significant rental accommodation component
Limited managed parking to reduce the amount of land devoted to parking and further
discourage the use of private transport
Convenient transit stops and stations
A strategic area policy framework has been undertaken for the Louis Botha, Perth-Empire and
Turffontein Corridors Areas. Through these frameworks areas for transit orientated development have
been identified, typologies for residential development defined, population projections proposed with
associated requirements for social, economic and service infrastructure. In turn these requirements
have been reflected in the City’s capital budget.
It is envisaged that each corridor will be a priority for City Capital investment for a 6 to 9 year period,
before another corridor becomes the focus for such funds. The realisation of the City’s vision for the
Corridors will require a range of coordinated public and private sector funding in order to ensure the
success of the Corridors of Freedom. This should be in conjunction with on-going leadership from
business, local, provincial and national government leadership.
The Corridors of Freedom is the central built environment concept that will realise significant change in
the urban form of the City. The Corridors of Freedom will include bullets from safe and Strategic Area
Framework (SAF) boundary maps.
Built Environment Performance Plan 2016/17
39 | P a g e
4.9 Sustainable Development Requirements
The City of Johannesburg falls within two priority areas identified in the National Spatial Biodiversity
Assessment (NSBA, Driver et al. 2004). It is also home to a disproportionately high percentage of rare
and threatened species and threatened ecosystems. A high proportion of South Africa’s mining
activity, heavy industry, commercial enterprise and urban population are located in the bioregion. As a
result, there are high pressures placed on the environment and the remaining natural ecosystems and
opportunities for conservation of biodiversity are limited.
There are at least 12 threatened plant
species and 10 threatened animal species in
the City of Johannesburg, and 9 ecosystems
listed as threatened according to NEMBA
2008. Aquatic systems are equally unique in
the bioregion and 100% of wetlands types
and 20% of river types in the City are listed
as threatened. Just over a third of the City of
Johannesburg is in a natural or near natural
state (36%), with urban development (48%),
agriculture (11%) and mining (5%) together
covering 64% of the City.
The high levels of urbanisation within the City
it is not an issue as to whether ecological
infrastructure constrains urban growth but a
function of the opposite relationship. Areas
of high biodiversity have been identified for
conservation, but the purchase and
subsequent management of such areas has
not happened. This is because there are
other developmental priorities for the City
and limited financial resources. Similarly the
urban population has generated high levels
of waste which often degrade existing open
space and bio-diversity hot-spot areas.
Related to the protection of biodiversity, it is the need to provide recreational open space in the form of
parks. From the CSIR study as depicted in Figure 26, it is clear that while the central and northern
areas of the city (shaded green) are well provided for with open space. However, the peripheral areas
of the City have experienced rapid urbanisation are in need of new parks (areas shaded yellow and
red).
The analysis revealed that the City’s lower density areas are best served in terms of park provision
with 61% of these areas being within a 1km distance of a park. This figures reduced to less than 40%
in the “High” and “Intermediate” areas. These include some priority areas for the City which includes
large portions of suburban Soweto, most of Ivory Park, Alexandra and Diepsloot. With capacity
assessment, the current supply of parks was deemed to serve about 42% of the estimated City
population. The shortfall of functional developed parks with the necessary infrastructure is deemed
low.
From a green infrastructure perspective, the City has various strategies to address its socio-economic
divisions. The northern regions (more wealthy areas of the city) are well vegetated, while the poorer
areas of the City, where the highest population densities are located remain denuded. The City has
Figure 26: CSIR Study – Access to Open Space
Built Environment Performance Plan 2016/17
40 | P a g e
had significant success in greening Soweto and providing parks to former black townships, though far
more investment in this area of infrastructure is required. This includes a combination of a strong civic
initiative which is required to support the growing of plants and trees particularly from the perspective
of promoting urban agriculture.
From a geological perspective, the physical environment is combined with the built environment, which
does the most to constrain urban growth:
Johannesburg is negatively affected by dolomite (limestone) geology in the north-west and
south of the Municipality which give rise to sink holes which can cause serious damage to
buildings and infrastructure. This prevents, or makes it very costly, to undertake construction
in these areas. Often these areas are targeted for low income housing due to the inexpensive
cost of land, with sometimes tragic consequences.
Deep level mining within south central Johannesburg along the gold reef (the mining corridor)
has through under-mining, the poisoning of underground water, the uncontrolled accumulation
of the aforementioned sub-surface water, the stacking of unconsolidated sand at mine dumps
have combined to make the land within the former mining belt either unusable for construction
or highly unpleasant and harmful to residents who live in townships adjacent to these areas.
Rehabilitation of the mining belt is critical to ensuring a better urban environment and a critical
component of creating a sustainable City given the central location of the Mining Belt.
Flooding is a major challenge for the City. This is due to increased intensity of summer
thunderstorms, the growth of informal settlements located within the 1:100 flood-line. As well,
increased storm flow in the City’s river and streams due to underinvestment in the City’s
stormwater network. Another cause is an increase in urban development and erosion of
stream banks combined with the destruction of remaining wet lands.
4.9.1 Development controls and supporting mechanisms in critical biodiversity areas
Critical biodiversity areas must be protected and preserved, with the value of ecosystem services they
provide maximised. They should form part of the public realm, adding value and structuring elements
to the urban system and provide agricultural, tourism, social and spiritual services.
Developments within critical biodiversity areas must be limited to those that add value to the public
realm, and that preserve the vital ecosystem services these areas provide.
These areas much be considered as vital to adding value and structuring elements to the urban
realm
o The interface with the urban area must be given high priority to promote public accessibility
o These areas are not just dead green space, but are key parts of the public realm, and must be
protected as such.
o They provide needed open space that must be preserved for a growing city
o These areas must be considered as adding real estate value to urban developments
All building or rezoning applications for critical biodiversity, Gauteng EMS or protected open space
areas must go through the appropriate processes set out by the Environment and Infrastructure
Services Department in the City of Johannesburg, the Gauteng Department of Agriculture and Rural
Development and any other relevant national policy and legislation
The City should:
Invest in and support the agricultural industry and agricultural projects as a key sector in preserving
green infrastructure and maximising its value for the city, including growing the economy, creating jobs
and providing food and other products
Invest in and support tourism, social, spiritual and leisure initiatives in critical biodiversity areas to
protect the areas, grow the economy, and create jobs
Built Environment Performance Plan 2016/17
41 | P a g e
Plan natural areas such as wetlands and swamps as protected natural buffers, serving as a natural
‘urban development boundary’ and protection from flooding and other climate-change related
damages
Within the city, plan green corridors and green patches as buffers/dividers between incompatible
land use areas, such as between residential and noxious industries
Within a region or precinct, classify corridors and patches and mark which patches are critical and
should be taken care of / not be redeveloped with infill development. Also mark which corridors /
strategic connectors are critical (connecting patches and directly contributing to building a city-wide
system) and should be set as priority investment.
Use neighbourhood guidelines and form-based codes in order to ensure that each street is planned
with a tree line, a pedestrian and bicycle pathway
On a neighbourhood scale, support, invest and incentivize development of smaller community
parks, gardens and urban agriculture
Figure 27: Key Ecological Areas for the City
Financing green infrastructure in cities
Natural services are very similar to other utilities, in the sense that they provide tangible, valuable
benefits to inhabitants and visitors of the city. However, these benefits do not always create an
immediate incentive for investors, as the economic benefits do not flow back to them directly. Where
such services do benefit private agents, they should contribute to the maintenance of such services as
well.
A crucial step for making investing in ecological areas viable is to create a business case for investing
in ecological assets, coupled with a strategy for the implementation of taxation and pricing measures
to raise revenue for advancing environmental goals (e.g. tax exemptions or subsidies for private
developers that invest in environmentally friendly technologies, water, energy and waste management,
as well as in green spaces and neighbourhood parks; or conditions for building licenses obliging
Built Environment Performance Plan 2016/17
42 | P a g e
investors to leave a certain percentage of their plot as a green space). The business case should be
developed with a background of strong collaboration between the city’s financial and environmental
departments, as well as other related departments such as basic services, disaster management and
transportation. This should also include priority investment from the city budget in green infrastructure,
especially since the investment pays off in reduced public costs for storm water management,
flooding, transport and basic services.
5 Synthesis of key challenges within CoJ’s Built Environment
In summary, a number of sector related factors have been responsible the current spatial form of the
City and will continue to do so:
1. Continued population growth at a growth rate that is higher than expected which has
exacerbated social and economic inequalities provides the context for the City’s current built
form
2. Poverty and high population densities are entrenched within specific locations away from
economic opportunities and wealthy residential areas which are concentrated adjacent to
significant mixed-use and industrial nodes in the north of the City.
3. Physically the City has a dispersed settlement pattern that was designed for the private
vehicle. This means that the poor have to pay proportionally more in transport fees to access
formal employment opportunities and higher levels of service.
4. Having noted this, the City has a significant backbone in economic infrastructure in the form of
rail, roads, telecommunications and airports.
5. The City has an established and flourishing (though vulnerable) commercial base
6. The City has a well-developed informal economy that has formed due to high levels of poverty
and unemployment within the City.
7. Provision of water, electricity, roads, waste removal and community facilities occurs in a
scenario where there is greater demand for services, but the ability of consumers to pay for
the services is diminishing in the face of the economic recession and increasing poverty.
Furthermore the dispersed settlement means that networks need to be extended beyond
expected capacity.
8. Similarly, much of the existing network infrastructure is reaching the end of its expected life
and is in need of replacement.
9. The squeeze on service revenues is occurring at a time when alternative revenues for
example from alternative sources of energy, and savings from more environmentally
sustainable methods of service provision are still in infancy.
10. Housing provision for the poor, middle income and wealthy has worsened the City’s sprawl in
the past 20 years with RDP housing and town house complexes being built where land is
cheapest, at the edge of the City’s boundaries away from existing social and economic
opportunities. Due to the increased rate of growth of residential development, the City has
failed to keep pace in the provision of Community Facilities though the City’s track record in
providing network services and waste management services has been good.
11. The housing shortage for low income housing, in-migration, population growth and the
regulation pertaining to accessing the housing subsidy have led to a proliferation of informal
settlements and backyard shacks. Current progress at addressing the informal settlement
challenge has been slow. There are also fears that the current housing strategy with regards
to informal settlements is entrenching poverty.
12. A response of the City has been to promote public transport through the roll out of a city wide
bus rapid transit system known as Rea Vaya to link the poorer areas of the City with the socio-
economic opportunities at the nodes. The system is still being rolled out will need on-going
capital and operational funding for the medium to long term. It has the potential to change the
City’s urban form.
Built Environment Performance Plan 2016/17
43 | P a g e
13. The concept by which this change will occur is the ‘Corridors of Freedom’ which designates
areas adjacent to the Rea Vaya Network and areas within existing economic nodes as places
for intensification of residential and the creation of economic opportunities to cater for a range
of income requirements including the poor. The concept sees the corridors as a focus for
public investment particularly around bus and rail stations and which promotes a walkable and
cyclist friendly environment. Public investment by itself will not be enough and therefore,
private investment will need to flow into these areas in order for these public transport
corridors to be a success.
14. The contradiction that the City stands with is that on-going population growth places increased
pressure on its natural resources be it water, electricity, open space, bio-diversity, streams
and vegetation cover. Managing these resources particularly around water, waste water
management, storm-water management, acid-mine drainage and mine dumps has become a
very costly imperative.
Sub-section 4 of the report (Spatial Targeting), elaborates on the strategies and programmes the City
is putting in place in response to the identified challenges.