50
Lecture Notes 15.401 Part B Valuation Part B Valuation Chapter 3: Fixed-Income Securities Chapter 4: Common Stocks Chapter 5: Forwards and Futures Chapter 6: Options

Lecture Notes
15.401
Part B ValuationPart B Valuation
TexPoint fonts used in EMF.Read the TexPoint manual before you delete this box.: AAAAAAAAAAAAAAAAAAAAAAA
Chapter 3: Fixed-Income Securities
Chapter 4: Common Stocks
Chapter 5: Forwards and Futures
Chapter 6: Options
Lecture Notes
15.401 Part B Valuation
We have learned that:_ Business decisions often reduce to valuation of assets/CFs_ Two elements are important in valuing a CF: time and risk_ Value of CFs is determined in financial markets
From the market, we can learn_ How to value time --- time value of money_ How to value risk --- risk premium
In particular,_ Prices in the bond market gives the time value of money_ Prices in the stock market gives the risk premium
In this part of the course, we study the valuation of bonds, stocks,forwards, futures and options.
2
IntroductionIntroduction

Lecture Notes
15.401
15.401 Finance Theory I15.401 Finance Theory I
AlexAlex Stomper StomperMIT Sloan School of ManagementMIT Sloan School of Management
Institute for Advanced Studies, ViennaInstitute for Advanced Studies, Vienna
Lecture Lecture 33: Fixed-Income Securities: Fixed-Income Securities
Lecture Notes
15.401 Lecture 3: Fixed income securities
_ Fixed-income securities_ Overview of fixed-income markets_ Term structure of interest rates_ Discount bonds and coupon bonds_ Forward interest rates_ Interest rate risk_ Inflation risk_ Default risk
Readings:_ Brealey, Myers and Allen, Chapters 4, 24_ Bodie, Kane and Markus, Chapters 14, 15, 16_ Salomon Brothers, "Understanding Duration and Volatility"
4
Key conceptsKey concepts

Lecture Notes
15.401
Fixed-income securities are financial claims with promised cash flowsof fixed amount paid at fixed dates.
Classification of Fixed-Income Securities:1. Treasury Securities:
– U.S. Treasury securities (bills, notes, bonds)– Bunds, JGBs, U.K. Gilts …
2. Federal Agency Securities:– Securities issued by federal agencies (FHLB, FNMA …)
3. Corporate securities:– Commercial paper (CP)– Medium-term notes (MTNs)– Corporate bonds …
4. Municipal securities (Munies)5. Mortgage-backed securities (MBS)6. Asset backed securities (ABS), …
5
Fixed-income securitiesFixed-income securities Lecture 3: Fixed income securities
Lecture Notes ©2008 Jiang Wang
15.401
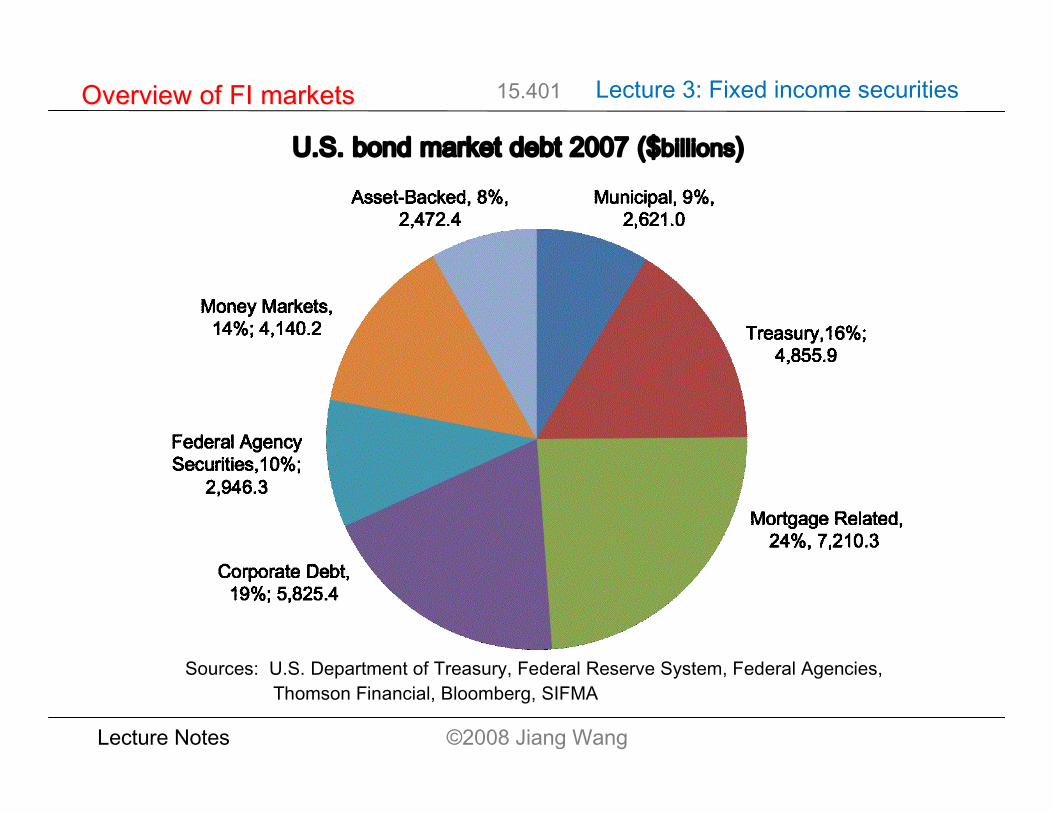
U.S. bond market debt 2007 ($billions)
Sources: U.S. Department of Treasury, Federal Reserve System, Federal Agencies, Thomson Financial, Bloomberg, SIFMA
Overview of FI marketsOverview of FI markets Lecture 3: Fixed income securities

Lecture Notes ©2008 Jiang Wang
15.401
Outstanding U.S. bond market debt ($ billions)
°° Municipal TreasuryMortgageRelated
CorporateDebt
Federal AgencySecurities
MoneyMarkets
Asset-Backed Total
1998 1,402.7 3,542.8 2,955.2 2,708.5 1,300.6 1,977.8 731.5 14,619.1
1999 1,457.1 3,529.5 3,334.2 3,046.5 1,620.0 2,338.8 900.8 16,226.9
2000 1,480.5 3,210.0 3,565.8 3,358.4 1,854.6 2,662.6 1,071.8 17,203.7
2001 1,603.6 3,196.6 4,127.6 3,836.4 2,149.6 2,587.2 1,281.1 18,782.1
2002 1,763.0 3,469.2 4,686.4 4,099.5 2,292.8 2,545.7 1,543.3 20,399.9
2003 1,900.7 3,822.1 5,238.6 4,458.4 2,636.7 2,519.9 1,693.7 22,270.1
2004 2,030.9 4,257.2 5,455.8 4,785.1 2,745.1 2,904.2 1,827.8 24,006.1
2005 2,226.0 4,517.3 5,915.6 4,960.0 2,613.8 3,433.7 1,955.2 25,621.6
2006 2,403.2 4,689.8 6,492.4 5,365.0 2,660.1 4,008.8 2,130.4 27,749.7
2007 2,621.0 4,855.9 7,210.3 5,825.4 2,946.3 4,140.2 2,472.4 30,071.52008Q
1 2,657.0 4,995.8 7,397.0 5,905.6 2,984.2 4,125.9 2,480.3 30,545.8Sources: U.S. Department of Treasury, Federal Reserve System, Federal Agencies, Thomson Financial, Bloomberg, SIFMA
Overview of FI marketsOverview of FI markets Lecture 3: Fixed income securities

Lecture Notes ©2008 Jiang Wang
15.401
U.S. bond market issuance 2007 ($billions)
Sources: U.S. Department of Treasury, Federal Reserve System, Federal Agencies, Thomson Financial, Bloomberg, SIFMA
Overview of FI marketsOverview of FI markets Lecture 3: Fixed income securities

Lecture Notes ©2008 Jiang Wang
15.401
U.S. bond market issuance ($ billions)
°° Municipal TreasuryMortgageRelated
CorporateDebt
Federal AgencySecurities
Asset-Backed Total
1998 286.8 438.4 1,143.90 610.7 596.4 286.6 3,362.701999 227.5 364.6 1,025.40 629.2 548 287.1 3,081.802000 200.8 312.4 684.4 587.5 446.6 337 2,568.702001 287.7 380.7 1,671.30 776.1 941 383.3 4,440.102002 357.5 571.6 2,249.20 636.7 1,041.50 469.2 5,325.702003 382.7 745.2 3,071.10 775.8 1,267.50 600.2 6,842.50
2004 359.8 853.3 1,779.00 780.7 881.8(4) 869.8 4,642.602005 408.2 746.2 1,966.70 752.8 669 1,172.10 5,715.002006 386.5 788.5 1,987.80 1,058.90 747.3 1,253.10 6,222.102007 429.1 752.3 2,050.10 1,128.30 941.8 901.2 6,202.80
2008Q1 85.1 203.8 386.7 213.1 429.5 58.1 1,376.30Sources: U.S. Department of Treasury, Federal Reserve System, Federal Agencies, Thomson Financial, Bloomberg,SIFMA.
Overview of FI marketsOverview of FI markets Lecture 3: Fixed income securities

Lecture Notes
15.401 Lecture 3: Fixed income securities
10
Organization of FI marketsOrganization of FI markets
Issuers:
1. Governments2. Corporations3. Commercial Banks4. States5. Municipalities6. SPVs7. Foreign Institutions
Intermediaries:
1. Primary Dealers2. Other Dealers3. Investment Banks4. Credit-rating Agencies5. Credit Enhancers6. Liquidity Enhancers
Investors:
1. Governments2. Pension Funds3. Insurance Companies4. Commercial Banks5. Mutual Funds6. Hedge Funds7. Foreign Institutions8. Individuals
Lecture Notes
15.401 Lecture 3: Fixed income securities
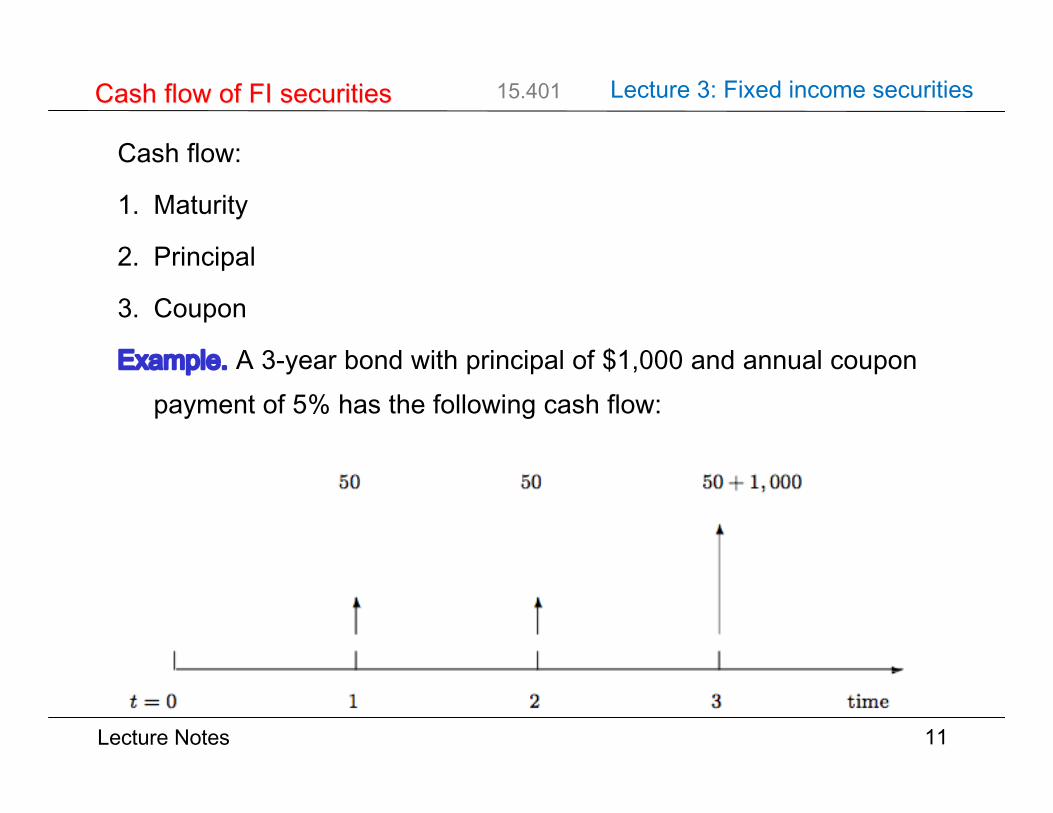
Cash flow:
1. Maturity
2. Principal
3. Coupon
Example. A 3-year bond with principal of $1,000 and annual couponpayment of 5% has the following cash flow:
11
Cash flow of FI securitiesCash flow of FI securities
-t = 0 1 2 3 time
6 6
6
50 50 50+ 1;000

Lecture Notes
15.401 Lecture 3: Fixed income securities
Valuation:
1. Time value
– Interest rates
2. Risks:
– Inflation
– Credit
– Timing (callability)
– Liquidity
– Currency …
12
Valuation of FI securitiesValuation of FI securities
Lecture Notes
15.401 Lecture 3: Fixed income securities
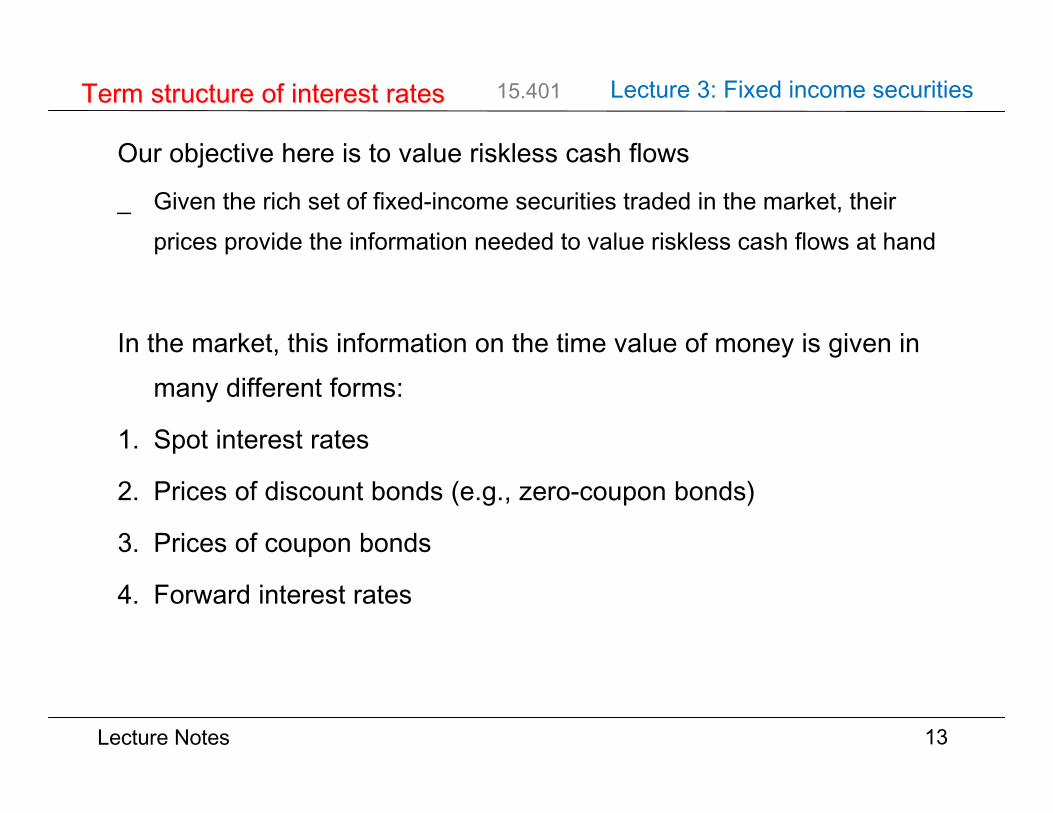
Our objective here is to value riskless cash flows
_ Given the rich set of fixed-income securities traded in the market, theirprices provide the information needed to value riskless cash flows at hand
In the market, this information on the time value of money is given inmany different forms:
1. Spot interest rates
2. Prices of discount bonds (e.g., zero-coupon bonds)
3. Prices of coupon bonds
4. Forward interest rates
13
Term structure of interest ratesTerm structure of interest rates

Lecture Notes
15.401 Lecture 3: Fixed income securities
Spot interest rate rt is the current (annualized) interest rate for maturitydate t
_ rt is for payments only on date t
_ rt is different for each different date t
Example. Spot interest rates on 2005.08.01:
The set of spot interest rates for different maturities
gives the term structure of interest rates, which refers to the relationbetween spot rates and their maturities
14
Term structure of interest ratesTerm structure of interest rates
Maturity (year) 1/4 1/2 1 2 5 10 20 25 25.5 (longest)I nterest R ate (%) 3.29 3.61 3.87 3.97 4.06 4.41 4.65 4.57 4.61fr1, r2, . . . , rt, . . .g
{r1,r2 ,...,rt ,....}

Lecture Notes
15.401 Lecture 3: Fixed income securities
Sept 5, 2008 (Bloomberg)
http://online.wsj.com/mdc/page/marketsdata.html?mod=topnav_0_0002
Term structure of interest ratesTerm structure of interest rates

Lecture Notes
15.401 Lecture 3: Fixed income securities
http://fixedincome.fidelity.com/fi/FIHistoricalYield
Term structure of interest ratesTerm structure of interest rates
History of U.S. term structure of interest rates
Lecture Notes
15.401 Lecture 3: Fixed income securities
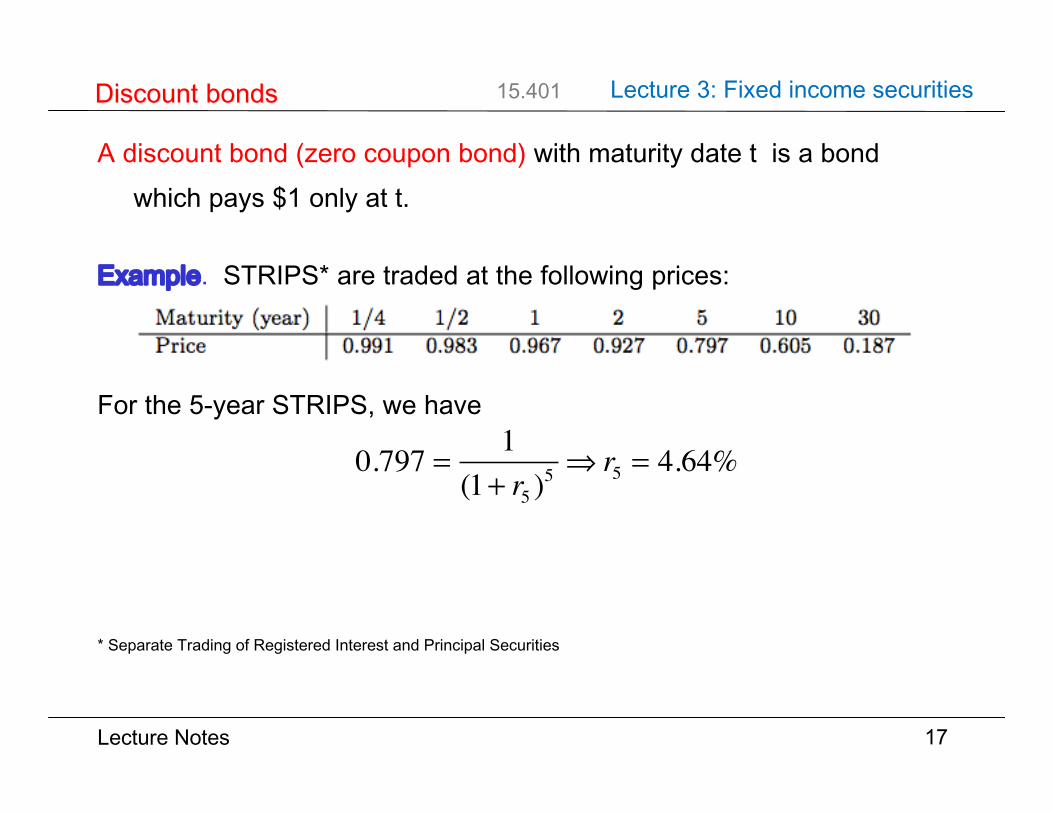
A discount bond (zero coupon bond) with maturity date t is a bondwhich pays $1 only at t.
Example. STRIPS* are traded at the following prices:
For the 5-year STRIPS, we have
* Separate Trading of Registered Interest and Principal Securities
17
Discount bondsDiscount bonds
Maturity (year) 1/4 1/2 1 2 5 10 30Price 0.991 0.983 0.967 0.927 0.797 0.605 0.187
0.797 =1
(1 + r5)5 ) r5 =1
(0.797)1=5 ¡ 1 = 4.64%Bt =
1
(1+rt)t or rt =1
B1=tt
¡ 1
0.797 = 1(1+ r5 )
5 ⇒ r5 = 4.64%

Lecture Notes
15.401 Lecture 3: Fixed income securities
Let Bt denote the current price (time 0) of a discount bond maturing at t.Then
Prices of discount bonds provide information about spot interest rates andvise versa.
18
Discount bondsDiscount bonds
Bt =1
(1 + rt)t or rt =1
B1=tt
¡ 1B1 =1
(1 + r1) $ r1
B2 =1
(1 + r2)2 $ r2
B3 =1
(1 + r3)3 $ r3
..
.
BT =1
(1 + rT )T $ rT
Bt =1
(1+ rt )t ⇔ rt =
1Bt1t−1

Lecture Notes
15.401 Lecture 3: Fixed income securities
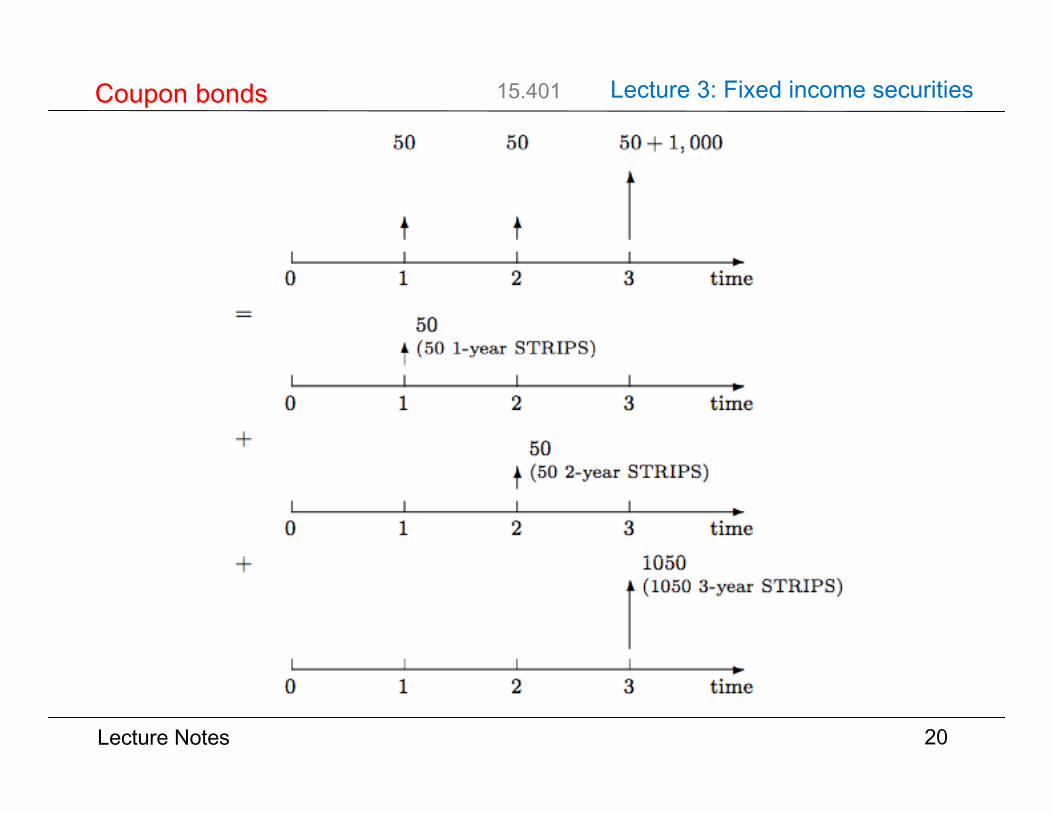
A coupon bond pays a stream of regular coupon payments and aprincipal at maturity.
A coupon bond is a portfolio of discount bonds.
Example. A 3-year bond of $1,000 par and 5% annual coupon.
19
Coupon bondsCoupon bonds
-0 1 2 3 time
6 66
50 50 50 + 1, 000
Lecture Notes
15.401 Lecture 3: Fixed income securities
20
Coupon bondsCoupon bonds
-0 1 2 3 time
6 66
50 50 50+ 1; 000
=
-0 1 2 3 time
650(50 1-year ST R I P S)
+
-0 1 2 3 time
650(50 2-year ST R I P S)
+
-0 1 2 3 time
61050(1050 3-year ST R I P S)
Lecture Notes
15.401 Lecture 3: Fixed income securities
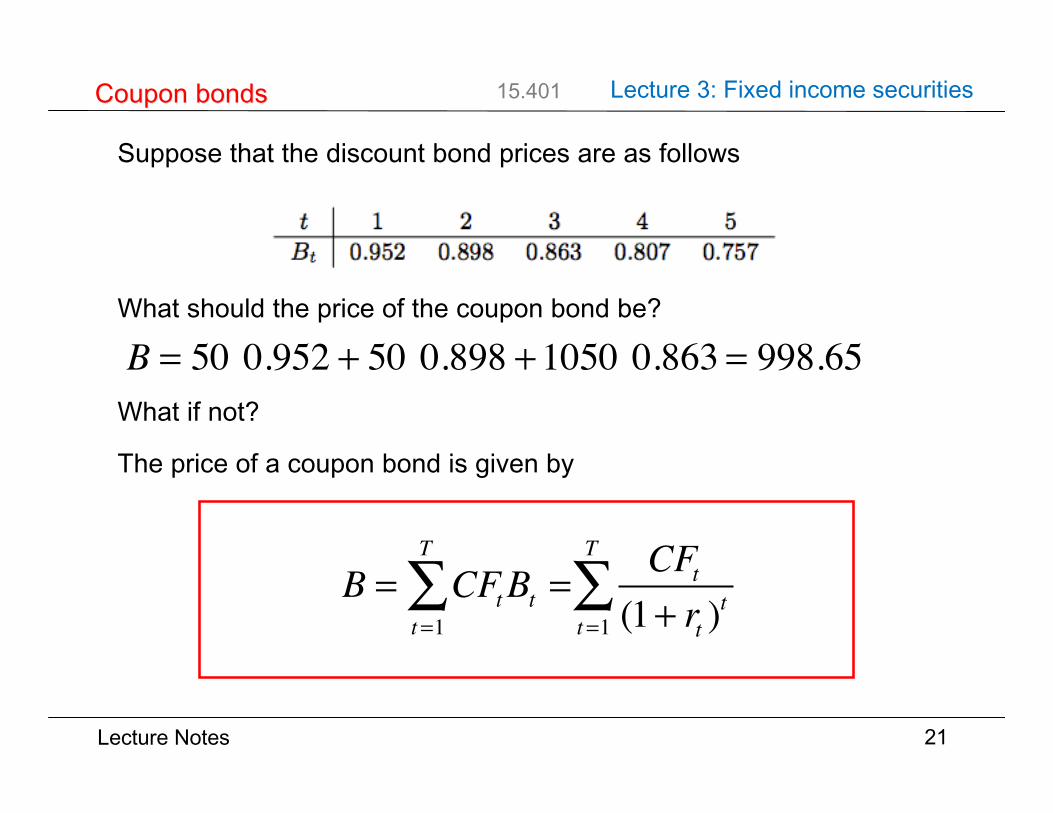
Suppose that the discount bond prices are as follows
What should the price of the coupon bond be?
What if not?
The price of a coupon bond is given by
21
Coupon bondsCoupon bonds
t 1 2 3 4 5Bt 0.952 0.898 0.863 0.807 0.757
Price = (50)(0.952) + (50)(0.898) + (1050)(0.863)
= 998.65B =
TX
t= 1(Ct £ Bt) + (P £ BT )
=C11+r1
+ ¢¢¢+CT ¡ 1
(1+rT ¡ 1)T ¡ 1 +CT +P
(1+rT )T
B = 50 0.952 + 50 0.898 +1050 0.863 = 998.65
B = CFtBt =t=1
T
∑ CFt(1+ rt )
tt=1
T
∑

Lecture Notes
15.401 Lecture 3: Fixed income securities
Yield-to-maturity of a bond, denoted by y, is given by
Given its maturity, the principle and the coupon rate, there is a one toone mapping between the price of a bond and its YTM.
Example. Current 1- and 2-year spot interest rates are 5% and 6%,respectively. The price of a 2-year Treasury coupon bond with parvalue of $100 and a coupon rate of 6% is
Its YTM is 5.9706%:
22
Yield-to-maturity (YTM)Yield-to-maturity (YTM)
B =TX
t= 1
Ct(1+y)t +
P
(1+y)T
B =6
1 + 0.05+
106
(1 + 0.06)2 = 100.0539100.0539 =6
1 + 0.059706+
106
(1 + 0.059706)2
B =CFt(1+ y)tt=1
T
∑
B =61.05
+1061.062
= 100.0539
100.0539 = 61+ y
+106(1+ y)2
Lecture Notes
15.401 Lecture 3: Fixed income securities
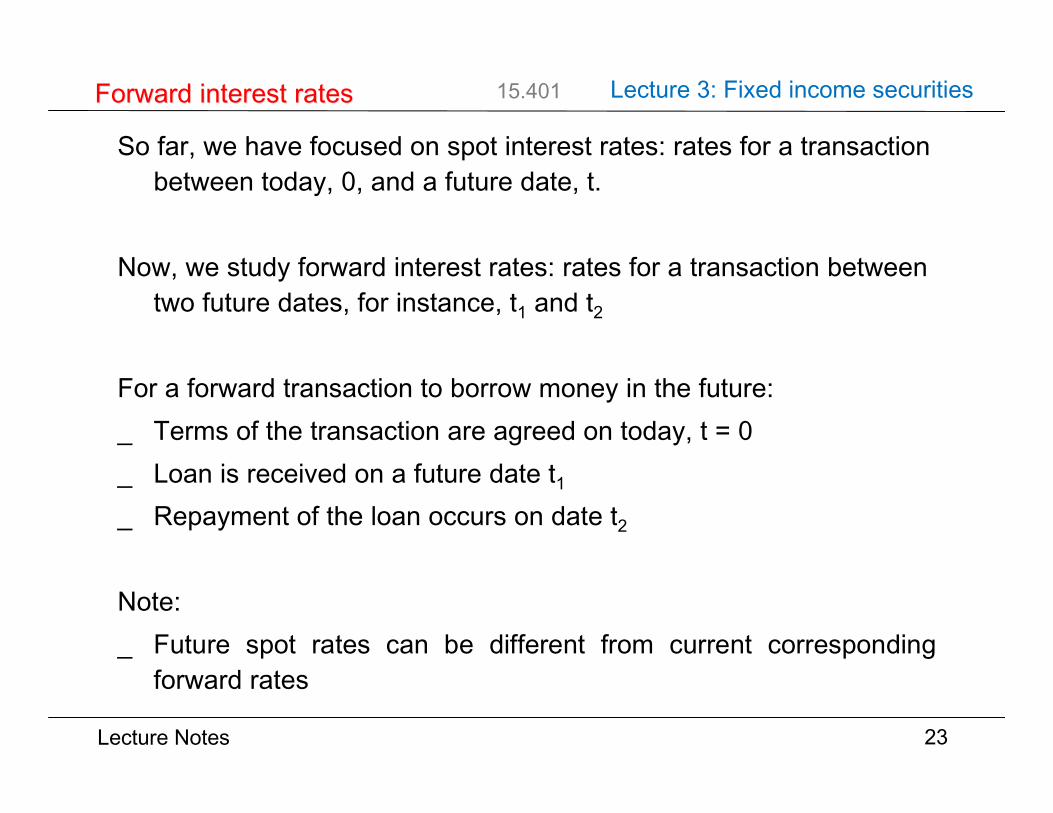
So far, we have focused on spot interest rates: rates for a transactionbetween today, 0, and a future date, t.
Now, we study forward interest rates: rates for a transaction betweentwo future dates, for instance, t1 and t2
For a forward transaction to borrow money in the future:_ Terms of the transaction are agreed on today, t = 0_ Loan is received on a future date t1_ Repayment of the loan occurs on date t2
Note:_ Future spot rates can be different from current corresponding
forward rates
23
Forward interest ratesForward interest rates

Lecture Notes
15.401 Lecture 3: Fixed income securities
Example. As the CFO of a U.S. multinational, you expect torepatriate $10 M from a foreign subsidiary in 1 year, which will beused to pay dividends 1 year later. Not knowing the interest ratesin 1
year, you would like to lock into a lending rate one year from nowfor a period of one year. What should you do?
The current interest rates are
24
Forward interest ratesForward interest rates
time to maturity t (years) 1 2spot interest rate rt 0.05 0.07
Lecture Notes
15.401 Lecture 3: Fixed income securities
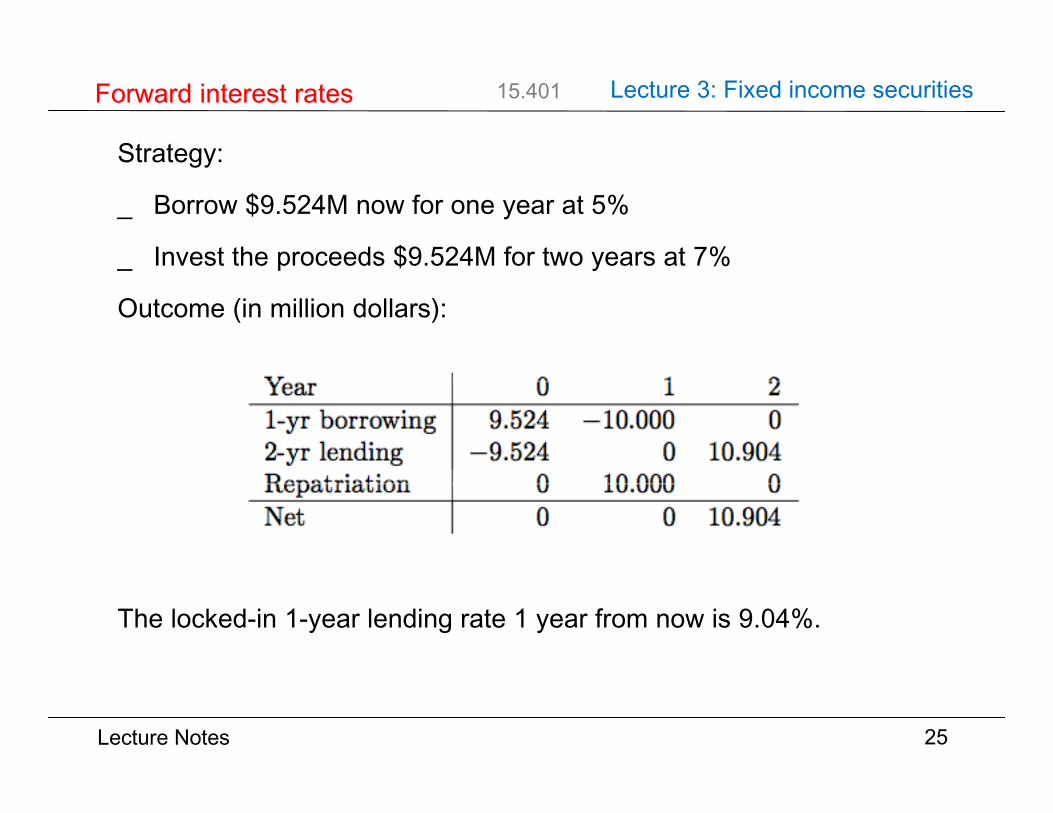
Strategy:
_ Borrow $9.524M now for one year at 5%
_ Invest the proceeds $9.524M for two years at 7%
Outcome (in million dollars):
The locked-in 1-year lending rate 1 year from now is 9.04%.
25
Forward interest ratesForward interest rates
Year 0 1 21-yr borrowing 9.524 ¡ 10.000 02-yr lending ¡ 9.524 0 10.904Repatriation 0 10.000 0Net 0 0 10.904

Lecture Notes
15.401 Lecture 3: Fixed income securities
The forward interest rate between time t-1 and t is
or
26
Forward interest ratesForward interest rates
(1 + rt)t = (1 + rt¡ 1)t¡ 1(1 + f
t)Spot and forward rates
-
6
year1 2 3 4 5
-r1 = f1
-r1 -f2
-r2 -f3
-r3 -f4
-r4 -f5
(1+ rt )t = (1+ rt−1)
t−1(1+ ft )
ft =(1+ rt )
t
(1+ rt−1)t−1 −1

Lecture Notes
15.401 Lecture 3: Fixed income securities
Example. Suppose that discount bond prices are as follows:
A customer wants a forward contract to borrow $20M three yearsfrom now for one year. Can you (a bank) quote a rate?
27
Forward interest ratesForward interest rates
t 1 2 3 4Bt 0.9524 0.8900 0.8278 0.7629rt 0.05 0.06 0.065 0.07
f4 = 8.51%
f4 = 8.51%

Lecture Notes
15.401 Lecture 3: Fixed income securities
What should you do today to lock-in these cash flows?
1. Buy 20,000,000 of 3 year discount bonds, costing
2. Finance this by selling 4 year discount bonds of amount
Cash flows from this strategy (in million dollars):
The interest for this future investment is given by:
28
Forward interest ratesForward interest rates
(20, 000, 000)(0.8278) = $16, 556, 00016, 556, 000/0.7629 = $21, 701, 403
Year 0 1{2 3 4Purchase of 3-year bonds -16.556 0 20.000 0Sale of 4-year bonds 16.556 0 0 -21.701Total 0 0 20.000 -21.701
21, 701, 403
20, 000, 000 ¡ 1 = 8.51%
21,701,40320,000,000
−1 = 8.51%
$20m0.8278 = $16.556m
$16.556m / 0.7629 = $21.701m

Lecture Notes
15.401 Lecture 3: Fixed income securities
What determines the term structure of interest rates?
1. Expected future spot rates
2. Risk of long bonds
Models of interest rates:
_ Expectations Hypothesis
_ Liquidity Preference
_ Dynamic Models (Vasicek, Cox-Ingersoll and Ross, …)
29
Hypothesis on interest ratesHypothesis on interest rates
Lecture Notes
15.401 Lecture 3: Fixed income securities
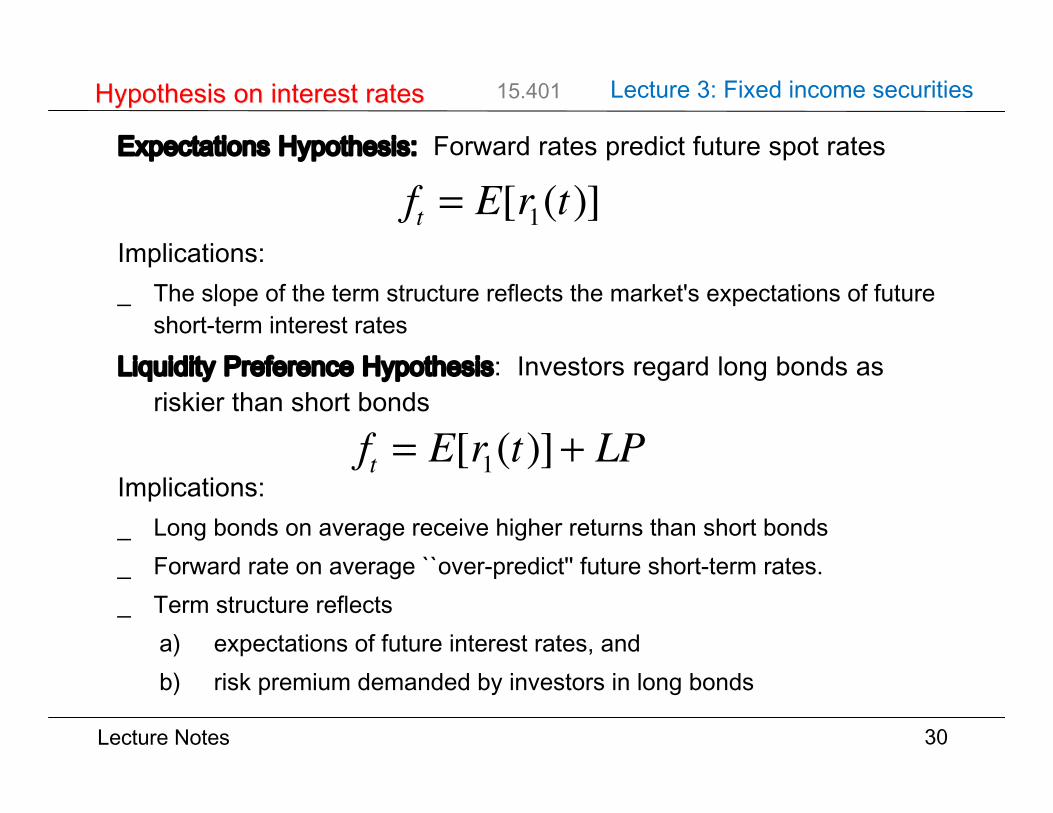
Expectations Hypothesis: Forward rates predict future spot rates
Implications:_ The slope of the term structure reflects the market's expectations of future
short-term interest ratesLiquidity Preference Hypothesis: Investors regard long bonds as
riskier than short bonds
Implications:_ Long bonds on average receive higher returns than short bonds_ Forward rate on average ``over-predict'' future short-term rates._ Term structure reflects
a) expectations of future interest rates, andb) risk premium demanded by investors in long bonds
30
Hypothesis on interest ratesHypothesis on interest rates
ft = E [r1(t)]ft = E [r1(t)] + LiquidityPremium
ft = E[r1(t)]
ft = E[r1(t)]+ LP
Lecture Notes
15.401 Lecture 3: Fixed income securities
31
Liquidity preferenceLiquidity preference
ft = E [r1(t)]ft = E [r1(t)] + LiquidityPremium
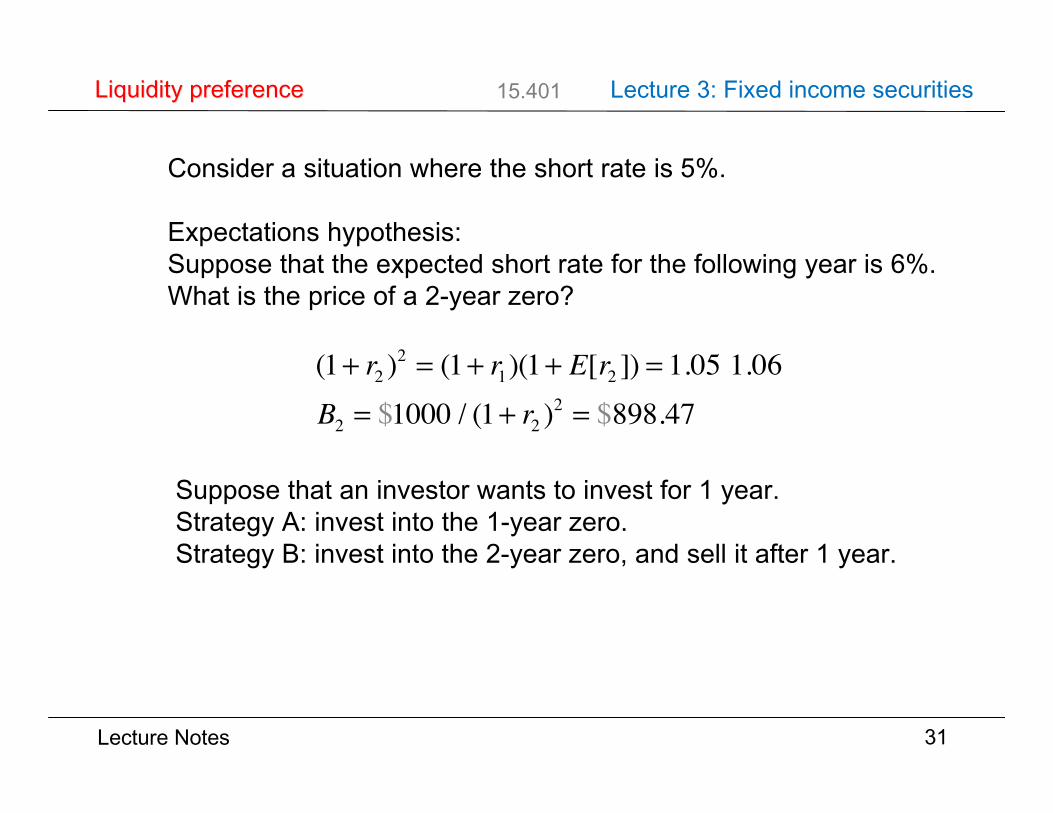
Consider a situation where the short rate is 5%.
Expectations hypothesis:Suppose that the expected short rate for the following year is 6%.What is the price of a 2-year zero?
(1+ r2 )2 = (1+ r1)(1+ E[r2 ]) = 1.05 1.06B2 = $1000 / (1+ r2 )2 = $898.47
Suppose that an investor wants to invest for 1 year. Strategy A: invest into the 1-year zero.Strategy B: invest into the 2-year zero, and sell it after 1 year.

Lecture Notes
15.401 Lecture 3: Fixed income securities
32
Liquidity preferenceLiquidity preference
ft = E [r1(t)]ft = E [r1(t)] + LiquidityPremium
What is the expected return of strategy B?
If the future short rate is 6%, the future bond price is
$1000/1.06=$943.4.
In this case, the return is ($943.4-$898.47)/$898.47=5%.
So, is the investor indifferent between strategies A and B?
What if the investor requires a discount to hold the 2-year bond?Suppose that the bond trades at $890.
B2 = $1000 / (1+ r2 )2 = $890
r2 = 6%
f2 =1.062
1.05= 7% = E[r1]+1%
Lecture Notes
15.401 Lecture 3: Fixed income securities
33
Liquidity preferenceLiquidity preference
ft = E [r1(t)]ft = E [r1(t)] + LiquidityPremium
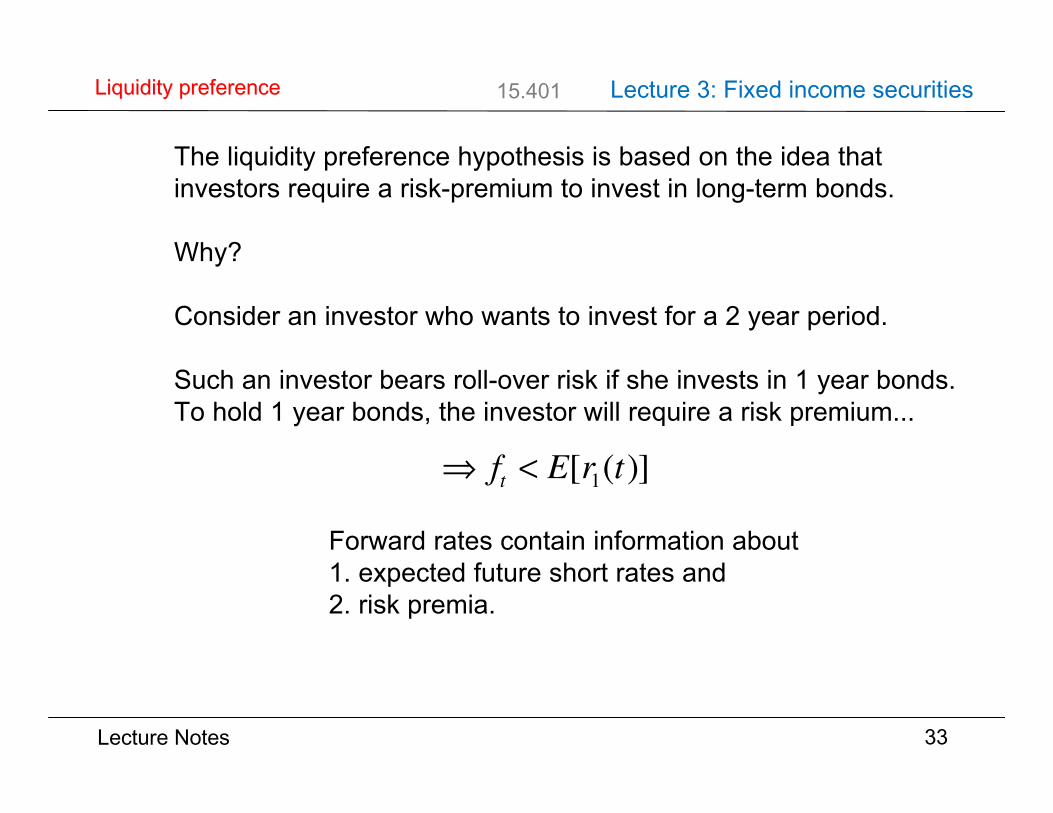
The liquidity preference hypothesis is based on the idea thatinvestors require a risk-premium to invest in long-term bonds.
Why?
Consider an investor who wants to invest for a 2 year period.
Such an investor bears roll-over risk if she invests in 1 year bonds.To hold 1 year bonds, the investor will require a risk premium...
⇒ ft < E[r1(t)]
Forward rates contain information about 1. expected future short rates and2. risk premia.

Lecture Notes
15.401 Lecture 3: Fixed income securities
34
Liquidity preferenceLiquidity preference
ft = E [r1(t)]ft = E [r1(t)] + LiquidityPremium
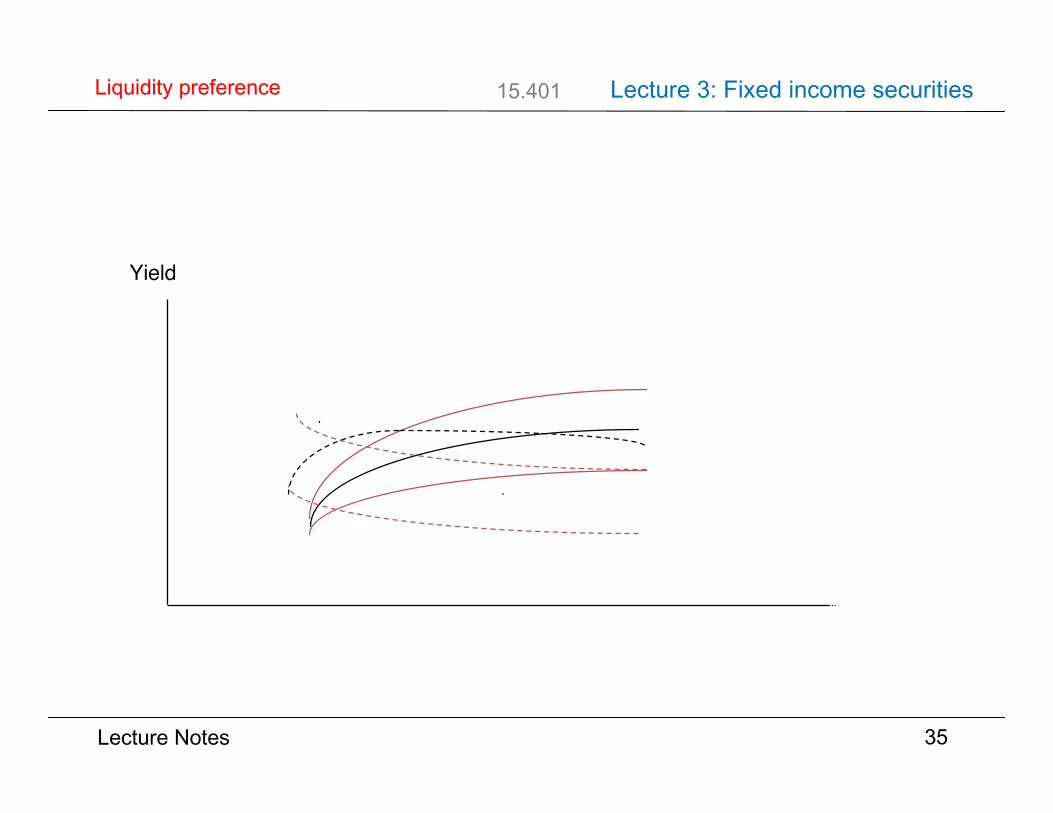
Yieldconstant liquidity premium
constant forward rate fyield curve:(1+yt)=(1+r1)(1+f)…(1+f)
constant expected short rate r1
Lecture Notes
15.401 Lecture 3: Fixed income securities
35
Liquidity preferenceLiquidity preference
Yield
Lecture Notes
15.401 Lecture 3: Fixed income securities
36
SummarySummary
Bond yields
Prices in the bond market contain information aboutthe time-value of money:
Spot interest ratesForward interest rates
The term structure of interest rates
Next time: managing bond portfolios.
Lecture Notes
15.401
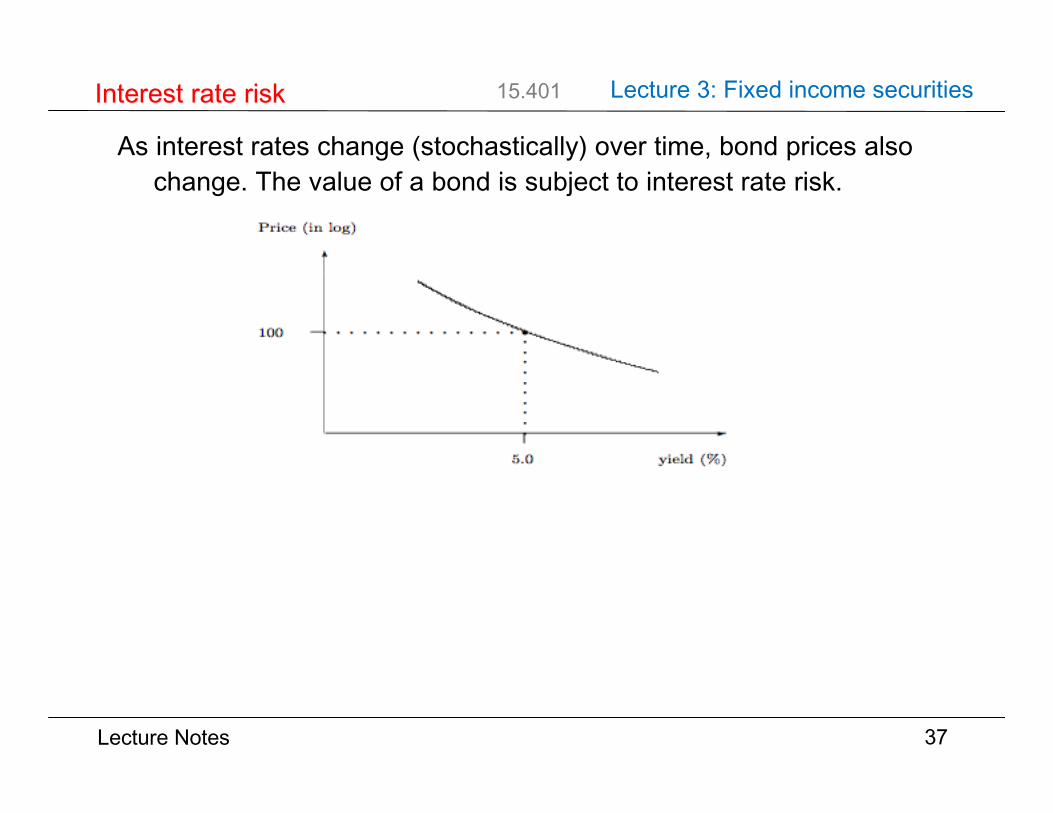
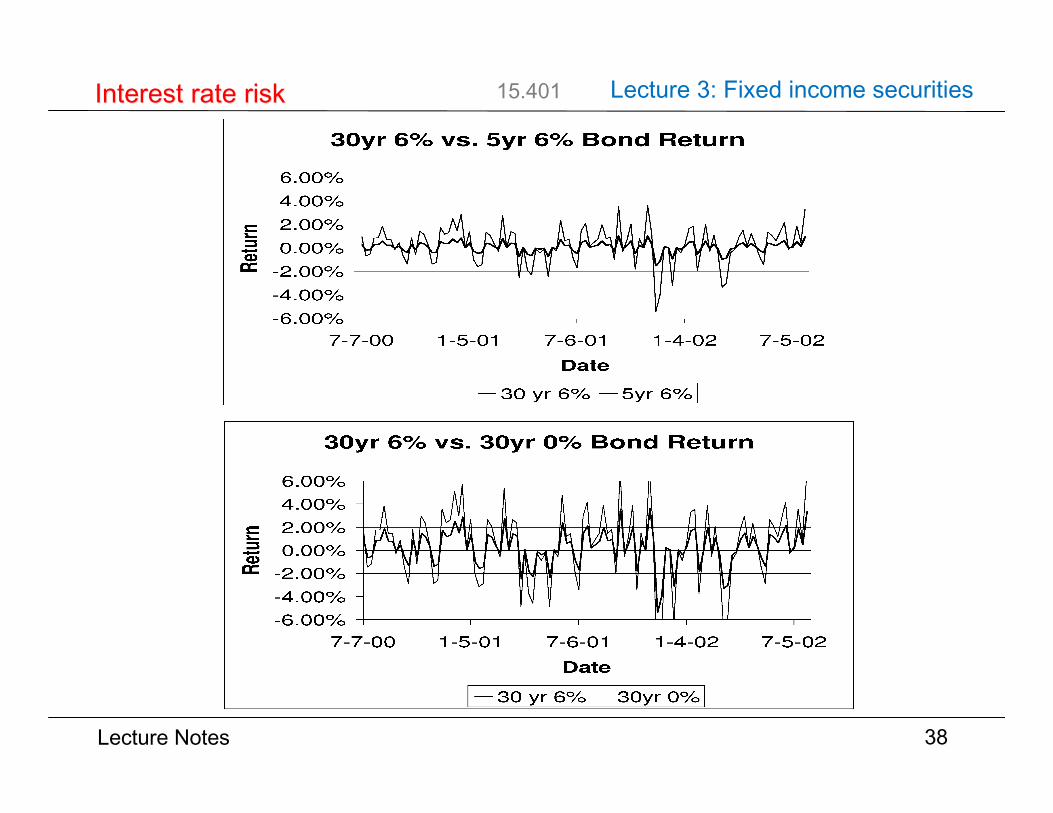
As interest rates change (stochastically) over time, bond prices alsochange. The value of a bond is subject to interest rate risk.
37
Interest rate riskInterest rate risk
-
yield (%)
6
Price (in log)
5.0
100 r
`̀`̀`̀`̀`̀
```````````````
Lecture 3: Fixed income securities
Lecture Notes
15.401
38
Interest rate riskInterest rate risk Lecture 3: Fixed income securities

Lecture Notes
15.401
Duration and Modified Duration (Duration and Modified Duration (assume a flat term structure at rt = y)
Macaulay duration is the weighted average term to maturity
A bond's interest rate risk can be measured by its relative pricechange with respect to a change in yield:
This is called a bond's modified duration or volatility.
39
Measures of interest rate riskMeasures of interest rate risk Lecture 3: Fixed income securities
D =PV[CFt ]
Bt = 1
Bt=1
T
∑ CFt(1+ y)t
tt=1
T
∑
MD = −1BΔBΔy
=D1+ y
Lecture Notes
15.401
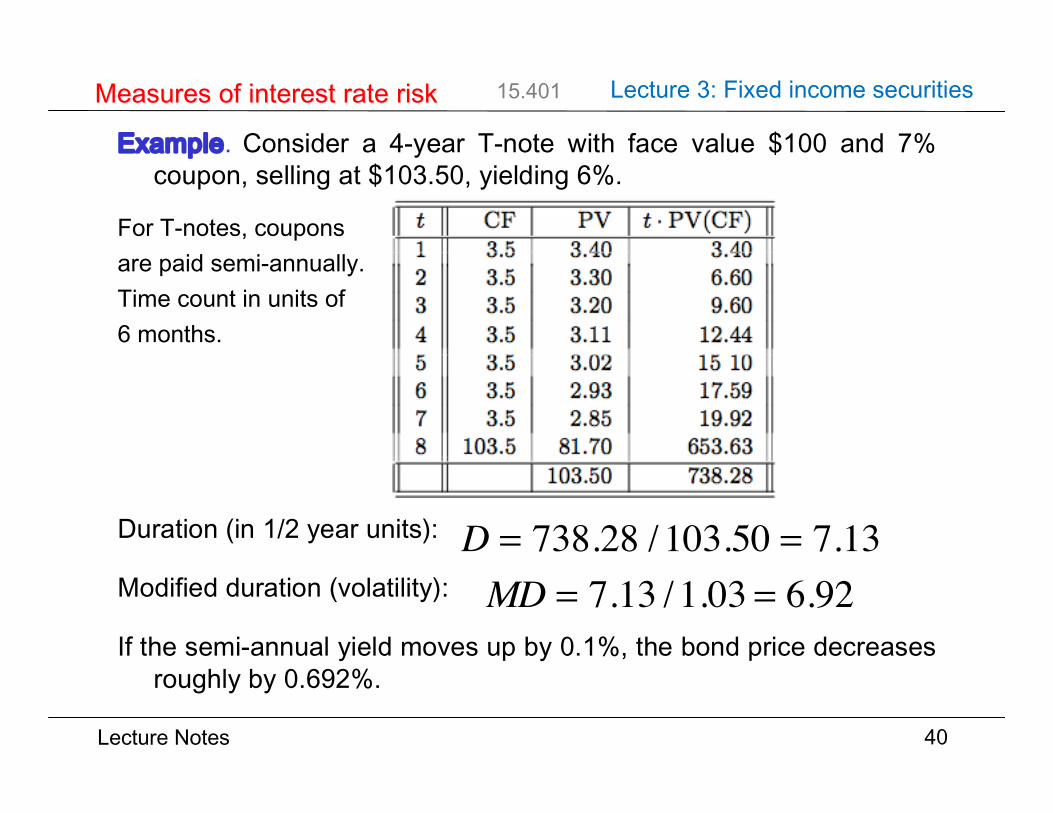
Example. Consider a 4-year T-note with face value $100 and 7%coupon, selling at $103.50, yielding 6%.
For T-notes, couponsare paid semi-annually.Time count in units of6 months.
Duration (in 1/2 year units):
Modified duration (volatility):
If the semi-annual yield moves up by 0.1%, the bond price decreasesroughly by 0.692%.
40
Measures of interest rate riskMeasures of interest rate risk
t CF PV(CF ) t¢PV(CF )1 3.5 3.40 3.402 3.5 3.30 6.603 3.5 3.20 9.604 3.5 3.11 12.445 3.5 3.02 15.106 3.5 2.93 17.597 3.5 2.85 19.928 103.5 81.70 653.63
103.50 738.28
D = (738.28)/103.50 = 7.13MD = D/(1 + y) = 7.13/1.03 = 6.92
Lecture 3: Fixed income securities
D = 738.28 /103.50 = 7.13MD = 7.13 /1.03 = 6.92

Lecture Notes
15.401
41
DurationDuration
t CF PV(CF ) t¢PV(CF )1 3.5 3.40 3.402 3.5 3.30 6.603 3.5 3.20 9.604 3.5 3.11 12.445 3.5 3.02 15.106 3.5 2.93 17.597 3.5 2.85 19.928 103.5 81.70 653.63
103.50 738.28
D = (738.28)/103.50 = 7.13MD = D/(1 + y) = 7.13/1.03 = 6.92
Lecture 3: Fixed income securities
Duration
How does duration depend on bond maturity?What happens if the maturity increases?

Lecture Notes
15.401
42
DurationDuration
t CF PV(CF ) t¢PV(CF )1 3.5 3.40 3.402 3.5 3.30 6.603 3.5 3.20 9.604 3.5 3.11 12.445 3.5 3.02 15.106 3.5 2.93 17.597 3.5 2.85 19.928 103.5 81.70 653.63
103.50 738.28
D = (738.28)/103.50 = 7.13MD = D/(1 + y) = 7.13/1.03 = 6.92
Lecture 3: Fixed income securities
Duration
Par and premium bonds: duration increases.Discount bonds: duration can decrease!
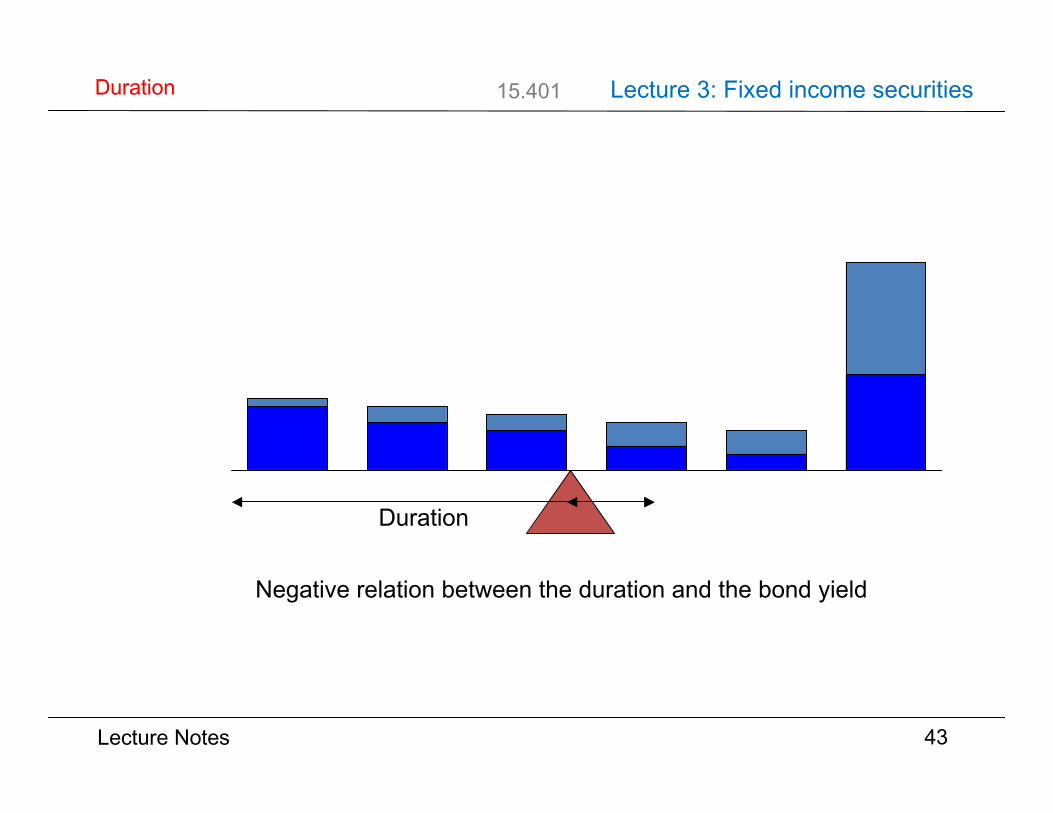
How does the duration depend on the bond yield?What happens if the yield increases?
Lecture Notes
15.401
43
DurationDuration
t CF PV(CF ) t¢PV(CF )1 3.5 3.40 3.402 3.5 3.30 6.603 3.5 3.20 9.604 3.5 3.11 12.445 3.5 3.02 15.106 3.5 2.93 17.597 3.5 2.85 19.928 103.5 81.70 653.63
103.50 738.28
D = (738.28)/103.50 = 7.13MD = D/(1 + y) = 7.13/1.03 = 6.92
Lecture 3: Fixed income securities
Duration
Negative relation between the duration and the bond yield

Lecture Notes
15.401
Example. (Continued) 4-year T-note with 7% coupon and 6% flatyield curve.
_ Duration is D=7.13_ Volatility is MD = 6.92
As the yield changes, the bond price also changes:
_ For small yield changes, pricing by MD is accurate_ For large yield changes, pricing by MD is inaccurate
44
ConvexityConvexity
Y ield Price Using MD Di®erence0.040 96.63 96.35 0.290.035 100.00 99.93 0.070.031 102.79 102.79 0.000.030 103.50 - -0.029 104.23 104.23 0.000.025 107.17 107.09 0.080.020 110.98 110.67 0.32
Lecture 3: Fixed income securities
0.1%
0.692%

Lecture Notes
15.401
Bond price is not a linear function of the yield. For large yieldchanges, the effect of curvature (i.e., nonlinearity) becomesimportant.
Convexity, CX, measures the curvature of the bond price (per $) as afunction of the yield:
45
ConvexityConvexity
-
yield (%)
6
Price (in log)
3.0
103.5 r
`̀`̀`̀`̀`̀
``````````````H̀HHHHH
H H H H HH
Duration gives the slope
? Convexity gives curvature
?
(¢ B ) = ¢ B¢ y (¢ y) + 1
2¢ 2B¢ y2 (¢ y)2 + ¢¢¢
¡ MD £ (¢ y)+ CX £ (¢ y)2
CX =1
2
1
B
¢2B
¢y2
Lecture 3: Fixed income securities
ΔB = −MDΔy + CX(Δy)2
CX =121B∂2B∂y2

Lecture Notes
15.401
Most bonds give nominal payoffs. In the presence of inflation risk,real payoffs are risky even when nominal payoffs are safe.
Example. Suppose that inflation next year is uncertain ex ante, withequally possible rate of 10%, 8% and 6%. The real interest rate is2%.
The 1-year nominal interest rate will be (roughly) 10%.
Consider the return from investing in a 1-year Treasury security:
46
Inflation riskInflation risk
Year 0 value In° ation rate (%) Year 1 nom. payo® Year 1 real payo®1000 0.10 1100 10001000 0.08 1100 10191000 0.06 1100 1038
Lecture 3: Fixed income securities
Lecture Notes
15.401
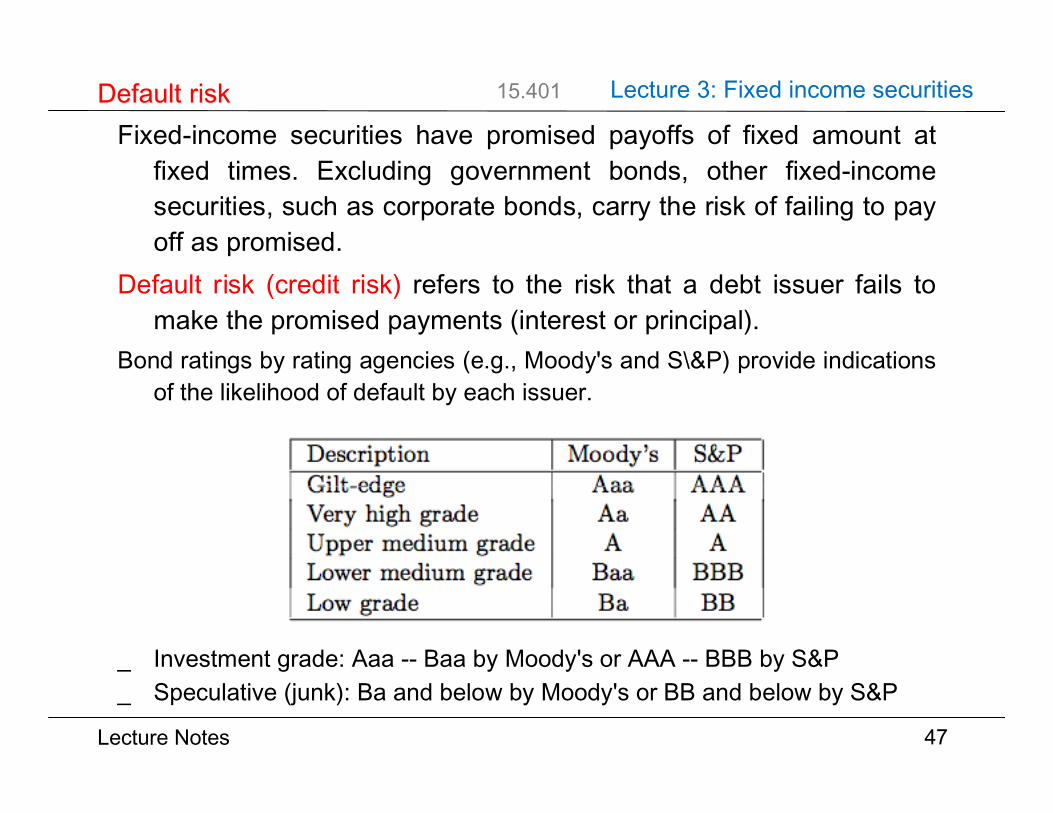
Fixed-income securities have promised payoffs of fixed amount atfixed times. Excluding government bonds, other fixed-incomesecurities, such as corporate bonds, carry the risk of failing to payoff as promised.
Default risk (credit risk) refers to the risk that a debt issuer fails tomake the promised payments (interest or principal).
Bond ratings by rating agencies (e.g., Moody's and S\&P) provide indicationsof the likelihood of default by each issuer.
_ Investment grade: Aaa -- Baa by Moody's or AAA -- BBB by S&P_ Speculative (junk): Ba and below by Moody's or BB and below by S&P
47
Default riskDefault risk
Description Moody's S&PG ilt-edge Aaa AAAVery high grade Aa AAUpper medium grade A ALower medium grade Baa BBBLow grade Ba BB
Lecture 3: Fixed income securities

Lecture Notes
15.401
Example. Suppose all bonds have par value $1,000 and_ 10-year Treasury strip is selling at $463.19, yielding 8%_ 10-year zero issued by XYZ Inc. is selling at $321.97_ Expected payoff from XYZ's 10-year zero is $762.22The XYZ bond:
_ Promised YTM: the yield if default does not occur_ Expected YTM: the probability-weighted average of all possible yields_ Default premium: the difference between promised yield and expected yield_ Bond risk premium: the difference between the expected yield on a risky bond and
the yield on a risk-free bond of similar maturity and coupon rate
48
Default riskDefault risk
Promised YTM =≥1000:00
321:97´1=10
¡ 1= 12%
Expected YTM =≥762:22321:97
´1=10¡ 1= 9%
Default Premium = Promised YTM ¡ Expected YTM= 12% ¡ 9% = 3%
Risk Premium = Expected YTM ¡ Default-free YTM= 9% ¡ 8% = 1%
Lecture 3: Fixed income securities
Promised YTM = (1000 / 321.97)110 −1 = 12%
Expected YTM = (762.22 / 321.97)110 −1 = 9%
Default premium = 12% - 9% = 3%Risk premium = 9% - 8% = 1%

Lecture Notes
15.401
Y ield-to-maturity for a risky bond
8% - Default-free YTM
9% - Expected YTM
12% - Promised YTM
Default-freerate
R iskpremium
DefaultpremiumY ield
spread
49
Default riskDefault risk Lecture 3: Fixed income securities
Lecture Notes
15.401 Lecture 3: Fixed income securities
_ Fixed-income securities_ Overview of fixed-income markets_ Term structure of interest rates_ Discount bonds and coupon bonds_ Forward interest rates_ Interest rate risk_ Inflation risk_ Default risk
50
Key conceptsKey concepts


![Contents 2020... · 2020. 10. 16. · Class Lesson Guide_[5A]_Term 4 Week 6 . Contents . MONDAY (19 October).....3 English Language (Fdn/Std).....3 Mathematics (Fdn/Std)](https://static.documents.pub/doc/80x56/61020083f22f806e5d02aad2/contents-2020-2020-10-16-class-lesson-guide5aterm-4-week-6-contents.jpg)


