To investigate wavelength (color) of light on the PV cell output current. To answer the question of why fluorescent bulbs are more efficient than
incandescent bulbs
MATERIALS
PV Cell Module Electrical Leads DC ammeter DC voltmeter 2 Lamps Light Filters 60W Incandescent Bulb Compact Fluorescent Bulb (13W Comparable light to 60W Incandescent Bulb)
OVERVIEW :
This experiment is designed to look at the effect of wavelength (color) of light on the output of a solar cell. Using an incandescent light bulb, the current output of the solar cell is measured as a series of filters are placed over the solar cell. Next a florescent bulb is used as a light source and the experiment is repeated. Given a sunny period with fairly consistent sunlight, this experiment can be run outdoors using light from the sun. The ratio of the solar cell current output shaded by the filter to the output of the cell without a filter can be used to investigate the dependence of the solar cell output on wavelength. This information can also be used to evaluate the wavelength of light emitted by the source.
By Stanley Micklavzina, Asher Tubman, and Frank Vignola for the Meyer Fund for Sustainable Development and the University of Oregon Department of Physics and the Solar Radiation Monitoring Laboratory
Part I: Affects of wavelength (“color”) on PV cell current output
Use only one cell on the PV module in the following exercise.
PV cells response (current output) is dependent upon the wavelength of sunlight. This exercise investigates this wavelength dependence of the PV cell performance (output). Note that PV cells also respond to some Infrared (IR) irradiance, a spectral region of light that we cannot see.
This experiment will be performed twice. First, use the lamp with an incandescent bulb and then with a lamp with a florescent bulb. It is suggest that two lamps be used, one with each type of bulb. This makes it unnecessary to unscrew the very hot incandescent bulb before screwing in the florescent bulb.
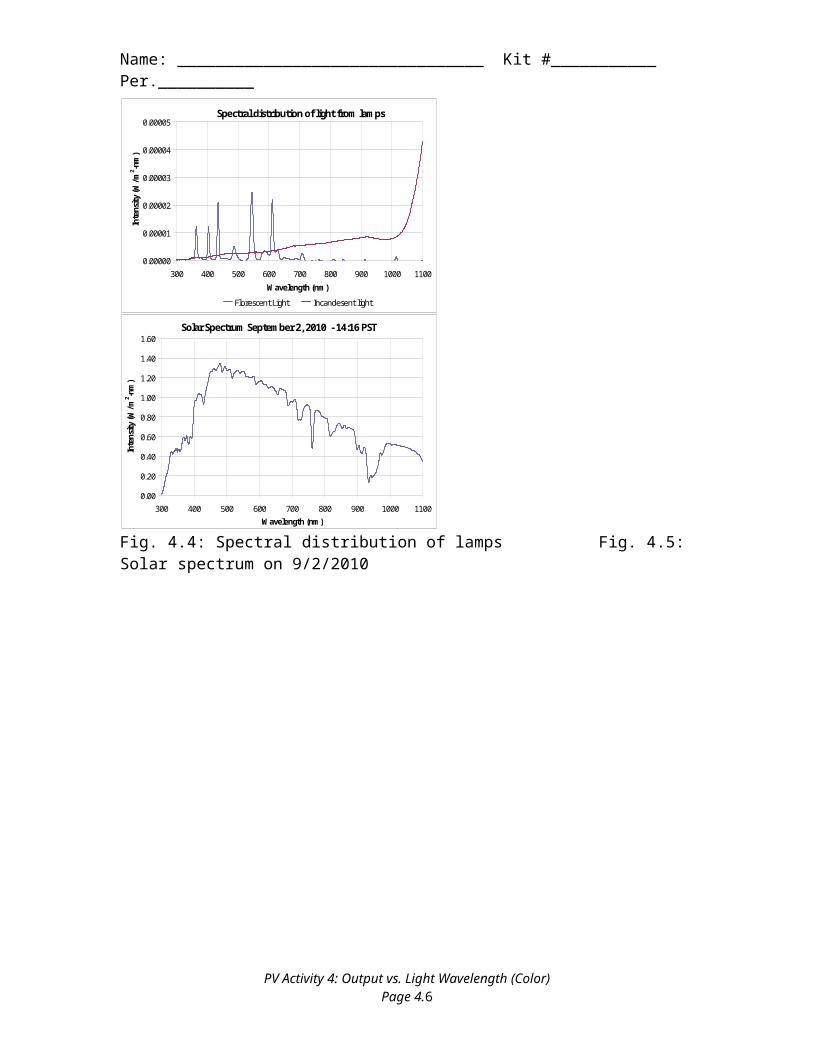
There is a graph on the page 4.3 that shows the transmittance curves for the light filters.
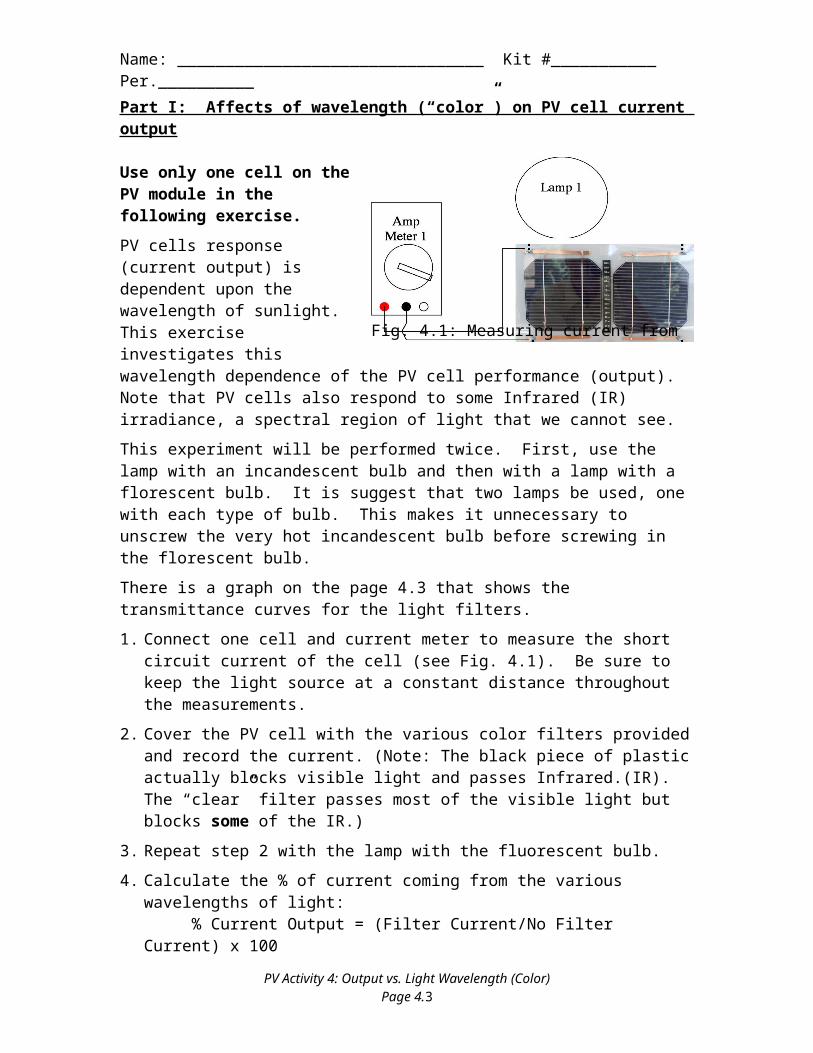
1. Connect one cell and current meter to measure the short circuit current of the cell (see Fig. 4.1). Be sure to keep the light source at a constant distance throughout the measurements.
2. Cover the PV cell with the various color filters provided and record the current. (Note: The black piece of plastic actually blocks visible light and passes Infrared.(IR). The “clear” filter passes most of the visible light but blocks some of the IR.)
3. Repeat step 2 with the lamp with the fluorescent bulb.
4. Calculate the % of current coming from the various wavelengths of light:% Current Output = (Filter Current/No Filter Current) x 100
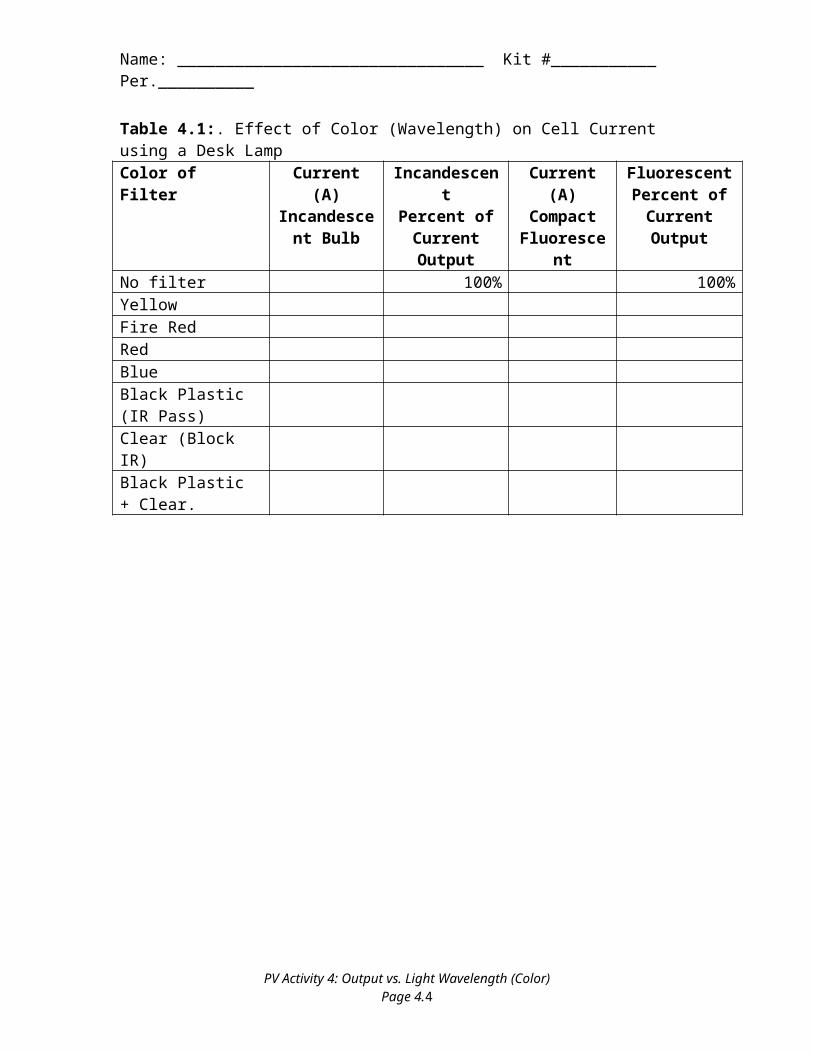
Table 4.1:. Effect of Color (Wavelength) on Cell Current using a Desk LampColor of Filter Current (A)
Incandescent Bulb
Incandescent Percent of
Current Output
Current (A) Compact
Fluorescent
Fluorescent Percent of
Current OutputNo filter 100% 100%Yellow Fire Red Red BlueBlack Plastic (IR Pass)Clear (Block IR)Black Plastic + Clear.
PV Activity 4: Output vs. Light Wavelength (Color)Page 4.2
Table 4.2: Wavelengths being transmitted by the filters
Color of Filter Wavelength being TransmittedYellow (Blocks Blue Light) > 500nmFire Red (Blocks Blue and some green) >550nm (color Filter # 15)Red (Blocks blue and green) > 630nm (color Filter # 27)Cerulean Blue (Blocks most red) See Fig. 4.3Black Plastic (Passes Infrared Blocks all visible)
Ideally, the combination of the Black Plastic filter and the Clear filter would cause the current to go to zero. It does not go to zero because the Clear filter does not block all the Infrared irradiance from passing through the filter. The combination of the Blue and the Red filter act very much like the Black Plastic Filter except they block a little more of the infrared radiation because each transmits only 90% of the IR.
Figures 4.2 & 4.3: Percent transmission of the filters.
PV Activity 4: Output vs. Light Wavelength (Color)Page 4.3
Discuss your results and include answers to the following questions.
What part of the light spectrum has produced the most current from the PV Cell, Visible or Infrared (IR)? (You can observe the table data or a suggested analysis would be to graph % Current Output vs. Wavelength for the Yellow, Fire Red, Red, Blue, and Visible Blocking filters.)
Why is the current output form the PV cell less for the Compact Fluorescent bulb while the illumination is about the same?
Why are Compact Fluorescent bulbs replacing Incandescent bulbs in businesses and households?
PV Activity 4: Output vs. Light Wavelength (Color)Page 4.5
Part II: Effect of sunlight on PV cell output current
Repeat the experiment with sunlight and see what you find. Note percent transmittance is equal to the current with the filter divided by the current without a filter times 100.
Table 4.3. Effect of Color (Wavelength) on Cell Current using sunlightColor of Filter Current (A)
SunlightPercent
TransmittedNo filter 100%Yellow Fire Red Red BlueBlack Plastic (IR Pass)Clear (Block IR)Black Plastic + Clear.
Discuss your results below. What part of the solar spectrum seems to have the greatest effect on the solar cell, Visible or IR?
How does the sun output compare with the light bulbs?
Compare and contrast the effects of the filters when the sun is the light source and when the light comes from the incandescent bulb and the florescent bulb. Is it possible to tell if the incandescent light bulb has a larger percentage of IR radiation than sunlight?
PV Activity 4: Output vs. Light Wavelength (Color)Page 4.6
If the students would plot % Output vs. Wavelength they would get data like seen below. The Y axis is the percent of output compared to the unfiltered output and the x axis is the wavelength that starts transmission through the filter (Table 4.2)
This shows most of the energy is actually coming from the IR part of the spectrum and not the visible part of the spectrum.
PV Activity 4: Output vs. Light Wavelength (Color)Page 4.7


![IEEE SEM - Wavelengths · 2018. 12. 6. · April 1, 2015 [IEEE SEM - WAVELENGTHS] Wavelengths. Section Chair’s Message . I received several responses to last month’ Chair’s](https://static.documents.pub/doc/80x56/60023b09958d664df8767988/ieee-sem-wavelengths-2018-12-6-april-1-2015-ieee-sem-wavelengths-wavelengths.jpg)


