101
PART VI ALUMINIUM REDUCTION TECHNOLOGY THE SECOND INTERNATIONAL CONGRESS «NON-FERROUS METALS – 2010», SEPTEMBER 2–4, 2010, KRASNOYARSK, RUSSIA

PART VI
ALUMINIUM REDUCTION TECHNOLOGY
THE SECOND INTERNATIONAL CONGRESS «NON-FERROUS METALS – 2010», SEPTEMBER 2–4, 2010, KRASNOYARSK, RUSSIA

The Second International Congress «Non-Ferrous Metals – 2010», September 2–4, Krasnoyarsk, Russia• Contents•
PART VI. ALUMINIUM REDUCTION TECHNOLOGY
RUSAL High-Amperage Technologies – 8 years Of Dynamic Evolution . . . . . . . . . . . . . . . . . . . . . . 286V.V. Pingin, A.V. Zavadyak, G.V. Arkhipov, M.A. Pak,V.V. Platonov, A.V. Proshkin, A.P. Skachko, I.I. Puzanov
Power Failure, Temporary Pot Shutdown, Restart And Repair . . . . . . . . . . . . . . . . . . . . . . . . . . . . . 299H.A. Ø ye , M. S rlie
Combining Industrial Engineering with Fundamentals to Improve Operating . . . . . . . . . . . . . . . . 307 and Control Practices for Cells with Increased Operating AmperageB.J. Welch , A. Alzaroni
Information Management Systems (Ims). Secrets of Their Efficiency . . . . . . . . . . . . . . . . . . . . . . . 316T.O. Khazaradze, V.F. Schwartzkopf
Current Efficiency of Aluminium Electrolysis Cells . . . . . . . . . . . . . . . . . . . . . . . . . . . . . . . . . . . . . . 317S.I. Nozhko, N.N. Pitertsev,
Russian Automation System of Electrolysis and Raw Stuff Feeding at Aluminium Smelter. . . . . . 322A.N. Skvortsov, P.A. Demykin
Effect of pitch quality on properties of baked anodes . . . . . . . . . . . . . . . . . . . . . . . . . . . . . . . . . . . . 333S.S. Zhuchkov , S.A. Khramenko
Experience of High-Sulfur Cokes Utilization in Baked Anode Production . . . . . . . . . . . . . . . . . . . . 336V.M. Polovnikov , I.V. Cherskikh , E.A. Startsev
The Management Process Higher Amperage Aluminum Cell by Automatic Feeding Systems . . . . 346V.Y. Bazhin , A.V. Lupenkov , A.A. Vlasov
Improving The Accuracy in Electrolyte Control at Aluminum Production. . . . . . . . . . . . . . . . . . . . 351by X-Ray Diffraction AnalysisJ.N. Zaitseva , I.S. Yakimov , S.G. Ruzhnikov , S.D. Kirik ,
Development of Inert Anodes for Electrolysis . . . . . . . . . . . . . . . . . . . . . . . . . . . . . . . . . . . . . . . . . . 354D.A. Simakov, A.V. Frolov, A.O. Gusev
Electrolytes for Low Temperature Aluminum Electrolysis. . . . . . . . . . . . . . . . . . . . . . . . . . . . . . . . . 361A.P. Apisarov, A.E. Dedyukhin, A.A. Redkin, P.E. Tinghaev, O.Yu. Tkacheva, Yu.P. Zaikov
Nickel Ferrite Cermets As Inert Anodes for Aluminum Electrolysis . . . . . . . . . . . . . . . . . . . . . . . . . 365B. Davis , A. Roy , S. Bell , C. Hitz , V. Krstic , Z. Krstic , D. Simakov
Construction and Electrode Materials for Low Temperature Aluminum Electrolysis . . . . . . . . . . . 375A.E. Dedyukhin, V.A. Kovrov, A.P. Khramov, A.Yu. Chuikin, Yu.P. Zaikov
Physical and Chemical Modeling for Control and Optimization Technology Relationship . . . . . . 379Component in The Aluminium Electrolysis N.V. Golovnykh , A.V. Mukhetdinova , V.A. Bychinsky , K.V. Chudnenko , I.I. Shepelev
Decisions for Radical Modernisation of Electrolysis Smelters. . . . . . . . . . . . . . . . . . . . . . . . . . . . . . 380 of Russion Aluminium IndustriesA.I. Begunov, A.A. Begunov

286
The Second International Congress «Non-Ferrous Metals – 2010», September 2–4, Krasnoyarsk, RussiaThe Second International Congress «Non-Ferrous Metals – 2010», September 2–4, Krasnoyarsk, Russia • Part VI • Aluminium Reduction Technology• Part VI • Aluminium Reduction Technology
Abstract
Severe competition demands from aluminum smelters highest performance which is im-
possible without state-of-the art engineering capability. In 2002 RUSAL started work to de-
velop its own high-amperage electrolysis technology. The charge over this task was given to the
Engineering& Technology Center (ETC) which assembled within its walls the best researchers
and experts.
The Engineering& Technology Center has worked out two novel electrolysis processes just-
ly called commercial:
RA-300 technology – 5 prototypes started in 2003, currently in operation are 341 cells
(336 cells – Khakass Aluminum Smelter, 5 cells – test area), amperage on an industrial scale –
320 kA. The technology is accepted for Boguchany Aluminum Smelter project in the scope of
672 cells.
RA-400 technology – 3 prototypes started in 2005–2006, currently in operation are 16 cells,
the amperage attained is 425 kA. The technology is accepted for Taishet Aluminum Smelter
project in the scope of 672 cells.
State-of-the-art technologies make RUSAL technologically independent to build new
smelters to further increase production output, to develop innovative engineering solutions
convertible for all processes of the company and enter the technology market with a competitive
product.
Introduction
For more than one hundred aluminum industry has been employing the electrochemical
process of Paul Heroult and Charles M. Hall to produce aluminum in electrolysis of cryolite-
alumina melts with carbon anode. All this time this technology has been continuously improved
to focus on unit power of cells. Since the start of the 20th century until the present day the am-
perage of commercial cells increased from 20–40 to 400–500 kA.
The primary motive to develop new technologies is the pursuit to reduce aluminum pro-
duction cost. Every leading company in the world strives to operate high-amperage cells; be-
cause powerful cells makes possible to decrease specific capital and operation cost to improve
economic efficiency of new smelters.
A case in point is shown in figure 1 – the milestones of high-amperage cell development by
PECHINEY, the processes of this company are classic for the industry.
From figure 1 it is apparent that complete cycle of process development (design, prototype
tests and implementation in commercial scale) is about 10 years. The engineering cycle varies,
at that, depending on the success of the project and market environment.
Fig. 1. The milestones of high-amperage cell development by PECHINEY
RUSAL HIGH-AMPERAGE TECHNOLOGIES – 8 YEARS OF DYNAMIC EVOLUTION
V.V. Pingin, A.V. Zavadyak, G.V. Arkhipov, M.A. Pak,V.V. Platonov, A.V. Proshkin, A.P. Skachko, I.I. Puzanov
RUSAL ETC Ltd., Krasnoyarsk, Russia

287
The Second International Congress «Non-Ferrous Metals – 2010», September 2–4, Krasnoyarsk, RussiaThe Second International Congress «Non-Ferrous Metals – 2010», September 2–4, Krasnoyarsk, Russia • Part VI • Aluminium Reduction Technology• Part VI • Aluminium Reduction Technology
RUSAL is a relatively young company founded in 2000. From its foundation the company
management has set a course for intensive development and ambitious goals:
• To be at the top of aluminum production
• Intensively develop production of aluminum by construction of new smelters.
• Modernize existing technologies and create new ones.
• Improve competitiveness in the world market.
To achieve the set goals the technological base should be inconformity with the world stan-
dards.
2. Engineering & Technology Center
Process maintenance, operating practices
were tested, structures of RA-300 and RA-400 cells
were checked in test areas of Sayanogorsk Alu-
minum Smelter (SAZ) which at the moment the
project was launched was the most advanced in
the territory of Russia. Five experimental RA-
300 cells were installed in potroom № 8, sixteen
RA-400 cells were installed in the pilot potroom.
Operating test areas where new engineering and
technological solutions are tested, makes possible
to reduce possible risks in construction of new smelters.
RA-300 and RA-400 processes were developed at a fast pace (development time is unprec-
edented in the industry), especially in view of the fact that in many respects they substantially de-
viated from the earlier VAMI designs forming the basis of SAZ potlines operating powerful cells.
RA-300 and RA-400 processes were designed on the basis of comparative analysis of the best
Western achievements, broad calculation and design capacities of ETC and quickly gained experi-
ence of employing experimental cell prototypes. Figure 3 shows milestones of these projects:
Fig. 3. Milestones of high-amperage process development by RUSAL
Compleat professionalism of the team, in-house know-how in the field of modeling, design
and construction enabled RUSAL in a relatively short time (~ 8 years) become an owner of its
own high-amperage 320 and 425 kA electrolysis technollogies with prebaked anodes.
3. High-amperage concept
3.1. Principal engineering solutionsIn April 2002 an objective was set to develop RA-300 employing novel engineering so-
lutions to reduce environmental load. The concept of high-amperage cells was based on op-
erational experience of the most powerful Russian cells C-255 (fig. 4) with design amperage
255 kA, operating in Sayanogorsk Aluminum Smelter.
Inspite of relatively high attained amperage basic technical and economic indicators of
these cells were substantially below the exemplary figures in the industry. Major problem was
the magnetihydrodynamic (MHD) instability of the cells which required operation with elevat-
ed height of metal.
Fig. 2. Engineering & Technology
Center

288
The Second International Congress «Non-Ferrous Metals – 2010», September 2–4, Krasnoyarsk, RussiaThe Second International Congress «Non-Ferrous Metals – 2010», September 2–4, Krasnoyarsk, Russia • Part VI • Aluminium Reduction Technology• Part VI • Aluminium Reduction Technology
Many years’ industrial operation experience
of C-255 cells made possible to disclose weak
spots in design and by the time RA-300 project was
launched the Company had now-how sufficient
to improve the cell design.
Principal directions in development of high-
amperage cell concept was to engineer a new bus-
bar circuit to eliminate negative effect of MHD
phenomena. The work to develop busbar for pow-
erful cells started in Russia more than 20 years ago
was based on in-situ measurements of magnetic
field in the cells and calculations employing the
first mathematical models. Tests of 300 kA cells
designed by VAMI and German firm VAW held in
1992–1993 at SAZ made a great contribution to development of RA-300 and RA-400 cells.
To develop RA-300 and RA-400 busbar design special attention was paid to arrangement and
«packing» of cathode busbar elements, to compensation of effect of the neighboring row of cells.
In March 2004 a ask was set to develop RA-400 process. RA-400 technology was based on
entire experience gained in design, installation and testing of RA-300 process (table 1).
RA-400 was designed in parallel with design and construction of Khakass Aluminum
Smelter, good solutions of RA-400 design were used in RA-300 in KhaZ.
Table 1
Evolution of engineering solutions of RA-300, RA-400
Cell arrangement
Cathode Anode Busbar design
C-2
55
Center-to center distance between cells – 7.5÷8.2 m; Elevation – ± 4.0 m
Cradle cathode shell type; Design of the lining (6 rows of refrac-tory and heat insulat-ing materials) does not provide for optimum heat balance of the cell;High specific weight of the cathode*
Design of superstructure with low gas removal efficiency;Non-optimum design of side pan-els (low sealing and electric insu-lation);Non-optimum design of the an-ode assembly;High specific weight of the an-ode*.
Design of busbar with low MHD sta-bility of the cell;High specific weight of the busbar*.
RA
-30
0
Center-to center distance between cells – 6.5 m; Eleva-tion – ± 3.0 m
Ribbed shell;Design of the lining (SiC plates, lower height of heat insu-lation) provides for optimum heat balance of the cell;Compared to C-255specific weight of the cathode reduced by 35 %.
New design of superstructure with high gas removal efficiency;New design of side panels (high sealing and electric insulation);New design of the anode as-sembly with double stub yoke 180 mm in diameter;Compared to C-255 specific weight of the anode reduced by 25 %.
New design of the busbar with im-proved MHD stabil-ity of the cell at 320 kA;Compared to C-255 specific weight of the busbar reduced by ~15 %.
RA
-40
0
Center-to center distance between cells – 6.3 m; Eleva-tion – ± 3.0 m
Modernized ribbed shell;Design of the lining (SiC plates, graphit-ic/graphitized cathode blocks) provides for optimum heat balance of the cell;Compared to RA-300specific weight of the cathode reduced by ~3 %.
Modernized design of super-structure with high gas removal efficiency;Modernized design of side panels (high sealing and electric insula-tion);New design of the anode as-sembly with twin six-stub yoke 180 mm in diameter;New geometry of carbon blocks (increased length, with «slots»)Compared to RA-300 specific weight of the anode reduced by ~3 %.
Modernized design of the busbar with high MHD stability of the cell at 425 kA;Compared to RA-300 specific weight of the busbar re-duced by ~20 %.New bypass system.
*mass/amperage ratio
Fig. 4. С-255

289
The Second International Congress «Non-Ferrous Metals – 2010», September 2–4, Krasnoyarsk, RussiaThe Second International Congress «Non-Ferrous Metals – 2010», September 2–4, Krasnoyarsk, Russia • Part VI • Aluminium Reduction Technology• Part VI • Aluminium Reduction Technology
Thorough design study of basic engineering solutions made possible to work out general
configuration of new RA-300, RA-400 cells, including:
1. Superstructure with a new gas removal system;
2. Cathode shell with minimum deformation and more efficient heat transfer;
3. Lining providing for the integrity of the cathode bottom lining and optimum energy
balance;
4. Busbar with high magnetohydrodynamic stability
Table 2 presents calculation of MHD stability of RA-400 cells at 400 kA. Calculations pre-
dict steady operation mode at metal height 8 cm and anode-cathode distance (ACD) 3.6 cm.
Table 2
Voltage, V(ACD, cm)
Metal height, cm
5 6 7 8 9
4.02 (3.2)
4.19 (3.6)
4.35 (4.0)
4.52 (4.4)
4.68 (4.8)
3.2. Selection of lining materialsThe methodology of selecting lining materials for high-amperage cells involved continuous
monitoring of global tendencies in production and application of new lining materials, making
selection on the basis of comparative laboratory and industrial tests. To evaluate the quality
of lining materials, in addition to standard methods for determination of physical-mechanical
properties, specialized methods and experimental plants have been developed to analyze behav-
ior of the new materials in contact with liquid and gaseous aggressive components.
Figures 5 and 6 show general view of the plant to test cryolite resistance and an experimen-
tal cell to evaluate resistance to gaseous components of different heat insulation material types.
To this date more than 120 barrier materials of foreign and Russian manufacturers have been
tested, ample information base has been accumulated to make substantiated selection of lining
materials. Performance characteristics of cathode blocks and ramming pastes made by different
manufacturers have been evaluated separately.
Condition of cathodes was monitored during installation of cells and their operation. Con-
dition of lining materials was evaluated during autopsies. This made possible to study the run-
ning processes and develop technologies to improve the lining operations.
ETC has developed a technology to make jointless low-porosity (~17–19 %) barrier layers
of unmolded materials employing a self-propelled vibrating compactor (fig. 7). This made pos-
sible to slow down bath penetration into the heat insulation of the cathode and provide for higher
stability of temperature fields in the cells. In addition to improved quality of barrier materials (by
decelerated penetration rate) this technology reduced labor expenses and installation time.
Fig. 5. Plant to test cryolite resistance
of barrier materials
Fig. 6. Experimental cell to evaluate
resistance of heat insulating materials to
gaseous components

290
The Second International Congress «Non-Ferrous Metals – 2010», September 2–4, Krasnoyarsk, RussiaThe Second International Congress «Non-Ferrous Metals – 2010», September 2–4, Krasnoyarsk, Russia • Part VI • Aluminium Reduction Technology• Part VI • Aluminium Reduction Technology
To reduce import of foreign materials to decrease the cost of lining materials development
of lining materials by Russian manufacturers have been initiated. Russian refractory BorAlBar
bricks, dry barrier mix (DBM), vermiculite heat insulating plates have been produced and suc-
cessfully used.
3.3. Mathematical modeling and experimental studiesParallel to development of high-amperage cell concept a group of specialists engaged in
mathematical modeling has been founded. For their work the group had a broad range of instru-
ments – from well known commercial packages to copyrighted material. Computer modeling
helped consider and optimize such cell parameters as:
• Temperature field – COSMOS/M, ANSYS;
• Electric field – COSMOS/M, ANSYS;
• Strain-stress state – COSMOS/M, ANSYS;
• Magnetic hydrodynamics – Arc@Rusal, ANSYS, StarCD.
Software products COSMOS/M, ANSYS and STAR-CD were used to develop models to
evaluate:
• design of the cathode shell, lining and superstructure;
• gas removal efficiency
• potroom ventilation
• parameters of prebaking, start-up and steady-state cell operation.
Software products Blums, Arc@Rusal, ANSYS and STAR-CD were used to develop models
to evaluate:
• MHD-stability;
• busbar design;
• bath and metal motion.
To model the electric field (fig. 8) distribution of potential and current density was evalu-
ated for the data to be analyzed and transferred into the electromagnetic field model. After that
electric balance, operational and average voltage, specific consumption of electric energy were
calculated.
To model the temperature field (fig. 9) position of solidus and liquidus isotherms was de-
termined to evaluate the freeze profile, reduce penetration in to the sub-cathode and preserve
Fig. 7. Vibrating compactor to make jointless
low-porosity barrier layers
Fig. 8. Electric field of RA-400 Fig. 9. Temperature field of RA-300

291
The Second International Congress «Non-Ferrous Metals – 2010», September 2–4, Krasnoyarsk, RussiaThe Second International Congress «Non-Ferrous Metals – 2010», September 2–4, Krasnoyarsk, Russia • Part VI • Aluminium Reduction Technology• Part VI • Aluminium Reduction Technology
the integrity of the cathode bottom. Magnetic hydrody-
namics of the cell was calculated to evaluate distribu-
tion of magnetic induction vector, motion velocity and
MHD stability margin, and to check conformity with
criteria of an MHD-stable cells. Calculations made for
different variations of the cathode shell, design of the
lining and busbar made possible to optimize the electric
and thermal field, ensure required freeze profile and
protective ledge, determine the busbar arrangement
providing for high MHD stability of the cell.
Modeling of RA-300 and RA-400 cells made pos-
sible to select an optimum design of the cathode from
the standpoint of temperature fields, freeze profile, in-
tegrity of the cathode bottom and deformations.
To produce confident results continuous work was
carried out to identify mathematical models on designs
of operating cells of the Company.
Multi-purpose diagnostic equipment KD-300 (КД-300 – fig. 10) was used to record
174 variables: temperature determination – 74 ea.; current load determination – 91 ea.; strain
gages – 9 ea. Later KD was removed from RA-300 cell to be updated for RA-400. Modified KD-
400 system (to record 55 variables) comprised determination of temperature of the cathode:
6 thermocouples in the lining, 24 thermocouples in peripheral joints, 19 thermocouples in the
cathode shell and 6 strain gages.
The measuring equipment on the whole proved calculation results and adequacy of the
model.
During the operation period of RA-300 and RA-400 cells ETC specialists made multiple ex-
perimental determinations of temperature of structural elements of the cell, electric and energy
balances, metal velocity (fig. 11) and gas flow velocity (fig. 12).
Fig. 11. Calculated and measured metal motion velocities, cm/s
Fig. 12. Calculated and measured gas flow velocities
Fig. 10. Thermocouples built into the
sub-cathode, current load sensors on
the cathode bars, sensor registering
movement of RA-300 on the goal
post

292
The Second International Congress «Non-Ferrous Metals – 2010», September 2–4, Krasnoyarsk, RussiaThe Second International Congress «Non-Ferrous Metals – 2010», September 2–4, Krasnoyarsk, Russia • Part VI • Aluminium Reduction Technology• Part VI • Aluminium Reduction Technology
4. Automated process control system
RA-300 and RA-400 cell operation is controlled by automated process control system SAAT
(CAAT) which is in-house development of ETC specialists.
The lower level cell control cabinets are «Siemens»-based SAAT-2 (fig. 13). One cabinet is
to control two cells. The upper control level is SUN server station.
The upper level software performs the following functions («Elvis» software, fig. 6): col-
lect, process and archive the lower level data; generate process and emergency messages (in-
cluding loudspeaker communication messages); communication with the smelter IT system;
visualize current status of cells; generate documents of archive data in text and graphic form;
change settings and block the lower level operation.
At the lower level the software performs the following functions: measure cell voltage and
potline current, calculate and filter normalized voltage; control movement of the anode carbon
to eliminate disagreement between the target and actual normalized voltage; predict, monitor,
track and quench anode effects; evaluate cell noise and eliminate MHD instability; control metal
tapping; control anode setting; control rack raising; control start-up cell; control alumina feeding
by concentration and by the timer; control aluminum fluoride addition; control current of anode
carbon motor drives; display basic parameters of CPCS operation in control cabinet display.
5. Experimental operation of RA-300 cells
To reduce test costs a decision was made
to displace the test area for RA-300 in operat-
ing potroom № 8 of Sayanogorsk Aluminum
Smelter (fig. 15).
In addition to RA-300 the booster substa-
tion was to increase the amperage at a section
of C-255 cells with modernized busbar in pot-
room № 7. Power supply for the test areas in-
volved the following problems:
• to independently boost test cells
sections by any substation unit;
• to minimize negative effect of magnetic
field from busbars of boosting station
to test and potline cells;
• to reduce negative effect of magnetic
field of the connecting busbar between
potrooms № 7, 8 to test cells;
• to eliminate disturbances in uniform
distribution of current over the busbar
branches during change-over from
one busbar to an other.
Fig. 13. KhAZ RA-300 control cabinet Fig. 14. Parameters of cell operation
for 24 hours by «Elvis» software
Fig. 15. RA-300 cell arrangement
in potroom № 8

293
The Second International Congress «Non-Ferrous Metals – 2010», September 2–4, Krasnoyarsk, RussiaThe Second International Congress «Non-Ferrous Metals – 2010», September 2–4, Krasnoyarsk, Russia • Part VI • Aluminium Reduction Technology• Part VI • Aluminium Reduction Technology
The operation period of test RA-
300 cells from start-up to commercial ex-
pansion can be divided into five significant
time intervals:
Period № 1. Five test RA-300 cells
were commissioned from 11 to 23 Decem-
ber 2003 (fig. 16).
The cells were preheated for 72 hours
by heat released by direct current passing
through the cell (coke coarse fraction pre-
heating). RA-300 cells were preheated in
8 stages employing special rheostat shunts.
At the start-up the amperage was 273 kA.
Period № 2. After stabilization of the
cell operation the amperage was increased
to 300 kA during the post-start-up period
and at this amperage the test area operated for 9 months. Actions to attain design performance
have been made, shortcomings have been disclosed, ways to optimize the cell design have been
outlined, dense phase alumina distribution system has been implemented.
Period № 3. After the development strategy was determined (to further increase produc-
tion capacity) in 4 months the amperage was increased to 312 kA without structural changes in
the cell.
Operation period with increased amperage made possible to find «weak» spots in cell de-
sign and make appropriate modifications:
• new geometry of the anode block and design of the anode assembly with increased
diameter of the stud (fig. 17);
• improved ventilation of the cathode shells;
• optimized feeding algorithm to reduce the frequency of anode effects;
• automatic quenching of anode effects (fig. 18).
This work made possible to increase amperage on test cells to 320 kA.
To reduce risks of commercial expansion associated with the cell life much attention was
paid to assessing lining behavior and the entire cathode during operation.
In five years eight autopsies (including
participation of world level experts) were
carried out in RA-300 test area (fig. 19). In view of the results of autopsies pre-
heating and start-up processes have been
revised, design of the lining and cathode
shell has been optimized. This work made
possible to eliminate the found shortcom-
ings and minimize the risk of industrial ap-
plication.
Fig. 16. Preparation of cell № 887 for start-up
Earlier design New design
Fig. 17. Sketches of anode block and yokeа Fig. 18. Example of automatic quenching of
anode effect in «Elvis» software
Fig. 19. RA-300 lining

294
The Second International Congress «Non-Ferrous Metals – 2010», September 2–4, Krasnoyarsk, RussiaThe Second International Congress «Non-Ferrous Metals – 2010», September 2–4, Krasnoyarsk, Russia • Part VI • Aluminium Reduction Technology• Part VI • Aluminium Reduction Technology
Period № 4. Main goal of this period was to test technological solutions for the Khakass
Aluminum Smelter project:
• to flame preheat RA-300 cells employing «Hotwork» equipment;
• to improve start-up and bath preparation procedures;
• to introduce new process operations to reduce the anode setting cycle (change-over
from 24 to 32 hours cycle), this made necessary to radically change the approach to
organization of production on the whole, precisely specify processing sequence and
time (fig. 20).
Fig. 20. Process cycle
Period № 5. In this period of test cell operation engineering solution to further develop
RA-300 technology with respect to the level attained at KhaZ have been tested. Among the key
events of this period are:
– Tests of graphitic and graphitized cathode blocks;
– Tests of slotted anodes;
– Increase of amperage to 328 kA.
Long-term operation of RA-300 proved correctness of embedded engineering solutions
and feasibility of operating at amperage higher than 300 kA (table 3).
Table 3
Performance indicators of test RA-300 cells
Indicator Design value Level attained
Cell production, kg/day 2100–2250 2478
Amperage, kA 280–300 328
Anode current density, A/cm 2 0.77–0.82 0.889
Current efficiency, % >93 93.7
Electric energy consumption, kW⋅h/t Al <13800 13950*
Prebaked anode consumption (gross/net), kg/t Al 540/420 530/420
* Electric energy consumption increased due to considerable increase of amperage and,accordingly, of anode current density as related to design values.
6. Industrial application of RA-300 technology
Tests of RA-300 technology at the test area formed grounds to make a decision to use this
technology as basis for KhaZ construction. This decision was based on capital cost estimate and
estimate of the risk of industrial introduction of the technology made in partnership with for-
eign experts.
Khakass Aluminum Smelter is the first enterprise of aluminum industry built in Russia in
recent 20 years. KhAZ is located in the operational site of Sayanogorsk Aluminum Smelter. KhaZ

295
The Second International Congress «Non-Ferrous Metals – 2010», September 2–4, Krasnoyarsk, RussiaThe Second International Congress «Non-Ferrous Metals – 2010», September 2–4, Krasnoyarsk, Russia • Part VI • Aluminium Reduction Technology• Part VI • Aluminium Reduction Technology
project is the second stage of SAZ, together they form an integrated industrial complex. Ad-
vanced technologies, international ecological standards, high quality of products – all this ranks
KhAZ among the state-of-the-art aluminum smelters in the world.
New engineering solutions and modern equipment create «comfortable» conditions for
RA-300 cells and derive maximum effect of the technology developed:
– new Alstom gas scrubbing equipment ensures high ecological efficiency of the technology;
– NKM-Noell multi-purpose potroom cranes (fig. 22) remove anodes in couples, mechani-
cally clean the cathode bottom by the cavity cleaner and load fluorides into the bins.
Fig. 21. RA-300 Khakass Aluminum Smelter Fig. 22. NKM-Noell potroom crane
Commercial version of RA-300 cell was optimized in terms of capital costs per cell and in-
volved all technological innovations which demonstrated their efficiency during pilot tests:
• modernized design of the superstructure providing for uniform and efficient gas removal
over the entire length of the cell;
• sealing of the anode bar to improve environmental performance;
• new design of the anode assembly yielding positive results both in increase of production
capacity of the cell and reduction of anode consumption;
• symmetrical arrangement of feeding points of the alumina and aluminum fluoride point
feeding system;
• cell busbar with reduced weight and improved MHD performance.
On 27 November 2006 KhAZ started the first two cells in potroom № 9 – № 9038 and
№ 9042 (today the life time of the cells is 41 months). Every day two cells were started at the
same time with one shutdown of potline load. The last cell of potroom № 10–10168 was started
on 29.10.2007; so the start-up period between the first and the last cell was 336 days.
Operation of Khakass Aluminum Smelter proved efficiency of engineering solutions, basic
technico-economic indicators substantially exceeded the design values (table 4).
Table 4
Basic performance indicators of KhAZ cells
Indicator Actual values June 2009 – May 2010
Amperage, kA 319.8
Current efficiency, % 94.9
Cell production capacity, kg/day 2446
Electric energy consumption, kW⋅h/t Al 13695
Average voltage, V 4.367
Consumption of prebaked anodes, gross/net, kg/t Al 529/419
Frequency of anode effects, AE/day per cell 0.095
Anode effect time, min 0.51
Total fluorine emissions, kg/t Al 0.26*
*estimate after commissioning all KhAZ cells.
At present Khakass Aluminum Smelter is among the world leaders in terms of production and environmental performance and operation costs.

296
The Second International Congress «Non-Ferrous Metals – 2010», September 2–4, Krasnoyarsk, RussiaThe Second International Congress «Non-Ferrous Metals – 2010», September 2–4, Krasnoyarsk, Russia • Part VI • Aluminium Reduction Technology• Part VI • Aluminium Reduction Technology
7. Experimental operation of RA-400 cells
RA-400 were installed in SAZ pilot potroom built in late 80s–early 90s. The potroom was
designed to elaborate and study electrolysis process and change the construction part of the
potroom, to test different cell designs and different center-to-center distance (fig. 23).
The operation period of RA-400 test cells can be divided into three significant time inter-
vals:
Period № 1. Three first RA-400 cells for design amperage 400 kA were started from 24 De-
cember 2005 till 14 February 2006 (fig. 24).
The first campaign cells are still in operation and as of July 2010 the age of the cells is
53 months.
The cells were preheated by «Hotwork» equipment in 70–72 hours. To cut cells into the
potline the process load was reduced to 0 kA. After cut-in the current was increased to 400 kA in
three stages.
After one year of operation to assess design of the lining and condition of RA-400 cell,
a test cell was autopsied in partnership with foreign experts.
Results of the autopsy were compared to the data of RA-300 cells. Condition of refractory
and heat insulation materials was recognized satisfactory (fig. 25).
Analysis of steel structures, properties of materials and lining on the whole helped make
expert conclusion about minimum risks in industrial expansion of RA-400 technology with cell
life not less than 1800 days.
Period № 2. Operational experience gained on the first generation cells proved the
efficiency of engineering solutions and made possible to find the margin of the design from
the standpoint of material intensity reduction and production capacity increase. In June-July
2008 five more RA-400 cells with optimized design were started:
– center-to-center distance was reduced from 6.5 to 6.3 m;
– changes made in the design of cathode and superstructure;
– busbar weight reduced;
– cell shunt system rearranged.
In July the age of this section of cells was 34 months.
Fig. 23. RA-400 test area Fig. 24. RA-400 cell
Fig. 25. Lining condition in RA-400

297
The Second International Congress «Non-Ferrous Metals – 2010», September 2–4, Krasnoyarsk, RussiaThe Second International Congress «Non-Ferrous Metals – 2010», September 2–4, Krasnoyarsk, Russia • Part VI • Aluminium Reduction Technology• Part VI • Aluminium Reduction Technology
Period № 3. The third expansion stage of RA-400 test stage was in November-December
2008. Eight RA-400T cells were started to implement all engineering solutions accepted for im-
plementation in Taishet Aluminum Smelter. During this stage manufacturing and installation
of all elements of the cell were elaborated, commercial version of control system for the crust
breakers with bath contact sensors was tested, methods of cell startup without shutting down
process load were tested.
Basic technico-economic and ecological indicators of RA-400 cells are presented in table 5.
Table 5
RA-400 performance indicators
Indicator Design value Level attained Cell potential
Technico-economic indicators
Cell production capacity, kg/day 3016 3239 3371
Anode current density, A/cm 2 0.855 0.851 0.85–0.88
Amperage, kA 400 425 440
Current efficiency, % 93.5 94.5 95.0
Specific electric energy consumption, kW⋅h/t Al 13846 13637 <13300
Average voltage, V 4.35 4.33 4.25
Carbon consumption, gross, net, kg/t Al 550/430 520/408 517/406
Environmental indicators
Frequency of anode effects, AE/cell⋅day 0.3 0.035 0.02
Total fluorine emissions, kg/t Al 0.47 <0.47 Less than 0.26
High level attained notwithstanding, RA-400 has high potentialities to improve technico-economical and environmental indicators.
8. RA-300, RA-400 Projects
Boguchany Aluminum SmelterPerformance attained at Khakass Aluminum Smelter considered the RA-300 technology
was adopted for Boguchany Aluminum Smelter project with annual output 600 thousand tons.
Industrial site of aluminum smelter is in Boguchany district north-east of Krasnoyarsk krai
(fig. 26). Reduction plant is to comprise two potlines 336 cells each, a potline of two potrooms,
168 RA-300 cells in each potroom.
Fig. 26. Boguchany Aluminum Smelter construction site
Operational experience of Khakass Aluminum Smelter allows to hope for further increase
of production capacity, energy and environmental performance of RA-300 technology in Bogu-
chany Aluminum Smelter.
Taishet Aluminum SmelterTo develop bankable feasibility study for construction of an aluminum smelter in Taishet
(Irkutsk oblast) RUSAL invited the world leader in the engineering and consulting services for
the field of non-ferrous metallurgy – Bechtel Corporation.
After consideration of a number of potential electrolysis processes Bechtel confirmed feasi-
bility and expedience of employing RA-400 technology for the bankable feasibility study for con-
struction of an aluminum smelter in Irkutsk oblast with minimum risk of industrial introduction.
298
The Second International Congress «Non-Ferrous Metals – 2010», September 2–4, Krasnoyarsk, RussiaThe Second International Congress «Non-Ferrous Metals – 2010», September 2–4, Krasnoyarsk, Russia • Part VI • Aluminium Reduction Technology• Part VI • Aluminium Reduction Technology
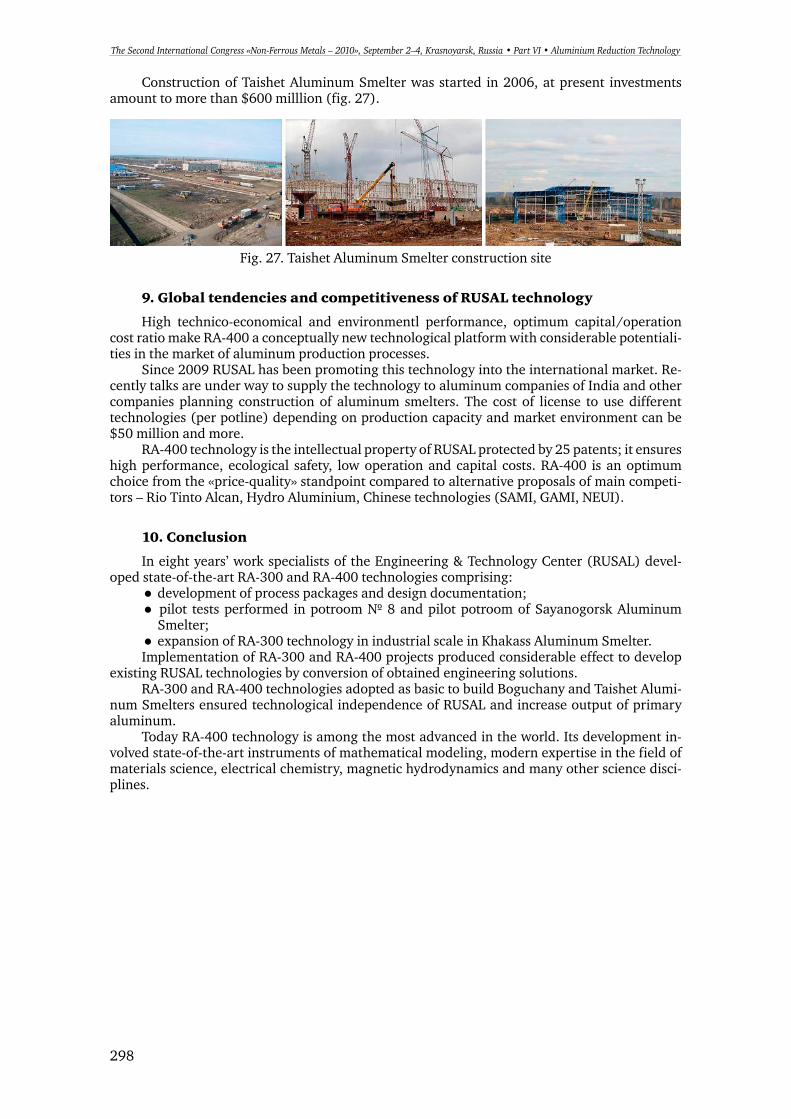
Construction of Taishet Aluminum Smelter was started in 2006, at present investments
amount to more than $600 milllion (fig. 27).
Fig. 27. Taishet Aluminum Smelter construction site
9. Global tendencies and competitiveness of RUSAL technology
High technico-economical and environmentl performance, optimum capital/operation
cost ratio make RA-400 a conceptually new technological platform with considerable potentiali-
ties in the market of aluminum production processes.
Since 2009 RUSAL has been promoting this technology into the international market. Re-
cently talks are under way to supply the technology to aluminum companies of India and other
companies planning construction of aluminum smelters. The cost of license to use different
technologies (per potline) depending on production capacity and market environment can be
$50 million and more.
RA-400 technology is the intellectual property of RUSAL protected by 25 patents; it ensures
high performance, ecological safety, low operation and capital costs. RA-400 is an optimum
choice from the «price-quality» standpoint compared to alternative proposals of main competi-
tors – Rio Tinto Alcan, Hydro Aluminium, Chinese technologies (SAMI, GAMI, NEUI).
10. Conclusion
In eight years’ work specialists of the Engineering & Technology Center (RUSAL) devel-
oped state-of-the-art RA-300 and RA-400 technologies comprising:
• development of process packages and design documentation;
• pilot tests performed in potroom № 8 and pilot potroom of Sayanogorsk Aluminum
Smelter;
• expansion of RA-300 technology in industrial scale in Khakass Aluminum Smelter.
Implementation of RA-300 and RA-400 projects produced considerable effect to develop
existing RUSAL technologies by conversion of obtained engineering solutions.
RA-300 and RA-400 technologies adopted as basic to build Boguchany and Taishet Alumi-
num Smelters ensured technological independence of RUSAL and increase output of primary
aluminum.
Today RA-400 technology is among the most advanced in the world. Its development in-
volved state-of-the-art instruments of mathematical modeling, modern expertise in the field of
materials science, electrical chemistry, magnetic hydrodynamics and many other science disci-
plines.

299
The Second International Congress «Non-Ferrous Metals – 2010», September 2–4, Krasnoyarsk, RussiaThe Second International Congress «Non-Ferrous Metals – 2010», September 2–4, Krasnoyarsk, Russia • Part VI • Aluminium Reduction Technology• Part VI • Aluminium Reduction Technology
Power Failure
All power interruptions will affect the operation of aluminium cells, from adapting modi-
fied operation procedures during routine power modulations to full shutdown at power line or
rectifier failure. Due to limited power or grid capacity several smelters have to live with power
modulation in periods of peak power demand and have worked out routines to deal with that.
Primary aluminium producers must have an emergency program to deal with all kinds of
power failures. Such situations can occur without warning and a power failure period of more
than a few hours may be fatal to most prebaked anode potlines. In this situation it is difficult to
minimize the damage. However, most power outages are not that dramatic, but it is nevertheless
necessary to have worked out emergency programs and have foremen and operators drilled in
these. Temporary shut-downs of potlines or groups of pots may also be caused by seasonal pow-
er shortages, economic considerations or industrial disputes [1, 2]. All shutdowns may result in
some irreversible damage to the pots and will likely reduce pot life.
Most smelters will have auxiliary power. However, if auxiliary power is lost during a full pow-
er failure, there is little one can do other than rapidly evacuate the potrooms. Since the fans will
not operate, carbon monoxide poisoning will be a real danger to personnel not wearing suitable
respiratory protection. If line load only falls out and loss of power is assumed to be over the critical
length of time, i. e. the time it takes for the bath to freeze, the anodes should be let down into the
metal but pulled up again in the interval between bath and metal freeze. With some power avail-
able it would be preferable, but not always possible, to run the pots on a lower load. Alternatively
only part of the line would need to shut down. If the power is restored within the critical time
period, pot operation is resumed, possibly at a lower load to give the rectifiers a necessary margin
to handle increased pot voltage for rapidly getting back to normal pot operating temperature and
conditions as well as handling the large number of anode effects that is likely to occur.
In the event of an unplanned power failure the cells will quickly lose temperature and the
electrolyte begin to freeze. There are, however, considerable differences between the reaction
of cells to power loss depending upon technology, size, design and cell condition [3]. S derberg
pots will cool slower than prebake cells. Due to the high heat capacity of the S derberg anode
this type of cell can tolerate larger power modulations and longer power failure periods than a
similar size prebaked cell without irreversible consequences. A pot in poor condition, e. g. run-
ning high voltage due to partial destruction of thermal insulation, will cool faster than a simi-
lar cell with intact thermal insulation. In general modern prebake cells (300–400 kA) will be
most vulnerable and have a significantly higher risk of damages if power interruptions should
occur. These high amperage cells are deliberately designed to have a high heat loss out from
cathode and sidelining. They are built with high thermal conductivity materials such as graphite
bottom blocks and graphite and/or silicon carbide in sides. Their sidewall blocks may be thinner
and they have enhanced shell cooling, e. g. fins, fans or forced air cooling.
Cell Cooling
Potline power interruptions of 10–30 minutes are commonly carried out in many smelters to
change cathodes and perform other necessary repairs. A prebaked cell can normally tolerate short
power interruptions without too much adverse effects. Operational side effects of a full power in-
terruption up to 1 hour will normally be cooling of the electrolyte to about 940 oC, increased anode
effect frequency, excess muck, more bottom ridge and an increase in ledge thickness. When the pe-
riod reaches 1–2 hours more serious problems are encountered. The bath may cool to about 900 oC,
and the cell will begin to freeze in and muck up. When power returns, a lot of anode effects will
POWER FAILURE, TEMPORARY POT SHUTDOWN, RESTART AND REPAIR
H.A. Ø ye 1, M. S rlie 2
1 Department of Materials Technology
Norwegian University of Science and Technology, Trondheim, Norway2 Alcoa Norway ANS, Kristiansand, Norway
300
The Second International Congress «Non-Ferrous Metals – 2010», September 2–4, Krasnoyarsk, RussiaThe Second International Congress «Non-Ferrous Metals – 2010», September 2–4, Krasnoyarsk, Russia • Part VI • Aluminium Reduction Technology• Part VI • Aluminium Reduction Technology
occur and the possibility of having to shut down some cells is high. A shutdown period stretched
towards 3 hours will, after power is restored, cause extreme difficulty in pot operations [4]. Non-
planned prebake cell power interruptions of more than 3 hours can be catastrophic. This can re-
sult in complete freezing of bath and the forced shutdown of all cells in a potline. Based on their
experience Stam and Schaafsma [5] claim that full power loss periods with a maximum duration
of about 2 hours is manageable for repeated current interruptions. A time limit of 3 to 4 hours is
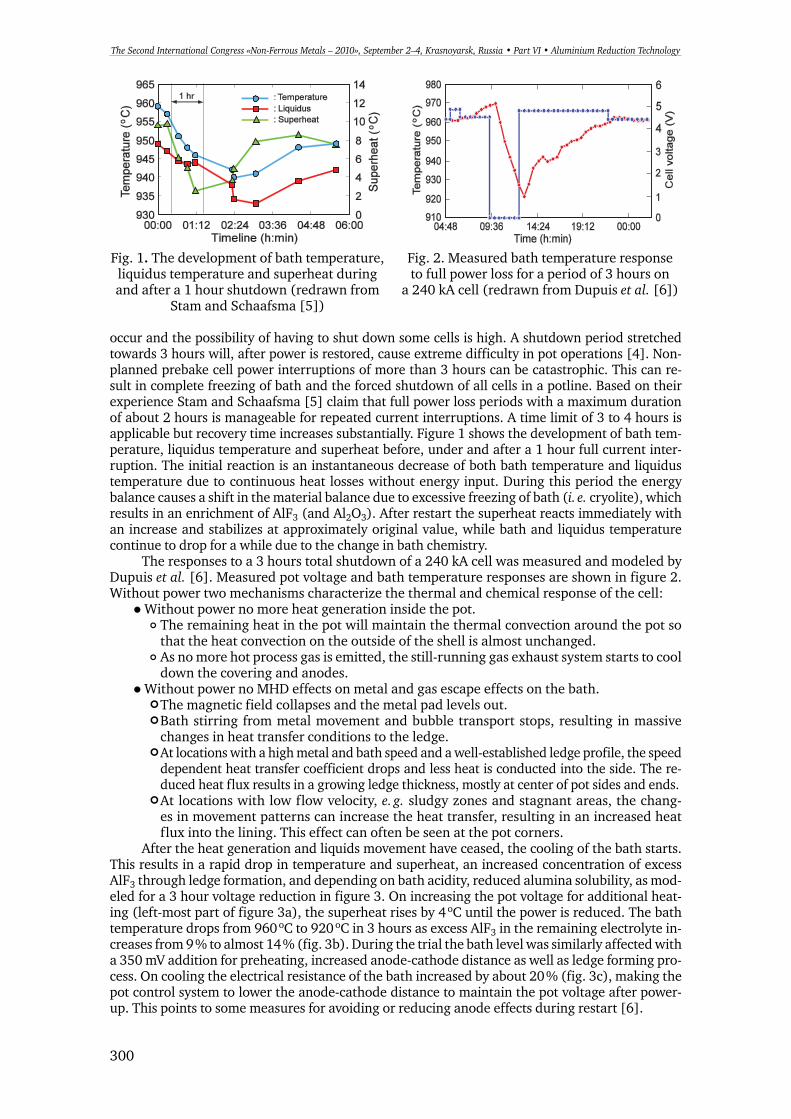
applicable but recovery time increases substantially. Figure 1 shows the development of bath tem-
perature, liquidus temperature and superheat before, under and after a 1 hour full current inter-
ruption. The initial reaction is an instantaneous decrease of both bath temperature and liquidus
temperature due to continuous heat losses without energy input. During this period the energy
balance causes a shift in the material balance due to excessive freezing of bath (i. e. cryolite), which
results in an enrichment of AlF3 (and Al2O3). After restart the superheat reacts immediately with
an increase and stabilizes at approximately original value, while bath and liquidus temperature
continue to drop for a while due to the change in bath chemistry.
The responses to a 3 hours total shutdown of a 240 kA cell was measured and modeled by
Dupuis et al. [6]. Measured pot voltage and bath temperature responses are shown in figure 2.
Without power two mechanisms characterize the thermal and chemical response of the cell:
• Without power no more heat generation inside the pot.
The remaining heat in the pot will maintain the thermal convection around the pot so
that the heat convection on the outside of the shell is almost unchanged.
As no more hot process gas is emitted, the still-running gas exhaust system starts to cool
down the covering and anodes.
• Without power no MHD effects on metal and gas escape effects on the bath.
The magnetic field collapses and the metal pad levels out.
Bath stirring from metal movement and bubble transport stops, resulting in massive
changes in heat transfer conditions to the ledge.
At locations with a high metal and bath speed and a well-established ledge profile, the speed
dependent heat transfer coefficient drops and less heat is conducted into the side. The re-
duced heat flux results in a growing ledge thickness, mostly at center of pot sides and ends.
At locations with low flow velocity, e. g. sludgy zones and stagnant areas, the chang-
es in movement patterns can increase the heat transfer, resulting in an increased heat
flux into the lining. This effect can often be seen at the pot corners.
After the heat generation and liquids movement have ceased, the cooling of the bath starts.
This results in a rapid drop in temperature and superheat, an increased concentration of excess
AlF3 through ledge formation, and depending on bath acidity, reduced alumina solubility, as mod-
eled for a 3 hour voltage reduction in figure 3. On increasing the pot voltage for additional heat-
ing (left-most part of figure 3a), the superheat rises by 4 oC until the power is reduced. The bath
temperature drops from 960 oC to 920 oC in 3 hours as excess AlF3 in the remaining electrolyte in-
creases from 9 % to almost 14 % (fig. 3b). During the trial the bath level was similarly affected with
a 350 mV addition for preheating, increased anode-cathode distance as well as ledge forming pro-
cess. On cooling the electrical resistance of the bath increased by about 20 % (fig. 3c), making the
pot control system to lower the anode-cathode distance to maintain the pot voltage after power-
up. This points to some measures for avoiding or reducing anode effects during restart [6].
Fig. 1. The development of bath temperature,
liquidus temperature and superheat during
and after a 1 hour shutdown (redrawn from
Stam and Schaafsma [5])
Fig. 2. Measured bath temperature response
to full power loss for a period of 3 hours on
a 240 kA cell (redrawn from Dupuis et al. [6])

301
The Second International Congress «Non-Ferrous Metals – 2010», September 2–4, Krasnoyarsk, RussiaThe Second International Congress «Non-Ferrous Metals – 2010», September 2–4, Krasnoyarsk, Russia • Part VI • Aluminium Reduction Technology• Part VI • Aluminium Reduction Technology
The metal takes a considerably longer time to freeze, also depending on the depth of bath
and metal pad [7]. In a small prebake cell with about 1600 kg metal left, complete freezing of
the metal took about 27 hours. Anode removal after 24 hours may have had a minor influence
(fig. 4). Modeling results for a large prebake cell with about 21/2 cm of remaining bath and 71/2
cm metal showed that it took more than 24 hours for all metal to solidify, while a similar size pot
with about 20 cm bath and 36 cm metal needed more than 3 full days for the aluminium pad to
turn 100 % solid, provided that anodes would not be removed in the meantime.
Due to the large heat capacity of the S derberg anode, this type of cell can survive a pow-
er interruption for a considerable time. T rklep [8] used computer simulations to calculate the
time it would take for the metal in a 116 kA S derberg cell to freeze in the event of a complete
power cut-off. The result was 33 hours, assuming that no extra oxide cover or other insulation
against heat losses was provided.
If a power interruption is anticipated some specific steps may be taken to minimize prob-
lems and reduce the risk of freezing bath in pots [4]:
• Increased pot voltage and/or amperage prior to the event.
• Increased alumina feed control setting prior to event.
• If possible tap metal from cells.
• Increase bath levels in pots with low bath levels.
• Adjust bath chemistry to lower excess AlF3 (higher ratio).
• Increase anode cover depth.
After the power is cut the suction power of the fans to the pot gas removal system can be
reduced to lower the heat transfer from the anode tops.
If short-term power interruptions occur and/or extended power reductions should become nec-
essary there are some modifications to work practices that can be done to reduce heat losses [4]:
• Disable automatic alumina control and resistance regulation.
• Stop changing anodes.
• Inspect and manually cover open holes in pots.
• Reduce fan suction.
• Stop forced cooling of cathode sides (where they exist).
• Close basement shutters (where they exist).
• Kill anode effects as soon as possible.
• Select a group of pots to stop (if necessary) in order to provide sufficient power to
remaining majority of pots.
Fig. 3. Modeled responses of pot operation parame-
ters during a 3 hours power curtailment and restart.
a) Pot voltage, bath temperature and superheat.
The pot is given some extra voltage (about 30 min-
utes into the timeline) to increase bath tempera-
ture in anticipation of shutdown. b) Concentration
of excess AlF3 and alumina. c) Bath level and bath
resistance (redrawn from Dupuis et al. [6])
Fig. 4. Aluminium temperatures measured in a cell
after shutdown. The intersection of metal freezing
and removal of anodes was coincidental (redrawn
from Lalonde et al. [7])
302
The Second International Congress «Non-Ferrous Metals – 2010», September 2–4, Krasnoyarsk, RussiaThe Second International Congress «Non-Ferrous Metals – 2010», September 2–4, Krasnoyarsk, Russia • Part VI • Aluminium Reduction Technology• Part VI • Aluminium Reduction Technology
Damage of Cooled Pots
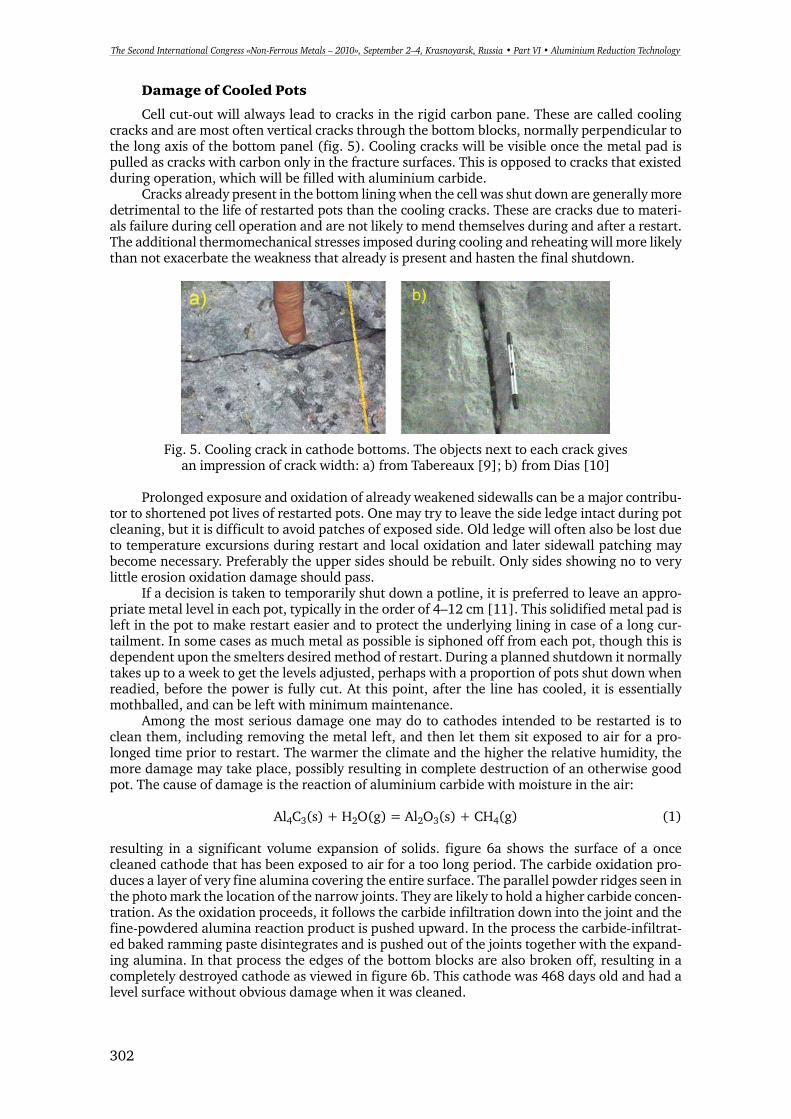
Cell cut-out will always lead to cracks in the rigid carbon pane. These are called cooling
cracks and are most often vertical cracks through the bottom blocks, normally perpendicular to
the long axis of the bottom panel (fig. 5). Cooling cracks will be visible once the metal pad is
pulled as cracks with carbon only in the fracture surfaces. This is opposed to cracks that existed
during operation, which will be filled with aluminium carbide.
Cracks already present in the bottom lining when the cell was shut down are generally more
detrimental to the life of restarted pots than the cooling cracks. These are cracks due to materi-
als failure during cell operation and are not likely to mend themselves during and after a restart.
The additional thermomechanical stresses imposed during cooling and reheating will more likely
than not exacerbate the weakness that already is present and hasten the final shutdown.
Fig. 5. Cooling crack in cathode bottoms. The objects next to each crack gives
an impression of crack width: a) from Tabereaux [9]; b) from Dias [10]
Prolonged exposure and oxidation of already weakened sidewalls can be a major contribu-
tor to shortened pot lives of restarted pots. One may try to leave the side ledge intact during pot
cleaning, but it is difficult to avoid patches of exposed side. Old ledge will often also be lost due
to temperature excursions during restart and local oxidation and later sidewall patching may
become necessary. Preferably the upper sides should be rebuilt. Only sides showing no to very
little erosion oxidation damage should pass.
If a decision is taken to temporarily shut down a potline, it is preferred to leave an appro-
priate metal level in each pot, typically in the order of 4–12 cm [11]. This solidified metal pad is
left in the pot to make restart easier and to protect the underlying lining in case of a long cur-
tailment. In some cases as much metal as possible is siphoned off from each pot, though this is
dependent upon the smelters desired method of restart. During a planned shutdown it normally
takes up to a week to get the levels adjusted, perhaps with a proportion of pots shut down when
readied, before the power is fully cut. At this point, after the line has cooled, it is essentially
mothballed, and can be left with minimum maintenance.
Among the most serious damage one may do to cathodes intended to be restarted is to
clean them, including removing the metal left, and then let them sit exposed to air for a pro-
longed time prior to restart. The warmer the climate and the higher the relative humidity, the
more damage may take place, possibly resulting in complete destruction of an otherwise good
pot. The cause of damage is the reaction of aluminium carbide with moisture in the air:
Al4C3(s) + H2O(g) = Al2O3(s) + CH4(g) (1)
resulting in a significant volume expansion of solids. figure 6a shows the surface of a once
cleaned cathode that has been exposed to air for a too long period. The carbide oxidation pro-
duces a layer of very fine alumina covering the entire surface. The parallel powder ridges seen in
the photo mark the location of the narrow joints. They are likely to hold a higher carbide concen-
tration. As the oxidation proceeds, it follows the carbide infiltration down into the joint and the
fine-powdered alumina reaction product is pushed upward. In the process the carbide-infiltrat-
ed baked ramming paste disintegrates and is pushed out of the joints together with the expand-
ing alumina. In that process the edges of the bottom blocks are also broken off, resulting in a
completely destroyed cathode as viewed in figure 6b. This cathode was 468 days old and had a
level surface without obvious damage when it was cleaned.

303
The Second International Congress «Non-Ferrous Metals – 2010», September 2–4, Krasnoyarsk, RussiaThe Second International Congress «Non-Ferrous Metals – 2010», September 2–4, Krasnoyarsk, Russia • Part VI • Aluminium Reduction Technology• Part VI • Aluminium Reduction Technology
а b
Fig. 6. The result of exposing a cleaned cathode surface to air: a) Alumina powder formed
by reaction between aluminium carbide and moist air. The ridges are reaction products
being pushed up from the narrow joints. b) A view of the same cathode surface after most
of the powder has been removed. The cathode was 468 days old when it was stopped
Loss of Pot Life
A pot cutout and subsequent restart will almost always lead to some damage to the lining
and can, on the average, decrease the otherwise obtainable pot life with up to several hundred
days. Driscoll [11] assumes a loss in life expectancy of 50–150 days for each individual pot fol-
lowing a line restart. Older pots with less than 10 % of expected life remaining will often not be
restarted, with newly lined cathodes taking their place. This will include at least 5–10 % of the
population in a line (perhaps as much as 40 %), requiring extra effort on the part of the potlining
crew to prepare a line for restart. Welch and Grjotheim [1] found that cells only continued to
operate from 400 to 580 days after a restart. Based on pot age at restart, cathode design and cell
operational practice, the pot life expectancy can be both longer or shorter. The pot life can suffer
badly if several shutdowns are experienced. According to Rao [2], the average pot life was re-
duced with 17 months and the average cathodic voltage drop increased from 11 to 16 mV, when
the number of restarts was increased from one to two for a given potline. Each restart resulted in
a drop in current efficiency of 1–2 % which could not be pin-pointed to any particular cause. By
taking into account the condition and age of each individual cell and estimation of the average
reduction in pot life for a particular cell design, it should be possible to calculate whether or
not it is economically feasible to restart a given pot.
Another way of assessing reduced pot life is in % of remaining life. Loss of 50–30 % of re-
maining life is probable figures. Again the loss will be dependent on how the pots are stopped.
For a total of 16 different potlines of 10 different prebake smelters Tabereaux [9] reported
an average loss in pot life due to shutdown and restart of 279 days with a typical variation from
100 to 400 days depending on specific circumstances particular to each smelter. Some of the
major factors that influenced pot life were pot age distribution, cathode sidewall and bottom
block materials, pot operational conditions prior to shutdown, cell restart methods and potline
startup amperage. The loss in pot life distribution emerged as follows:
• A low loss in pot life (100–200 days) and low number of premature failures (0–2 %)
were obtained in potlines that had a low to normal age distribution of cells, controlled
shutdown, slow restart practices and control of pot temperatures after the restart.
• An average loss in pot life (200–300 days) and normal number of premature failures
(2.5–5 %) were obtained in potlines that had a normal pot age distribution, controlled
shutdown, improved restart practices and good control of pot temperatures after
restart.
• A high loss in pot life (300–400 days) and a high number of premature failures (>5 %)
were obtained with potlines that had one or more of the following:
High pot age distribution.
Long extended cooling periods prior to shutdown.
Uncontrolled shutdown.
Rapid restart practices with marginal control of pot temperatures after restart.

304
The Second International Congress «Non-Ferrous Metals – 2010», September 2–4, Krasnoyarsk, RussiaThe Second International Congress «Non-Ferrous Metals – 2010», September 2–4, Krasnoyarsk, Russia • Part VI • Aluminium Reduction Technology• Part VI • Aluminium Reduction Technology
Summary Reports on Shutdown and Restart
ALBRAS 2002, [10]
• Cells covered with electrolyte during stop.
• Cell were cleaned, checked and patched before start-up.
• Covered with a plastic sheet after cleaning to hinder oxidation.
• Some oxidation was however observed. It had probably been better to cover the cell with
solidified aluminium during the stop.
• Due to capacity reasons
1. Cold restart. Use of hot butts and addition of hot bath (cold anodes cracked).
2. Hot restart. Use of preheating devices and/or shunt.
• Faced some operational difficulties: Joint failure, high burn-off rate, anode cracking and
hot pots.
ALUMAR 2003, [12]
• Rectifier blow-up and fire affected 247 pots.
• All anodes were raised above bath level.
• Some pots were tapped, some not.
• Anode and superstructure were removed and bath removed. Tried to keep the side ledge.
• Butts selection was critical. Discharged all butts older than 22 days or with cracks.
• The anode sidewall channel was filled with crushed bath to protect sidelining and give
heat insulation.
• Start-up by the crash method, i. e. the bridges were lowered until contact with the solid
metal pad, liquid bath poured in and the current cut in.
• The ACD during restart was kept higher to melt the metal pad and heat the cathode.
• Enough bath should be poured in to allow the higher ACD.
• No liquid metal should be added with the bath.
• A lowering of the line load may be necessary if the number of anode effect got high.
• Increase of metal pad depth may help with ledge formation and pot stability.
• Additional liquid metal should not be added before the bath is completely melted.
• Keep the bath ratio above target to compensate for sodium absorption.
• Alumina feed is turned on when pot noise reaches a low level.
• The restart of the 247 pots took 32 days. (Shorter than first anticipated).
TRIMET 2007, [13]
• The Hamburg plant was shut down in 2005 and
restarted by Trimet in 2007.
• Metal and bath that could not be tapped was left in
the pot. This proved to be an excellent protection
for the mothballed cathode.
• The first pot was started dry using coke bed and
with a lot of difficulties.
• Cryolite and temperature of 1150 oC was chosen.
Cryolite contains much less Al2O3 than crushed
bath and anode effect started much faster.
• After 3 pots were started. One pot a day was started
with a mixture of coke bed and flame preheating.
• From the 8 th pot on, two pots a day were started.
• A special feature was cooling of the bimetal joint to avoid burn-off.
ELKEM Aluminium, Mosj en, 1982 [14]
• An arctic hurricane hit and line II lost power for 7.5 hours and 1/3 power for an additional
6 1/2 hours. Auxilary power was available.
• The anodes were lowered into the metal pad and covered with extra crushed bath. The gas
cleaning system was run on 1/3 capacity.
• A hole in the frozen bath was chiseled out in the middle of the aisle side for inspection and
possible bath addition.
• The pots were on normal load and 1.5–2 volts with anodes in the metal pad. Temperature
875–925 oC.
• The anode was lifted to the top of the metal pad to give 4–7 volts and left for preheating
for 6–8 hours.
Fig. 7. Cooling device for the bime-
tallic connection installed on an
anode during dry start (from [97])

305
The Second International Congress «Non-Ferrous Metals – 2010», September 2–4, Krasnoyarsk, RussiaThe Second International Congress «Non-Ferrous Metals – 2010», September 2–4, Krasnoyarsk, Russia • Part VI • Aluminium Reduction Technology• Part VI • Aluminium Reduction Technology
• The anode was lifted further to give an unstable voltage of 5–30 volts.
• Bath started to melt out from the sides, and after some bath production the voltage
stabilized at 15–25 V.
• After 1 hour sufficient bath had melted and the cell was operated with wooden poles.
The voltage dropped to 7–9 volts.
• The pot was operated manually for 12–16 hours and then set to «auto» with a set point
3 mΩ higher than normal for 24 hours.
• Two days after restart the average bath temperature was ≈ 1010 oC and went down to
normal 1 week after restart.
• The cryolite ratio was stabilized after 2 weeks.
• Two pots were lost in the end of the month probably due to the accident. No anode problems
were encountered.
RUSAL NOVOKUZNETSK, 2009 [15]
• Two properly functioning 140 kA vs. S
derberg pots were stopped (age 33.8 and
32.1 months.
• The cathode surface was cleaned by increase
of the cryolite ratio and temperature.
• Metal was tapped to two levels, A: 3–5 cm, B:
17–19 cm.
• As much bath as possible was siphoned off
by temporarily lowering the anode into the
metal.
• The anode was raised out of the molten
aluminium after all bath had solidified.
• The cell was left for 20 days for complete
cooling.
• The pots were resistance preheated on liquid
aluminium.
• When all the metal had been added the
current load was gradually restored, reaching
the nominal value in 80 minutes for pot A and
50 minutes for pot B (fig. 8).
• The ramp-up speed was determined by the
time it took to reach maximum pot voltage.
• Cryolite was added to the side channels to
reduce heat loss.
• Both pots were preheated for three days with metal temperatures reaching 855 oC in pot A
and 893 oC in pot B. The cells were then started by adding bath and raising the anodes.
Pot Repair
Complete relining or partial repair of failed pots is an economic decision that has to be taken
on a case to case basis. The extent of the damage and the age of the pot are important parameters.
A repair that presupposes a complete cell shut-down and subsequent cooling of the cathode will
reduce the pot life with several hundred days. This will therefore be uneconomical for cathodes
above a certain age. If the repair can be performed without a major interruption in production
or metal quality, it is generally performed regardless of cell age. Most cathode failures, however,
are so extensive that it is neither technically nor economically feasible to do anything but a full
pot relining.
Among the failures that sometimes can be subject to temporary repairs without a major in-
terruption in production are bath tap-out through the sidewall, metal leak through a collector
bar and sudden iron contamination caused by pothole formation.
Red-hot sides, often followed by bath tap-outs through the sidewall, are generally caused
by air oxidation of the sidewall carbon. A local failure generally can be repaired by temporarily
reduction of the bath level in the pot, cleaning the failure area and tamping cold or hot ramming
paste towards the steel side. Sometimes a hole has to be cut through the deckplate to accommo-
date this. The cathode life can in some instances be extended several years by this repair meth-
od, until finally the entire sidewall lining and steel shell have reached an irreparable condition.
Fig. 8. Current ramp-up and voltage re-
sponses during the first couple of hours
preheat of S derberg cells on metal:
a) Pot A with only 3.5 cm of frozen un-
tapped metal left; b) Pot B with 17–19 cm
of frozen untapped metal left (redrawn
from Buzunov et al. [15])

306
The Second International Congress «Non-Ferrous Metals – 2010», September 2–4, Krasnoyarsk, RussiaThe Second International Congress «Non-Ferrous Metals – 2010», September 2–4, Krasnoyarsk, Russia • Part VI • Aluminium Reduction Technology• Part VI • Aluminium Reduction Technology
Red sides alone are no reason to cut the pot. Cool the affected area by air pipes but determine
the root cause of the problem.
If the cause of metal tap-out through a collector bar can be localized to a crack or pothole
through the carbon lining near to the bar, it might be possible to seal it by packing the pot-
hole/crack with lump or flake (recrystallized) alumina. The strap to that particular current col-
lector bar may have to be cut in order to reduce the temperature and current density in the failed
area and let the alumina-cryolite form hard sludge that may seal the crack. If the tapout is due
to a specific block failure and not from collector bar exposure from general bottom wear caused
by old age, the pot can be cut and repaired by removing a few blocks, or in some instances only
part of a block. Core drilling around the damage area will make it possible to remove a part of
the bottom carbon lining without disturbing the remaining too much.
Local bottom surface wear under the tap-hole can be repaired in the same way by filling up
the depression with recrystallized alumina. However, the tapping has to be moved to another
location, which can be impossible in some cell designs. Otherwise it will be impossible to form a
stable alumina-bottom sludge protective cover.
If iron contaminates the aluminium through a greater number of minor cracks, which some-
times are formed in the peripheral paste seam due to excessive paste shrinkage, the metal con-
tamination may sometimes be kept at an acceptable level for some period by breaking the top crust
along the sides of the cell. If this procedure is repeated at regular intervals, a ledge of frozen bath
and alumina may cover the lower side and bottom periphery and help seal off the failed areas.
Once serious metal infiltration through the ring joint followed by bottom heave has oc-
curred further cathode deterioration is impossible to stop. The cell will have to be cut when
the iron contamination reaches an unacceptable level or the pot no longer can be operated due
to excessive noise or instability.
If the cell has to be shut down due to a local damage in a bottom block or the peripheral
paste seam, the full extent of the damage should be accessed before the decision to repair or
not is taken. This will often imply the removal of a section of the bottom lining. If the cell age is
low and the damage only local, it may be worthwhile economically to replace the failed block
(s) or repair the border. If there has been a metal tap-out through a collector bar and only the
border is repaired, the strap to the failed collector bar should be cut in order to reduce the pos-
sibilities of a new tap-out at this weak spot.
REFERENCES
1. B. J. Welch and K. Grjotheim, Light Metals (1988) 613.
2. A. N. Rao, Proc. Int. Conf. Aluminium (INCAL), New Dehli, India (1985) 151.
3. A. R. Kjar and J. T. Keniry, Reducing the impact of power supply interruptions on pot-
room operations, Proc. 9th Australasian Aluminium Smelting Technology Conf., Terrigal, NSW,
Australia (2007).
4. A. Tabereaux, Mechanism for the Formation of Cathode «Cooling» Cracks, TMS Short
Course «Shutdown and Restart of Potlines», Seattle, WA (2010).
5. M. A. Stam and J. Schaafsma, The impact of power modulation on the cell dynamics,
Proc. 9th Australasian Aluminium Smelting Technology Conf., Terrigal, NSW, Australia (2007).
6. M. Dupuis, I. Eick and F. Waldmann, Modeling thermal dynamic response to a 3-hour
total power shutdown event, Proc. 9th Australasian Aluminium Smelting Technology Conf., Ter-
rigal, NSW, Australia (2007).
7. K.F. Lalonde, W. Cotten and R. M. Beeler, Light Metals (2006) 291.
8. K. T rklep, Paper presented at 118th TMS Ann.Meet., Las Vegas, NV, 1989.
9. A. Tabereaux, Light Metals (2010) 1039.
10. H. P. Dias, Light Metals (2004) 227.
11. K. J. Driscoll, Light Metals (1996) 305.
12. A. Borim, E. Batista, E. Bessa and S. Matos, Light Metals (2005) 337.
13. T. Reek, J. Prepeneit and D. Eisma, Light Metals (2008) 461.
14. S. Brekke 1st International Course on Process Metallurgy of Aluminium, Trondheim,
Norway, 1982
15. Ya.Buzunov, V. I. Borisov, Ye. g.Masyutin, D. G. Bolshakov and A. A. Pinayev, Light Met-als (2010) In print.

307
The Second International Congress «Non-Ferrous Metals – 2010», September 2–4, Krasnoyarsk, RussiaThe Second International Congress «Non-Ferrous Metals – 2010», September 2–4, Krasnoyarsk, Russia • Part VI • Aluminium Reduction Technology• Part VI • Aluminium Reduction Technology
Abstract
Excepting for the very latest greenfield smelters, today virtually all smelters are operating
with design, control and operating conditions that are substantially different to those under which
they were started. Sometimes the work practices and automatic adjustments can control strategy
that is inbuilt into the original system deviate from the comfort zone that gives good performance.
For example most smelters have had an increase in anode effect frequency, and hence the carbon
dioxide footprint, with increased amperage unless there are changes made to control and operat-
ing strategy. The differences in original design plus approaches to increase productivity make it
difficult to simply compare situations between different potline’s. This paper describes some suc-
cesses in reducing both the carbon dioxide footprint of smelters and the unit electrical energy
consumption through a reappraisal of control and work practices based on core fundamentals.
Introduction
Aluminium smelting has developed in stages, with each spurt being associated with a tech-
nology breakthrough. Some important stages include, the advent of is Soderberg technology to
reduce the capital cost, the increase in cell sizes into the 80 to 100 kA band, then an associated
swing back to pre-bake anode is but incorporating mechanical alumina feeding devices, change
to side-by-side configuration with better control of magnetic fields enabling cells in the 150 to
200 kA range. At that stage the new cellstechnologies incorporated automatically controlled
alumina feeding system and computer management of cell voltage. The final stage in the last
quarter centuryhas been progressively larger cell technology designed by mathematical models
and incorporating more sophisticated alumina feeding devices with control logic based on a
combination of fundamental knowledge and typical cell behaviour.
The energy efficiency, productivity, and manpower demands of each technology type has
steadily improved, but the capital costs has also risen because of the need for more sophisticated
support machinery, and the need to meet more stringent environmental standards.
During all the stages of development the materials of construction have improved, and
consequently the operating lifespan of smelters has expanded from 2 to 3 decades, to more than
60 years. Thus while the older smelters have a capital cost advantage, they invariably have pro-
ductivity and efficiency challenges countering this. Consequently there has been a strong eco-
nomic driving force to increase productivity, and retrofit appropriate design or control advances
when economic. No operating smelter exists today that is more than 30 years old, and has the
original design and operating parameters. Nor does the smelter of that vintage exist that has all
the modern features and service equipment!
Design, operating conditions, and performanceThe performance of smelting cells [1] is dependent on:
• the basic cell design (including the modified design);
• the operating parameters around which the cell control is based;
• the quality of work practices, and minimise deviations (either spatially or temporally)
within the cell;
• the quality of the materials used (especially alumina and baked anode carbon).
COMBINING INDUSTRIAL ENGINEERING WITH FUNDAMENTALS TO IMPROVE OPERATING
AND CONTROL PRACTICES FOR CELLS WITH INCREASED OPERATING AMPERAGE
B.J. Welch 1, A. Alzaroni 2
1 Welbank consulting Ltd, New Zealand,School of Chemical Sciences and Engineering,
University of New South Wales, Australia2 Dubai aluminium, UAE

308
The Second International Congress «Non-Ferrous Metals – 2010», September 2–4, Krasnoyarsk, RussiaThe Second International Congress «Non-Ferrous Metals – 2010», September 2–4, Krasnoyarsk, Russia • Part VI • Aluminium Reduction Technology• Part VI • Aluminium Reduction Technology
Directly linked with the performance is the cell heat balance [2]. Heat loss from a cell is
design dependent and the overall magnitude has very little link with cell productivity. Each cell
requires a certain minimum extra heat to maintain the electrolyte liquid and provide both the
alumina and gross carbon preheat energy as well as the driving force for alumina dissolution.
The excess heat (as reflected by the superheat value), is constrained by the need to maintain
frozen electrolyte around the peripheries of the cell to prevent leakage and rapid deterioration
and failure. Thus the heat balance provides constraints that can impact performance as produc-
tivity is changed.
• Cell voltage, line current and current efficiency all impact the heat generation, and since both the current efficiency and voltage are dependent on anode to cathode distance, there is an immediate challenge for optimising performance with a line current increase.
– The historical approach for maximizing current efficiency has been aimed at reducing the aluminium solubility and lowering the mass transfer rate of the dissolved metal to the anode gas zone where it is reoxidised. This led to an emphasis on maintaining an adequate lowering operating temperature and increasing aluminium fluoride concentration, having an adequate anode-cathode separation (ACD), and lowering interfacial velocities. The back reaction has traditionally been treated as the primary source of inefficiency.
Modern Driving Forces in Smelter Operation
The operating emphasis today focuses on four aspects which are not independent even though modern management expects changes to be made to achieve an individual outcome without other adverse effects. These four aspects are:
1. Productivity per unit cell. 2. Electrical energy efficiency. 3. Current efficiency. 4. Environmental performance.Trying to achieve the production goals in one invariably adversely impacts the others.The various changes introduced for these goals – such as increasing line current introduc-
ing larger anode’s, slotting anodes, changed anode cover quality and quantity, perhaps anode
setting pattern, moving towards more continuous alumina feeders, changing cells thermal re-
sistance, and increasing dimensions of electrode components – are well documented. However
less well documented is how they also impact the cell behavioural model or alternatively were
used in setting up the earlier control parameters.
Increasing ProductivityThis is primarily done through increasing line current, but it immediately runs into conflict
with either the cell heat balance, or the ACD and interfacial velocity requirements unless there
are design modifications. However it also brings in new issues – alumina solubility [3, 4], anode
setting [5], control settings and mechanical reliability of equipment- because of the accelerated
consumption rate of materials.
Improving Energy EfficiencyCell voltage is the main driver for energy efficiency and therefore gains require reduc-
tions in the cell’sohmic resistance by design modifications to individual components. The most
common approaches for reducing the resistance include [6]:
• Using graphitised cathode blocks because of the superior electrical conductivity.
• Increasing the dimensions and changingmaterials of the cathode collector bars to reduce cathode resistance.
• Larger anode stubs and inserting them deeper in the anodes has been successful in reducing the contact resistance and overall anode resistance.
• A larger cross sectional area of anodes to lower the effective resistivity.
• Reducing the average volume of anode gas in the ACD by slotting anodes.
• Reducing the electrolyte resistance by minimizing ACD through work practice optimization and better control.
• Adding extra leaves/increasing cross section area of interconnecting bus-bars.

309
The Second International Congress «Non-Ferrous Metals – 2010», September 2–4, Krasnoyarsk, RussiaThe Second International Congress «Non-Ferrous Metals – 2010», September 2–4, Krasnoyarsk, Russia • Part VI • Aluminium Reduction Technology• Part VI • Aluminium Reduction Technology
Improving Current EfficiencyDissolution and mass transfer of dissolved metal has been substantially reduced by a com-
bination of electrolyte composition (all additives), temperature, and magnetic field control.
However at higher line currents with the necessary lower ACD’s, short circuiting through spikes
and protrusions has become the dominant mechanism of efficiency loss, and therefore the gains
can only be achieved by:
• minimizing the chance of shorting (by anode setting and other work practice, control around the set, and carbon dust minimization);
• early detection of poor performing cells;
• eliminating the causes of metal pad instability.
Improving Environmental PerformanceThe main contributors to the high carbon dioxide equivalent emissions in smelter cells are:
• the high anode effect frequency (AEF);
• the duration of anode effects (AED);
• and the excessive airburn of the carbon anodes.
Whilst it is well known anode effects occur at a critical current density, the alumina con-
centration at which it occurs is also dependent on current density as well as temperature and
excess aluminium fluoride concentrations. Thuschanging design or operating conditions in the
cell will impact the alumina concentration and speed with which the operating limit is reached.
It is also important to recognize some of the design changes made to reduce resistance – such as
ACD, anode cross sectional area and electrolyte conditions – also impact alumina dissolution [4]
(and hence replenishment) so increasing current density makes cells more prone to anode ef-
fects unless control changes are made.
Ultimately reducing AEF and AED relies on
• maximizing alumina solubility conditions;
• better control logic to give more timely detection of the approach to the concentration limit;
• reliable work practices.So too does the improvements to Current efficiency, and energy efficiency as line cur-
rent is increased.
Summary of impact of Changes made for higher productivityPrimarily through larger anodes (both mass and cross sectional area), reduced ACD, and
narrower centre channel:
• The electrolyte volume/kA is dramatically reduced,
the rate of change in alumina concentration through electrolysis becomes greater
than that due to current alone. (Control changes needed!).
• The volume of electrolyte in the alumina feeding zone is reduced, making the alumina
and crust dissolution more critical.
But the average feed and dissolution rate required increases so dissolution conditions
– including heat transfer – are more critical. (Cell Condition changes needed!).
• The larger newly set anodes have a higher heat demand for preheat and to melt the
freeze initially formed underneath on setting so pre-heat rate slower.
But the average consumption rate and hence beam movement rate also often in-
crease thus reducing the time available for newly set anodes to melt the bath-carbon
dust matrix under the anode. (Changes to anode setting practices needed. Also
greater account needs to be taken of spatial and temporal properties!).
• The reduced anode to cathode distance at higher current intensities – in order to main-
tain heat balance – makes the cells more sensitive to current distribution, leading to a
higher probability of short-circuiting [1, 5].
this changes the most probable cause of temperature cycling and cell noise pattern.
(Different diagnostics and work practices needed!).

310
The Second International Congress «Non-Ferrous Metals – 2010», September 2–4, Krasnoyarsk, RussiaThe Second International Congress «Non-Ferrous Metals – 2010», September 2–4, Krasnoyarsk, Russia • Part VI • Aluminium Reduction Technology• Part VI • Aluminium Reduction Technology
Building on the fundamentals.
Solving each of these issues relies on a deep understanding of the science and physics and
the detailed explanation is too extensive for this paper. Most problems initiate from anode change,
and these are linked to crust and alumina dissolution – so these will be discussed. A low AEF is linked with good performance and therefore this property is used to illustrate many of the improve-ments achieved.
Alumina and crust DissolutionObtaining quantitative dissolution of alumina is fundamental to good feed modulation
control.
Because of the adding methodology, there
are two stages – preheating the cold powder
and dissolving. The preheat of the cold alumina
typically requires between 0.25 and 0.3 kWh/kg
Al. The Enthalpy of dissolution requires a simi-
lar amount of heat. This combination can be
rate limiting in itself, especially if the powder
clumps and aggregates.
For a typical operating cell the non-process
heat generation rate in the bath (redof figure 1) is
12 to 15 kW/m 2. At 100 % feed rate, the preheat &
dissolution energy demand (blue)for a 20 cm
channel width is between 45 and 55 kW/m 2.
However this is concentrated in electrolyte near
the feeder – hence we get strong energy gradi-
ents, emphasising the importance of centre chan-
nel electrolyte volume, good mixing and the need for increased superheat at higher production
rates. The risk of sludge formation increases – actually a limited amount cannot be avoided, but you
need to minimize it so that it can back-feed!
There are two commonly used endothermic dissolution reactions [7].
Na3AlF6 (l) + 2Al2O3 (s) ↔ 3Na2AlO2F4 (dissolved) (1)
and
4Na3AlF6 (l)+ Al2O3 (s) ↔ Na2Al2OF6 (dissolved) + 6NaF (l) (2)
and the kinetics of dissolution by either reaction can be expressed by the rate equation of
Thonstad, Johansen and Kristensen [3].
Rate of Dissolution = k (CAl2O3, saturated – CAl2O3, electrolyte), (3)
where, in the operating electrolyte the pseudo rate constant k is dependent on the electrolyte
(AlF 63–
) composition, interfacial contact area, and stirring or interfacial mass transfer of materi-
als involved in the dissolution process. The saturation solubility,CAl2O3, saturated, decreases as the
AlF3 concentration in the electrolyte is raised or the temperature lowered. Low average alumina
concentrations and avoiding high AlF3 concentrations help dissolution. Interfacial mass trans-
Fig. 1. A scaled representation
of the thermal energy demand/utilization
in a cross-section of a cell
Fig. 2. Increase in AEF with line current
without adjusting for better solubility
Fig. 3. The tendency to have AE’s through
energy deficiency following anode change

311
The Second International Congress «Non-Ferrous Metals – 2010», September 2–4, Krasnoyarsk, RussiaThe Second International Congress «Non-Ferrous Metals – 2010», September 2–4, Krasnoyarsk, Russia • Part VI • Aluminium Reduction Technology• Part VI • Aluminium Reduction Technology
fer is important for transport of the cryolitic anion to the alumina surface, and transfer of the
dissolved oxy-fluoride product away.
A detailed analysis of smelter data for AE’s emphasises the importance of the need for
greater attention to alumina solubilityand heat transfer.
Other analyses confirmed the importance of the dissolution rate since increases in AEF
were clearly evident for low temperature and high AlF3 concentrations.
While the decrease in available heat, coupled with higher current densities explains the
trends of figure 3, the impact of the additional crust from the work practices can also be a con-
tributor. Hence attention to other variables that impact the amount of crust and sludge formed
has also been given. This includes coupled parameters such as metal and bath height – which im-
pact the ability to transfer the alumina to the bath.
Figure 4 shows that while there are other situations influencing the onset of AE’s, there is
a need to optimize the metal level because it hinders back feeding of sludge, bath level for good
flow, mixing and concentration swings, and probably the combined height. The latter to ensure
good open feeder holes.
As a flow on from the basics of alumina and sludge dissolution, the following changes have
also been found to be beneficial:
• the chemistry and temperature control algorithm altered from a target to a band to minimizes the chance of low temperatures and high AlF3 concentrations (including taking into account
the impact of spatial and temporal effects on measured values);
• the amount of anode cover that can be spilt into the bath is minimized by changed work
practices (8) and composition [9, 10];
• the operating superheat is towards the upper end of the safe level for good dissolution.
the anode slots are designed to maximize bath flow and mixing in the centre channel;
• Greater attention is given to detecting mechanical and wear problems of feeder systems [10].
Even with these changes dissolution can continue as a problem and then it also becomes
desirable to reduce the relative overfeed rate. Preliminary studies showed that at very fast addi-
tion rates the deficit of heat in the feeding zone tended to form sludge, negating the objective.
Fig. 4. Minimizing impact of electrolyte
and Metal heights on alumina feeding
Fig. 5. Showing a stable cell
is a good feeding cell!
Fig. 6. Showing importance of Temperature, AlF3 concentration (above) and line current

312
The Second International Congress «Non-Ferrous Metals – 2010», September 2–4, Krasnoyarsk, RussiaThe Second International Congress «Non-Ferrous Metals – 2010», September 2–4, Krasnoyarsk, Russia • Part VI • Aluminium Reduction Technology• Part VI • Aluminium Reduction Technology
Modification to Feed Modulation and ControlEnhanced control systems that enable calculation and detection of voltage changes quicker
have led to significant improvements. However for older computer control systems that are un-
able to process data rapidly there is a need to reduce the magnitude of the increase in voltage (or
resistance) and to have less dependence on the slope in order to effect better detection.
Reducing the percent overfeed is one way of minimizing the impact of the thermal energy
demand on alumina solubility.Besides reducing the magnitude of the voltage rise (or adjusting
the resistance change accordingly), it is sometimes found to be beneficial to have a base feed for a
period of time (in order to allow the dissolution to catch up) and to have multi levels of underfeed.
The multi levels of underfeed with more extended time limits, ensures the sludge formed during
such work practices as anode change and beam movements has enough time to back feed.
Table 1
An example of a successful Modified Feed logic For a potline
Window Original
Feed rate %
Comment Modified
Feed rate %
Comment
Super fast 400 % 2 minutes 333 Only one shot/feeder
Over feed 150 % Duration
30 Minutes.
129 reduce to 126 % duration
extended
Base feed 100 % Duration
30 Minutes.
100
Under feed 50 % Limit 120 Minutes 64
ΔR 0.20 0.18 Subsequently reduced to 0.16
Slope 8 7
As a consequence of these changes the AEF was reduced by 41.5 %.
Improved Anode setting practiceThe newly set anodes used in cells operating at high line currents preheat at a slower rate
because of a combination of the increased cross sectional area, the increased carbon mass, and
the fact that the heat generation under the anode (refer Figure 1) cannot be increased signifi-
cantly because of the need to maintain heat balance. The melt back of the freeze is also reduced
because the reduced inter electrode distance lowers the cross sectional area for dissolution of
the cryolite rich freeze that has been formed under the anode. Consequently the changed op-
erating current density within the cell following the anode change extends over a longer time.
As a flow on, having a base feed time as was commonly practiced for a period after the anode
change, can be dangerous and therefore a shift in the feeding and control sequence during the
period immediately after an anode change is necessary.
Because carbon dust retards the melt back of the freeze more precise work practices and
better carbon skimming also becomes mandatory for a successful anode change. The most ef-
ficient way of removing carbon dust from a cell is to allow it to be lifted out by the anode gases
and burnt as it is transported to the duct. This necessitates keeping feeder holes open. Thus elec-
trolyte and metal pad height control becomes important in order to ensure feeder holes remain
open – the benefits are demonstrated in figure 4.
With the reduced inter-electrode distance anode re-referencing practice is also beneficial.
Rather than working on an individual anode current draw however, this needs to be done based
on the current distribution within the cell and also at a time (typically 48 hours) after the anode
set but before the next scheduled change. This helps minimise the risk of spike formation.
Another desirable change is to increase the duration with which additional voltage is ap-
plied (it being applied to maintain anode to cathode distance because of the increased cell re-
sistance when the anode is not drawing full current).The extra voltage is extended further as
seen in the following example. However the feed control logic needs to then operate in the nor-
mal manner but with modifications to allow for the slope in the reduction of the resistance.
The following figure illustrates a successful improvement to the anode setting control.

313
The Second International Congress «Non-Ferrous Metals – 2010», September 2–4, Krasnoyarsk, RussiaThe Second International Congress «Non-Ferrous Metals – 2010», September 2–4, Krasnoyarsk, Russia • Part VI • Aluminium Reduction Technology• Part VI • Aluminium Reduction Technology
Fig. 7. Changed anode setting to enhance alumina and sludge dissolution
and maintain cell performance;
Other Performance Improvement PracticesReduction in airburn has been achieved by using a blend of crushed electrolyte and alu-
mina as the anode cover material. With the interaction of this mixture with the sodium tetra
fluoraluminate vapours, partial sintering occurs preventing ingress of air. While the crust can
shrink away from the anode, it fuses and entraps a carbon monoxide atmosphere that prevents
carbon consumption. However this is also dependent on the quality of the anodes being main-
tained to a high level with low differential reactivity.
Reducing Anode Effect DurationNavarro et al [12] has shown that the duration can be reduced by more rapid response and
with a more aggressive beam movement once the underfeed termination limit signal is given.
Essentially he uses a cell noise signal to indicate when the beam movement has been sufficient
to accelerate the mixing and dissolution. In our study, with different hardware will use a slightly
different approach but the same philosophy.
At the start of this improvement programme the average AED was 29 seconds.
By following principles while working within the constraints of installed hardware the av-
erage AED has been reduced to 19 seconds.
Productivity Increase and Key Performance Indicator ChangesIn 2010 Dubal is on track to increase the smelter productivity of 20,000 tons without in-
creasing the number of operating cells. In achieving this:
• The average energy consumption per ton has not increased.
• The average current efficiency is targeting to within 0.2 % of the current efficiency achieved in
the previous year.
The PFC emissions (based on anode effect frequency and anode effect duration has re-
duced by 80 %) (refer to table 2).
Table 2
Reductions Achieved in Lowering PFC Emissions
BEFORE 226 days AFTER 168 days
AE frequency (AE/pot/day) 0.2 0.05
AE duration (second) 29 19
AE voltage (volt) 17 21
PFC emission (gm/mt of Al) 15 3
These improvements can also partly be attributed to our in-house developed control sys-
tem and control logic. We found that the flexibility needed for changing setting parameters is
such that the traditional control systems with fixed parameters are less effective. They reflect
and build on other published advances [13, 14].

314
The Second International Congress «Non-Ferrous Metals – 2010», September 2–4, Krasnoyarsk, RussiaThe Second International Congress «Non-Ferrous Metals – 2010», September 2–4, Krasnoyarsk, Russia • Part VI • Aluminium Reduction Technology• Part VI • Aluminium Reduction Technology
INTEGRATING BENEFITS – the DX TECHNOLOGY
The improvements and practice changes described have been developed systematically
over the last five years. During that time the development and operation of the DX test cells was-
completed and subsequently, approximately two years ago constructed a demonstration potline
of these cells. When the R&D development and testing was completed the performance param-
eters of the Test cells were as follows:
• Line current = 340 kA.
• Current efficiency = 93.9 %.
• Energy efficiency = 13.6 DCkWh per kilogram.
• AEF = 0.20 AE per pot day.
However with the improved knowledge already development we were able to incorporate
a few minor design modifications as well as change the control logic and work practices for
the new potline. Consequently when the demonstration DX potline was started, in the first six
months it had the following performance parameters [15]:
• Line current = 344 kA.
• Current efficiency = 96 %.
• Energy Efficiency = 12.98 DC kW⋅h per kilogram.
• AEF = 0.05 AE per cell day.
• Today the DX potline is operating at:
• Line current = 370 kA.
• Current efficiency = 95.7 %.
• Energy Efficiency = 13.1 DC kW⋅h per kilogram.
• AEF = 0.020 AE per cell day.
As seen in figure 8 on only three occasions did the anode effect frequency exceed 0.1 anode
effects per cell day. In all situations where the daily anode effect frequency exceeded 0.05 there
were some power interruptions.
Fig. 8. 12 months of the Daily AEF of the Dubal DX potline
Summary and Conclusions
All the improvements discussed have been helped by combining better industrial engineer-
ing with work practices whilst adhering to sound fundamentals.
Scope exists for making better allowance for the spatial and temporal effects, which be-
come different and more important at higher line currents.
As has also been demonstrated by Navarro et al [8], modifying the work schedule between
anode change, metal tapping, beam raising and dressing becomes ways of minimizing these and
thisalso helps minimise sludge formation and obtain better feed control.
REFERENCES
1. B. J. Welch And J. T. KeniryAdvancing The Hall Heroult Electrolytic Process Light Metals 2000 P. 17.
2. Welch, B. J., «Impact of Changes in Cell Heat Balance and Operatons on the Electrolyte
Composition» in Proc 6th Australasian Aluminium Smelting Conference and Workshop, (eds M
Skyllas-Kazacos& B J Welch) Queenstown, New Zealand, pp. 191 to 204, November 1998.

315
The Second International Congress «Non-Ferrous Metals – 2010», September 2–4, Krasnoyarsk, RussiaThe Second International Congress «Non-Ferrous Metals – 2010», September 2–4, Krasnoyarsk, Russia • Part VI • Aluminium Reduction Technology• Part VI • Aluminium Reduction Technology
3. G. I. Kuschel, and B. J. Welch, «CRUST AND ALUMINA POW»DER DISSOLUTION IN AL-
UMINIUM SMELTING ELECTROLYTES»JoMVol 59 No.5 pp50 to 54 2007.
4. Marianne Jensen, KjellKalgraf, TarjeiNordb , Tor Bjarne Pedersen «ACD MEASURE-
MENT AND THEORY» Light Metals 2009 pp 455 to 459.
5. J. Thonstad, P. Johansen and E. W. Kristensen, «Some Properties of Alumina Sludge» in
TMS Light Metals 1980 pp 227–239.
6. M. P. Taylor & B. J. Welch «Future Outlook and Challenges for Smelting Aluminium»
Aluminium International Today March 2004, pp 20 to 24.
7. K. Grjotheim and B. J. Welch, «Aluminium Smelter Technology (2nd Ed.),» Aluminium-
Verlag, D sseldorf (1988).
8. Pablo Navarro, Carolina Daviou, Leandro Daurade. «ALUAR’S AL20PROJECT: A SUC-
CESSFUL WAY UP TO 200 kA», IV International Aluminium Congress, Sao Paulo, Brazil, May
18 to 20th, 2010.
9. HalldorGudmundsson «IMPROVING ANODE COVER MATERIAL QUALITY AT NORDU-
RAL – QUALITY TOOLS ANDMEASURES»Light Metals 2009 pp 467 to 472.
10. W. Kristensen, G. Hoskuldsson, and O. Jonsson, «Reducing Anode Effect Frequency by
Changed Operating Practices and Control Strategies,» Proc. 8th Aust. Aluminum Smelting Conf., ed. M. Skyllas-Kazacos (Sydney, NSW, Australia: University of New South Wales, 2004).
11. Ali H. Mohammed, A. Kumar, and B. J. Welch, «Alumina Dump Weight Variation in Reduc-
tion Cells and the Occurrence of Anode Effects,» Proc. 9th Aust. Aluminum Smelting Conf., ed. M. Skyl-
las-Kazacos (Sydney, NSW, Australia: University of New South Wales, 2007), pp. 33–42.
12. P. Navarro, G. Gregoric, O. Cobo, and A. Calandra, «A New Anode Effect Quenching
Procedure», Light Metals, 2003.
13. W. E. Kristensen, G. Hoskuldsson, and B. J. Welch, «Potline Start-up with Low Anode
Effect Frequency», Light Metals 2007, ed. M Sorlie (Warrendale, PA: TMS, 2007), pp. 411–416.
14. Barry Welch, Martin Iffert, and Maria Skyllas-Kazacos. «Reductions in the carbon diox-
ide footprint of aluminium smelters by the application of fundamental data» JoM Vol. 60 No. 11.
pp17 to 23.
15. Ali. Al Zarouni, Marc de Zelicourt, Maryam Mohamed Al-Jallaf, Ibrahim Baggash,
Kamel Alaswad, A. Kumar, A. Reyami, Vijay Kumar, D. J. Bakshi, J. Blasques» DX POT TECHNOL-OGY POWERS GREEN FIELD EXPANSION» Light Metals 2010 pp 339 to 343.

316
The Second International Congress «Non-Ferrous Metals – 2010», September 2–4, Krasnoyarsk, RussiaThe Second International Congress «Non-Ferrous Metals – 2010», September 2–4, Krasnoyarsk, Russia • Part VI • Aluminium Reduction Technology• Part VI • Aluminium Reduction Technology
In the last two years the demand for the industrial IMS in Russia became obvious and large-
scale. This situation is not surprising. During the time of crisis changes many companies require
for additional flexibility of management and control of technological process. It was impossible
to attain controllable bankruptcy only by mere organizational formidable actions. From 2001
ToxSoft Company is continuously developing the program of creation and implementation of
information management systems (IMS) at the plants with continuous and discrete-continuous
processes. Now the company attempts to discover the secrets of the IMS efficiency as well as the
reasons of demand thereof at the market of automation.
It was a historical trend that the development of industrial automation began from auto-
mation of technological processes. Automated systems of process control in its modern meaning
are based on more than 25-year experience. However, the other industrial issues:
• equipment management,
• flow management,
• quality management, and
• management of technical and economical performances
were settled mainly in semi-manual mode on the basis of conventional logs, reports, and in
the best variant were aided with a base of computerized archives.
Resulting from the development of networks and open SCADA-systems there appeared
a capability to solve the aforementioned problems at a new technical level. Unfortunately, the
initial IMS, designed according to the rule of «common sense» could not perform the problems
of efficient management and were considered as unreasonable waste of financial funds, provid-
ing only promotion of company image (as operating innovative IT-technologies).
And on the contrary, the results of the companies, where the IMS were developed on scien-
tific basis with application of best foreign and domestic experience, were outstanding, indeed.
Even more, the personnel of such companies at present cannot imagine the process manage-
ment without such means.
This report is devoted to discussion of the secrets of efficient implementation and opera-
tion of the IMS.
Some examples are given of the IMS implementation for various industrial services.
INFORMATION MANAGEMENT SYSTEMS (IMS).SECRETS OF THEIR EFFICIENCY
T.O. Khazaradze, V.F. Schwartzkopf
ToxSoft Ltd., Moscow, Russia

317
The Second International Congress «Non-Ferrous Metals – 2010», September 2–4, Krasnoyarsk, RussiaThe Second International Congress «Non-Ferrous Metals – 2010», September 2–4, Krasnoyarsk, Russia • Part VI • Aluminium Reduction Technology• Part VI • Aluminium Reduction Technology
Current efficiency is the most important indicator of an aluminium electrolysis cell perfor-
mance. Definition of «current efficiency» is both theoretically and practically accurate and un-
ambiguous. It expresses the ratio between actually produced aluminium and metal that should
be produced in theory according to Faraday’s law.
In spite of the fact that many works performed by different researchers during last decade
deepened our knowledge of current efficiency nature, still some problems remain which prevent
to achieve the maximum possible current efficiency for a group of aluminium electrolysis cells
steadily.
Evolution of current efficiency
The first commercial aluminium electrolysis cells for aluminium production appeared at
the beginning of the twentieth century. Current efficiency of about 78 % was typical for them.
The current efficiency limit of 85 % was reached in 1940-es on aluminium electrolysis cells with
capacity of 50 kA. Then a sharp increase in current efficiency was observed due to profound
study of commercial electrolytes properties, and in 1952 the 90 % limit for vertical stud Soeder-
berg with capacity of 100 kA was achieved [1]. This indicator was significantly higher than aver-
age value for aluminium industry at that time. During the next years the progress slowed down,
since the main attention of researchers, because of an energy crisis in the middle of 1970th, was
directed at decrease of electric power consumption. The best indicators reached on a rather
small group of VSS aluminium electrolysis cells with amperage 100 kA were: current efficiency –
92.0 %, electric power consumption – 12700 kW⋅h/t. It is quite comparable with the best results
received for prebake cells.
The average annual current efficiency of 93.9 % for a group of prebake cells with amper-
age 150 kA was reached in 1974, and one test aluminium electrolysis cell was operated with
the average annual electric power consumption of 12200 kW⋅h/t. It is the lowest electric power
consumption mentioned in reference literature [2].
Not enough data is available about operation of super powerful aluminium electrolysis cells
(with amperage over 200 kA), though the first aluminium electrolysis cells with such capacity were
started up by company ALCOA in 1969. According to [3], these aluminium electrolysis cells per-
formed with current efficiency of 91.0 % and electric power consumption of 15100 kW⋅h/t in 1978.
In 1986 company Pechiney started up the first 280 kA cells on which current efficiency of 95.8 %
and electric power consumption of 12800 kW⋅h/t were achieved [4], later aluminium electrolysis
cells of comparable capacity were put into operation by companies VAW and ALCAN, however alu-
minium electrolysis cells of that design failed to surpass the result reached by Pechiney.
Direct estimation of current efficiency
Calculation of current efficiency is generally reduced to determining power of electric cur-
rent running through aluminium electrolysis cell, and weight of the aluminium produced dur-
ing a certain time interval. The systems of calculation developed lately allow speaking about a
satisfactory error by estimation of electric current power (the error of electric current power
measurement makes 0.2 %). The systems of electric current power calculation used before had
higher error of measurements (to 8 %). Therefore many researchers doubt the results of cur-
rent efficiency reached in 70-s of the previous century. It is also rather simple to determine the
time of the electrolysis process and weight of metal tapped from the cell; however it is difficult
to determine changes occurring in liquid aluminium in the cell cavity. To determine weight of
liquid aluminium in the cell cavity the Russian researchers traditionally use a metal indicator
method: a certain copper weight is introduced into melt, and the change in its concentration in
CURRENT EFFICIENCY OF ALUMINIUM ELECTROLYSIS CELLS
S.I. Nozhko, N.N. Pitertsev
RUSAL ETC Ltd., Krasnoyarsk, Russia

318
The Second International Congress «Non-Ferrous Metals – 2010», September 2–4, Krasnoyarsk, RussiaThe Second International Congress «Non-Ferrous Metals – 2010», September 2–4, Krasnoyarsk, Russia • Part VI • Aluminium Reduction Technology• Part VI • Aluminium Reduction Technology
raw aluminium determines the amount of liquid aluminium at the beginning and the end of the
experiment. This method permits to reduce error to about 1.5–2.5 % at estimating change of
liquid aluminium weight in the cell cavity.
In western countries a eutectic alloy containing 70 % of silver and 30 % of aluminium is
used as an indicator metal [5]. Whereas the melting temperature of this alloy (596 oC) is com-
parable to the temperature of liquid aluminium in the electrolysis cell, the effect of better dis-
solution of indicator metal in the melt is reached. Application of the eutectic alloy on the basis of
silver allows lowering an error of liquid aluminium measurement in the cell to 1.4 %.
The Institute of Inorganic Chemistry of the Norwegian Institute of Technology in Trond-
heim worked out the radio isotope method for estimation of liquid aluminium weight in the cell
cavity. As radioactive isotopes either Au-198 or Ga-72 are used. Irradiated «granules» weigh only
3 g, and this essentially simplifies their input into metal volume. The standard error by deter-
mining liquid aluminium weight in the aluminium electrolysis cell using a radio isotope method
makes 0.06–0.13 % [6].
Existing empirical dependences of current efficiency on technological parameters of cell operation
The influence of bath chemistry and impurities in electrolyte, magnetic hydrodynamics
and gas dynamics in the aluminium electrolysis cells were widely studied by many researchers,
as a result of these studies commercial processes of aluminium production were supplied with
numerous models [7–13] at the majority of the aluminium smelters.
Models [8–12] are inherently hypothetical: they are based on the factors which were con-
sidered important from the theoretical point of view, for example, electrolyte density and vis-
cosity, solubility of the reduced metal in electrolyte, anode cathode distance, the area of metal
contact with electrolyte, the ratio of the metal area to the total area of bubbles on the anode
bottom. To account the «inexplicable» phenomena in model [8] the constant correction factor is
used and in model [10] short circuit factor. Therefore the application of these models directly in
the industrial environment is rather limited.
In this context model [7] which was empirically deduced by a method of regressive analy-
sis is of special interest, because it estimates the influence of AlF3 and LiF rather accurately.
By developing model [11] considerable laboratory work was carried out to determine
the influence of multivalent impurities in electrolyte. These impurities cause losses during a
cycle of secondary oxidation (the influence of phosphorus impurities was determined and it was
shown, that this influence is 2–5 times higher than the influence of other multivalent impuri-
ties). Another important contribution was direct inclusion of cathode overvoltage in the equa-
tion for calculating current efficiency.
In article [14] the expert estimation of technological factors influence on current efficien-
cy (fig. 1) was given for the first time. As well as in earlier works, the greatest importance from
all factors has solubility of metal in electrolyte; however it is rather difficult to identify this pa-
rameter operatively in commercial conditions.
Parameter Orthogonal estimationAluminium solubility in electrolyte -2.2569930Alumina content in electrolyte -1.1805344Solubility * alumina content -1.1782484MHD -instability (noise) -1.0744226Current distribution in anode -0.7800229Cathode overvoltage 0.7618233Cathode voltage drop -0.7253440Cathode current balance -0.7247978 (Cathode overvoltage)* (cathode voltage drop) -0.2772371
Fig. 1. Orthogonal estimation of various factors influence
on current efficiency and their scope

319
The Second International Congress «Non-Ferrous Metals – 2010», September 2–4, Krasnoyarsk, RussiaThe Second International Congress «Non-Ferrous Metals – 2010», September 2–4, Krasnoyarsk, Russia • Part VI • Aluminium Reduction Technology• Part VI • Aluminium Reduction Technology
In article [15] the empirical formulas describing the dependence of current efficiency on
technological factors are given for the first time:
Current efficiency = 235.1–0.147 * Electrolyte temperature +
+ 1.552 * (Content Al2O3–2.533) * (Content AlF3–12.478) +
+ 0.254 * ((Content Al2O3–2.533) * (Electrolyte temperature – 957.046) (1)
Current efficiency = 289.2–1.39 * Alumina content –
– 0.732 * Metal height – 0.19 * Electrolyte temperature (2)
Current efficiency = 102.3–424 * Metal solubility in electrolyte (3)
Current efficiency = 76.2 + 0.919 * Content AlF3–
– 0.0107 * (Total melt height – 46.418) * (Noise due to bubbles – 89.407) +
+ 1.39 * Number of feeding cycles. (4)
If different researchers agree that the tendency of influence of such additives content as
AlF3 and LiF on current efficiency is identical, the alumina influence is considered in different
ways: there are some opinions, that the increase in alumina concentration in electrolyte increas-
es current efficiency, and there are absolutely opposite opinions. A number of researchers con-
sider that the dependence of current efficiency is of an extreme nature. The equations indicated
above (1–3) are deduced empirically for prebake anode cells, the equation (4) – for Soederberg
cells. Unlike equations (1–3) in equation (4) there is no dependence on alumina concentra-
tion in electrolyte. This fact is explained in article [15] in the following way: insensibility of Soe-
derberg cells to alumina concentration in electrolyte is caused by the cell geometry. Models of
alumina dissolution predict that current efficiency should increase with the increase of alumina
concentration; however observations prove an opposite effect. Alumina influence on the space
occupied by bubbles under the anode is focused. The long way under huge Soederberg (self bak-
ing) anode, as compared with prebake anodes, gives bubbles more opportunities to merge and
become bigger, that causes «noise» increase on the cell. This effect of geometry on the bubble
size dominates over effect of alumina concentration influence in electrolyte.
Working out empirical dependence of current efficiency on technological parameters for a group of aluminium electrolysis cells
Within the framework of studies, carried out by the authors of this article, the dependence
of current efficiency on technological parameters for a group of vertical stud Soederberg cells
was obtained. In the course of developing process the influence of technological parameters and
routine operations were separated. The total current efficiency was estimated as a difference
between technological and operational current efficiencies (5):
η = ηtechn – ηoper, (5)
where: η – current efficiency, %;
ηtechn – technological current efficiency, %;
ηoper – operational current efficiency, %.
The technological current efficiency was determined empirically based on commercial alu-
minium electrolysis cells performance. All cells were divided into ten equal groups according
to their productivity. The influence of technological parameters on current efficiency was esti-
mated by the second decil, i. e. 10 % of the most productive cells were excluded from the analy-
sis as statistically incorrect. Within the framework of the carried out studies some interesting
results were obtained: it was revealed that a multivalent vanadium impurity has no influence
on current efficiency, 92 % of vanadium getting into cell accumulates in raw aluminium, and
there is practically no vanadium in electrolyte. It contradicts the results obtained in previous
works; however it is quite logical because vanadium is more electropositive than aluminium.
Phosphorus influence was also not detected: phosphorus delivery during the analyzed period
was insignificantly small. An approach deserving attention was applied to estimation of sul-
phur influence: sulphur was estimated according to its content in the anode weight with time
delay of its appearance on the anode bottom. Such approach is technologically simpler, than
direct estimation of sulphur content in electrolyte, but statistically it is proved by high correla-
tion. Also the influence of alumina concentration and its properties was not detected, this con-
firms results reported in [15], i. e. the influence of alumina properties becomes significant only

320
The Second International Congress «Non-Ferrous Metals – 2010», September 2–4, Krasnoyarsk, RussiaThe Second International Congress «Non-Ferrous Metals – 2010», September 2–4, Krasnoyarsk, Russia • Part VI • Aluminium Reduction Technology• Part VI • Aluminium Reduction Technology
in aluminium electrolysis cells where alumina feeding is done in an automatic mode and there-
fore its concentration is conventionally constant. The final empirical formula of a technological
current efficiency looks like (6):
ηtechn = 92.5 – ((tel – 961)⋅0.26 + (CR – 2.31)⋅35.6 +
+ (7.6 – СCaF2 %)⋅9 – (SАМ – 1.47)⋅6.21),
where: ηtechn – technological current efficiency, %;
92.5 – basic current efficiency, %;
tel – average electrolyte temperature for test cells, oC;
961 – basic electrolyte temperature, °C;
0.26 – coefficient of electrolyte temperature significance, %/oC;
КО – average cryolite ratio in electrolyte, mole;
2.31 – basic cryolite ratio in electrolyte, mole;
35.6 – coefficient of cryolite ratio in electrolyte significance, %/mole;
СCaF2 % – average CaF2 concentration in electrolyte, %;
7.6 – basic CaF2 concentration in electrolyte, %;
9 – coefficient of CaF2 concentration in electrolyte significance;
SАМ – weighted average of sulpher content in anode paste three months before
planned/analyzed period, %;
1.47 – basic weighted average of sulpher content in anode paste, %;
6.21 – coefficient of sulpher content in anode paste significance, %/ %.
It is necessary to discuss the value of operational current efficiency separately. This group
of aluminium electrolysis cells included cells systematically performing with current efficiency
less than 85 %: started up cells and with failures in technological process, i. e. those cells which
were operated with comparable technological parameters of the electrolysis process but failed
to perform with the required productivity. According to the condition of the Russian alumini-
um industry this factor is the most important currently.
A similar approach to calculation of current efficiency, but without empirical dependence,
is given in article [16].
Prediction of current efficiency for aluminium electrolysis cell based on periodic data collection from aluminium electrolysis cells
As it was indicated above, at present the most important factor of the technological pro-
cess at the Russian aluminium smelters is a number (share) of cells specified by low production.
Therefore the problems of timely identification of cells performing below target and undertak-
ing actions to increase their productivity and prevent its decrease are very important.
The performed review of literature has shown, that the majority of researchers tend to
think, that the intensity of back reaction process (7) is the most important:
Al + CO (CO2) = Al2O3 + C (CO) (7)
Therefore there are 4 ways of operative determining current efficiency on cells at a certain
moment:
– monitoring of the CO ratio to СО2 in exhausted gases. This method based on reaction (7),
is rather correct, however it is difficult to implement it in commercial conditions due to
a big number of various units used in aluminium production (it is impossible and very
expensive to provide all aluminium electrolysis cell with gas analyzers);
– monitoring alumina concentration in electrolyte. This method also logically results from
reaction (7). In commercial conditions it can hardly be applied because of insufficient re-
liability of the existing techniques for determining alumina concentration in electrolyte.
– monitoring electrolyte superheating. This method indirectly results from reaction (7).
At temperature of electrolyte superheating increase, reaction (7) progresses more inten-
sively. The existing instruments and tools permit to deal operatively with electrolyte super-
heating, at present this technology is widely used on industrial scale at many smelters.
– monitoring sodium content in metal. Some researchers use sodium in metal as substi-
tute indicator of current efficiency. This idea is based on a hypothesis, that the most
soluble reduced substance in electrolyte is sodium; hence, if sodium remains and ac-
cumulates in aluminium, it cannot contribute to losses at back oxidation. This method is

321
The Second International Congress «Non-Ferrous Metals – 2010», September 2–4, Krasnoyarsk, RussiaThe Second International Congress «Non-Ferrous Metals – 2010», September 2–4, Krasnoyarsk, Russia • Part VI • Aluminium Reduction Technology• Part VI • Aluminium Reduction Technology
simple, operative and as a consequence can be applied commercially; however some re-
searchers indicate that it is difficult to use this method for low capacity aluminium elec-
trolysis cells (amperage lower than 170 kA).
Conclusions
1. The analysis of influence of technological parameters on current efficiency value of the
aluminium electrolysis cells and the analysis of the existing methods for planning current ef-
ficiency were carried out.
2. The empirical method for planning current efficiency of aluminium electrolysis cells was
developed based on commercial experience of operating vertical stud Soederberg cells.
3. Options for identifying productivity decrease of aluminium electrolysis cells were con-
sidered and practical recommendations how to apply them were offered.
REFERENCES
1. P. Barrand, R. Gadeau, L’Aluminium, vol. 1. Paris: Editions Eyrolles, 1964.
2. S. Tanji, O. Fujishima, K. Mori/Light Metals, 1983, p. 577–586.
3. G. T. Holmes, D. C. Fisher, J. F. Clark, W. D. Ludwig/Light Metals, 1980, p. 401–411.
4. B. Langon, P. Varin/Light Metals, 1986, p. 343–347.
5. G. P. Tarcy, D. R. DeCapite/Light Metals, 1990, p. 275–283.
6. B. Berge, K. Grjotheim, C. Krohn, R. Numann, K. Torklep/Met. Trans., vol. 4, 1973, p.
1945–1952.
7. E. W. Dewing/Met. Trans. 22B, 1991, p. 177.
8. B. Lillebuen, S. A. Ytterdahl, R. Huglen, and K. A. Paulsen, Electrochim. Acta 2, 1980, p. 131
9. R. F. Robl, W. E. Haupin, D. Sharma,/Light Metals, 1977, p. 185
10. W. E. Haupin and A. R. Burkin, Production of Aluminium and Alumina, John Wiley &
Sons, 1987.
11. Per Arinn Solli, Current Efficiency in Aluminium Electrolysis Cell, DOKTOR INGENI
RAVHANDLING, 1993: 22 Institutt for Teknisk Elektrokjemi, Trondheim
12. R. D. Peterson and X Wang,/Light Metals, 1991, p. 331
13. R. Odegard, A. Sterten and J. Thonstad/Met. Trans. 19 B, 1988, p. 449
14. G. P. Tarcy/Proceedings of the Seven Australasian Aluminium Smelter Workshop, 1999.
15. G. P. Tarcy, K. Torklep/Light Metals, 2005, p. 319
16. O.-J. Siljan, J. A. Haugan, B. E. Rasmussen, B. Arnesen/Light Metals, 2004, p. 271–275.

322
The Second International Congress «Non-Ferrous Metals – 2010», September 2–4, Krasnoyarsk, RussiaThe Second International Congress «Non-Ferrous Metals – 2010», September 2–4, Krasnoyarsk, Russia • Part VI • Aluminium Reduction Technology• Part VI • Aluminium Reduction Technology
Development and attractive costs of automation devices, increase of specific capacity of alu-
minium electrolysis cells makes it possible to design and develop such complex automation sys-
tem that can be integrated into each electrolysis cell as its inherent and necessary part. The major
task of this system is alumina conveying to a cell and its feeding to electrolyte in required and
sufficient amount, facilitating the cell operation at maximal capacity and preventing formation
of insoluble residues at the cell bottom, as well as decreasing labor consumption for the electroly-
sis cell maintenance.
TOXSOFT Company was awarded with the project of development of automation complex
for Potline 5 of Irkutsk Aluminium Plant equipped with 300 kA electrolysis cells. And this project
was successfully and completely implemented by TOXSOFT Company as the turnkey complex:
ACPS of Potline 5 of IrkAZ, including the design, production, assembling and commissioning.
– The complex consists of the following components:
– APCS TROLL (Automatic process control system);
– The system of centralized alumina feeding from gas-scrubbing silos to the electrolysis
cells (CAF);
– The system of automated alumina feeding to electrolyte (AAF).
APCS TROLL
ACPS TROLL is a well-known system at the RUSAL plants, it is installed and is in operation
from 1994 at Sayanogorsk, Irkutsk, Volgograd, Nadvoitsk, Novokuznetsk, Zaporozhye, Volkhov
(experimental site), Ural (experimental site) aluminium plants, as well as at aluminum com-
plex in Podgoritsa, Montenegro.
The share of the ACPS TROLL in the overall ACPS of electrolysis at RUSAL plant amounts to
36 % (as of 2008), hundreds of experts have been trained and successfully utilize the ACPS TROLL
every day.
TROLL36%
SAAT23%
AL 2000 (ShUE BM)15%
ELEKTRA12%
ALUMINUM8%
OTHER SYSTEMS6%
TROLL SAAT AL 2000 (ShUE BM) ELEKTRA ALUMINUM OTHER SYSTEMS
Figure 1. Distribution of the ACPS systems at the RUSAL Plants
At customer request the ACPS TROLL is integrated into RUSAL proprietary software com-
plex – SMiT Workstation, for data transfer and storage in required format. In addition, the re-
verse data transfer from SMiT Workstation to TROLL is also arranged, because the TROLL control
units at NkAZ are used for displaying information on metal and electrolyte levels, temperature,
cryolite ratio and other measured parameters.
Organization of the ACPS TROLL
The organization of the complex of technical means is illustrated in figure 1.
The hardware of the system is based on the TROLL cell control units. The TROLL control
unit is based on PC-compatible PLC by Octagon Systems. The MicroPC controllers utilize all
RUSSIAN AUTOMATION SYSTEM OF ELECTROLYSIS AND RAW STUFF FEEDING AT ALUMINIUM SMELTER
A.N. Skvortsov, P.A. Demykin
ToxSoft Ltd., Moscow, Russia

323
The Second International Congress «Non-Ferrous Metals – 2010», September 2–4, Krasnoyarsk, RussiaThe Second International Congress «Non-Ferrous Metals – 2010», September 2–4, Krasnoyarsk, Russia • Part VI • Aluminium Reduction Technology• Part VI • Aluminium Reduction Technology
capacities of Intel processors for data processing and real-time control. The TROLL control units
are installed in the potrooms, one unit per two electrolysis cells. The control units are intercon-
nected into groups by coaxial cable. The groups are star-connected to the potroom network
concentrator – ArcNet fiber-optic hub. The concentrator is also connected to the potline current
and voltage controller, installed at rectifier substation, which measures and distributes the val-
ues of the potline current between the control units.
The potroom network concentrators are connected via fiber-optic cable to the router of the
TROLL system. The router is installed in the ACPS control room together with the servers of the
system:
– real-time server (RTS);
– database server (DBS).
On the one hand, the servers acquire information from the router of the system. On the
other hand, the servers open access to the data from the plant network. Any computer connect-
ed to the plant network can have either real-time data access (via RTS), or the access to stored
data, reviews, reports (via DBS).
Potroom
Potroom APCS system
Rectifiersubstation
ArcNet network
TROLL-5 control units
Electrolysiscells
Technologist Workstation
Potline currentand voltagecontroller
Other potrooms
Router Sprut-2
Intermediate Ethernet 100
Real time server
Database server
Senior foreman Workstation
Technologist Workstation
Potroom operator Workstation
Other groups
Fiber-optic cable
Group No. 1 Group No. 8
Potroom network concentrator
Coaxial cable
Twisted pair
Plant Ethernet 10/100
Potroom operator Workstation
Fig. 2. Organization of ROLL-5 hardware
The TROLL control unit are adapted
for all types of electrolysis cells, for pre-bake
electrolysis cells, for VSS and HSS electroly-
sis cells, for the electrolysis cells with various
number of the motors for anode and anode
shell travelling, for the electrolysis cells with
automated alumina feeding.
High clock frequency of the control-
ler makes it possible to process input data
and to generate output signals of various
duration beginning from 0.055 seconds to
a required value. Therefore, the system can Fig. 3. TROLL-5 Control Unit
324
The Second International Congress «Non-Ferrous Metals – 2010», September 2–4, Krasnoyarsk, RussiaThe Second International Congress «Non-Ferrous Metals – 2010», September 2–4, Krasnoyarsk, Russia • Part VI • Aluminium Reduction Technology• Part VI • Aluminium Reduction Technology
readily be adapted for operation with any mechanisms of anode travelling (for example, the
signal duration for anode travelling at NAZ equipped with very rapid mechanisms begins from
0.2 second), with type of feeders of AAF system (for example, for pneumatic metering devices
the signal duration can be adjusted in increments of 0.055 second). At this, in the SAAT ACPS
the system clock frequency amount to 1 second, implying certain restrictions on application of
rapid mechanisms requiring fine tuning.
TROLL Algorithms
The ACPS TROLL is characterized with modern set of algorithms:
– adjustment of anode-to-cathode distance (ACD);
– maintenance of metal tapping;
– maintenance of stud repositioning (anode replacement);
– maintenance of anode rack raising;
– jerking of anode shell;
– detection and suppression of metal perturbations;
– maintenance of anode effects;
– automatic quenching of anode effects (by jerking of anode set and more frequent in-
creased alumina feeding at AE occurrence);
– control of alumina concentration for the electrolysis cell with AAF, automatic adjust-
ment of presets for AAF;
– notification of required anode rack raising.
Such set of algorithms is supported by nearly all modern ACPS in the World, however, their
efficiency and adaptivity to various cell designs can be disputable. Moreover, these algorithms
can be improved or fine-tuned up to infinity, often this requires a programming crew, and in the
ACPS TROLL the adjustments can be made by a qualified technologist.
The IrkAZ Potline 5 incorporates significant improvements in the algorithm of automatic
adjustment of alumina feeding frequency – AAF Presets. Taking into account, that at the time
of the system commissioning the alumina suppliers were not selected, the variations of alumina
properties were not studied both for as-delivered material and for material after dry scrubbing
system (and these variations are of great significance for the range of alumina fluidity), the
limits of allowable AAF preset range were increased to 50 %. As a result, the system now can
automatically adjusted nearly for any delivered alumina.
Adjustment of the ACPS TROLL
After installation and commissioning of the system including adjustments for a specific
plant there is no urgent need in programmers for custom adjustment of the system. The ACPS
TROLL is supported by the so-called Standard Reference Data (SRD) consisting of more than
250 parameters, by varying them an experienced technologist can customize the system includ-
ing adjustment of parameters of any single electrolysis cell.
The supply of TROLL is completed with special software, Editor of system description, that
provides capability to open and to close certain parameters of the SRD after adjustments.
The security system of the ACPS TROLL aided with the codes and passwords makes it pos-
sible to specify the user capabilities – from «GUEST – just to observe» to «Expert – to enter modi-
fications at any level».
The system settings are not limited by the SRD ranges, on-line adjustment of current pa-
rameters is available, both from the upper system level and directly from the TROLL control unit
of an electrolysis cell.
Example: At variations in the alumina properties it is possible to vary capacity of the me-
tering device in wide range directly from the TROLL control unit, and at wide-scale variations,
for example, at conversion to another dosage (higher or lower), the feeder capacity can be pro-
portionally modified from the upper level. Therefore, the feeding dosage of a potroom, potline,
or cell group obtaining alumina from one gas scrubber silo can be readjusted by a couple of PC
clicks from the system upper level.

325
The Second International Congress «Non-Ferrous Metals – 2010», September 2–4, Krasnoyarsk, RussiaThe Second International Congress «Non-Ferrous Metals – 2010», September 2–4, Krasnoyarsk, Russia • Part VI • Aluminium Reduction Technology• Part VI • Aluminium Reduction Technology
Data displaying in the TROLL automated complex
The data on the operation of electrolysis cells are displayed by Monitor TROLL software in-
stalled at any PC of the plant network.
This software facilitates monitoring both of total potroom or plant, and of each electrolysis cell.
There are three viewing windows:
– 3 minute plot of variations of voltage and other parameters;
– 3 second plot of voltage variations, that is, noise shapes (for the last 3 days);
– viewing of voltage variations and parameters of anode effects;
– viewing of parameters and time of scheduled procedures;
– viewing of parameters of MHD-properties of electrolysis cells;
– viewing and adjustment of AAF and fluoride feeding systems;
– viewing of the list of events occurring at electrolysis cell operation;
– electrolysis cell operational data per shift;
– viewing of potline voltage and current parameters.
If a user has appropriate rights, the Monitor TROLL can be used for adjustment of param-
eters and remote control of electrolysis cell, for start and end of scheduled procedures, for anode
travelling, for control of AAF.
The integrated system of logs and reports makes it possible, without exiting from the
Monitor TROLL software, to readily analyze the operation of a potroom, crew, group or a single
electrolysis cell in terms of numerous parameters in a wide time range, beginning from a shift
(8 hours). The stored data, logs and other information can be printed on paper or transported to
Microsoft Office or OpenOffice.
Specially for the IrkAZ Potline 5 the Monitor TROLL software was supplemented with the
data on operation, time, and quality of feeding of AAF hoppers by the system of centralized alu-
mina distribution.
The detailed information about organization, hard- and software of the ACPS TROLL is
available at the TOXSOFT site: http://www. toxsoft.ru/.
System of centralized alumina distribution
The system system of centralized alumina distribution is base of the SibVAMI project, modified
by the TOXSOFT experts both for the system automation and for certain elements of the design.
The IrkAZ Potline 5 is equipped with four silos for storage of fluorinated alumina transferred
from the dry gas scrubbers. Alumina from these silos should be conveyed to the AAF hoppers at the
electrolysis cells preventing them from being completely empty. The alumina conveyance is aided by
pneumatic spouts, the so-called «low pressure system of centralized alumina distribution» or «Alu-
mina fluidized bed conveyance». Such method of alumina conveyance is widely known in the global
experience and is the most cost efficient, not deteriorating the alumina properties (minimal alumina
attrition).
Composition of the system of centralized alumina distribution
The system of centralized alumina distribution includes:
– Blowing units – one per two silos – each blowing unit consists of 4 air blowers;
– Under-silo pneumatic spouts – for alumina discharging from silo and its feeding to in-
line pneumatic silos of electrolysis potlines;
– Line pneumatic spouts – for alumina conveyance along the potline sector;
– Transversal distributing pneumatic spouts – for charging of AAF hoppers on the elec-
trolysis cells;
– Accompanying air pipelines – for fan air inlet to the pneumatic spouts;
– Electric shutters for toggling of air flow from one sector to another;
– Pressure gauges of fan air;
– Local relay units – 16 pieces, for adjustment and checking of shutter operation after
maintenance or overhaul;
– Two control cabinets of the segments of the system of centralized alumina distribution:
«North», «South» – facilitating charge procedures both in automatic and in manual mode;
– Server – for acquiring and storage of data on the system operation and provision of commu-
nications with the technological network of ACPS TROLL and the plant network, which in-
corporates «Workstations of the users of the system of centralized alumina distribution».

326
The Second International Congress «Non-Ferrous Metals – 2010», September 2–4, Krasnoyarsk, RussiaThe Second International Congress «Non-Ferrous Metals – 2010», September 2–4, Krasnoyarsk, Russia • Part VI • Aluminium Reduction Technology• Part VI • Aluminium Reduction Technology
Overall distance of the pneumatic spouts is about 5.5 kilometers, the horizontal slope of
the in-line pneumatic spouts is about 3 %. The porous membrane is made of special fabric for
pneumatic spouts, produced in Italy.
Operational principle of the system of centralized alumina distribution
The system of centralized alumina distribution is controlled by two segments: «North» and
«South», each of them operates in autonomous way and provides charging of electrolysis cells
from two silos of gas scrubbing system.
Each segment of the system of centralized alumina distribution is subdivided into 8 sec-
tors charging 10–15 electrolysis cells, the sectors are charged sequentially. The sequence and
frequency of the charging are preset by a user from «Workstation – The system of centralized
alumina distribution» by arrangement of charging schedule, where an unscheduled charging
can be determined for the most extended sectors.
The duration of a sector charging amounts to 3–7 minutes and depends on:
– alumina fluidity;
– alumina level in the gas scrubber silo;
– quantity and pressure of fan air;
– extent of emptying of the AAF hoppers.
Currently the charging procedure is performed 4–6 times per day, and all electrolysis cells
of «North» or «South» segment are charged in 5.5–6.0 hours per day, that is, the capacity of the
system of centralized alumina distribution is 75–80 t/h.
Usually the charging procedures are performed at the operation of 3 blowers.
The charging quality, that is, filling of the AAF hoppers, is determined at estimation of
pressure variations in the accompanying air pipeline of the sector. When the pressure reaches
the preset value, the system assumes that the hoppers are filled, and the distributing pneumatic
spouts as well as in-line spout of the sector are filled, too. Then the signal is generated for charg-
ing of next scheduled sector. The air flow is toggled by the shutters to next sector.
If by any reasons the pressure does not reach the preset value, then the system algo-
rithms increase the blowing capacity (the fourth blower is activated) for a preset time. If again
the pressure does not reach the required value, an emergency signal is generated and the charg-
ing is considered as failed. The data on time, duration and quality of charging are transferred to
Workstations- The system of centralized alumina distribution and to ACPS TROLL.
Fig. 4. North segment of the system of centralized alumina distribution

327
The Second International Congress «Non-Ferrous Metals – 2010», September 2–4, Krasnoyarsk, RussiaThe Second International Congress «Non-Ferrous Metals – 2010», September 2–4, Krasnoyarsk, Russia • Part VI • Aluminium Reduction Technology• Part VI • Aluminium Reduction Technology
System of automated alumina feeding (AAF)
Alumina and its metering
The companies designing and operating electrolysis cells with alumina point feeding set
stringent requirements to alumina quality. The major quality criteria are as follows:
– particle size distribution;
– chemical composition;
– moisture and L. O.I.;
– angle of repose.
These properties determine the alumina flow rate from the hoppers, the rate and the ex-
tent of alumina solubility in the electrolyte, the wear of equipment (at high content of alpha-
alumina – corundum), the alumina attrition.
Aiming at acceptable quality of alumina Western companies modified its production for
obtaining of the so-called sandy alumina.
At present the Russian alumina refineries produce mainly floury alumina, that hardly
be used for point feeding of electrolysis cells. Below is given a table with comparison of the
PECHINEY requirements to alumina and the data on the Russian alumina (table 1).
Table 1
Properties of Russian alumina and PECHINEY requirements to alumina
Properties Units of
measure-
ment
Value
Supplier Pechiney
requirements
AGK Pavlo-
dar
UAZ BAZ
Bulk density g/cm3 0.9 0.97 0.96 1.05 1.01
BET surface area m2/g 60–80 n/a n/a 104.94 n/a
Alpha-phase % 5.0 12.0 15.1 14.8 17.1
L. O.I. % 0.6–0.9 1.21 1.01 0.94 0.90
Hydrate content (moisture) % 0–0.5 0.426 0.170 0.180 0.108
Content of +150 micron particle size % 0–0.5 n/a 1.66 4.37 2.92
Content of –45 micron particle size % 0–10.0 n/a 34.74 27.93 23.12
Angle of repose degrees 29–35 36.8 33.1 32.6 32.1
As is obvious from the table, PECHINEY company cannot and will not utilize our Russian
alumina considering these products as inapplicable for point feeding.
The table summarizes the averaged data for several deliveries, the inherent scattering can
be as high as 10–15 %. The issue of variations of alumina properties at dry gas scrubbing is not
studied in details, especially at variations of weather conditions and the level of saturation with
fluorine.
The alumina for Potline 5 was delivered by UAZ and BAZ, at present the alumina is deliv-
ered mainly from BAZ.
Especial attention should be paid to the content of alpha-phase, that is, corundum, its 2.4–
3.4 fold increased content increases the wear of moving parts of metering devices, in addition to
solubility decrease and increased chance of sediment formation on the bottom.
High scatter in bulk density will result in a scatter of the weight of a single batch at opera-
tion of volumetric metering devices.
And high angle of repose increases the probability of the situation when the valve metering
devices will not be filled with alumina.
The TOXSOFT experts studied the problem of the variants of application of floury alumina
for point feeding.
It has been discovered that this can be facilitated by a decrease of a single batch and (or)
increase in the number of feeding points.
Our recommendations at application of floury alumina are as follows:
– one feeding point for 35–60 kA potline current;
– minimal batch of 80–100 g per point at breaking for 4 –5 batches;
– maximal batch of 600–800 g per point at breaking for 1–2 batches.
– maximal batch is determined only after testing.

328
The Second International Congress «Non-Ferrous Metals – 2010», September 2–4, Krasnoyarsk, RussiaThe Second International Congress «Non-Ferrous Metals – 2010», September 2–4, Krasnoyarsk, Russia • Part VI • Aluminium Reduction Technology• Part VI • Aluminium Reduction Technology
When the batch is decreased from 1.2–1.3 kg/point at foreign AAF (sandy alumina) to
0.3–0.7 kg/point at Russian AAF (floury alumina) it results in sharp increase in:
– costs of the AAF equipment;
– wear rate of conventional mechanical metering devices;
– compressed air consumption for metering and breaking increases.
Aiming at solution of this problem the Company experts developed and tested pneumatic
metering device, the use of which made it possible:
– to vary in wide range the weight of a single batch exclusively by variation of the system
preset parameters. As a result, a single batch can be adjusted when another alumina
supplier is selected or at modification in the electrolyte composition – readily and at
minimal expenses;
– to eliminate wear of the metering devices, because a pneumatic metering device does
not contain moving parts; hence, there is the decrease in the expenses for operation,
maintenance, assembling and disassembling of the metering devices. Operation of the
pneumatic metering devices at Nadvoitsy aluminium plant demonstrated that even af-
ter running of 15000 tons of alumina via one metering device no wear was observed in
the porous membrane. When a single batch is reduced at a valve metering device, its
wear increases 2–5 fold, that is confirmed by the data for one Siberian modern plant;
– to achieve minimal consumption of compressed air for metering. The measurements
of compressed air consumption per one kilogram of alumina, depending on its fluidity,
showed that this value varied in the range from 0.28 to 0.33 liters, that is 3.5–7.0 fold
lower than at the use of mechanical metering devices actuated by pneumatic cylinders
(the comparison is given for valve metering devices developed by SibVAMI and ETC);
– to eliminate the problem of the hopper not filled with alumina at its low fluidity, this
problem is characteristic for many valve-type, rotary and other mechanical metering
devices equipped with metering cup.
The discussions about advantages and disadvantages of the valve-type and pneumatic de-
vices, despite the aforementioned numerous advantages of the pneumatic type, we often face
the reasoning that the pneumatic devices cannot process coarse and heavy impurities as well as
noticeable variations of a batch.
Once again, we are ready to argue these issues:
1. Dear Sirs, alumina meeting the requirements of GOST Standard 30558–98 SHOULD
NOT CONTAIN IMPURITIES, and of they exist, then it is required to install traps or filters for
these impurities at the stage of unloading, storage, dry gas scrubbers and in the system of cen-
tralized alumina distribution. The relevant expenses are not high and the final profit is undispu-
table at the use of any type of metering devices.
2. Batch variations occur as a result of variations in alumina fluidity, it cannot be considered
as a fault of metering device, it can be considered as a HINT for technologists indicating that the
alumina solubility will also change, and certain technological measures should be implemented.
3. We are perfectly aware of the fact, that a decrease of increase in a single batch will result
either in insufficient alumina feeding to electrolyte, or in sediment formation on the bottom,
therefore, we developed algorithms of the system response to the batch variations – Automatic
adjustment of AAF presets. This algorithm, in contrast to many foreign analogues, is not based
on accurate single batches, but calculates total weight of the batches and results in the second
estimating criterion of alumina concentration to – Amount of fed alumina – and only then the
conclusion is arrived about increase or decrease in alumina feeding frequency.
The one-year experience with the operation of AAF with pneumatic metering devices
at IrkAZ Potline 5, with deliveries of UAZ and BAZ alumina, demonstrated that the selected ap-
proaches were appropriate and feasibility of high technical and economical performances.
Configuration of AAF
The AAF system of point-type with 6 points of alumina feeding, one of them is used for
feeding of aluminium fluoride from separate module of automated fluoride feeding (AFF).
The AAF content at electrolysis cell includes:
– 6 crust breakers;
– 6 AAF modules;
– 1 AFF module;
– pneumatic panel;
– pipe manifold on electrolysis cell.

329
The Second International Congress «Non-Ferrous Metals – 2010», September 2–4, Krasnoyarsk, RussiaThe Second International Congress «Non-Ferrous Metals – 2010», September 2–4, Krasnoyarsk, Russia • Part VI • Aluminium Reduction Technology• Part VI • Aluminium Reduction Technology
Crust breaker
The crust breaker is equipped with pneumatic cyl-
inder, 160 mm in diameter and 400 mm stroke. The head
diameter is 90 mm. At compressed air pressure in the net-
work of 0.55–0.6 mPa the pneumatic cylinder generates
the force of 7500–8000 N.
The crust breaker is equipped with two rod guides, that
provides absence or significant reduction of radial forces on
the bottom bearing of the pneumatic cylinder. The guides
are equipped with insulating units, and the crust breaker rod
has insulating bushing, in combination with the insulation
of the attachment of the crust breaker and pneumatic cylin-
der it provides two-stage protection against electric current
appearing at contact between the crust breaker and elec-
trolyte. The protection makes possible to operate the crust
breaker at anode effects. Compressed air for the operation
of crust breaker is supplied by pipe manifold, d=20 mm,
equipped with special high-pressure sleeves, non-combusti-
ble, resistant against high temperature, as well as character-
ized with high insulation properties.
The recycled air from the pneumatic cylinders is dis-
charged to gas duct, that provides low noise level and ad-
ditional flashing of the gas ducts.
AAF module
The AAF module is intended for alumina stor-
age and feeding, it consists of:
– 340–350 kg hopper with a hole for con-
necting of chutes of distributing pneumatic
spouts of the system of centralized alumina
distribution and charging hole for hopper
loading by crane at maintenance or replace-
ment of distributing pneumatic spout. Over-
all capacity of the AAF hoppers amounts to
2040–2100 kg;
– metering device with TOXSOFT with pneu-
matic unit – specially for the IrkAZ Potline 5;
– pipe manifold, d=12 mm, that is connect-
ed via special sleeve to the metering device.
The TOXSOFT metering device is controlled
by low pressure air pulse via one pipe.
The design of the pneumatic metering de-
vice is illustrated in figure 6. The device body is a
closed parallelepiped, its upper plane is made of po-
rous material. The body is supplied with a pulse of
compressed air by a pipe. Alumina from hopper is shut off by the angle of repose at the upper
plane of the device. At the air pulse the friction forces Fattr disappear and alumina begins to move
by gravity Fg. The operational principle is illustrated in figure 7.
The pressure of the compressed air is minimal and amounts to 10–15 kPa.
Varying the duration of air pulse from 0.055 s to the required value, it is possible to vary the
batch weight. For the batch of 0.7 kg the pulse duration is 0.6–1.2 s. This range is required for
compensation of inaccuracies at manufacturing the metering devices, inaccuracies (horizontal
alignment) at its mounting in the AAF hopper, different permeability of the porous material.
The initial adjustment of the throughput of the metering devices can be readily and ef-
ficiently performed directly from the TROLL control unit. A batch is sampled and weighed, and
the required batch amount is adjusted by the parameter «Metering cycle». Adjustment of one
metering device is performed in 15–30 s, it is required only before start of the AAF operation.
Fig. 5. Crust breaker
Fig. 6. AAF module

330
The Second International Congress «Non-Ferrous Metals – 2010», September 2–4, Krasnoyarsk, RussiaThe Second International Congress «Non-Ferrous Metals – 2010», September 2–4, Krasnoyarsk, Russia • Part VI • Aluminium Reduction Technology• Part VI • Aluminium Reduction Technology
If the batch readjustment is required for all electrolysis cells, the ACPS TROLL provides ca-
pability of proportional variation of the parameter «Metering cycle» from the system upper level.
With this aim at several electrolysis cells (3–4 cells) the coefficient of proportionality is deter-
mined by means of comparison of «Metering cycle» for old and new batch, and this coefficient is
applied to the other AAF metering devices. The time of application of the modifications for over-
all potline, including sampling and calculation of the coefficient of proportionality, is not higher
than half an hour.
The weight of the metering device is about 6–7 kg, it cannot be assembled and disassem-
bled manually without a crane.
Capability of rapid variation of the batch weight makes it possible to apply the so-called
«Increased metering cycles» at anode effect (AE) quenching. At AE start the device throughput is
modified for predetermined value, therefore, it is possible to charge into electrolysis cell the
alumina content required for AE quenching, 70–200 kg per 20–30 seconds. There is no such
mechanical metering device that could feed electrolysis cell at anode effect.
AFF module
The AFF module (SibVAMI project) is intended for
storage and metering of fluorinated aluminium, for main-
taining of preset value of cryolite ratio.
The AFF module consists of:
– 370 kg hopper with charging hole for hopper load-
ing by floor machinery, the hopper capacity is suf-
ficient for 4–5 day reserve of aluminium fluoride;
– valve-type metering device, 0.7 kg single batch, driv-
ing pneumatic cylinder, 63 mm in diameter, 80 mm
stroke;
– pipe manifold, d=12 mm, connected via special
sleeves to pneumatic cylinder of metering device.
The use of valve-type metering device in the AFF mod-
ule was specified by the customer, because it was planned
to apply granulated aluminium fluoride tested at the ex-
perimental site of Ural aluminium plant, the results were
excellent. Taking into consideration infrequent operation
of the metering device of fluorides (several times per day)
and low abrasivity of AlF3, the use of valve-type metering
device for granulated materials is quite reasonable.
The pneumatic metering device at operation with
granules in wide size range (from 0.1 to 10 mm) is of low efficiency.
Among the disadvantages of the valve-type metering device its high weight can be men-
tioned. Together with pneumatic auxiliaries its weight is about 50–55 kg, a crane is required
for its mounting or dismounting.
Fig. 7. Metering device with
TOXSOFT pneumatic unitFig. 8. Operation principle of the TOXSOFT
pneumatic metering device
Fig. 9. Automated fluoride
feeding module

331
The Second International Congress «Non-Ferrous Metals – 2010», September 2–4, Krasnoyarsk, RussiaThe Second International Congress «Non-Ferrous Metals – 2010», September 2–4, Krasnoyarsk, Russia • Part VI • Aluminium Reduction Technology• Part VI • Aluminium Reduction Technology
Pneumatic equipment
Pneumatic equipment – primary filter, filter-drier, pneumatic toggles for crust breakers,
metering device for fluorides, pneumatic valves of alumina metering devices, receiver and valve
for flashing of collector beam are installed in sealed thermostatic cabinet, mounted on the sup-
port of collector bar at its dead end.
Pneumatic panel is located at the height comfortable for maintenance.
The pneumatic panel is equipped with insulators, it is connected with the pipe manifold via
flexible special high-pressure sleeves with high insulating properties.
For operation of the pneumatic metering device the compressed air pressure is reduced
to 0.08 mPa, then the air is accumulated in the receiver, then, at further pressure reduction to
10–15 kPa, via regulating valve it is supplied to pneumatic alumina metering valves.
If foreign matters, debris, Macroflex foam or other impurities are accumulated on the me-
tering membrane, it is possible to operate in Manual Mode for flashing of the metering device by
compressed air at high-pressure – 0.6 mPa.
The valve for flashing of collector beam, integrated into the pneumatic panel, is periodi-
cally activated for 1–2 minutes. The frequency and duration of the flashing is preset from Moni-
tor TROLL as actual parameter.
Compressed air consumption
As has been already mentioned, air consumption by the pneumatic metering devices is in-
significant, and it would be interesting to compare minimal air consumption per minute for vari-
ous AAF designs and with various number of feeding points.
Table 2
Compressed air consumption at operation of various designs of Automated Alumina Feeding
Parameters of pneumatic equipment
un
its
of
me
a-
sure
me
nt
ToxSoft AAF SibVAMI AAF (UAZ-оу)
AAF at one of the mod-ern Siberian plants
Pneumatic metering
device
Crust breaker
Valve metering
device
Crust breaker
Valve metering
device
Crust breaker
Cylinder diameter mm 160 63 160 80 200
Rod diameter mm 40 20 40 20 50
Rod travelling distance mm 400 80 400 100 400
Pressure atm 0.015 6 6 6 6 6
Number of feeding points
piece 6 6 6 6 4 4
Batch weigh kg 0.7 0.7 1.2
Compressed air con-sumption per minute
NL per min
0.99 408.80 14.20 408.80 17.03 425.84
Maximal compressed air consumption per minute at the crust breakers and alumina metering devices
NL per min
409.79 423.00 442.87
Taking into consideration, that various types and dimensions of pneumatic cylinders and
metering devices are used, the air consumption is approximately the same at various number of
alumina feeding points, the TOXSOFT AAF has the lowest one.
Conclusions
In conclusion we would like to draw your attention to such issues – What is AUTOMA-
TION COMPLEX OF ELECTROLYSIS PROCESS AT IrkAZ POTLINE 5? And what is the efficiency
of its implementation?
As is obvious from the report, the three systems included in the Complex – ACPS TROLL, the
System of centralized alumina distribution and the AAF System – are interrelated supplementing
each other, they minimize the drawbacks and highlight the advantages, they constitute an inher-

332
The Second International Congress «Non-Ferrous Metals – 2010», September 2–4, Krasnoyarsk, RussiaThe Second International Congress «Non-Ferrous Metals – 2010», September 2–4, Krasnoyarsk, Russia • Part VI • Aluminium Reduction Technology• Part VI • Aluminium Reduction Technology
ent part of an electrolysis cell. The complex facilitates the electrolysis cell to perform its main
task – metal production from alumina at minimal costs and maximal efficiency. The complex con-
veys alumina from gas scrubber silos to an electrolysis cell, feeds alumina into electrolyte in ac-
cordance with the cell demand preventing sediment formation on the cell bottom without attain-
ment of extremely low alumina content resulting in occurrence of anode effect. At occurrence of
casual AE (and it cannot be defined in another way – the AE frequency is about 0.02 AE per cell in
a day) the complex facilitates rapid and automatic quenching of AE, it controls the cell voltage
minimizing electric power consumption and accompanies all scheduled procedures.
Despite the fact that at the Potline 5 in 2009 numerous new electrolysis cells were started,
and these events are always of negative effect for operating cells, the obtained results are excel-
lent and at regular potline operation they will be even better.
Table 3 summarizes the plant performances.
Table 3
Technical-economical performances of Potline 5 in 2009
Performance
un
its
of
me
asu
re-
me
nt.
Jan Feb Mar Apr May Jun Jul Aug Sep Oct Nov Dec 2009
Current efficiency % 93.57 93.56 93.51 93.16 93.03 93.25 93.51 93.47 93.41 93.43 93.74 93.71 93.45
Specific power con-
sumption
kW*h/t 14578 14694 14419 14308 13147 14225 14164 13895 13978 13981 13915 13877 14098
AE frequency AE/*day 0.06 0.06 0.06 0.05 0.05 0.06 0.05 0.07 0.06 0.05 0.04 0.03 0.05
Grade, higher grades
(А85, А8, А7, А7 Э)
% 100 100 99.47 95.43 96.07 96.54 99.66 99.1 97.44 99.65 99.62 100 98.58
Number of operating
cells at the end of
month
piece 117 117 119 128 137 142 142 145 154 154 154 154 139
The AUTOMATION COMPLEX OF ELECTROLYSIS PROCESS AT IrkAZ POTLINE 5 was im-
plemented by TOXSOFT company on turnkey basis, that is:
– design and production, as well as ACPS TROLL software;
– design and production of the AAF system;
– production of the system of centralized alumina distribution and equipment assembling.
The assembling, implementation and commissioning of the Complex would be impossible
without assistance by the RUSAL employees, who rendered all reasonable support in arrange-
ment of the activities, in solving disputable issues, in selection of technological parameters.
Our especial acknowledgements in relation to the implementation of the Potline 5 ACPS
are as follows:
Kartavtsev, Aleksei Vasilyevich, OOO RUSAL Engineering – Irkutsk, General Director;
Bavykin, Sergei Gennadievich, Head of electrolysis branch, Potline 5;
Isaichenko, Vladislav Yurievich, Head of IrkAZ Potline 5;
Mineev, Vladimir Viktorovich, Manager of AAF and Anode facilities, Potroom 9;
Zagerson, Aleksei Sergeevich, Manager of AAF and Anode facilities, Potroom 10;
Zherdev, Aleksei Sergeevich, Head of OUT-OA 300M.
REFERENCES
1. Grjotheim К., Welch B. J. Aluminium Smelter Technology.- Dusseldorf: Aluminium-Ver-
lag, 1988. – 327 с.
2. Isaeva L. A., Polyakov P. V. Alumina at aluminium production in an electrolysis cell –
Kranoturyinsk: Publishing House OAO BAZ, 2000. – 199 p.
3. A. T. Tabereaux, «Impact of AE Kill Strategies on CF4 Emissions» 9th Australasian Alu-
minium Smelting Technology Conference, 4–9 Nov. 2007, pp.127–138.
4. TROLL system algorithm description No. 31–2201/01, Specifications by OAO ToxSoft.
Moscow, 2003.
5. Khazaradze T. O. TROLL-5, Automation complex. Presentation at Sayanogorsk Alumin-
ium Plant in 2001.
6. Skvortsov A. V., Gallov N. A. Russian System of alumina conveying – Report, Aluminium
of Siberia–2007.

333
The Second International Congress «Non-Ferrous Metals – 2010», September 2–4, Krasnoyarsk, RussiaThe Second International Congress «Non-Ferrous Metals – 2010», September 2–4, Krasnoyarsk, Russia • Part VI • Aluminium Reduction Technology• Part VI • Aluminium Reduction Technology
For new aluminum smelters with prebaked technology RUSAL plans to build facilities to
produce carbon anode blocks. Anode blocks are produced on the basis of petroleum coke and
coal-tar pitch composite. Against the background of growing deficit of carbon raw materials to
provide material of sustained performance for the new anode production is an engineering task
of great importance.
Carbon material laboratory of Engineering and Technology Center «RUS-Engineering»
Ltd. Compared coal-tar pitch from two potential suppliers for the new smelters. The pitches have
close softening points (table 1), but were produced by different processes: pitch from supplier
A – by heat treatment, pitch from supplier B – by vacuum distillation.
Table 1
Pitch properties
Coal-tar pitch Supplier Softening point
(Мettler), oС
Volatiles,
%
Fixed car-
bon, %
Insolubles, % Viscosity, сР
TI QI 155 oС 185 oС
Thermally treated А 121 51 60 34 11 8700 750
Vacuum distilled Б 120 57 55 30 6 4600 640
From table 1 it is apparent that pitches differ substantially in the following parameters:
fixed carbon, content of volatiles, amount of toluene insolubles (TI). The difference is especial-
ly marked between viscosity and quinoline insolubles (QI). Literature review showed that this
difference in properties is typical for the pitches produced by vacuum distillation and thermal
treatment [1, 2]. Tests to assess effect of pitch properties on properties of baked anodes are con-
ducted on batches of laboratory anodes [2, 3]. For this purpose for each pitch the carbon mate-
rial laboratory produced batches of laboratory anodes with pitch content 12 %, 13 %, 14 % and
15 %. The filling agent was calcined petroleum coke with the following size distribution:
Coarse (-12.5+4) mm – 30 %
Medium (-4+1) mm – 20 %
Intermediate (-1+0) mm – 20 %
Dust (Blaine number 3500) – 30 %
Anode paste was mixed in Eirich intensive mixer. Anodes (two for each pitch concentra-
tion) with diameter 160 mm and 150 mm high were formed by vibration [4]. Anode production
conditions are given in table 2.
Table 2
Anode manufacturing report
Mixing and molding conditions
Coke aggregate preheating 200 oС
Mixing time 5 minutes
Activator rpm 1300 rpm
Mixing temperature 200 oС
Molding temperature 180 oС
Vibration time 60 seconds
Baking report:
0–600 oС 10 oС/hour
600–1100 oС 30 oС/hour
Soaking at 1100 oС 10 hours
EFFECT OF PITCH QUALITY ON PROPERTIES OF BAKED ANODES
S.S. Zhuchkov 1, S.A. Khramenko 2
1RUSAL ETC Ltd., Krasnoyarsk, Russia2Siberian Federal University, Krasnoyarsk, Russia

334
The Second International Congress «Non-Ferrous Metals – 2010», September 2–4, Krasnoyarsk, RussiaThe Second International Congress «Non-Ferrous Metals – 2010», September 2–4, Krasnoyarsk, Russia • Part VI • Aluminium Reduction Technology• Part VI • Aluminium Reduction Technology
Fig. 1. Properties of baked anodes on pitches A and B
1,4
1,45
1,5
1,55
1,6
1,65
11 12 13 14 15 16
De
nsi
ty,
g/
cm
3
De
nsi
ty,
g/
cm
3
Pitch А Pitch B
0
5
10
15
20
25
30
35
11 12 13 14 15 16
Str
en
gth
, М
Pa
Pitch А Pitch B
-1
0
1
2
3
4
11 12 13 14 15 16
Ex
pa
nsi
on
, %
Pitch А Pitch B
Baked density
1,4
1,45
1,5
1,55
1,6
1,65
11 12 13 14 15 16
Pitch content, %
Pitch А Pitch B
Specific electric resistance
40
4550
55
60
65
70
75
80
11 12 13 14 15 16
Pitch content, %
Re
sist
an
ce, μО
˙m
Pitch А Pitch B
Gas permeability
0
5
10
15
20
25
30
11 12 13 14 15 16
Pitch content, %
Ga
s p
erm
ea
bil
ity,
nP
m Pitch А Pitch B
Heat conductivity
0
0,5
1
1,5
2
2,5
3
3,5
11 12 13 14 15 16
Pitch content, %
He
at
con
du
cti
vit
y,
W/
m˙К
Pitch А Pitch B
Carboxy residue, CRR %
72
74
76
78
80
82
84
11 12 13 14 15 16
Pitch content, %
Re
sid
ue
, %
Pitch А Pitch B
5,2
5,3
5,4
5,5
5,6
5,7
5,8
5,9
11 12 13 14 15 16
CT
E 1
0–
6K
–1
Pitch А Pitch B
68
69
70
71
72
73
74
75
11 12 13 14 15 16
Green density
Pitch content, %
Compressive strength
Pitch content, %
Volumetric expansion
Pitch content, %
CTE
Pitch content, %
Fixed carbon in anode
Pitch content, %
Fix
ed
ca
rbo
n ,
%
Pitch А Pitch B

335
The Second International Congress «Non-Ferrous Metals – 2010», September 2–4, Krasnoyarsk, RussiaThe Second International Congress «Non-Ferrous Metals – 2010», September 2–4, Krasnoyarsk, Russia • Part VI • Aluminium Reduction Technology• Part VI • Aluminium Reduction Technology
After baking 4 cores were taken from the anodes to define ten typical properties of anode.
Diagrams showing test results are given in figure 1.
Results given in figure 1 form grounds to make the following conclusions: proceedings
from requirements of the aluminum industry the pitch A anodes exhibit better performance in
most parameters. In the diagrams it is visible that the properties of anodes tend to depend on
the amount of pitch. The higher the pitch content the less is the difference between the anodes
made on pitches A and B.
In addition to differences in physical-mechanical properties the anodes based on A and B
pitched behaved differently in baking. Figure 2 shows anodes samples with pitch content 14 %.
The cores of anodes with pitch B (fig. 2 b) exhibit vertical cracks.
a b
Fig. 2. Samples of baked anodes: a) with pitch A; b) with pitch B
Vertical cracks emerging in baking are attributed [5] to release of elastic stress arising
during molding and cooling of green anodes or to evolution of pitch coking gas. Emergence
of vertical cracks was shown [6] to depend on the following factors: molding pressure and
temperature, cooling rate after molding, calcinations gas release rate. It was found that the rate
of heating to 200 oC should not be more than 10 oC/h [7]. These requirements are satisfied by
baking procedure given in table 2. It may be concluded that anodes on pitch A are more crack-
resistant than anodes on pitch B. This may due both to lower content of volatiles and higher
content of QI in pitch A. There is literature evidence on effect of amount of pitch coking gas on
cracking during baking [5, 6, 7]. However the effect of quinoline insolubles on crack resistance
of anode blocks has not been discussed. This problem is valid for further investigation.
REFERENCES
1. P. Rhedey, Laboratory evaluation of a low Quinoline Insolubles coal-tar pitch as anode
binder, Light Metals 1990, 1990, p. 605–608.
2. Robert H. Wombles, John Thomas Baron, Laboratory Anode Comparison of Chinese
Modified Pitch and Vacuum Distilled Pitch, Light Metals 2006, 2006, 535–540.
3. Wombles, Robert H., Sadler, Barry, «The Effect Of Binder Pitch Quinoline Insolubles
Content On Aluminum Anode Physical Properties,» 8th Australasian Aluminum Smelting
Technology Conference, September 2004.
4. Zhuchkov S. S. et al., Laboratory vibrocompactor test and optimization of anode
block vibrating compaction parameters, «Aluminum of Siberia 2009», 2009.
5. Meier M. W. Cracking Behavior of Anodes, R&DCarbon Ltd., 2000.
6. M. Jarry (1977), «Elaboration des Anodes Precuites en Carbone Agglomere pour 1’Industrie
de 1’Aluminium», Ph. D. thesis, l’universite scientifique et medicale de Grenoble, France.
7. R. C. Perruchoud (1992 b), «Impact of the Forming and Baking Conditions on the Anode
Cracking During the Baking», RDC report A-1277, (unpublished results of a private study carried
out for an RDC customer).

336
The Second International Congress «Non-Ferrous Metals – 2010», September 2–4, Krasnoyarsk, RussiaThe Second International Congress «Non-Ferrous Metals – 2010», September 2–4, Krasnoyarsk, Russia • Part VI • Aluminium Reduction Technology• Part VI • Aluminium Reduction Technology
Introduction
Ever changing market environment necessitate diversification of petroleum coke scope
used to produce anode paste and baked anodes. As the quality of produced oil tends to deterio-
rate the part of coke with high sulfur content involved in production increases. Experience of
petroleum coke utilization in recent 10–15 years allows to make a conclusion about negative im-
pact on sulfur content on Soderberg anodes – SO2 emission increases, stud corrosion acceler-
ates, impurities in the metal increases and contaminates and reduces its grade. Effect of sulfur
content and other impurities on baked anode technology, their impact on the quality of anodes
and electrolysis process are covered in detail in numerous publications of foreign authors.
Historically to produce baked anodes OJSC «RUSAL Sayanogorsk» used coke with fairly
low sulfur content more than two times higher than ordinary level. The paper presents results
of tests – effect of higher sulfur content on quality of baked anodes, on cell performance, and
makes an attempt to interpret the produced results and consequences caused by variation of sul-
fur content and other impurities in baked anodes from the standpoint of knowledge available.
Review of foreign experience
As predicted decade ago [1], currently anode coke of proper quality is deficient. Lower
quality affects, first of all, one of key characteristics – purity – which determined fitness of coke
for production of anode paste/baked anodes. Fraction of cokes with increased content of sul-
fur and impurities increases. The reason is well known – the quality of crude oil delivered for
refining continues deteriorating; high-sulfur compounds are more available and cheaper than
paraffin-base crude oil with low sulfur content. Inorganic chemical impurities in crude oil not
removed by desalination remain in the coke, unless (in rare cases) an oil refinery possesses
desulfurization/demineralization techniques. Metals and sulfur not removed accumulate in the
sediment flow and after baking process – in the coke. Therefore, content of metal impurities in
crude oil (vanadium, in particular) generally grows in proportion with sulfur content.
Issues of high-sulfur coke utilization in foreign enterprises are generally reduced to the
following lines:
– determination of optimum patterns of blending cokes with different sulfur content;
– search for engineering solution to reduce thermal desulfurization in calcination of green
coke and anode baking.
Most aluminum enterprises use the coke blending method. Cokes can be blended in coke
calcinations, immediately in anode production or both methods can be combined. To meet envi-
ronmental requirements to SO2 emissions the high sulfur content can be set off by blending with
low-sulfur cokes. As a result cokes used in blending may considerably differ by sulfur content.
E. g. [2], to make sulfur content in total coke 2.5–3.0 % coke with sulfur content 1–2 % can be
blended with coke with sulfur content 4–6 %.
Principles of selecting optimum patterns to blend calcined coke with different sulfur con-
tent tested under laboratory and industrial conditions are published in several works:
1. Alcoa Deschambault [3, 4] – their avenue of attack on the problem was to chose size dis-
tribution, proceeding from the hypothesis that the coke formed by pitch (binder) pyrolisis tends
most to react in CO2. Greater part of pitch is used to bind finer coke fractions, consequently, the
dust fractions have more close contact with coke from pitch. Otherwise coke with high sulfur
content in the dust fraction «closer» to pitch coke should lower its reactivity. Redistribution in
the total composition of the anode aggregate low-sulfur coke into coarse gractions and increase
EXPERIENCE OF HIGH-SULFUR COKES UTILIZATION IN BAKED ANODE PRODUCTION
V.M. Polovnikov 1, I.V. Cherskikh 1, E.A. Startsev 2
1 Aluminum Technology Directorate, RUSAL ETC Ltd., Krasnoyarsk, Russia2 Technology Department PP, RUSAL ETC Ltd., Sayanogorsk, Russia

337
The Second International Congress «Non-Ferrous Metals – 2010», September 2–4, Krasnoyarsk, RussiaThe Second International Congress «Non-Ferrous Metals – 2010», September 2–4, Krasnoyarsk, Russia • Part VI • Aluminium Reduction Technology• Part VI • Aluminium Reduction Technology
of high-sulfur coke in the dust fractions increases the probability of sulfur to inhibit effect of
sodium and reduce anode reactivity in CO2. This was proved in laboratory and industrial tests in
production and operation of anodes.
2. Albras [5] – two cokes from different suppliers were blended for optimum aggregate.
Formulation (weight ratio) of coke blending providing for required quality performance of
baked anodes, not below than in «monocoke» mode operation was found.
Both works emphasize that selection of aggregates cannot be limited to the principle of
averaging impurity content and reducing carboxy reactivity of the anodes. E. g. [3], if low-sulfur
coke with low density is blended with high-sulfur coke with high density the density of final
mixture for the anode will decrease when material with higher density (and sulfur) is fed into
the to the dust milling system.
Loss of dust during calcinations of petroleum coke is an obvious phenomenon and is general-
ly mentioned as thermal desulfurization or merely desulfurization. Numerous study evidence [2],
that the loss of sulfur increases both with calcination temperature and with initial sulfur content in
the coke. Desulfurization of coke in calcinations increases its microporosity and affects such prop-
erties as actual density and reactivity. Further desulfurization takes place in anodes by prolonged
soaking during baking [2, 3, 6]. Desulfurization of baked anodes is an important factor affecting
chemical reactivity of the anodes. This process is considered [6] to increase the chemically reac-
tive surface area of the anodes. Any loss of sulfur atoms in the anode structure creates additional
surface area to help gas react with greater number of anodes’ carbon atoms. In addition, the con-
tent of sulfur which is known [7, 8] to inhibit the Boudoir reaction, decreases. With catalyst con-
tent (first of all, Na) invariable this reduction increases reactivity of anode.
Special attention is paid to calcination degree of green coke «overcalcination» should be
avoided [2]. Partial disruption or break-down of bonds between carbon and sulfur during calci-
nations may bring forth destabilized structure more apt for desulfurization during anode bak-
ing, too. According to available information [2], some enterprises revise specifications to reduce
operating requirements to actual density of coke (2.00–2.05 g/cm 3) to produce baked anodes.
Article [6] presents results of work performed in 2007–2009 at Alba smelter to minimize
desulfurization during baking, too. Actual practice showed that to manage desulfurization by
lowering the baking degree is one of the lines to decrease dust formation and carbon consump-
tion on cells with elevated amperage.
Industrial utilization of high-sulfur coke
Industrial tests of high-sulfur coke used to produce baked anodes OJSC «RUSAL
Sayanogorsk» pursued the following technological goals:
– to assess impacts on quality characteristics of anodes;
– to select optimum involvement patterns, among them – blending with other cokes;
– assess results of industrial use in anode production and their operation in electrolysis.
Effect of impurities on coke performance
Tests were carried out with «Slantsy» high-sulfur coke. This conditionally denotes high-sulfur
coke made in Russia – OJSC «NuNPZ» («НуНПЗ») and OJSC «Ufaneftekhim» («Уфанефтехим»),
calcined at OJSC «Zavod «Slantsy» («Завод «Slantsy»).
Results of quality analysis of coke under consideration compared to quality characteristics
of typecal cokes used at OJSC «RUSAL Sayanogorsk», are given in table 1.
Tests of this coke showed the following: sulfur content is more than double of the typical
level; content of vanadium is up to 0.1 %; like all high-sulfur cokes it is specified by high content
of nickel; very high content of iron and silicon. On the whole the sum of contents of all impuri-
ties is more than two time higher than the typical average level.
One of the highest content of catalytic impurities – Na and Ca notwithstanding, «Slantsy»
cokes have the lowest reactivity in CO2 among the cokes under consideration – 7.9 % on the
average (fig. 3).
The flash point is, at this, among the lowest, which is indicative of relatively high reactiv-
ity in air.
The results on content of impurities and reactivity are in good agreement with generally
accepted standing [7, 8] about effect of coke purity on its reactivity in СО2 and air.

338
The Second International Congress «Non-Ferrous Metals – 2010», September 2–4, Krasnoyarsk, RussiaThe Second International Congress «Non-Ferrous Metals – 2010», September 2–4, Krasnoyarsk, Russia • Part VI • Aluminium Reduction Technology• Part VI • Aluminium Reduction Technology
Table 1
Quality characteristics of cokesSlantsy ONPZ Gaocheng VNPZ TianLi NovEZ-
ONPZ
NovEZ-
ONPZ
Atyrau Average
Real density, g/cm 3
Average 2.079 2.089 2.079 2.077 2.078 2.078 2.083 2.100 2.080
Stand. dev. 0.012 0.008 0.011 0.011 0.012 0.014 0.009 0.009 0.012
Spec. el.res. Ω⋅mm 2/m
Average 493 475 472 472 472 492 481 490 479
Stand. dev. 32 19 21 30 24 10 28 10 26
Ash content, %
Average 0.67 0.15 0.44 0.16 0.40 0.25 0.19 0.26 0.44
Stand. dev. 0.13 0.06 0.19 0.04 0.18 0.06 0.06 0.04 0.23
Sulfur con-tent, %
Average 3.18 1.19 1.40 1.50 0.98 1.34 1.48 1.50 1.76
Stand. dev. 0.21 0.05 0.13 0.04 0.16 0.06 0.07 0.09
Content, %:
Fe Average 0.094 0.034 0.072 0.026 0.058 0.046 0.036 0.052 0.067
Stand. dev. 0.032 0.065 0.042 0.008 0.042 0.027 0.013 0.012 0.043
Si Average 0.065 0.025 0.051 0.008 0.049 0.032 0.018 0.009 0.048
Stand. dev. 0.026 0.008 0.037 0.005 0.030 0.007 0.008 0.003 0.033
Na Average 0.011 0.006 0.010 0.012 0.005 0.011 0.012 0.028 0.010
Stand. dev. 0.004 0.002 0.003 0.002 0.002 0.008 0.003 0.006 0.006
Ca Average 0.018 0.004 0.029 0.006 0.034 0.010 0.010 0.020 0.023
Stand. dev. 0.015 0.002 0.009 0.003 0.018 0.004 0.005 0.004 0.017
V Average 0.107 0.015 0.018 0.020 0.017 0.018 0.020 0.020 0.045
Stand. dev. 0.017 0.001 0.004 0.002 0.004 0.002 0.002 0.004 0.042
Ni Average 0.0384 0.0126 0.0291 0.0131 0.0194 0.0117 0.0127 0.0242 0.0262
Stand. dev. 0.0068 0.0019 0.0035 0.0022 0.0019 0.0021 0.0021 0.0052 0.0105
Ti Average 0.0017 0.0002 0.0010 0.0006 0.0008 0.0004 0.0004 0.0007 0.0010
Stand. dev. 0.019 0.0001 0.0003 0.0003 0.0005 0.0002 0.002 0.0005 0.0012
Fraction content, %
+6.0 mm Average 39.3 24.8 45.1 32.1 33.9 15.7 30.3 32.8 35.3
Stand. dev. 10.5 7.6 7.5 11.9 5.0 7.9 15.0 9.3 11.3
-6.0+1.0 mm Average 36.7 44.0 34.1 37.0 36.6 37.6 38.9 34.3 37.0
Stand. dev. 5.6 4.6 4.5 5.7 2.9 6.1 6/9 4.9 5.6
-1.0 mm Average 24.0 31.2 20.8 30.9 29.5 46.8 30.9 32.9 27.7
Stand. dev. 6.5 6.7 3.9 9.1 4.8 14.0 13.1 5.8 8.6
Bulk density, g/cm 3
Average 0.95 0.80 0.85 0.92 0.90 0.82 0.86 0.84 0.88
Stand. dev. 0.07 0.05 0.02 0.05 0.02 0.03 0.04 0.01 0.07
Carboxy reac-tivity, %
Average 7.9 9.7 18.0 16/6 14.9 14.8 17.3 35.7 14.6
Stand. dev. 2.1 1.3 2.9 1.3 4.1 4.0 2.0 5.3 7.9
Flash point, oC
Average 589 599 602 586 632 596 589 585 601
Stand. dev. 12 13 15 17 22 12 8 3 23
Reactivity in air, %min
Average 0.51 0.38 0.35 0.59 0.14 0.41 0.50 0.56 0.40
Stand. dev. 0.19 0.18 0.17 0.19 0.22 0.15 0.11 0.07 0.24
Fig. 1. Sulfur content in cokes Fig. 2. Impurity content in cokes

339
The Second International Congress «Non-Ferrous Metals – 2010», September 2–4, Krasnoyarsk, RussiaThe Second International Congress «Non-Ferrous Metals – 2010», September 2–4, Krasnoyarsk, Russia • Part VI • Aluminium Reduction Technology• Part VI • Aluminium Reduction Technology
Presence of sulfur is known to counteract catalytic behavior or sodium. Hume et al. [7] showed
that reaction of sulfur with sodium retards its catalytic behavior. Consequently, carboxy reactivity
and dusting of cokes with higher sulfur content and anodes made on its basis will be lower.
Paper [3] gives the following dependence of carboxy reactivity of coke on content of cata-
lytic impurities Na and Ca and inhibitor – S (fig. 5).
Analysis of measured reactivity of coke in СО2 as a function of calculated ratio (Na+Ca)/S
proves this dependence (fig. 6). Due to higher sulfur content reactivity of «Slantsy» coke with
Na+Ca content 3–4 times more than ONPZ (ОНПЗ) coke is at the same level and even lower.
Extreme data produced for other cokes are even more convincing about the effect of sulfur con-
tent (with respect to concentration of catalytic impurities. Na content in Atyrau coke – with typi-
cal content of S and Ca – is on the average 2–3 times higher, its reactivity is, at this, the highest
among all cokes –35 % on the average. Approximately analogous is the situation with TianLi
coke – reactivity is above average with the lowest sulfur content.
Hume in his work [7] on the basis of statistical analysis and examination of numerous
cokes derived regression equations which make possible to forecast effect of coke purity (con-
tent of impurities) on its reactivity in СО2 and in air:
; (1)
, (2)
where RCO2 is the reactivity in СО2 ( %), calculated for known purity
Tig is the flash point calculated for known purity of coke of average structure and porosity.
Accuracy of coefficients is ±15 %.
Fig. 3. Reactivity of cokes in СО2
Fig. 5. Residue of reaction (reactivity in CO2)
vs. content of Na, Ca and S [3]
Fig. 4. Flash point of cokes in air
Fig. 6. Reactivity of cokes in
СО2 vs. (Na+Ca)/S ratio

340
The Second International Congress «Non-Ferrous Metals – 2010», September 2–4, Krasnoyarsk, RussiaThe Second International Congress «Non-Ferrous Metals – 2010», September 2–4, Krasnoyarsk, Russia • Part VI • Aluminium Reduction Technology• Part VI • Aluminium Reduction Technology
Comparison of actual reactivity in СО2 and in air with predicted values on the basis of these
regularities is given in figures 7, 8. So, the actual data on qualitative performance of «Slantsy»
high-sulfur coke – high reactivity in СО2 and high reactivity in air with considerable content
of impurities (catalytic impurities including) – are in good agreement with the known state-
ments about effect of coke impurity. Accordingly it may be argued that anodes made from this
coke wil exhibit high carboxy reactivity (CRR) due to inhibiting effect of sulfur, but ARR (reac-
tivity in air) will, on the contrary, be lower due to catalytic effect of vanadium.
Anode production
Initially «Slantsy» coke was used in its «pure» form as a monocoke. Proceeding from the
principle of taking for blending cokes with close porosity values and volume-strength properties
later a decision was made to use it in a mixture with the lowest-sulfur coke – TianLi (at the ratio
of 50/50). With the use of «Slantsy, TianLi cokes and their mixtures to produce «green» anodes
demand for the binder was found to be fairly low (on the average 0.5 % below the ordinary
cokes), which is indirectly indicative of their modest porosity. This is also proved by analysis of
bulk density (table 1): Slantsy – 0.92 g/cm 3, TianLi – 0.90 g/cm 3, with typical level for other
cokes – 0.8–0.9 g/cm 3. At the same time from the viewpoint of positive impact of sulfur on re-
duction of carboxy reactivity acceptable for blending could be Atyrau coke specified by consider-
able content of sodium. However porosity of this coke is considerably higher (binder demand is
1–1.5 % higher). «Green» anodes pressed with use of a mixture of cokes with such a great dif-
ference in pitch capacity were predicted to have destabilized apparent density and, accordingly,
quality characteristics of baked anodes.
Process variables of «green» anode production from high-sulfur coke both as part of mix-
ture and in «pure» form were ensured in compliance with prescribed requirements and satisfied
the average level for the production of «green» anodes from typical cokes.
Quality indicators of «green» anodes made from the cokes under consideration are com-
pared with quality characteristics of anodes from typical cokes in table 2.
Content of impurities in «green» anodes made from «Slantsy», TianLi cokes and their mix-
tures is on the whole in agreement with average level in initial cokes. However, it stands out that
the content of Fe and Na in all anodes does not agree with the initial content in the coke. The
reason is the input of these impurities with returned butts. E. g. from the start of tests (Na+Ca)
content in recycled butts with 0.05–0.06 % increased to 0.07–0.08 %.
Experimental anodes were baked by typical baking schedule. Quality characteristics of
baked anodes, made from the coke under consideration compared to anodes from typical cokes
are presented in table 3.
As predicted, CRR values (fig. 9) in baked anodes made from high-sulfur coke was the high-
est, reactivity in air (ARR) on the contrary – the lowest. According to empirical dependencies
(1) and (2), the highest impact on CRR was to be by (Na+Ca)/S ratio, on ARR – by total sum of
Na+V. Calculated average values of these indices (by actual content of impurities) formed the
basis to define their impact of reactivity for the anodes from different cokes (fig. 11, 12).
Fig. 7. Actual and predicted (by formula 1)
carboxy reactivities of cokes
Fig. 8. Actual and predicted (by formula 2)
flash point of cokes in air

341
The Second International Congress «Non-Ferrous Metals – 2010», September 2–4, Krasnoyarsk, RussiaThe Second International Congress «Non-Ferrous Metals – 2010», September 2–4, Krasnoyarsk, Russia • Part VI • Aluminium Reduction Technology• Part VI • Aluminium Reduction Technology
Table 2
Quality characteristics of «green» anodes
Slantsy Slantsy + TianLi
TianLi Gaocheng ONPZ VNPZ Atyrau Average
Real density, g/cm 3 Average 1.836 1.837 1/835 1.818 1.836 1.836 1.843Stand. dev. 0.013 0.014 0.012 0.017 0.015 0.016 0.012 1.833
Apparent density, g/cm 3
Average 1.692 1.687 1.685 1.684 1.676 1.679 1.680 0.017Stand. dev. 0.025 0.022 0.024 0.025 0.027 0.027 0.025 0.026
Porosity, % Average 8.2 81 7.8 7.4 8.6 8.5 9.2 8.3Stand. dev. 1.9 1.6 1.6 1.5 1.6 1.9 1.5 1.7
Compressive strength, kgs/cm 2
Average 348 333 367 353 355 367 353 354Stand. dev. 61 66 66 59 66 67 83 65
Ash content, % Average 0.61 0.53 0.48 0.40 0.31 0.32 0.37 0.37Stand. dev. 0.10 0.06 0.07 0.12 0.10 0.09 0.06 0.13
Content, %Fe Average 0.073 0.074 0.089 0.057 0.044 0.049 0.066 0.054
Stand. dev. 0.013 0.012 0.028 0.018 0.012 0.012 0014 0.019Si Average 0.051 0.041 0.033 0.026 0.023 0.017 0.014 0.025
Stand. dev. 0.012 0.014 0.008 0.007 0.006 0.006 0.005 0.012V Average 0.056 0.040 0.015 0.013 0.014 0.016 0.022 0.019
Stand. dev. 0.010 0.008 0.003 0.003 0.003 0.003 0.007 0.012Na Average 0.033 0.31 0.024 0.026 0.027 0.030 0.040 0.029
Stand. dev. 0.012 0.008 0.007 0.017 0.014 0.011 0.010 0.013Ca Average 0.018 0.019 0.025 0.021 0.010 0.011 0.016 0.014
Stand. dev. 0.009 0.004 0.003 0.003 0.003 0.003 0.002 0.006Na + Ca Average 0.052 0.060 0.050 0.047 0.037 0.041 0.056 0.043
Stand. dev. 0.017 0.011 0.007 0.018 0.015 0.013 0.012 0.016
Table 3
Quality characteristics of baked anodes
Slantsy TianLi Slantsy + TianLi
Gaocheng ONPZ VNPZ Atyrau Average
Real density, g/cm 3
Average 2.085 2.083 2.088 2.083 2.089 2.09 2.090 2.087Stand. dev. 0.014 0.012 0.011 0.011 0.012 0.012 0.011 0.012
Apparent density, g/cm 3
Average 1.592 1.586 1.586 1.580 1.571 1.580 1.576 1.579Stand. dev. 0.026 0.025 0.024 0.023 0.026 0.027 0.022 0.026
Spec. el.res.
Ω⋅mm 2/m
Average 54/3 52.7 52.8 53.4 53.0 51.9 53.3 52.6Stand. dev. 2.42 2.11 2.46 2.12 2.23 2.12 1.65 2.29
Compressive strength,kgs/cm 2
Average 410 436 414 401 399 424 430 413Stand. dev. 51 63 61 56 54 59 57 59
CRR, % Average 90.3 81.8 87.8 84.6 86.9 85.8 84.6 86.1Stand. dev. 4.2 4.0 4.0 3.6 3.1 3.3 3.4 3.2
CRD, % Average 2.9 6.3 3.7 4.9 3.7 4.2 4.3 4.1Stand. dev. 2.1 2.8 2.4 2.6 1.7 2.0 1.4 2.2
CRL, % Average 6.8 11.9 8.5 10.5 9.4 10.1 11.2 9.7Stand. dev. 2.4 2.1 2.4 2.0 1.9 2.1 2.7 2.3
ARR, % Average 62.1 74.2 65.9 75.2 72.0 69.2 70.2 70.4Stand. dev. 4.4 7.9 6.4 7.7 6.4 5.8 4.8 7.0
ARD, % Average 11.4 8.5 10.4 7.4 7.1 8.3 8.1 8.2Stand. dev. 3.7 5.1 4.3 5.4 4.1 4.2 2.7 4.5
ARL, % Average 26.6 17.3 23.6 17.4 20.9 22.6 21.7 21.4Stand. dev. 3.3 3.6 3.6 3.4 3.5 3.0 2.9 4.0
Ash content, % Average 0.62 0.50 0.54 0.40 0.34 0.37 0.39 0.40Stand. dev. 0.14 0.09 0.10 0.09 0.09 0.12 0.07 0.13
Sulfur content, % Average 2.01 1.14 1.63 1.25 1.18 1.31 1.28 1.32Stand. dev. 0.27 0.20 0.16 0.09 0.09 0.11 0.06 0.22
Content, %Fe Average 0.081 0.100 0.082 0.070 0.055 0.062 0.079 0.067
Stand. dev. 0.021 0.038 0.019 0.020 0.019 0.017 0.019 0.023Si Average 0.061 0.034 0.037 0.026 0.025 0.020 0.013 0.026
Stand. dev. 0.018 0.011 0.017 0.008 0.011 0.010 0.005 0.014V Average 0.052 0.017 0.040 0.017 0.016 0.019 0.019 0.021
Stand. dev. 0.009 0.007 0.011 0.006 0.004 0.004 0.001 0.011Na Average 0.033 0.027 0.029 0.025 0.025 0.031 0.034 0.029
Stand. dev. 0.012 0.010 0.009 0.010 0.010 0.014 0.011 0.012Ca Average 0.026 0.031 0.026 0.026 0.016 0.018 0.019 0.020
Stand. dev. 0.021 0.005 0.007 0.005 0.006 0.007 0.004 0.009Na + Ca Average 0.059 0.058 0.055 0.051 0.042 0.049 0.053 0.049
Stand. dev. 0.027 0.012 0.014 0.013 0.014 0.019 0.015 0.017

342
The Second International Congress «Non-Ferrous Metals – 2010», September 2–4, Krasnoyarsk, RussiaThe Second International Congress «Non-Ferrous Metals – 2010», September 2–4, Krasnoyarsk, Russia • Part VI • Aluminium Reduction Technology• Part VI • Aluminium Reduction Technology
On the basis of calculated dependencies (fig. 11–12) it is possible to explain differences in the
reactivity of anodes made from different cokes. Most different are the anodes from «nontypical»
anodes – Atyrau, «Slantsy» и TianLi. Atyrau coke in spite of considerable sodium content features
average values of (Na+Ca)/S and Na+V, therefore, the results of CRR and ARR of the anodes are
also at average acceptable level. TianLi coke with low Na+V exhibits the highest (Na+Ca)/S ratio –
due to the lowest sulfur content, АRR values, are, accordingly high and СRR values are the lowest.
Opposite is the result for anodes from high-sulfur «Slantsy» coke. Average values (Na+Ca)/S and
Na+V obtained by blending «Slantsy» and TianLi cokes made possible to have average acceptable
level of CRR and ARR in the anodes.
Among positive effects of using «Slant-
sy» coke and mixture is lack of baking ad-
hesion of packing material on the surface of
baked anodes.
This is connected with low coke poros-
ity (low binder content in the initial anode
paste); decreased release of pitch on the an-
ode surface during baking making the pack-
ing material adhere to the baked anode.
Baked anodes in electrolysis
Experimental anodes from high-sulfur
coke («Slantsy»), low-sulfur coke (TianLi)
and their mixture were used in different
potrooms. Table 4 shows potrooms, opera-
Fig. 9. Residue of reaction in СО2 (CRR)
in baked anodes in 2009
Fig. 10. Residue of reaction in in air (ARR)
in baked anodes in 2009
Fig. 11. CRR of baked anodes vs. (Na+Ca)/S
ratio in them
Fig. 12. ARR of baked anodes vs. Na+V
sum in them
Fig. 13. Baked anodes from Slantsy coke

343
The Second International Congress «Non-Ferrous Metals – 2010», September 2–4, Krasnoyarsk, RussiaThe Second International Congress «Non-Ferrous Metals – 2010», September 2–4, Krasnoyarsk, Russia • Part VI • Aluminium Reduction Technology• Part VI • Aluminium Reduction Technology
tion periods and basic process performance of experimental anodes. To compare, figures of pot-
rooms (potlines 3, 4), which used anodes made from typical cokes are given.
Table 4
Operation performance of potrooms
Experimental anodes were found to scorch somewhat more at «packing material – anode»
interface during the period of 1–9 days after setting on the cell (quite logical, taking into account
low ARR of the anodes). Oxidation, at this, was uniform without considerable sloughing.
On the whole performance of potrooms (anode consumption, skimming) where the anodes
with high-sulfur coke did not differ much from performance of potrooms with typical anodes.
Major problem in operating anodes made with high-sulfur «Slantsy» coke, is elevated con-
tent of vanadium impurities. From the start of setting anodes made with this coke average vana-
dium content in raw aluminum increased from 0.008 % to 0.016 % (fig. 15).
Vanadium content in raw aluminum increased both in the potrooms with experimental an-
odes (up to 0.02 % on the average), and in other rooms with typical anodes (up to 0.013 %).
Technological flow diagram of anode production does not provide for separation of involved
butts, therefore, their input gradually increases impurity content (fig. 17) in all produced anodes
(fig. 16). Besides, the high-sulfur cokes in addition to high vanadium content are known [7, 9],
to have considerable level of Ni, which is proved by input control (table 1). In baked anodes Ni
content was not measured, however, analysis of raw aluminum during the test period its concen-
tration increased by 10 ppm on the average.
Fig. 15. V content variation in raw aluminum in potrooms

344
The Second International Congress «Non-Ferrous Metals – 2010», September 2–4, Krasnoyarsk, RussiaThe Second International Congress «Non-Ferrous Metals – 2010», September 2–4, Krasnoyarsk, Russia • Part VI • Aluminium Reduction Technology• Part VI • Aluminium Reduction Technology
In addition to known impact on cell operation growing concentrations of impurities in the
metal affect the quality of finished product made by casthouses. Thus, increased vanadium con-
tent has negative effect on strength properties of aluminum; potential problems with thermal
treatment during rolling arise. Principal harmful effect of vanadium is decreasing electric con-
ductivity of aluminum [9]. It must be removed from the metal used in electrical engineering
products. This makes necessary to correct the nomenclature of produced alloys or their specifi-
cations, or treat the metal with boron-containing master alloy.
Consequences of V and Ni increase in the metal by «input» from the anodes and a strategy
of their minimization are considered in more detail in [9].
Conclusion
1. Industrial tests made possible to make a conclusion about feasibility of using high-sulfur
coke to produce baked anodes. Contrary to Содерберг technology, the role of sulfur in baked
anodes is more positive reducing the effect of catalytic impurities (Na, Ca), whose content due
to return of butts into production as by an order higher than in the self-baked anodes. This mani-
fests in considerable increase of anode carbon resistivity in СО2 (CRR). However the negative
effect is connected with reactivity of anode in air – decrease of ARR. The reason is catalytic effect
of elevated vanadium content in reaction of carbon with air.
2. Statistical analysis of impurity content in the anodes made from different cokes made
possible to conclude a regularity of their effect on carboxy and air reactivity of anodes. Specifi-
cally, CRR is affected by the ratio of content of impurities – (Na+Ca)/S, ARR is mostly affected
by the sum of contents V+Na. Hence, these dependencies can be practically used:
– to involve cokes with different purity (impurity content); with account of impurity input
balance at production stages it is possible to predict reactivity of produced anodes.
– initial value of these variables considered, to select a combination of aggregates to
provide for acceptable quality of baked anodes.
– to predict optimum fraction of returns to be involved.
3. In industrial tests the selected aggregate made possible to level out individual negative
properties of each coke and ensure acceptable quality of baked anodes, made on the basis of
their mixture. Critically important is to observe one more principle of aggregate selection – con-
sistency of structural properties of cokes to be blended – identical bulk density (porosity charac-
teristic) and, accordingly, similar demand for binder content.
4. Performance of anodes from high-sulfur coke and its mixtures in potrooms did not show
much difference (anode consumption, skimming) from potrooms operating typical anodes.
5. The most considerable problem which is capable of constraining mass application of
high-sulfur coke for production of baked anodes is the purity of coke as it is. Considerable con-
tent of impurities (V, Fe, Si, Ni) attendant to high-sulfur cokes is a great challenge for the purity
of raw aluminum and production of alloys of required nomenclature.
Fig. 16. V content in baked anodes Fig. 17. V content in butts

345
The Second International Congress «Non-Ferrous Metals – 2010», September 2–4, Krasnoyarsk, RussiaThe Second International Congress «Non-Ferrous Metals – 2010», September 2–4, Krasnoyarsk, Russia • Part VI • Aluminium Reduction Technology• Part VI • Aluminium Reduction Technology
REFERENCES
1. F. Vogt, R. Tonti, L. C. Edwards. Global Trends in Anode Grade Coke Availability & Qual-
ity for the Australasian Aluminium Industry. Proc. 7th Aust. Al Smelting Workshop 2001.
2. L. C. Edwards, K. J. Neyrey, L. P. Lossius. A Review of Coke and Anode Desulfurization.
Light Metals, 2007, р. 895–900.
3. A. Adams, R. Cahill, Y. Belzile, K. Cantin, M. Gendron. Minimizing Impact of Low Sulfur
Coke on Anode Quality. Light Metals, 2009, р.957–962.
4. M. Gendron, S. Whelan, K. Cantin. Coke Blending and Fines Circuit Targeting at the Al-
coa Deschambault Smelter. Light Metals, 2008, р. 861–864.
5. A. S. Gomes и R. M. Heilgendorff. Carbon Plant Performance with Blended Coke. Light
Metals, 2005, р.659–663.
6. H. Abbas, K. Khaji, D. Sulaiman. Desulphurization Control during Anode Baking, its Im-
pact on Anode Performance and Operational Costs-Alba’s Experience. Light Metals, 2010, р.
1011–1014.
7. S. M. Hume «Anode Reactivity», R&D Carbon Ltd.1999, 455 p.
8. M. Sorlie, Z. Kuang, J. Thonstad. Effect of Sulfur on Anode Reactivity and Electrolytic
Consumption. Light Metals, 1994, p.659–665.
9. J. F. Grandfield, J. A. Taylor. The Downstream Consequences of Rising Ni and V Concen-
trations in Smelter Grade Metal and Potential Control Strategies. Light Metals, 2009, р.1007–
1011.
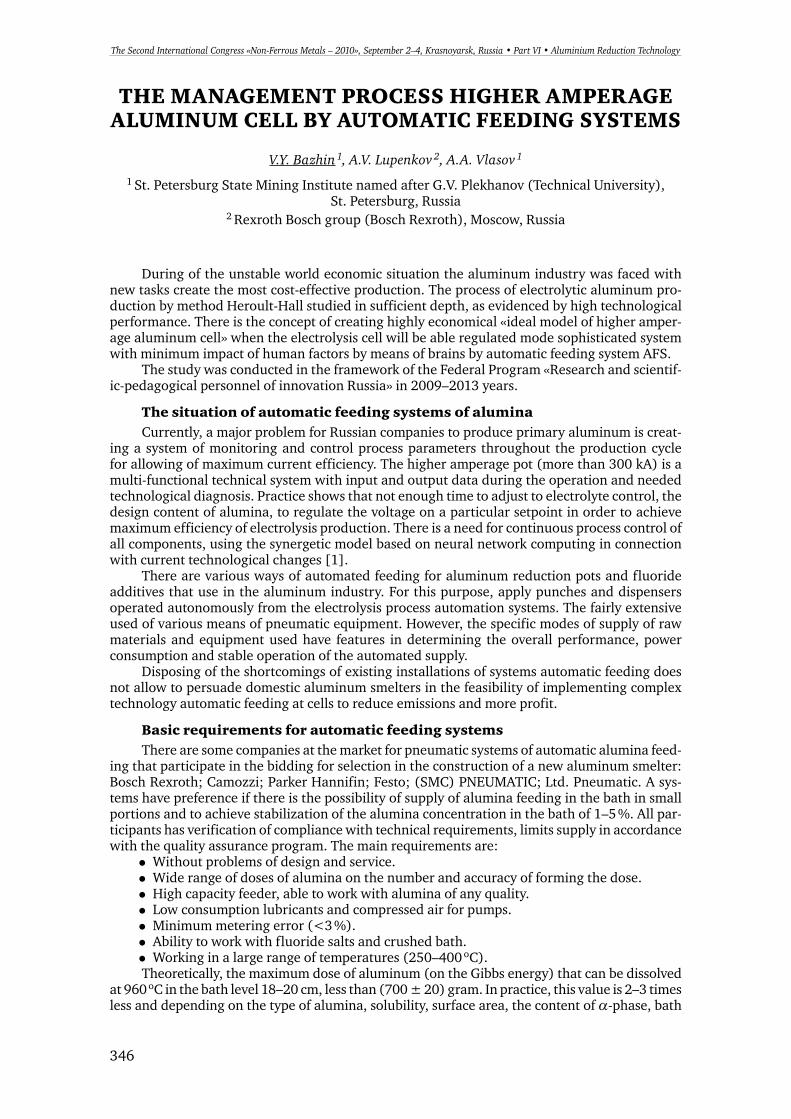
346
The Second International Congress «Non-Ferrous Metals – 2010», September 2–4, Krasnoyarsk, RussiaThe Second International Congress «Non-Ferrous Metals – 2010», September 2–4, Krasnoyarsk, Russia • Part VI • Aluminium Reduction Technology• Part VI • Aluminium Reduction Technology
During of the unstable world economic situation the aluminum industry was faced with
new tasks create the most cost-effective production. The process of electrolytic aluminum pro-
duction by method Heroult-Hall studied in sufficient depth, as evidenced by high technological
performance. There is the concept of creating highly economical «ideal model of higher amper-
age aluminum cell» when the electrolysis cell will be able regulated mode sophisticated system
with minimum impact of human factors by means of brains by automatic feeding system AFS.
The study was conducted in the framework of the Federal Program «Research and scientif-
ic-pedagogical personnel of innovation Russia» in 2009–2013 years.
The situation of automatic feeding systems of alumina
Currently, a major problem for Russian companies to produce primary aluminum is creat-
ing a system of monitoring and control process parameters throughout the production cycle
for allowing of maximum current efficiency. The higher amperage pot (more than 300 kA) is a
multi-functional technical system with input and output data during the operation and needed
technological diagnosis. Practice shows that not enough time to adjust to electrolyte control, the
design content of alumina, to regulate the voltage on a particular setpoint in order to achieve
maximum efficiency of electrolysis production. There is a need for continuous process control of
all components, using the synergetic model based on neural network computing in connection
with current technological changes [1].
There are various ways of automated feeding for aluminum reduction pots and fluoride
additives that use in the aluminum industry. For this purpose, apply punches and dispensers
operated autonomously from the electrolysis process automation systems. The fairly extensive
used of various means of pneumatic equipment. However, the specific modes of supply of raw
materials and equipment used have features in determining the overall performance, power
consumption and stable operation of the automated supply.
Disposing of the shortcomings of existing installations of systems automatic feeding does
not allow to persuade domestic aluminum smelters in the feasibility of implementing complex
technology automatic feeding at cells to reduce emissions and more profit.
Basic requirements for automatic feeding systems
There are some companies at the market for pneumatic systems of automatic alumina feed-
ing that participate in the bidding for selection in the construction of a new aluminum smelter:
Bosch Rexroth; Camozzi; Parker Hannifin; Festo; (SMC) PNEUMATIC; Ltd. Pneumatic. A sys-
tems have preference if there is the possibility of supply of alumina feeding in the bath in small
portions and to achieve stabilization of the alumina concentration in the bath of 1–5 %. All par-
ticipants has verification of compliance with technical requirements, limits supply in accordance
with the quality assurance program. The main requirements are:
• Without problems of design and service.
• Wide range of doses of alumina on the number and accuracy of forming the dose.
• High capacity feeder, able to work with alumina of any quality.
• Low consumption lubricants and compressed air for pumps.
• Minimum metering error (<3 %).
• Ability to work with fluoride salts and crushed bath.
• Working in a large range of temperatures (250–400 оС).
Theoretically, the maximum dose of aluminum (on the Gibbs energy) that can be dissolved
at 960 оС in the bath level 18–20 cm, less than (700 ± 20) gram. In practice, this value is 2–3 times
less and depending on the type of alumina, solubility, surface area, the content of α-phase, bath
THE MANAGEMENT PROCESS HIGHER AMPERAGE ALUMINUM CELL BY AUTOMATIC FEEDING SYSTEMS
V.Y. Bazhin 1, A.V. Lupenkov 2, A.A. Vlasov 1
1 St. Petersburg State Mining Institute named after G.V. Plekhanov (Technical University),
St. Petersburg, Russia2 Rexroth Bosch group (Bosch Rexroth), Moscow, Russia

347
The Second International Congress «Non-Ferrous Metals – 2010», September 2–4, Krasnoyarsk, RussiaThe Second International Congress «Non-Ferrous Metals – 2010», September 2–4, Krasnoyarsk, Russia • Part VI • Aluminium Reduction Technology• Part VI • Aluminium Reduction Technology
ratio, temperature and velocity of circulation of the melt and concentration in its previously dis-
solved alumina. If alumina has a low solubility of in the bath it current efficiency is decreases,
so it should consider adjusting the dose and frequency of their submission to the bath, depending
on the quality of alumina. The 1–2.5 kg of alumina brining to hole is cause a sharp supercooling
of local volume of electrolyte, its glut and only partially dissolved. So under punches in the cath-
ode of the cell is always present sludge accumulation which isolates parts of hearth and impairs
work cell, until disorders of technology. The existing system of regulation while exacerbating the
state of the pot: analyzing his condition, makes an erroneous conclusion that the concentration of
alumina in the bath is not sufficient and reduces the intervals between alumina feeding.
Means for automatic feeding aluminum pots must provide accurate reproducibility of doses
over a wide range of variation of their size. When the anode effect, or in case of sudden appear-
ance of « voltage noise» device must comply with the saturation of the electrolyte aluminum for
no more than 1–2 minutes, and this time fill the feeder and the discharge should be minimal.
In the operation of dusting and loss of the dosed material should be kept to a minimum, for it is
carried out ultrasonic treatment dose. The device should consume a minimum of electricity to
be economical on consumption of compressed air, oil and lubricants. The characteristics of the
device during operation must be unchanged or changed only minimally when using different
types of raw materials. To ensure acceptable solution doses of alumina is necessary to use a spe-
cial «sandy» alumina, which is dissolved in 30–40 % faster, reduces the quantity of sludge in the
cathode, stabilizes the process, and increases current efficiency by 2 %.
In a practice used alumina «intermediate» type which contains α-phase, 36–40 %, angle of
repose of 35–40 o, bulk density of 0.95–1.10 g/cm 3, containing dust fractions (-40 mm) 25–30 %,
the dose 220–250 g with a pulse duration of 2 seconds was sufficient. Tests of alumina sand type has
not demanded the changes and did not show any peculiarities. The punches delay must be minimize
(1–2 seconds) in the lowest position because punch, even coming into contact with the melt can not
keep warm, and only gives information about the momentum of contact with the surface bath.
The disadvantages of higher amperage the cell knows everyone:
• Substantial loss of alumina and bulk fluorides during transportation and loading in the cell;
• The complexity of dosing and transport of alumina and other loose materials.
• Issues of control of the composition of cryolite-alumina melts and differential loading
of alumina, depending on the technological state of the cell and the process parameters.
The features of higher amperage cells
The power amperage cells (more than 300 kA) have a higher speed of the melt, and the na-
ture of the circulation of the melt varies as the anode array has a different resistance at its great
length. Some cells have markedly different circulation of the melt, for example, in face of the
body, so the doses must to configure individually. In addition, practice shows that after the instal-
lation of systems of automatic feeding there is shift magneto-dynamic components, which causes
a shift of sediment under the punch toward the anode risers. This is due primarily with a design
flaw, when the questions change the heat balance and MHD of the built and attached equipment
are not considered at the stage of design completely, because the decision on the choice of sys-
tems of automatic feeding is taken after completion of the project under the contract system.
In the modern aluminum cells addition to the automatic feeding system, which is a com-
ponent of the system automated supply raw materials, envisaged the download additional ma-
terials. There is acute problem to recovery crushed waste electrolyte, fluorinated alumina (gas
cleaning), a mixture of crushed electrolyte and alumina (from cleaning stumps), powdered alu-
mina (after cleaning buildings and equipment).
The fluorinated alumina gas cleaning in a mixture of aluminum fluoride advisable to apply
through a special bunker with channels. Submission of fluorides in the area of most intensive
circulation of the melt (zone of convergence of the magneto-dynamic flows) in the cell allows
for maximum dissolution of raw materials. In the case of reduction pot capacity 300 kA, this
bunker the most rational place in the central riser anode, relegating it to the side following the
cell. The dose of fluoride should be quickly heated and exposed to the melt, because the mois-
ture reaching a cell with raw materials and from the air reacts with fluoride salts, decomposing
at temperatures of 200–250 оС to gaseous hydrogen fluoride and alumina.
The fluoride salts have to enter into the hole 0.05–0.25 kg doses at a constant frequency,
which coincides with the frequency of punch, ahead of the beginning of movement of punch
down for 3–4 seconds. Thus, we can reduce the loss of fluorine on 03–0.5 kg/ton of aluminum,
as well as provide the required range of bath ratio (2.2–2.4) and accurate to maintain it.
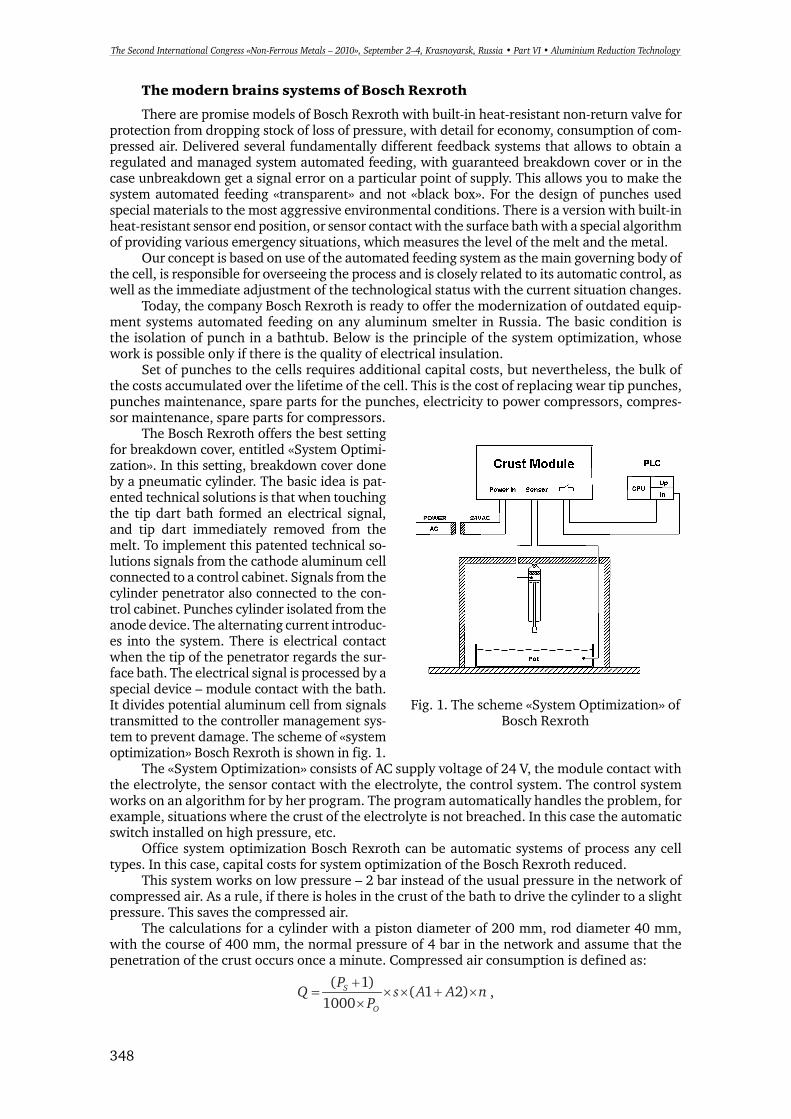
348
The Second International Congress «Non-Ferrous Metals – 2010», September 2–4, Krasnoyarsk, RussiaThe Second International Congress «Non-Ferrous Metals – 2010», September 2–4, Krasnoyarsk, Russia • Part VI • Aluminium Reduction Technology• Part VI • Aluminium Reduction Technology
The modern brains systems of Bosch Rexroth
There are promise models of Bosch Rexroth with built-in heat-resistant non-return valve for
protection from dropping stock of loss of pressure, with detail for economy, consumption of com-
pressed air. Delivered several fundamentally different feedback systems that allows to obtain a
regulated and managed system automated feeding, with guaranteed breakdown cover or in the
case unbreakdown get a signal error on a particular point of supply. This allows you to make the
system automated feeding «transparent» and not «black box». For the design of punches used
special materials to the most aggressive environmental conditions. There is a version with built-in
heat-resistant sensor end position, or sensor contact with the surface bath with a special algorithm
of providing various emergency situations, which measures the level of the melt and the metal.
Our concept is based on use of the automated feeding system as the main governing body of
the cell, is responsible for overseeing the process and is closely related to its automatic control, as
well as the immediate adjustment of the technological status with the current situation changes.
Today, the company Bosch Rexroth is ready to offer the modernization of outdated equip-
ment systems automated feeding on any aluminum smelter in Russia. The basic condition is
the isolation of punch in a bathtub. Below is the principle of the system optimization, whose
work is possible only if there is the quality of electrical insulation.
Set of punches to the cells requires additional capital costs, but nevertheless, the bulk of
the costs accumulated over the lifetime of the cell. This is the cost of replacing wear tip punches,
punches maintenance, spare parts for the punches, electricity to power compressors, compres-
sor maintenance, spare parts for compressors.
The Bosch Rexroth offers the best setting
for breakdown cover, entitled «System Optimi-
zation». In this setting, breakdown cover done
by a pneumatic cylinder. The basic idea is pat-
ented technical solutions is that when touching
the tip dart bath formed an electrical signal,
and tip dart immediately removed from the
melt. To implement this patented technical so-
lutions signals from the cathode aluminum cell
connected to a control cabinet. Signals from the
cylinder penetrator also connected to the con-
trol cabinet. Punches cylinder isolated from the
anode device. The alternating current introduc-
es into the system. There is electrical contact
when the tip of the penetrator regards the sur-
face bath. The electrical signal is processed by a
special device – module contact with the bath.
It divides potential aluminum cell from signals
transmitted to the controller management sys-
tem to prevent damage. The scheme of «system
optimization» Bosch Rexroth is shown in fig. 1.
The «System Optimization» consists of AC supply voltage of 24 V, the module contact with
the electrolyte, the sensor contact with the electrolyte, the control system. The control system
works on an algorithm for by her program. The program automatically handles the problem, for
example, situations where the crust of the electrolyte is not breached. In this case the automatic
switch installed on high pressure, etc.
Office system optimization Bosch Rexroth can be automatic systems of process any cell
types. In this case, capital costs for system optimization of the Bosch Rexroth reduced.
This system works on low pressure – 2 bar instead of the usual pressure in the network of
compressed air. As a rule, if there is holes in the crust of the bath to drive the cylinder to a slight
pressure. This saves the compressed air.
The calculations for a cylinder with a piston diameter of 200 mm, rod diameter 40 mm,
with the course of 400 mm, the normal pressure of 4 bar in the network and assume that the
penetration of the crust occurs once a minute. Compressed air consumption is defined as:
( 1)
( 1 2)1000
S
О
PQ s А А n
P+
= × × + ××
,
Fig. 1. The scheme «System Optimization» of
Bosch Rexroth

349
The Second International Congress «Non-Ferrous Metals – 2010», September 2–4, Krasnoyarsk, RussiaThe Second International Congress «Non-Ferrous Metals – 2010», September 2–4, Krasnoyarsk, Russia • Part VI • Aluminium Reduction Technology• Part VI • Aluminium Reduction Technology
where Ps – pressure supply (bar), Po – atmospheric pressure (bar), A1-area of the piston (cm2), A2 –
area of the piston rod end (cm2), s – stroke (cm), n – number of cycles per minute (cycles/min),
Q – flow of compressed air (normal conv.) (l/min). This compressed air consumption will be:
(4 1)
40 (314 301,5) 1 123,1 1231000 1
Q+
= × × + × = ≈×
l/min;
The calculations for the same cylinder have been used for the System optimization. The cylin-
der operates at a reduced pressure of 2 bar and returns with a level of electrolyte reduces the move
to 50 mm. This consumption of compressed air will be:
(2 1)
35 (314 301,5) 1 64,627 651000 1
Q+
= × × + × = ≈×
l/min;
In the case considered saving compressed air was 47 %.
At low pressure decreases the wear of the cylinder seals and increases its service life. This
leads to lower costs for maintenance of punches.
The back punch with the electrolyte level has a number of other advantages. The tip of the
punch is not immersed in the bath, it is less heated, and decreases the probability of sticking to it
regularly and decreased stay in power the reduction cell. Increased service life of punch and,
consequently, reduces the cost of its maintenance. There is aluminum more quality because of it
did not get iron impurities from the tip of punch.
An important aspect of the concept of good governance higher amperage pots is the or-
ganization of work without anode effect. Advantages of the system can deal with anode effects
and lower their rate to 0.03. For example, the low consumption of compressed air cylinders may
be invoked all at once, if you want to pay the mounting tension causes the anode effect. Also
low consumption of compressed air can lodge alumina in the aluminum electrolysis frequently
and in small portions. This makes it possible to achieve greater stability of dissolved alumina in
the electrolyte.
Other special options for process control is easily implemented by setting the parameters in
the program of «system optimization». If a likely buildup of bath on the tip of penetrator con-
tact with the bath occurs only once every 10 minutes (time can be adjusted). At the same time,
progress is measured punch to the contact with the electrolyte. Next, punch, making stroke,
returns to the starting position without touching the bath by reducing the time of the punch at
0.1 seconds, while time can be adjusted.
Measurement of the melt by means of the automated feeding systems
There are additional features system optimization of Bosch Rexroth that includes measure-
ment of the melt in an aluminum reduction pot. To implement this feature, you must replace the
punch cylinder on the cylinder with Linear position sensor and use the measuring cell contact
with the bath.
This will provide continuous feedback on the position of the tip of punch.
The tip of the punch reaches the surface of the bath, the value of the position is recorded
and transmitted to the controller of systems automated cell manager. Therefore, collects statisti-
cal information for changes in the melt in an pots. Measurement of the metal in an aluminum
electrolyzer is a patented solution (fig. 2) [3]. To implement this feature, you must:
• Cylinder dart replace the cylinder with potentiometer.
• The tip of the penetrator replaced by a special tip of the penetrator designed Bosch Rexroth.
This tip dart separates the control point and the electric current on the surface of the tip of
the penetrator.
• Replace the bath level module for crust module.
The values of the melt level and the level of metal can be detected with certain intervals of
time without the aid of manual control. To gather this information does not require any additional
systems. The frequency of data recording can be installed in accordance with actual needs. Based on
these data to evaluate the performance and condition of the cell and to take adequate measures
The technical solutions for system design with pneumatic self-regulating rod position
punches systems of automated feeding Bosch Rexroth provides: automatic adjustment of the
length of punches without adjustment, lowering operating costs, reduce the cost of compressed
air. The Return of punch pneumatic punches in the initial position from the current level of elec-
trolyte in order to minimize the time spent punch in the melt.

350
The Second International Congress «Non-Ferrous Metals – 2010», September 2–4, Krasnoyarsk, RussiaThe Second International Congress «Non-Ferrous Metals – 2010», September 2–4, Krasnoyarsk, Russia • Part VI • Aluminium Reduction Technology• Part VI • Aluminium Reduction Technology
Since the feature equipment AFS Bosch Rexroth is compatible with existing equipment and
process control is important to convince domestic producers to change technology policy for the
modern pots in the direction of modernization and replacement of obsolete systems to new in-
telligent systems with the functional control of the AFS parameters.
The result of system optimization Bosch Rexroth is a stable and controlled process of the
aluminum cell, and generally reducing the cost of the aluminum.
There are now also held development and laboratory testing, accented on the improve-
ment of AFS company Bosch Rexroth for a full independent control over the technological pro-
cess of electrolysis. In this case the system automated feeding is a key element of management
(brains of the system) through ASUTP pots on the sensor signals.
Conclusions
The main challenge in improving the management of higher amperage pots is to create a
fundamentally new system of automated supply alumina to pots. The main difference, which
of the existing systems, is a full functional control of technological process of electrolysis under
constant control of key parameters. Signals from the automated feeding system linked to the
automated control system and the principle of feedback regulation of the cell is to the optimum
condition. To resolve the full upgrade higher amperage pots need to discuss the following issues
• Full control of technological parameters of electrolysis (temperature, levels of metal and the
electrolyte concentration of alumina, cryolite ratio) with AFS.
• A new approach to the anode effect as an emergency on the electrolytic reduction to the val-
ues of the world level – 0.03).
• Effective supply fluorinated alumina, crushed electrolyte through special units.
• Interaction with process control systems AFS.
• Diagnosing production situation.
The new AFS expands functionality to influence the process technology and maintain its
basic meaning of the element of a stable feeding alumina of reduction pot. This will give more
opportunities for wide dissemination AFS Bosch Rexroth on the Russian market the alumi-
num industry. Changing priorities for systems AFS state for technical specialists of new chal-
lenges when the end result is the creation of economical highly controlled cell with minimal
human influence and the time factor.
REFERENCES
1. N. Dourado, M. Castro, M. V. Branco, R. C. Oliveira, V. G. Pereira. Neural model of elec-
tric resistance in reduction cells of aluminum to be applied on the process control. Light Metals
2006. pp. 353–359
2. OO Native AI Berezin, Polyakov PV, Gonebny IV « The Identification of the technological
state of the electrolyzer to the fluctuations of the reduced voltage. Proceedings of the Interna-
tional Conference «Aluminium of Siberia-2003».
3. Patent WO 01/06039 A1 (priority date17.07.2000). Method and device for controlling
the movement of a supply and breaking chisel in an aluminum production cell.
4. Patent WO 2009/074319 A1 (18.06.2009) Method of controlling bath level in an alumi-
num production cell.
Fig. 2. The Schematic diagram of the measurement of the metal
and electrolyte Bosch Rexroth

351
The Second International Congress «Non-Ferrous Metals – 2010», September 2–4, Krasnoyarsk, RussiaThe Second International Congress «Non-Ferrous Metals – 2010», September 2–4, Krasnoyarsk, Russia • Part VI • Aluminium Reduction Technology• Part VI • Aluminium Reduction Technology
One of the main technological control parameters of the aluminium reduction technology is
cryolite ratio (CR), which implies the mole ratio of sodium fluoride to aluminum fluoride. The
composition of the melt components during the electrolysis process changes due to fluorides es-
caping from the bath. To maintain the effective regime of the bath operation the electrolyte com-
position is regularly corrected. The composition is determined by X-ray phase diffraction analysis
(XRD) using a cooled electrolyte sampled from the bath. The necessary accuracy of estimating
CR amounts to Δ=± 0.03 and relative estimation error is CaF2 – Δ=±10 %. Since the number of
electrolysis baths on some industrial plants varies from 1000 to 2000 units, the problem of the
bath composition control becomes a complex engineering task with a great number of samples.
To hold CR within a narrow range of values (ΔСR=0.03 units) the electrolyte of each bath is
analyzed once every three days. To effectively control the electrolyte composition the aluminum
plant applies X-ray diffraction analysis allowing one to determine the content of certain crys-
tal phases and estimate the chemical composition of the sample. The main phases determined
when analyzing the electrolyte composition by XRD are given in table 1.
Table 1
Mineral components of the cooled electrolyte
№ Mineral phase Chem. formula
1. Cryolite Na3AlF6
2. Chiolite Na5Al3F14
3. Ca-cryolite1 NaCaAlF6
4. Ca-cryolite1.5 Na2Ca3Al2F14
5. Fluorite CaF2
During the crystallization the main components of NaF and AlF3 form two phases, namely,
cryolite Na3AlF6 and chiolite Na5Al3F14. Calcium fluoride forms three phases: CaF2 (fluorite),
NaCaAlF6 и Na2Ca3Al2F14 (calcium cryolites). As calcium fluoride also bounds aluminum and
sodium fluorides, it is necessary not only to determine calcium as a chemical compound but to
measure the content of each calcium-containing phase (NaCaAlF6 and Na2Ca3Al2F14). Unfortu-
nately, the phase NaCaAlF6 is not sufficiently crystallized, decreasing the accuracy of its mea-
surement by XRD. However, the ratio between the calcium-containing phases in a sample can
change during the sampling [1, 2, 3].
Since it is difficult to determine calcium fluoride concentration by XRD only, the X-ray fluo-
rescent measurement of the total calcium content is added to the X-ray evaluation scheme [4]. This
evidence, however, doesn’t allow one to take into account the contribution of sodium and alumi-
num fluorides bound to calcium into the cryolite ratio. In practice, when calculating the final val-
ues, calcium with a constant ratio is assumed [5] to be distributed between possible calcium-con-
taining phases (NaCaAlF6 and Na2Ca3Al2F14). The real situation, however, is quite different, giving
rise to the distortion of the analysis result. For example, with the electrolyte composition being
expressed through the main components: Na3AlF6–72 % wt. and AlF3–14 % wt. and CaF2–8 % wt.,
an assumption on calcium being crystallized in NaCaAlF6 phase gives the value CR=2.19, and in
the case of Na2Ca3Al2F14 phase, one has the value CR=2.27. The arising difference of the results
(0.08 CR units) exceeds considerably the admissible error. It is possible to increase the accuracy of
the analysis by using the samples containing the phases formed under equilibrium crystallization
conditions. This can be achieved by improving the stages of sampling and/or sample preparation.
Interlaboratory analysis of the electrolyte samples carried out at four plants of RUSAL in
2003 shows that the mean square deviation of the instrumental techniques from the chemical
IMPROVING THE ACCURACY IN ELECTROLYTE CONTROL AT ALUMINUM PRODUCTION BY X-RAY
DIFFRACTION ANALYSIS
J.N. Zaitseva 1, I.S. Yakimov 2, S.G. Ruzhnikov 2, S.D. Kirik 1,2
1 Institue of Chemistry and Chemical Technology, SB RAS, Krasnoyarsk, Russia2 Siberain Federal University, Krasnoyarsk, Russia

352
The Second International Congress «Non-Ferrous Metals – 2010», September 2–4, Krasnoyarsk, RussiaThe Second International Congress «Non-Ferrous Metals – 2010», September 2–4, Krasnoyarsk, Russia • Part VI • Aluminium Reduction Technology• Part VI • Aluminium Reduction Technology
analysis exceeds the value of 0.08 CR units, independent of the equipment used [6]. The analy-
sis of the results reveals that significant contribution to the error is made both by the effect of the
calcium phase redistribution described above and microstructure distortion appearing when the
sample is prepared for the measurements, including grinding and compressing.
The present work considers possible reasons of errors in the results of the qualitative XRD
of electrolyte sample composition, caused by the shortcomings of sampling and/or sample prep-
aration, and suggests methods allowing one to eliminate them in order to increase the accuracy
of determining the electrolyte composition by XRD.
On the basis of the results of the high temperature XRD of the electrolyte behavior in the
pre-melting temperature range, experiments on thermal treatment of the calcium containing
electrolyte samples have been carried out at temperatures from 450 to 650 оС. The thermal
treatment of the samples with an ill-crystallized phase NaCaAlF6 in the original composition at
temperatures below 600 оС has been shown to result into the decomposition of this compound
with the formation of a well-crystallized compound Na2Ca3Al2F14 (fig. 1). Simultaneously, there
occurs a slight decrease in the cryolite content and the increase of chiolite. The thermal treat-
ment of the electrolyte without any NaCaAlF6 in its original composition at temperatures below
600 оС does not result into the change of the phase composition. X-ray fluorescent measure-
ment indicates that the thermal treatment does not change the sample elemental composition.
5 - CaF2
4 - Na2Ca3Al2F14
3 - NaCaAlF6
2 - Na5Al3F14
1 - Na3AlF6
18 19 20 21 22 23 24 25 26 27 28 29 30 31 32 33 34
0
1000
3000
4000
5000
CaF2
Na3AlF6Na2Ca3Al2F14 NaCaAlF6
Na5Al3F14
3
5
531
4 1
2
4
4
4
44
4
1
1
1
1
1
1
1
1
11
1
3,4
1
2II
I
Re
l. i
nte
nsi
ty
2Theta, deg.
Fig. 1. XRD patterns of the industrial electrolyte (CR=2.54, CaF2=8.19 % wt.): I – original
electrolyte, the main phases Na3AlF6, Na5Al3F14, calcium is distributed between the three phas-
es: NaCaAlF6, CaF2, Na2 Ca3 Al2 F14; II– electrolyte after thermal treatment, the main phases
are Na3AlF6, Na5Al3 F14, calcium is distributed between the two phases: CaF2, Na2Ca3Al2 F14.
The phase NaCaAlF6 is not observed. Shown by the rectangles are the analytical lines accord-
ing to which it is possible to observe the change of the phase content
The method XRD has been applied to a number of samples from the aluminum plant sub-
jected to the sample preparation procedure (grinding and compressing) using the computer-
aided line «Herzog». It has been shown that as a result of the «industrial» sample preparation,
the analytical lines on the XRD pattern broaden in comparison with the samples treated in the
laboratory conditions (fig. 2, 3). The values of the FWHM for the cryolite (22.86 о) and chiolite
(30.71 о) analytical lines of the samples subjected to the sample preparation on the Krasnoyarsk
Aluminum Plant amount to 0.18–0.2 and 0.19–0.22, correspondingly. The samples subjected to
the laboratory preparation (hand crushing in an agate mortar) have the half-width values 0.16–
0.18 for cryolite and 0.16–0.17 for chiolite, the spread of these data is given in figure 2. More
considerable differences are observed when comparing samples from various plants (fig 4, 5).
The FWHM values allow one to estimate the particle size of the main phase. For example, for
the samples subjected to the industrial preparation procedure the size of the cryolite crystals is in the
range from 700 to 1000 , and for the laboratory samples it varies from 1000 to 1200 . Thus, inten-
sive grinding results in the change of the crystallite sizes. The line broadening is accompanied by the
considerable decrease of the peak intensity which can be seen in figure 3, as well as by the underesti-
mate of the phase content and, as a consequence, by the incorrect estimation of the cryolite ratio.
The microstructure factor can be taken into consideration by measuring the integral intensi-
ties or the profile intensities followed by fitting the analytical function describing the line shape.
Thus, as a result of the investigations made it has been established that the main factors
decreasing the accuracy of estimating CR are the non-equilibrium sample crystallization at sam-

353
The Second International Congress «Non-Ferrous Metals – 2010», September 2–4, Krasnoyarsk, RussiaThe Second International Congress «Non-Ferrous Metals – 2010», September 2–4, Krasnoyarsk, Russia • Part VI • Aluminium Reduction Technology• Part VI • Aluminium Reduction Technology
pling and uncontrolled microstructure change at the sample grinding. It has been shown that:
– the influence of the non-equilibrium crystallization of the calcium-containing phases
when sampling from the baths can be leveled by the subsequent thermal treatment of
the samples at a certain regime;
– the microstructure of cryolite, and to a smaller extent, that of chiolite in the electrolyte
samples change at grinding. This results in the change of the width and peak intensity of
the X-ray bands, which, in turn, decreases the accuracy of estimating CR. The microstructure
factor can be taken into account by means of measuring the integral intensities of the
analytical lines or fitting the analytical lines to the profile of the X-ray band;
– the consideration of the above mentioned factors allows one to significantly increase
the accuracy of estimating the cryolite ratio during the XRD analysis and to bring the
accuracy into agreement with the technical requirements.
REFERENCES
1. S. D. Kirik, I. S. Yakimov, N. N. Golovnev et al.//Abstracts of the International Confer-
ence «Aluminum of Siberia 2002», Krasnoyarsk, 2002, p.400–404.
2. J. N. Zaitseva, E. N. Lyndina, S. D. Kirik, I. S. Yakimov, Journal of Siberian Federal Uni-
versity Chemistry 1 (3) (2008) 260–268.
3. Kirik S. D., Yakimov I. S., Zaitseva J. N., Journal of Solid State of Chemistry, 182 (8), 2009,
с. 2246–2251
4. Combined XRD/XRF System for Potflux Analysis PW1760/10. Instructional Manual
9499–303–01711, 840127. Almelo, Netherlands
5. L. P. Lossius, H. Hoie, H.H Pedersen et.al., Light Metals, 2000, p.265–270.
6. I. Yakimov, P. Dubinin, S. Kirik, Y. Medvednikov, S. Ruzhnikov, A. Sayutin, T. Pecherskaya.
Abstracts of the International Conference «Aluminum of Siberia 2004», Krasnoyarsk, 2004, p.250.
Fig. 3. Analytical line of the cryolite of a
sample subjected to industrial and laboratory
preparation
Fig. 5. Analytical lines of the sample cryo-
lite, subjected to preparation at the plants
of RUSAL (Bratsk Aluminum Plant (BRAZ),
Novokuznetsk Aluminum Plant (NKAZ),
Sayanogorsk Aluminum Plant (SAZ))
Fig. 2. Value of the FWHW for different phases
at different ways of sample preparation
Fig. 4. Value of the cryolite FWHM depending
on the value of CR for the samples subjected
to the preparation at the plants of the Russia
Aluminum group (RUSAL)
0 2 4 6 8 10 12 14 16 18 200,14
0,16
0,18
0,20
0,22
0,24 plant
lab.
FW
HM
, d
eg
.
Sample22,6 22,8 23,0 23,2
0
200
400
600
800
1000
1200
1400 plant
lab.
Int.
, co
un
ts.
2 Theta, deg.
1,8 2,0 2,2 2,4 2,6 2,8 3,0
0,2100,2150,2200,2250,2300,2350,2400,2450,2500,2550,2600,2650,2700,2750,2800,2850,290
FW
HM
, C
ry (
32
,56
o )
KR
SAZ KRAZ NKAZ BRAZ
31,6 31,8 32,0 32,2 32,4 32,6 32,8 33,0 33,2 33,40
200
400
600
800
1000
1200
1400
NKAZ
SAZ
BRAZI,
co
un
ts
2 Theta, deg.

354
The Second International Congress «Non-Ferrous Metals – 2010», September 2–4, Krasnoyarsk, RussiaThe Second International Congress «Non-Ferrous Metals – 2010», September 2–4, Krasnoyarsk, Russia • Part VI • Aluminium Reduction Technology• Part VI • Aluminium Reduction Technology
Abstract
Since 2004 RRSAL Company has been developing aluminum production process employ-
ing inert anodes. By now research and development to work out and test inert anode material
and aluminum-wetted composite cathode has been carried out with leading science centers.
Detailed information acquired about degradation processes running on the electrodes during
electrolysis created opportunities to further purposefully modify properties of material to im-
prove their performance. Materials developed so far were tested in long-term (24–250 hours)
laboratory tests and exhibited high stability (anode consumption not more than 6 cm/year).
The work presents principal achievements made by RUSAL in inert anode development. Possible
futures of further work are discussed.
Introduction
The groundwork for existing aluminum production process was laid as long ago as the XIX
century and since then did not undergo any considerable changes. Aluminum is produced by
electrolysis of cryolite-alumina melts in cells with bottom carbon-graphite cathode and carbon
anode. The latter burn in electrolysis by overall reaction:
Al2O3 + C → Al + CO2.
In actual practice up to 0.5 carbon anodes burn to produce 1 t of aluminum (theoretical
consumption: 334 kg).
The need to constantly replace burning anodes presents considerable technological diffi-
culties, production of anodes is fairly expensive and account for a considerable fraction in the
prime cost of aluminum. Besides, environmental hazards of aluminum production is mostly due
to use of carbon anodes, as the process of electrolysis and anode production emit large amounts
of greenhouse gases, polyaromatic hydrocarbons and fluorocarbons. Search for a technology ca-
pable of solving these problems is worldwide. Along with alternative methods for aluminum pro-
duction scientists aim their efforts to find material for aluminum cell anodes which could make
oxygen and the life of the anode, at this, to be not less than 1 year (the so-called «inert anode»).
New process can not only reduce environmental impact, bit also increase its efficiency. Electroly-
sis with inert anode can run at substantially lower temperature (reduced energy consumption)
with vertical arrangement of electrodes (increased cell capacity, reduced capital expenditures).
DEVELOPMENT OF INERT ANODES FOR ELECTROLYSIS
D.A. Simakov, A.V. Frolov, A.O. Gusev
RUSAL ETC Ltd., Krasnoyarsk, Russia
а b
Fig. 1. Laboratory cells to conduct life tests of cathode and anode materials
for amperage up to 10 A (a) and up to 300 A (b)

355
The Second International Congress «Non-Ferrous Metals – 2010», September 2–4, Krasnoyarsk, RussiaThe Second International Congress «Non-Ferrous Metals – 2010», September 2–4, Krasnoyarsk, Russia • Part VI • Aluminium Reduction Technology• Part VI • Aluminium Reduction Technology
Development and implementation of electrolysis with inert anodes makes possible to:
1) substantially reduce capital expenditures to build new aluminum smelters and expen-
ditures to build anode production conversion reduced in half size of potrooms, reduce
unit cost for busbars;
2) reduce specific energy consumption from existing 13.5–14 kW h/kg of Al to ~ 12 kW⋅h/kg
of Al;
3) reduce prime cost of aluminum production by implementing electrolysis with vertical
inert anodes and wetted cathodes (not less than 8500 rub./t⋅Al);
4) completely eliminate emissions of CO, CO2, polyaromatic hydrocarbons as is the case
with carbon anodes.
Even though intensive work has been under way for more than 25 years, material com-
pletely satisfying the requirements imposed (see below) has not been found. To create inert
anode material requires development and consistent implementation of a certain concept of
materials science comprising a number of avenues of attack and solutions (including cell design,
anode design, other materials, etc.). Base components of this problem are:
• solutions to select anode material (metal alloy, cermet, oxide ceramics)
• new approaches to composition (both chemical and phase) and optimization of micro/
nanostructure. Composition of both metal and cermet materials should make electrolysis
self-induce formation of dense, time-stable protective layer with electron conductivity
and satisfactory electric conductivity, mechanical strength and thermal resistance;
• new approaches to optimize material technology (in addition to economic expediency
technology should provide for production of nonporous material with prescribed chemi-
cal and phase composition and micro/nanostructure).
RUSAL has been realizing this concept within the framework of «Inert Anode Cell» project
opened in 2004.
Experimental capacities to tests materials of inert anodes and wetted cathodes
Considerable difference in behavior of inert anodes observed in a laboratory or enlarged ex-
periments, even more so in an industrial-scale experiment, are of principal significance. Key phe-
nomena and secondary processes disturbing due to this or that reason functioning of the anode
and resulting in its intensive wear increase with the scale of experiment. This makes the problem
multifactorial. Today generally accepted is the following sequence to enlarge the scale of testing
a potential inert anode material: successful continuous operation of the anode for 10 hours in an
electrochemical cell with current 10 A, 100 hours – in a 100 F cell, 1000 hours in a 1 kA cell and,
finally – for not less than 6 months in a 5–10 kA cell. This sequence is considered to a certain extent
guarantee against serious mistakes and unwarranted
expenses for large-scale tests, and helps gain experi-
ence of operating new anodes, structural concepts.
To change-over to an industrial cell is possible after
this only.
Within the framework of «Inert Anode Cell»
project materials of inert anode and wetted anode
are electrochemically tested in electrolysis labo-
ratory founded specifically for these purposes in
2007 at RUSAL Engineering and Technology Cen-
ter, Krasnoyarsk.
To conduct tests the project team has:
– electrolysis plant for 10 А (fig. 1 а) – 4 ea.;
– 50–300 А cell (fig. 1 b) – 3 ea.
Results of laboratory tests of inert anodes and
wetted cathodes made by different methods form
the basis to choose most efficient technology in
terms of material with best performance. To test en-
gineering solutions RUSAL also designed and erect-
ed an installation to test inert cells with amperage
5 kA (fig. 1). Fig. 2. Large laboratory 5 kA cell
to test inert anodes

356
The Second International Congress «Non-Ferrous Metals – 2010», September 2–4, Krasnoyarsk, RussiaThe Second International Congress «Non-Ferrous Metals – 2010», September 2–4, Krasnoyarsk, Russia • Part VI • Aluminium Reduction Technology• Part VI • Aluminium Reduction Technology
Principal requirements to inert anodes
Inert anodes are developed with account of the following requirements:
• low solubility in cryolite-alumina melt (concentration of anode aomponents in the
bath in electrolysis ≤ 100 ppm);
• resistance to effect of oxygen and fluorine (corrosion rate ≤ 5 cm/year);
• thermal resistance and mechanical strength;
• low electric resistance (≤100 mcΩ⋅cm at operating temperature);
• low osygen overpotential (≤ 200 mV);
• ease and stability of electric connection with current supply;
• relatively low cost and adaptability to manufacture.
Thermal resistance (resistance to thermal stresses) is among obvious key characteristics
of inert anode material – corrosion resistance and electric conductivity. Only sufficiently high
resistance to thermal stresses the material can be used to create an industrial-size anode (modu-
lar including), that can be fairly easily exposed to temperature conditions of the operating cell.
Globally search of material for inert anode flows three major lines [1]:
1) metal anodes;
2) cermets;
3) ceramics.
Most experts admit [2, 3], that in terms of minimizing technological problems arising
with implementation of inert anodes in production the metal anodes have no rivals. Ease of com-
mercial-scale production (generally, casting) ease of manufacturing contact with power supply
(generally welding), high resistance to thermal shock makes these anode optimal. However, with
anode polarization in the evolving oxygen medium metal is a thermodynamically nonequilibrium
phase and inevitably oxidizes. This process can be constrained by highly conductive oxide film
forming on the surface of the electrode – it is its surface that is to evolve oxygen. This oxide film
can form spontaneously in anode polarization after the anode is submerged into the melt or ap-
plied on the anode in advance during manufacture. From the viewpoint of reliability of long-term
corrosion protection the self-induced film is preferable because of its capability to self-heal on the
surface after any mechanical damage of the anode surface inevitable in industrial operation.
Ceramic anodes are thermodynamically stable in the melt and exhibit substantially high
stability and low corrosion rates. However, low resistance to thermal shock and mechanical
stress, complexity to manufacture electric contact with power supply constrains development in
this line. Cermets which are composite ceramic/metal materials are an attempt to find optimum
balance between low corrosion rate of ceramic anodes and high adaptability to manufacture of
metal anodes.
The required qualities are exhibited, first of all, by metal alloys, and to a smaller degree –
by cermets. Oxide ceramic generally does not exhibit sufficient thermal resistance and in most
cases electric conductivity. In addition, the problem to make for its stable high-temperature elec-
tric contact is rather difficult. From this point of view anode products of oxide ceramics may
be of rather limited linear dimensions and considerable technological obstacles in scaling. At
the same time oxide ceramics exhibits best performance in terms of stability during long-term
tests. All types of possible materials (metal, oxide film, cermet) have their advantages and dis-
advantages which make difficult to choose between them. It is for this reason that from 2004 to
2008 RUSAL performed intensive scientific research on all three material types.
Studies carried out within the framework of «Inert Anode Cell» project found that most prom-
ising among metal materials are anodes on xopper-iron-nickel base. Performance of these alloys is
best in medium- and low-temperature cryolite-alumina melts (kgm) We consider these alloys as
most promising to develop inert anode electrolysis. Degradation behavior of metal anodes can be
considerably improved by application of additional protective coatings (metal and oxide).
Metal inert anodes
As stated above, working capacity of metals and alloys under conditions of anode polariza-
tion in the melt is determined by the possibility to form on their surface a stable protective con-
ducting oxide layer on the surface of which oxygen electrochemically evolves. Operational stabil-
ity of such an anode is determined by the balance between formation rate of protective oxide film
on its surface and the rate of dissolution in the bath. These rates should equal each other, other-
wise the film grows with time or decreases which, accordingly, practically completely passivates

357
The Second International Congress «Non-Ferrous Metals – 2010», September 2–4, Krasnoyarsk, RussiaThe Second International Congress «Non-Ferrous Metals – 2010», September 2–4, Krasnoyarsk, Russia • Part VI • Aluminium Reduction Technology• Part VI • Aluminium Reduction Technology
the anode or quickly deteriorate it. Electric conductivity of the oxide films is among its most impor-
tant properties. When the electric conductivity is low, voltage drop in the film increases, this may
result in evolution of non-conducting fluoride layer at metal-oxide interface and, consequently,
completely block the anode [4]. Another factor considerably constraining choice of materials for
metal inert anodes is selective dissolution/oxidation of one of alloy components forming porous
structure in the alloy volume and highly contaminating aluminum with this component [4]. As
a rule this component is iron. Resistance of inert anodes is highly affected by composition of the
melt, temperature of electrolysis and amperage. Alloys exhibiting successful performance as inert
anodes with some values of these parameters do not meet the abode stated requirements when
electrolysis conditions substantially deviate from optimum. This complicates development of inert
anode material and considerably increases the scope of experimental studies.
Development of metal anodes was most successful with Cu-Ni-Fe alloys. Tests of Cu-Fe-Ni
alloy anode for 250 hours with vertical arrangement of anode and cathode showed that during
electrolysis with this anode the voltage remains stable, anode consumption rate is 6–9 cm/year,
and contamination of aluminum with anode components was about 3.45 % (Cu – 1.84 %, Fe –
1.08 %, Ni – 0.53 %). Figure 3 shows diagrams of voltage, amperage and back emf. Appearance
of anode before and after the tests is given in figure 4.
Fig. 3. Voltage, amperage and back emf vs. during life test of metal Cu-Fe-Ni anode
in cryolite-alumina melt. Voltage increase after 40 hours of electrolysis is due to
replacement of the cathode and is not connected with anode performance
а b
Fig. 4. Anode-cathode assembly before tests (а) and anode after tests (b)
Cross section of sample studied after electrolysis showed depth of deterioration zone in-
cluding porosity zone and oxide fragments forming in electrolysis is about mcm deepening in the
course of electrolysis at the rate correlating with the dissolution rate of outside oxide films in the
bath (fig. 5). In its metal part the deterioration zone becomes relatively uniform in chemical com-
position, impoverishing in copper and nickel content. In addition, the deterioration zone forms
oxide particles preventing the deterioration zone from propagation deep into the metal base.
The base of the surface zones are shown to be formed by oxide phases performing protec-
tive part in anode operation. In its core section composition of the metal base is inhomogeneous,
which is due to dendrite structure of the initial alloy which does not vary even in prolonged
electrolysis at 850–950 oС.

358
The Second International Congress «Non-Ferrous Metals – 2010», September 2–4, Krasnoyarsk, RussiaThe Second International Congress «Non-Ferrous Metals – 2010», September 2–4, Krasnoyarsk, Russia • Part VI • Aluminium Reduction Technology• Part VI • Aluminium Reduction Technology
Worth noting is uniform wear of the an-
ode over its area. As the current efficiency was
about 30 % (typical value for a laboratory ex-
periment) it is possible to conclude that under
conditions of an industrial cell with typical cur-
rent efficiency току 90–95 % contamination of
aluminum with anode components will be not
higher than 1.1 %. It should be noted, that low
current efficiency is indicative of considerable
oxidation of produced aluminum with anode
gases and, consequently, of possible contact of
dissolved or drip aluminum with the anode in-
creasing its corrosion rate and reducing purity
of the metal. Current efficiency usual for in-
dustrial cells will eliminate this wear mecha-
nism. Besides, work is under way to specificate
composition of anode, its structure, prelimi-
nary treatment and electrolysis conditions
to improve resistance of Cu-Fe-Ni alloys.
Aluminum-wetted cathode
To enhance economic efficiency of aluminum production, specifically, under conditions of
using inert anode materials (in low- and medium-temperature alloys) requires to reduce con-
siderably heat liberation in the cell and, accordingly, considerably reduce the anode-cathode
distance (ACD). In the existing process as the cathode material is not wetted by the metal the
minimum distance between the electrodes is determined by the necessity to maintain on the
cathode surface a thicker layer of molten aluminum. Hydrodynamic mobility of the metal pad in
magnetic field arising with current flow results in ACD 4–6 cm and about 50 % of spent electric
energy transforms into Joulean heat. Aluminum-wetted materials in aluminum cells can consid-
erably reduce ACD by thin aluminum film formed on the surface. This technological problem
also enjoys thorough attention of many research groups worldwide. It gains more importance
for electrolysis with oxygen-evolving inert anodes, because disturbance of wetting results in for-
mation of aluminum drops entrapped with evolving oxygen bubbles to contact with the inert
anode. The latter results in quick reduction corrosion of the anode.
Fig. 5. Surface layer of Cu-Fe-Ni anode after
250 hours of electrolysis (oxide phase is grey,
metal – light shade)
а b
Fig. 6. Composite titanium diboride-based
cathodes before (а) and after (б) life tests in
cryolite-alumina melt
Fig. 7. Electron microscope image of surface
area of composite cathode after life tests
in cryolite-alumina melt and results of local
microanalysis (at. %) in different points

359
The Second International Congress «Non-Ferrous Metals – 2010», September 2–4, Krasnoyarsk, RussiaThe Second International Congress «Non-Ferrous Metals – 2010», September 2–4, Krasnoyarsk, Russia • Part VI • Aluminium Reduction Technology• Part VI • Aluminium Reduction Technology
Work carried in RUSAL in 2004–2008 developed technologies to manufacture wetted cath-
odes from graphite with titanium diboride and composite wetted cathode consisting entirely on
TiB2 –based material. Cathodes tested in electrolysis showed that the composite cathode have
better performance than the cathodes with coating. Figure 6 shows appearance of laboratory
cathodes 95 %TiB2–5 %C before and after 100-hours life tests and results of electron microscopy
of near-surface cathode after electrolysis. Electron microscopical study proved (fig. 7), that af-
ter electrolysis the cathode is coated with a thin aluminum film which partly oxidized after the
cathode was removed from the melt.
To-date «Inert anode Cell» project developed a process to manufacture large cathode plates
from TiB2-C material for tests in 5 kA cells with inert anodes. By the end of 2008 the developed
technology was used to manufacture on a specially designed vibropress large (430×300×90 mm)
wetted 95 % TiB2–5 %C cathodes (fig. 8). Density of cathodes about 3 g/cm 3, porosity – about
30 %, which is in good agreement with the results produced on laboratory cathode samples.
Performed studies showed that correct choice of size distribution of the aggregate, its prep-
aration and compaction process and baking conditions makes possible to considerably increase
density, strength and electric conductivity of baked cathode material which is specific of any
ceramic and composite material.
а b
Fig. 8. Table for vibrocompaction of wetted 5 kA cathodes (а) and green
(compacted, but unbaked) cathode (b)
From the standpoint of cost the composite cathode cannot compete with graphite cath-
odes with applied coating. Therefore of interest at this time is to find methods reducing cost of
composite cathodes, which can be attained by partial replacement of titanium diboride in the
cathode composition by carbon component. Studies performed made possible to develop com-
position 47.5 %TiB2–47.5 %gaphite-10 % carbon binder + additions of boron oxide and a pro-
cess to manufacture cathodes of this composition. Considerable decrease of titanium diboride
notwithstanding these cathodes retain high oxidation resistance and are wetted by aluminum in
electrolysis [5]. Cathodic density was about 2 g/cm 3, porosity – about 20 %.
Pilot tests
Parallel to R&D work to develop inert electrode materials RUSAL develops a process to
convert the existing cells from carbon anodes to metal inert anodes. Within this line of develop-
ment industrial inert anodes were designed, products were cast and metal anodes were tested in
the midst of carbon anodes (fig.9). This test arrangement was found to expose metal anodes
to increased corrosion due to presence of reducers (CO2, carbon dust) and operation failure of
CPCS because of concurrent installation of carbon and inert anodes. Therefore, a batch of met-
al inert anodes was manufactured to replace all carbon anodes on one of the cells in Krasnoyarsk
Aluminum Smelter. Along with this metal anode design was improved (fig. 10) and a program
and anode change process on an operating cell were developed.

360
The Second International Congress «Non-Ferrous Metals – 2010», September 2–4, Krasnoyarsk, RussiaThe Second International Congress «Non-Ferrous Metals – 2010», September 2–4, Krasnoyarsk, Russia • Part VI • Aluminium Reduction Technology• Part VI • Aluminium Reduction Technology
Conclusion
Since 2004 RUSAL Company has been developing aluminum production process employ-
ing inert anodes. R&D work has been carried out with leading science centers in Russia to devel-
op and test materials for inert anode and aluminum-wetted composite cathode. Detailed infor-
mation obtained about deterioration processes running on electrodes during electrolysis created
prerequisites to further purposefully modify material properties to improve their performance.
It was demonstrated for all classes of materials under study, that deterioration of electrode is
to a great extent determined by local inhomogeneity of material microstructure (composition,
electric conductivity, electrocatalytic properties), methods to control stability at early degrada-
tion stages have been developed.
The developed materials have been tested in prolonged (24–500 hours) laboratory tests
and exhibited high stability (anode consumption – not more than 10 cm/year). Metal anodes
have been tested on industrial cells. Process to convert existing cells from carbon anodes to inert
anodes has been developed. Processes to manufacture large inert anodes and cathodes have
been developed and tested. A 5 kA cell with inert electrodes has been developed and assembled.
These results are unique and have not parallel in the world.
Plans on the immediate horizons are to further optimize composition of inert anode and
electrolysis conditions to further decrease contamination of aluminum to levels meeting the
existing standards. Plans to conduct pilot tests of inert anodes and wetted cathodes on the cells
of Krasnoyarsk Aluminum Smelter are being developed.
REFERENCES
1. I. Galasiu, R. Galasiu, J. Thonstad Inert anodes for aluminium electrolysis//Aluminium-
Verlag, 2007, 207 с.
2. B. J. Welch, JOM 51 (1999) 24–28
3. R P. Pawlek, Light Metals, 2008, 1039–1045.
4. D. A. Simakov, E. V. Antipov, M. I. Borzenko, S.Yu. Vassiliev, Yu. A. Velikodny, V. M. Den-
isov, V. V.
Ivanov, S. M. Kazakov, Z. V. Kuzminova, A. Yu. Filatov, G. A. Tsirlina, V. I. Shtanov, «Nickel
and nickel alloys electrochemistry in cryolite-alumina melts» Light metals, 2007, p.489
5. A. V. Golounin, S. A. Simakov, A. O. Gusev, Patent application № 2009130820, A method
to manufacture cathode for vertical alumina reduction cell.

361
The Second International Congress «Non-Ferrous Metals – 2010», September 2–4, Krasnoyarsk, RussiaThe Second International Congress «Non-Ferrous Metals – 2010», September 2–4, Krasnoyarsk, Russia • Part VI • Aluminium Reduction Technology• Part VI • Aluminium Reduction Technology
From the seventies of the last century the main aluminum manufacturing companies have
been searching the materials, that can be used as inert anodes. But up to the moment there are
no outstanding results in this field, because it is very difficult to find the material that can be
stable in aggressive fluoride-oxide environment at temperatures close to 1000 oC. The possible
way of salving this problem is the operation temperature lowering by means of the electrolyte
composition change. The composition in turn defines the base physical chemical properties of
electrolyte that are very important for the technological process.
Alumina solubility
Intensive search of low-melting electrolytes for aluminum production were started about
thirty years ago [1]. At the fist time the main source of lowering temperature was cryolite ratio
decrease (AlF3 content rise) of the sodium cryolite melt. But such change of composition leads
to considerable drop of electrical conductivity. Moreover alumina solubility is very low in such
melts [2, 3]. The further investigation of low melting compositions were dealt with lithium cryo-
lites possessing high electrical conductivity even at low CR. But scientists [3] showed that LiF
additives depress the alumina solubility substantially. The attempt of overcoming this problem
using slurry electrolytes was made in later research [4, 5]. But the presence of solid particles in
electrolyte leads to viscosity rise that prevent liquid aluminum coagulation and metal stay as
small drops at the bath. This fact can cause difficulties in future technological process. The potas-
sium fluoride additives for a long time were not considered as modifying additives because they
destroy the graphite materials – the base of electrolytic cell construction. The developing of new
construction materials [6] that can replace the graphite in the cell allowed using of electrolytes
with great fraction of potassium fluoride. The main advantage of the KF-AlF3 system is the high
alumina solubility even at low temperature and CR [3]. The alumina solubility is said in [7] to be
4 mol. % in potassium cryolite (СR=1.5) at 700 oC and drops to 1.0 mol. % at CR=1.0. As far as
the technology of alumina production brings sodium ions to the electrolyte the electrolysis can
not be performed in pure potassium electrolyte. The wide concentration range of potassium-so-
dium cryolites mixtures had required the alumina solubility investigation in the NaF-KF-AlF3 sys-
tem at constant CR and different alkali metal fluoride fraction. The substitution of K+ by Na+
in the KF-AlF3-aF system is shown in papers [8, 9] to lead the alumina solubility decrease from
5.76 to 2.14 mol. % at CR=1.5 и Т=800 oC. In potassium electrolyte CR=1.3 at 800 oC alumina
solubility is 4.76 mol. %, and at 700 oC – 3.24 mol. %, that is in a good agreement with data [7].
The alumina solubility values in pure potassium system at CR=1.3 are confirmed by further in-
vestigations. Thereby alumina solubility in low-melting electrolytes based on the potassium cryo-
lite at the same conditions is higher than in sodium and lithium ones. In paper [10] the 5 mas. %
CaF2 additive is shown to decrease the Al2O3 solubility from 3.2 to 3.0 mas. %. in eutectic mixture
NaF-AlF3. Our investigations showed that alumina solubility in the electrolytes with a great frac-
tion of potassium fluoride is more depressed by CaF2 additives than in sodium systems.
Electrical conductivity
Electrical conductivity along with alumina solubility is an important technological prop-
erty as far it influences the energy parameters of the process. So long as electrical conductivity
has a strong temperature dependence it is lower in low-melting electrolytes in comparison with
traditional ones. Fist time the conductivity of such electrolytes based on sodium cryolite was
studied by Batashev K. P. [11]. But the data have just evaluating character because the tech-
nique was not perfect. More precise data were published by Abramov [12]. These results were
confirmed by further studies [13]. According to this paper [12] electrical conductivity of sodium
electrolyte at CR=1.3 and temperature 800 °C are twice lower than conductivity of sodium cryo-
ELECTROLYTES FOR LOW TEMPERATURE ALUMINUM ELECTROLYSIS
A.P. Apisarov, A.E. Dedyukhin, A.A. Redkin, P.E. Tinghaev, O.Yu. Tkacheva, Yu.P. Zaikov
Institute of High Temperature Electrochemistry, Ural branch of Russian Academy of Sciences,
Yekaterinburg, Russia

362
The Second International Congress «Non-Ferrous Metals – 2010», September 2–4, Krasnoyarsk, RussiaThe Second International Congress «Non-Ferrous Metals – 2010», September 2–4, Krasnoyarsk, Russia • Part VI • Aluminium Reduction Technology• Part VI • Aluminium Reduction Technology
lite (CR=3) at 1000 oC (1.40, 2.8 S/сm resp.), values for potassium electrolyte are lower. Group
of scientists [14] studied potassium and sodium melts at CR=1.22 in the temperature range
from liquidus up to 700 oC. Close conductivity values were given by authors [15]. As the KF-NaF-
AlF3 system was proposed as a base of low-melting electrolyte the electrical conductivity of the
melts with CR (1.3 и 1.5) was studied [23]. Results [23] are close data of Chinese authors [16],
but the conductivity temperature dependence is stronger in [16]. The literature conductivity
data for different systems at temperature range 700–900 oC are given in table 1.
Table 1
Electrical conductivity of low-melting cryolite systems
Electrolyte CR NaF/(NaF+KF),
mol/mol,
[NaF]+ [KF]=1
Т, oC
κ, S/сm
Source
of data
NaF-AlF3 1.22 1 750
800
1.27
1.34
14
KF-AlF3 1.22 0 700
750
0.96
1.05
14
(Na3AlF6–40 mass %K3AlF6)-AlF3 1.4
1.4
1.6
1.6
1.8
– 750
800
850
900
900
1.11
1.28
1.53
1.66
1.73
16
KF-AlF3 1.3 0 700
750
800
1.03
1.16
1.29
15
KF-NaF-AlF3 1.3
1.3
1.3
1.5
1.5
1.5
0.54
0.79
0.79
0
0
0.73
750
800
800
750
800
800
1.31
1.23
1.34
1.16
1.31
1.49
23
KF-AlF3 1.3
1.3
0 800
850
1.44
1.52
12
The results allow estimating conductivity change depending on CR, temperature and cat-
ion composition. The temperature influence is the most considerable. The substitution of so-
dium fluoride to potassium one (up to 25 mol. %) in cryolite system with low CR decreases con-
ductivity slightly. On the other hand while NaF substitutes KF (up to 25 mol. %) the conductivity
significantly rises. While AlF3 content rises conductivity decreases proportional to CR reduction.
From the technological point of view rather low electrical conductivity of the KF-NaF-AlF3 sys-
tem suggested for industrial process can be compensated by the electrode distance reduction.
Liquidus temperature
Liquidus temperature is one of the basic parameters of the process defining the working
temperature. The KF-NaF-AlF3 system was studied by different authors. The main attention was
paid to mixture of cryolites (CR=3). Results of different authors differ in absolute values and in
shape of liquidus curves (fig.1).
Data [17] are in a good agreement with results [18], and the liquidus curve shape [19] is
better corresponds with results obtained for low CR. In paper [20] there is also a maximum in
liquidus that corresponds to elpasolyte composition. The presence of K2NaAlF6 correlates with
maximum in liquidus curve for all CR studied. There are less data for low CR, moreover part of
them are presented in graphic form. It makes analysis and comparison more difficult. Numeri-
cal values are published in papers [21, 22]. The influence of K+ substitution by Na+ at different
mole relation ([KF]+ [NaF])/[AlF3] on the liquidus curves shape is given in figure 2. The NaF
concentration rise up to the 30 mol. % in the total fraction of fluorides leads to decreasing of liq-
uidus temperature at CR=3.0. However the while the CR decreases the liquidus trend reverses.

363
The Second International Congress «Non-Ferrous Metals – 2010», September 2–4, Krasnoyarsk, RussiaThe Second International Congress «Non-Ferrous Metals – 2010», September 2–4, Krasnoyarsk, Russia • Part VI • Aluminium Reduction Technology• Part VI • Aluminium Reduction Technology
At CR<1.8 NaF additions rise the liquidus. The replacement of sodium fluoride by potassium
one also extremely influence the CaF2 solubility. The CaF2 solubility in sodium electrolyte drops
with the CR decrease (fig. 3). More significant solubility reduction occurs at of Na+ cations
substitution by K+ ones.
650
750
850
950
1050
0 5 10 15 20 25 30 35
CaF2, mass %
t, °
С 2
3
1
Fig. 3. Liquidus temperature of the KF-NaF-AlF3 system depending on CaF2 content
at different CR and NaF concentration: 1 – system Na3AlF6-CaF2 [24];
2 – NaF-KF-AlF3 (CR=1.3, [NaF]=20 mas. %) [25]; 3 – NaF-AlF3 (CR=1.3) [25]
The electrolytes with the NaF content less than 20 mas. % is unreasonable for the low-
temperature aluminum electrolysis process performing due to the low CaF2 solubility, because
with the calcium fluoride accumulation in the bath the significant rise of the liquidus tempera-
ture will occur.
REFERENCES
1. W. C. Sleppy and C. N. Cochran, Bench Scale Electrolysis of Alumina in Sodium Fluoride-
Aluminum Fluoride Melts below 900 oC, Light Metals 1979, p. 385.
2. E. Skybakmoen, A. Solheim, A. Sterten. Alumina solubility in molten salt systems of in-
terest for aluminum electrolysis and related phase diagram data. Metallurgical and materials
Transactions B. V. 28B. February 1997. pp. 81–86.
3. E. Robert, J. E. Olsen, V. Danek et al. Structure and Thermodynamics of Alkali Fluoride–
Aluminum Fluoride–Alumina Melts. Vapor Pressure, Solubility, and Raman Spectroscopic Stud-
ies. J. Phys. Chem. B. 1997. 101. pp. 9447–9457.
4. Craig W. Brown, Laboratory Experiments with Low-Temperature Slurry-Electrolyte Alu-
mina Reduction Cells, Light Metals 2000, pp. 391–396.
5. T. R. Beck, A Non-Consumable Metal Anode for Production of Aluminum with Low-tem-
perature Fluoride Melts», Light Metals 1995, pp. 355–360.
6. Yurii Zaikov, Alexander Chuikin, Alexander Redkin et al. Interaction of heat resistance
concrete with low melting electrolyte KF-AlF3 (CR=1.3). Light metals 2007, pp. 369–372.
7. J. Yang, D. Graczyk, C. Wunsch, J. Hryn. Alumina solubility in KF-AlF3-based low-tem-
perature electrolyte system. Light metals 2007. pp. 537–541.
600
700
800
900
1000
0 0.2 0.4 0.6 0.8 1
[KF]/([KF]+[NaF])
t,oC
КО=3 [19]
КО=1.85 [21]
КО=1.7 [26] КО=1.5 [22]
КО=1.3 [22]
Fig. 2. Liquidus temperatures of the
NaF-KF-AlF3 system at different CR
Fig. 1. Liquidus temperature of the
Na3AlF6-K3AlF6 system
920
940
960
980
1000
1020
0 20 40 60 80 100
K3AlF6 , % mass
t, °
С

364
The Second International Congress «Non-Ferrous Metals – 2010», September 2–4, Krasnoyarsk, RussiaThe Second International Congress «Non-Ferrous Metals – 2010», September 2–4, Krasnoyarsk, Russia • Part VI • Aluminium Reduction Technology• Part VI • Aluminium Reduction Technology
8. A. E. Dedyukhin, A. P. Apisarov, O.Yu. Tkacheva et al. Solubility of Al2O3 in the molten
system KF-NaF-AlF3 (in russian). Rasplavy. 2009. no. 2. pp. 23–28.
9. A.P Apisarov, A. E. Dedyukhin, A. A. Redkin, O.Yu. Tkacheva, Yu. P. Zaikov, Elektrokh-
imiya, 2010, vol. 46, no. 6, p. 672 [Russ. J. Electrochem. (Engl. Transl.), vol. 46, no. 6].
10. E. J. Frazer and J. Thonstad. Alumina Solubility and Diffusion Coefficient of the Dis-
solved Alumina Species in Low-Temperature Fluoride Electrolytes. Metallurgical and materials
transactions 41B, 543–548.
11. K. P. Batashev. Electrical conductivity of molten fluoride solts mixtures of sodium, po-
tassium and aluminium (in russian). Legkie metally. 1936. no. 10. pp. 48–54.
12. Theoretical bases of aluminium metallurgy (in russian). G. A. Abramov, M. M. Vetyu-
kov, I. P. Gupalo et al.. Gosudarstvennoe nauchno-tehnicheskoe izdatelstvo literatury po cher-
noy i cvetnoy metallurgii. Moscow, 1953. p. 583.
23. K. Grjotheim, C. Krohn, M. Malinovsky et al. Aluminium Electrolysis. Fundamentals of
Hall-Heroult Process. 2-nd Edition. – Dusseldorf. Aluminium- Verlag. 1982. 443 p.
14. J. Hives, J. Thonstad. Electrical conductivity of low-melting electrolytes for aluminium
smelting. Electrochemica Acta. 2004. 49. 28. pp. 5111–5114.
15. V. Kryukovsky, A. Frolov, O. Tkacheva et al. Electrical conductivity of low melting cryo-
lite melts. Light metals 2006. pp. 409–413.
16. H. Youguo, L. Yanqing, T. Zhongliang et al. Electrical conductivity of
(Na3AlF6–40 wt. %K3AlF6)-AlF3 melts. Light Metals. 2008. pp. 519–521.
17. P. Fellner et al. Physicochemical properties of the molten system Na3 AlF6-K3 AlF6-Al2O3.
I. The temperature of primary crystallization. Chem. Papers. 1990. 44 (5). pp. 677–684.
18. A. I. Belyaev, Ya. E. Studentsov. Alumina electrolysis with unoxidizable (metal) anodes
(in russian). Legkie metally, 1936. no. 3. pp.15–24.
19. K. Grjotheim et al. Equilibrium studies in the systems K3AlF6-Na3AlF6 and K3A-
lF6-Rb3AlF6/Acta Chemica Scandinavica. 1973. 27. 4. pp. 1299–1306.
20. D. A. Chin and E. A. Hollingshead. Liquidus curves for aluminum cell electrolyte.
IV. System Na3AlF6 and Na3AlF6-Al2O3 with MgF2, Li3AlF6, and K3AlF6. J. Electrochem. Soc.
1966. 113. p. 736.
21. V. Danelik and J. Gabcova. Phase diagram of the system KF-NaF-AlF3. J. Thermal Anal-
ysis and Сalorimetry. 2004. V.76. p.763.
22. A. Apisarov, A. Dedyukhin, A. Redkin et. al. Physical-chemical properties of the KF-
NaF-AlF3 molten system with low cryolite ratio. Light metals 2009. pp. 401–403.
23. A. Dedyukhin, А. Apisarov, O. Tkacheva et al. Electrical conductivity of the (KF-AlF3)-
NaF-LiF molten system with Al2O3 additions at low cryolite ratio. ECS Transactions, 2009, 16
(49), p.317–324.
24. Anne Fenerty and E. A. Hollingshead. Liquidus Curves for Aluminum Cell Electro-
lyte. III. Systems cryolite and Cryolite-alumina with Aluminum Fluoride and Calcium Fluo-
ride. J. Electrochem.Soc., 107, No 12, pp. 993–997.
25. Alexei Apisarov, Alexander Dedyukhin, Elena Nikolaeva et al. Liquidus temperatures of
cryolite melts with low cryolite ratio, Light metals 2010, pp. 395–398.
26. E. V. Nikolaeva, A. E. Dedyukhin, A. A. Redkin et al. Liquidus temperatures in system
NaF-KF-AlF3 with low cryolite ratio. Proceedings of 2008 Joint symposium on molten salts. Oc-
tober 19–23. 2008. Kobe, Japan. pp. 712–715.
365
The Second International Congress «Non-Ferrous Metals – 2010», September 2–4, Krasnoyarsk, RussiaThe Second International Congress «Non-Ferrous Metals – 2010», September 2–4, Krasnoyarsk, Russia • Part VI • Aluminium Reduction Technology• Part VI • Aluminium Reduction Technology
Abstract
Cermet materials made of 83 % nickel ferrite (51.7 % NiO and 48.3 % Fe2O3) and 17 % of a
metallic phase (14 % Cu+3 % Ag, or 17 % Cu) have been previously shown to function effectively for
short terms as inert anodes. The intent of this work was to confirm these results and to quantify their
effectiveness under small-scale electrolysis. Three compositions were manufactured containing the
same proportion of nickel ferrite, but were different in their metallic content. Composition #1 used a
mixture of copper and silver powder (14 %-3 %); composition #2 used a silver coated copper powder
containing about 18 % of silver, resulting in the same proportion (14 %–3 %) of copper and silver in
the cermet; and composition #3 contained 17 % of copper (no silver). The use of a scanning elec-
tron microscope (SEM) confirmed that all compositions of cermet produced had fine, dense, and
homogeneous microstructures, with uniform distribution of the metallic phase. It was observed that
the nickel ferrite consisted of particles typically 5 to 10 microns and that the nickel to iron ratio in
the ferrites was varying within reasonable range. It was also seen that the metallic phase regularly
presented phases very high (pure) in silver. Densities of the cermets were all above 5.95 g/cm 3.
Electrochemical measurements were made on the three compositions of cermets in or-
der to measure their open circuit potential (O. C.P.), their corrosion current right after immers-
ing the anode in the melt, and the same corrosion current but after anodic polarization of the
anode. Reproducible results were obtained, indicating that the lowest corrosion was expected
from the cermet anode made by addition of silver coated copper powder (composition #2). The
cermet made using the mix of copper and silver powder (composition #1) was expected to have
chemical corrosion slightly higher than the one with silver coated copper powder, while the
cermet containing only copper powder was expected to be the most affected by corrosion. All
three compositions showed ability to auto-protect themselves to some extent, by comparing the
evolution of their corrosion current values before and after potentiostatic anodic polarization.
Short term aluminum electrolysis (8 hours) at various current densities (0.5 to 0.8 A/cm 2)
allowed the comparison of the behavior of each composition when used as an anode in hot
(970–980 oC) cryolitic molten salts. In general, the composition #1 (copper and silver powder
mix) showed the best performance, followed by the composition #2 (silver coated copper pow-
der). The composition #3 (copper powder only) showed more tendencies towards degradation.
The first sign of degradation is the loss of the metallic phase at the perimeter of the anode. This
may progress a significant distance within the volume of the anode. The next phase of degrada-
tion involve de-cohesion of the nickel ferrite matrix. The composition #1 operated at 0.5 A/cm 2
shows very little degradation after 8 hours.
Introduction
There are three main materials for inert anodes: semi-conducting ceramics, cermets, and
alloys. Each material has advantages and disadvantages – usually around mechanical, electrical,
and chemical properties. The focus of this work is on cermets and our independent manufactur-
ing and assessment of compositions described [1] as having potential as inert anodes. With this
work, we have started developing cermet anode materials with optimized properties compared
with those which were achieved earlier by various researchers.
Cermet anode manufacturing
Thecermet anode manufacturing protocol was developed and performed at the Queen’s
UniversityCentre for Manufacturing of Advanced Ceramics under the direct supervision of Dr.
Vladimir Krstic. Review of the literature showed that nickel ferrite compositions had been devel-
NICKEL FERRITE CERMETS AS INERT ANODES FOR ALUMINUM ELECTROLYSIS
B. Davis 1, A. Roy 1, S. Bell 1, C. Hitz 1, V. Krstic 2, Z. Krstic 2, D. Simakov 3
1 Kingston Process Metallurgy Inc., Kingston, Ontario, CANADA2 Queen’s University, Kingston, Ontario, CANADA
3 RUSAL ETC Ltd., Krasnoyarsk, RUSSIA

366
The Second International Congress «Non-Ferrous Metals – 2010», September 2–4, Krasnoyarsk, RussiaThe Second International Congress «Non-Ferrous Metals – 2010», September 2–4, Krasnoyarsk, Russia • Part VI • Aluminium Reduction Technology• Part VI • Aluminium Reduction Technology
oped and tested, and that this has been the subject of a number of patents [1, 2, 3, 4, 5]. Review
of the patents and literature gave general guidelines for the cermet fabrication, but many pro-
tocol details were missing. The preparation of the powder (pre-milling, microstrucutre control,
sizing. etc.) and the control of the perovskite structure of adequate composition appeared as
key parameters. Heating rates and precise sintering temperature control also proved to be very
sensitive parameters. Finally, the control of the atmosphere combined with optimization of the
binder addition was found to be essential in achieving high sintered density. After significant
development work, good reproducibility was shown for the production of pellet disc samples,
with no metal bleeding, no micro cracksand even distribution of metal and ceramic phases in
the bulk material. Other properties criteria included high density (>5.95 g/cc), high mechani-
cal strength (>100 MPa) and high electrical conductivity (>100 (Ωcm)-1 at 960 oC).
Synthesis of Nickel-Ferrite (NiFe2O4)
Commercially available nickel-oxide green powder purchased from Fisher Scientific
and iron-oxide powder (metallic based 99.5 %) purchased from Alfa Aesar were used as the raw
materials for the fabrication of nickel-ferrite.
All cermet to be manufactured were to contain 83 % of oxides (made of 51.7 % NiO and 48.3 %
Fe2O3) and 17 % metal. The nature of the metallic portion of the cermet is an important parameter
and defines the three different families of cermet fabricated and tested, as described below.
The first step in the fabrication process was to prepare a nickel ferrite powder mix. This
was done by mixing 51.7 % of NiO and 48.3 % of Fe2O3 and ball milling the mixture for 16 hours
using stainless steel as milling media. The ball to powder ratio was kept at 5 to 1 and alcohol was
used as a vehicle to create suspension.
After drying the ball milled powder mix at 90 oC for 8 hours, the dry powder mixture was
calcined at 1000 °C for 2 hours. The objective of the calcination step is to promote the formation
of a perowskite structure in the oxide phase of the cermet.
Technological parameters used for anode manufacturing
The synthesized NiFe2O4 powder was then mixed with the required metallic powders in or-
der to meet the target compositions: composition #1 used a mixture of copper and silver powder
(14 %-3 %); composition #2 used a silver coated copper powder containing about 18 % of silver,
resulting in the same proportion (14 %-3 %) of copper and silver in the cermet; and composition
#3 contained 17 % of copper (no silver).
Previously calcined NiFe2O4 powder was ball milled with the metallic powders for 16 hours
using stainless steel media and alcohol (methanol) as the vehicle. Polyvinyl alcohol (PVA) in the
amount of 3 wt % was added to the powder mixture. As for the initial ferrite powder prepara-
tion, the ball to powder ratio used was 5:1.
After mixing and ball milling the ferrite powder with the metallic powders, all compositions
were dried in the oven at 90 oC for 2.5 hours, followed by the sieving of the powder mixtures.
At least 10 samples of each composition were pressed by cold isostatic pressing at a pressure of
220 MPa. The dimensions of the green samples were typically 14.0 mm×13.5 mm×108.1 mm.
Sintering was done in an electric resistant furnace (Sentro Tech SST-1700) under a con-
stant flow of argon doped with different concentrations of oxygen. The sintering temperature
ranged from 1100 oC to 1400 oC and sintering time was varied from 1 to 4 hours. After sintering,
the density of the samples was measured (water displacement method), as a primary mode of
quality control of the cermet produced. Samples with a density above 5.95 g/cc were used for
further measurement of other physical properties or for the electrochemical testing.
Physical properties of the samples – Methods and measured values
Electrical Conductivity
Electrical conductivity of the sintered cermet samples was measured using the conven-
tional four-point method, measuring the imposed potential across the sample. The results of the
high temperature electrical conductivity measurements for the first composition are shown in
figure 1. The other compositions showed similar trends, with composition #2 ranging from
60–170 S/cm and #3 from 5 to45 S/cm over the same temperature range as for #1. This can
be compared to other researchers 6 that found the electrical conductivity of similar samples to
range from 10 to 47 S/cm up to 960 oC. Other work [7] saw the electrical conductivity range
from 20–30 S/cm with a spike at 650 oC to 275 S/cm that has not been duplicated by others.

367
The Second International Congress «Non-Ferrous Metals – 2010», September 2–4, Krasnoyarsk, RussiaThe Second International Congress «Non-Ferrous Metals – 2010», September 2–4, Krasnoyarsk, Russia • Part VI • Aluminium Reduction Technology• Part VI • Aluminium Reduction Technology
Mechanical Strength
At least 5 samples of composition 1, 2 and 3 were machined into rectangular bars with
dimensions 3 mm×4 mm×35 mm and used to measure flexural strength of the sintered sample-
susingthe MOR 4 pt. method. The jig used to measure strength had the inner span of 14 mm and
the outer span of 30 mm. The samples were broken under the conventional four-point bending
configuration.
No significant difference in strength was measured for the three compositions. All com-
positions had flexural strength in the range of 140–180 MPa (fig. 2). This compares very well
with other researchers 8 using similar cermets whose fracture strengths were found to be also
between 140–180 MPa with a maximum at 5 % metal of 176.4 MPa.
Microstructural characterization of nickel ferrite cermet samples
Each composition of cermet samples produced was observed under scanning electron mi-
croscope (SEM) in order to characterize their microstructure. The ferrite grain size, the metal
component size and distribution, the homogeneity of the microstructure, the presence of po-
rosity and micro-cracks, or other defects, were among the observations of interest. These are
shown in Figure 3, Figure 4, and Figure 5 below.
In general, all the cermet samples observed show fine and homogenous microstructure.
Some present open porosity, but in general the structure is fully dense. Typical grain size is in
the range of 5 to 10 microns. The nickel ferrites have a variable composition, which is reflected
by different intensity of gray on the back-scattered image (the darker is richer in Fe).
The metal phase size and shape seems to present more variability. The composition #2 us-
ing Ag coated copper flakes seems to produce coarser metal phase and generate more linear
alignments. Taking into account the limited number of samples observed, this composition is the
only one where cracks and linear defects have been observed. This might be detrimental to the
stability of the cermet samples during electrolysis.
081030–1 S2 (50x) 081020–1 S1 (500x)
Fig. 3. SEM micrographs of the cermet, composition #1 (Ag + Cu)
Fig. 1. Change of electrical conductivity with
temperature for Composition #1
Fig. 2. The average bending/flexural strength
of the three different cermet compositions
0
20
40
60
80
100
120
140
160
180
200
0 1 2 3 4
Состав
Пр
оч
но
ст
ь н
а и
зги
б (
Мп
а)Composition #1
0
20
40
60
80
100
120
140
160
180
0 100 200 300 400 500 600 700 800 900 1000 1100
Temperature [C]
Co
nd
uc
tiv
ity
[S
/cm
]

368
The Second International Congress «Non-Ferrous Metals – 2010», September 2–4, Krasnoyarsk, RussiaThe Second International Congress «Non-Ferrous Metals – 2010», September 2–4, Krasnoyarsk, Russia • Part VI • Aluminium Reduction Technology• Part VI • Aluminium Reduction Technology
081112–1 S2 (50x) 081106–1 S1 (500x)
Fig. 4. SEM micrographs of the cermet, composition #2 (Ag coated Cu)
081118–1 S2 (50x) 081114–1 S1 (500x)
Fig. 5. SEM micrographs of the cermet, composition #3 (Cu)
Electrochemical measurements of cermet anodes properties
The objective of the electrochemical measurements was to determine the corrosion pa-
rameters of the three composition of nickel ferrite cermet to be used as anode for molten salts
aluminum electrolysis. Open circuit potentials and corrosion currents were calculated from the
electrochemical tests. The corrosion currents values were determined at different scan rates,
after initial immersion of the cermet anodes in the electrolyte and after an anodic polarization.
The three compositions of anodeswere tested in duplicate.
Experimental
The 1×1×10 cm cermet sticks were cut at4 cm lengths. A graphite holder was used in order
to hold the 1×1×4 cm cermet anode. The aluminum reference electrode and a 1 mm Mo wire
cathode were used in the cell for electrochemical characterisation of anode samples.
The alumina saturated electrolyte with a weight ratio of 1.13 was prepared by mixing
285.3 g of Na3AlF6, 36.7 g of AlF3 and 28 g of α-Al2O3. (8 wt %). A crucible made of 99.8 % alu-
mina was used for melting the salts mixture. The crucible was put inside a stainless steel well.
The reactor was enclosed by a stainless steel lid where the electrodes were attached. This reactor
was sealed and had argon cover. Tests were done at 960–970 oC.
Definition of the corrosion parameters
The corrosion resistance of the cermet anode is characterized by three parameters:
• The open circuit potential (O. C.P.), defined as the potential where there is no current.
• The corrosion current after immersing the anode in the melt.
• The corrosion current after anodic polarization of the anode.
The corrosion current (A⋅cm–2) is defined as the anodic current density occurring at the
thermodynamic oxygen evolution potential.

369
The Second International Congress «Non-Ferrous Metals – 2010», September 2–4, Krasnoyarsk, RussiaThe Second International Congress «Non-Ferrous Metals – 2010», September 2–4, Krasnoyarsk, Russia • Part VI • Aluminium Reduction Technology• Part VI • Aluminium Reduction Technology
The corrosion of the cermet anode takes place in a potential zone between the OCP value
and the potential of the thermodynamic oxygen evolution. A large OCP value will decrease the
potential zone where the corrosion takes place.
The difference between the corrosion current value after immersing the cermet anode in
the melt and after anodic polarization of the anode will characterize the ability of the anode to
develop an anodic passive film that will decrease its corrosion.
In order to determine the corrosion parameters, the following electrochemical measure-
ments were performed in sequence:
• Determination of the ohmic dropusing impedance spectroscopy
• Linear sweep voltammetry at 5, 10, 20, 30, 40 and 50 mV s –1 right after immersion
• Determination of the ohmic drop
• Galvanostatic (anodic) polarization at +0.5 A cm –2 during 2 hours
• Determination of the ohmic drop
• Linear sweep voltammetry at 5, 10, 20, 30, 40, 50 mV⋅s –1 right after anodic polarization
Linear sweep voltammograms were corrected for the ohmic drop before determining the
corrosion current.
Results of electrochemical measurements
Figure 6 shows the linear sweep voltammogram (corrected for the ohmic drop) between
1.2 and 2.8 V, at 5 mVs –1 obtained after immersing the anode in the melt for sample of com-
position #1, which was the copper/silver mixture alloy. Figure 7 shows the same voltammo-
gram in Tafel format. The OCP value was 1.433 V. For comparison, S. Pietrzyk [9] found an
OCP value of 1.441 V for a cermet anode with a density of 4.59 g cm-3, made of 42.9 % NiO,
40.1 % of Fe2O3 and 17 % of Cu. The thermodynamic oxygen evolution potential occurred at
2.28 V. The corrosion current measured at the thermodynamic oxygen evolution potential was
0.072 A cm-2. Between the OCP value and the thermodynamic oxygen evolution potential, we
can see an anodic peak whichwas probably attributed to copper or silver oxidation.
Table 1 gives a compilation of all the OCP values and table 2 shows the associated corrosion
currents. It can be concluded that the cermet anode that gave the lowest corrosion current values
was the one that was made by the addition of silver coated copper powder (anodes #2a and #2b).
The highest corrosion currents values were obtained with the anode prepared with only copper
powder. The composition using the mix of cop-
per and silver powder show good performance,
but did not reach the lowest corrosion obtained
with the addition of silver coated copper pow-
der. The difference in values of OCP between
the types of anodes was very close, but the
best (higher) OCP value was obtained with
the cermet prepared with the silver coated
copper powder as well. Finally, all of the types
of cermet anodes were able to decrease their
corrosion by forming a passive layer during an
1.00 1.25 1.50 1.75 2.00 2.25 2.50 2.75 3.00-0.50
-0.25
0
0.25
0.50
0.75
1.00
1.25
1.50
E (Volts)/ref
I (A
mp
s/cm
2) Thermodynamic oxygen
evolution potential
OCP
Icor = 0.072 A cm-2
I (Amps/cm2)10-5 10-4 10-3 10-2 10-1 100 101
1.00
1.25
1.50
1.75
2.00
2.25
2.50
2.75
3.00
E (
Vo
lts)
/ R
ef
OCP
Fig. 6. Linear sweep voltammogram obtained
at 5 mV⋅s –1, composition #1
Fig. 7. Linear sweep voltammogram plotted
in Tafel format at 5 mV⋅s –1, composition #1
Table 1
OCP values of the cermet anodes tested
OCP / V
Anode # 1a 1.433
Anode # 1b 1.431
Anode # 2a 1.448
Anode # 2b 1.449
Anode # 3b 1.426

370
The Second International Congress «Non-Ferrous Metals – 2010», September 2–4, Krasnoyarsk, RussiaThe Second International Congress «Non-Ferrous Metals – 2010», September 2–4, Krasnoyarsk, Russia • Part VI • Aluminium Reduction Technology• Part VI • Aluminium Reduction Technology
anodic polarization. The best protection was established by the anode with addition of the mix-
ture of copper and silver powders (20 %), followed by the anode prepared with addition of silver
coated copper powder (15 %) and by the anode prepared with addition of copper powder (12 %).
After protection, the cermet anode prepared with addition of silver coated copper powder re-
mained the one with the lowest corrosion.
Table 2
Corrosion currents values in A cm-2 at different scan rates (mV s –1) after immersion and after anodic polarization of the cermet anodes tested
Icor/A cm –2
at 5 mV⋅s –1
Icor/A cm –2
at 10 mV⋅s –1
Icor/A cm –2
at 20 mV⋅s –1
Icor/A cm –2
at 30 mV⋅s –1
Icor/A cm –2
at 40 mV⋅s –1
Icor/A cm –2
at 50 mV⋅s –1
Anode #1aAfter immersion
0.072 0.086 0.11 0.126 0.139 0.153
Anode #1bAfter immersion
0.069 0.085 0.111 0.126 0.137 0.153
Anode #1aAfter polarization
0.063 0.071 0.088 0.098 0.111 0.12
Anode #1bAfter polarization
0.065 0.069 0.087 0.1 0.109 0.12
Anode #2aAfter immersion
0.056 0.066 0.086 0.107 0.121 0.133
Anode #2bAfter immersion
0.054 0.064 0.085 0.106 0.12 0.132
Anode #2aAfter polarization
0.05 0.059 0.073 0.087 0.094 0.108
Anode #2bAfter polarization
0.051 0.06 0.073 0.088 0.095 0.109
Anode #3bAfter immersion
0.109 0.123 0.157 0.182 0.202 0.216
Anode #3bAfter polarization
0.098 0.11 0.141 0.159 0.177 0.184
Short term electrolysis
The cermet samples manufactured were tested by using them in the performance of labo-
ratory scale aluminum electrolysis. The 1 cm×1 cm×10 cm cermets were tested using a molten
aluminum electrolysis cell. All three composi-
tions were tested in duplicate during an 8 hour
electrolysis with a current of 5 A. The cermets’
immersion depth was adjusted for having about
10 cm 2 working area of cermet anode, resulting in
a target current density of about 0.5 A/cm 2.
Electrolysis Set-up
The liquid aluminum cathode electrolysis cell
consisted of a graphite crucible, alumina liner, and
a small alumina crucible (fig. 8). At the bottom of
the graphite container deep cavity was machined
out in order to position the small alumina
crucible inserted for control of the active cathode
area. The internal alumina liner was placed inside
the graphite crucible to electrically insulate
the walls of the crucible. The entire cell was en-
closed by using a stainless steel (SS) well, collar,
silicone o-ring, and a water cooled lid. About 6 g
of Al shot (4–8 mm) was weighed and placed be-
tween the liner and the central alumina crucible.
According to ICP-OESanalysis Al shots had the
following composition: 470 ppm Fe, 184 ppm Ni, Fig. 8. Electrolysis Cell Schematic

371
The Second International Congress «Non-Ferrous Metals – 2010», September 2–4, Krasnoyarsk, RussiaThe Second International Congress «Non-Ferrous Metals – 2010», September 2–4, Krasnoyarsk, Russia • Part VI • Aluminium Reduction Technology• Part VI • Aluminium Reduction Technology
103 ppm Cu, and 0.7 ppm Ag. Subsequently, 275 grams ofcryolite mixture with a NaF/AlF3 ratio
of 1.13, supplemented with 8 wt % Al2O3 alumina was charged into the crucible. Neutron activa-
tion analysis of the initial bath composition showed that it was contaminated with 132 ppm Fe,
10.3 ppm Ni, <175 ppm Cu, and 2.73 ppm Ag. A 200 ml/min flow of argon through the gas-in
port was used during heat up to create an inert gas atmosphere inside the cell. Scanning electron
microscopy (SEM) was performed on a slice of the cermet cut from one end of the sample tested,
before the electrolysis, and on one slice of the working area after the electrolysis.
Electrolysis Runs at 0.5 A/cm 2 – Results
Run #1 – Ag/Cu Powder MixThe SEM micrographs (fig. 9, at 500x magnification) show that the fine, dense and homoge-
neous microstructure is preserved after 8 hours of electrolysis at 0.5 A/cm 2. After the test, a thin
layer of about 25 microns at the surface of the sample seems to have lost its metallic fraction.
081020–1 S1 (500x) 081020–2 S1 (500x)
Fig. 9. SEM micrographs of the cermet before (left) and after (right) the electrolysis run #1
Run #3 – Ag Coated Cu PowderThe SEM micrographs (fig. 10) show that the fine, dense and homogeneous microstruc-
ture is generally preserved after 8 hours of electrolysis at 0.5 A/cm 2. After the test, a layer of
about 200 microns shows a loss of the metallic fraction all around the working anode area and
the development of porosity in that area.
081106–1 S2 (50x) 081106–2 S1 (50x)
081106–1 S1 (500x) 081106–2 S2 (400x)
Fig. 10. SEM micrographs of the cermet before (left)
and after (right) the electrolysis run #3

372
The Second International Congress «Non-Ferrous Metals – 2010», September 2–4, Krasnoyarsk, RussiaThe Second International Congress «Non-Ferrous Metals – 2010», September 2–4, Krasnoyarsk, Russia • Part VI • Aluminium Reduction Technology• Part VI • Aluminium Reduction Technology
Run #6 – Cu PowderThe SEM micrographs figure 11 show that the fine, dense and homogeneous microstruc-
ture is preserved after 8 hours of electrolysis at 0.5 A/cm 2, except for a 200 to 300 micron layer
where the metallics are gone. In that transition zone, the nickel ferrite seems to have loss cohe-
sion. The metallic layer at the interface of the degraded cermet and the crust, was analyzed at
multiple location and showed to be made of Cu, with traces of Ni.
081118–1 S2 (50x) 081118–2 S2 (50x)
Fig. 11. SEM micrographs of the cermet before (left) and after (right) the electrolysis run #6
Electrolysis at higher current density
The both Ag contained cermet compositions that showed the best performance in the
0.5 A/cm 2 short term electrolysis trials and the electrochemical behavior study were then tested
at two greater current densities: 0.65 and 0.8 A/cm 2.
The SEM micrographs (fig. 12) show a sample of Ag/Cu Powder Mix cermet after electroly-
sis at 0.8 A/cm 2 having more pronounced porosity than after electrolysis at 0.5 A/cm 2 for the
same composition (fig. 9). We can see a sharp transition between the dense part of the used
sample and the layer with metal loss and the crust. The 150x picture shows the transition in the
crust area. The 500x picture shows nickel ferrites particles, with variation in the gray intensity.
The group of lighter grains is a high (Ni) nickel ferrite, which is rimmed by essentially pure Cu.
The zone with complete metallic loss is about 150 to 200 micron thick on the sides and within
100 microns all along the bottom of the cermet anode.
081203–1 S1 (50x) 081203–2 S2 (50x)
081203–1 S3 (500x) 081203–2 S4 (150x)
Fig. 12. SEM micrographs of the cermet before (left) and after (right) the electrolysis run #10

373
The Second International Congress «Non-Ferrous Metals – 2010», September 2–4, Krasnoyarsk, RussiaThe Second International Congress «Non-Ferrous Metals – 2010», September 2–4, Krasnoyarsk, Russia • Part VI • Aluminium Reduction Technology• Part VI • Aluminium Reduction Technology
Electrolysis results summary
Results for the electrolysis tests are shown in table 3. It should be noted that, according to
the measures taken, all three compositions showed the ability to protect themselves from cata-
strophic corrosion, following measurements before and after a 2 hour potentiostatic anodic po-
larization. In addition to the physical degradation, an important criterion for judging the per-
formance of the nickel ferrite cermets is the composition of the aluminum produced. Short term
electrolysis is certainly not sufficient for definitive judgment on the purity of the aluminum to be
produced. In one way, impurities are diluted by the aluminum used as initial charge. As well, it is
expected that the cermet degradation will be worst in the initial period of operation. As such, the
micrographs are considered the best evidence of survivability of the anodes during electrolysis.
The loss of metal from the nickel ferrite matrix in the periphery of the sample, followed
by de-cohesion of the matrix appears as the main degradation mechanism. The composition #3
(copper powder) is clearly the most sensitive to that mechanism. The nickel ferrite matrix los-
es its cohesion more easily. Surprisingly, after measuring the electrochemical performance in-
dicating that the silver coated copper powder gives better resistance to corrosion, this composi-
tion seems to have a higher tendency for loss of its metallic fraction. However the nickel ferrite
matrix stays fairly cohesive, potentially allowing the sample to stabilize. The best stability clearly
goes to the cermet fabricated from the copper and silver powder.
The copper and silver powders have smaller average diameter than the silver coated copper
powder but, more importantly, they have a much higher effective surface area (based on micro-
scopic observations). This likely allows for a better small scale interaction with the nickel ferrite
particles and a better distribution. The flaky and dense nature of the silver coated copper powder
seems to promote linear defects and channeling of the metallics out of the nickel ferrite matrix.
Table 3
Results of short term electrolysis tests
Run #
Cermet Type
Cermet Density (g/cm 3)
Current Density
(A/cm 2)
Al Produced
(g)
Fe (ppm)in salt
Ni (ppm)in salt
Cu (ppm)in salt
Ag (ppm)in salt
Fe (ppm)
inAl°
Ni (ppm)
inAl°
Cu (ppm)
inAl°
Ag (ppm)
inAl°
1 Ag/Cu 5.97 0.50 5.2 362 330 378 140 1499 1115 1701 273
2 Ag/Cu 6.10 0.50 4.5 94 49.9 200 20.0 2113 561 719 150
3 Ag Coated
6.08 0.50 4.9 128 64.9 <280 19.9 3102 2504 4070 680
4 Ag Coated
6.07 0.50 4.0 289 85.5 555 90.5 6221 244 2675 818
5 Cu 6.01 0.50 5.1 171 10.7 <150 0.42 9808 588 497 49
6 Cu 6.03 0.50 5.2 193 29.5 227 0.73 4163 442 2385 19
7 Ag Coated
6.00 0.80 10.9 719 1004 1965 470 5170 243 3295 1450
8 Ag Coated
6.08 0.65 9.2 269 122 302 39.1 2674 225 2847 959
9 Ag/Cu 6.08 0.65 6.9 112 59.0 <200 11.7 4293 471 3376 440
10 Ag/Cu 6.06 0.80 11.3 227 138 361 120 3491 454 2784 943
Conclusions
Cermet anode manufacturing procedure were developed which allowed to produce sample
meeting properties criteria:
Density of not less than 5.95 g/cm 3 – the best value achieved was 6.08 g/cm 3 for Ag coated Cu and Ag/Cu mixed metal phase.
• Electrical conductivity (at 960 oC) of not less than 100 ohm –1cm –1 – the samples of both compositions containing Ag met that criteria, with high temperature conductivity of over 150 ohm–1cm–1.
• Mechanical strength not less than 100 Mpa – all compositions had strength of 140 Mpa or more.

374
The Second International Congress «Non-Ferrous Metals – 2010», September 2–4, Krasnoyarsk, RussiaThe Second International Congress «Non-Ferrous Metals – 2010», September 2–4, Krasnoyarsk, Russia • Part VI • Aluminium Reduction Technology• Part VI • Aluminium Reduction Technology
• Absence of bleed out of the metal phase – the samples produced did not show metal phase bleed out.
• Absence of micro cracks – the vast majority of the samples produced were free of microc-racks.
Even distribution of metal and ceramic phases in the bulk material – all micrographs showed homogeneous distribution of the phases.
The electrochemical measurements performed allowed for quantification of the ability of
each cermet composition to resist the chemical corrosion during high temperature aluminum
electrolysis in a bath of molten cryolite. The cermet using the silver coated copper powder
(Composition #2) showed the best performance, followed by the cermet made using the mix-
ture of copper and silver powder (Composition #1), while the cermet using only copper pow-
der (Composition #3) showed the worst performance.
All compositions performed adequately during the 8-hour electrolysis. The increase in cur-
rent density from 0.5 to 0.65 and 0.80 A/cm 2 had a drastic impact on the ability of the cermets
to resist degradation. At 0.5 A/cm 2, the degradation was limited to a very thin layer and cermets
may be able to withstand a much longer electrolysis run. The loss of metal from the nickel fer-
rite matrix in the periphery of the sample, followed by de-cohesion of the matrix appears as the
main degradation mechanism. Based on micrographic observations, the best cermet composi-
tion seems to be the one using the copper and silver mix, followed by the one using the silver
coated copper powder. Again the composition using only copper powder showed much more
degradation at all current densities.
As an initial interpretation of these results, we believe that the morphology of the metallic
powder used has a very important role to play in anode stability.
REFERENCES
1. Ray, S. P. et al., «Inert electrode containing metal oxides, copper, and noble metal», US Pat-
ent 6332969, Dec. 25, 2001
2. Yao, Guangchun et al., «Inert anode material for aluminium electrolysis and method for
manufacturing same», CN101255570 (A), Sept. 3, 2008
3. Wu, Xianxi, et al., «Nanao metal ceramic inert anode material for aluminium electrolysis
and preparation method thereof», CN101255569, Sept. 3, 2008
4. Veronique, L.; Armand, G., «Inert anode production, comprises use of cermet contain-
ing iron, nickel and copper, for production of aluminum by igneous electrolysis», FR2852331 (A1),
Sept. 17, 2004
5. Dimilia, R. et al., «Stable inert anodes including an single-phase oxide of nickel and iron»,
US6758991 (B2), July 6, 2004
6. Tian, Zhong-liang; Lai, Yan-qing; Li, Jie; Liu, Ye-xiang, «Electrical conductivity of
Cu/(10NiO-NiFe2O4) cermet inert anode for aluminum electrolysis», Journal of Central South Uni-
versity of Technology (English Edition) (2007), 14 (5), 643–646.
7. Olsen, E. and Thonstad, J., «Nickel ferrite as inert anodes in aluminium electrolysis: Part I Ma-
terial fabrication and preliminary testing», Journal of Applied Electrochemistry, 29 (1999) 293–299
8. Zang G. et al., «Effect of metallic phase content on mechanical properties of (85Cu-
15Ni)/(10NiO-NiFe2O4) cermet inert anode for aluminum electrolysis», Trans. Nonferrous Met.
Soc. China 17 (2007) 1063–1068
9. S. Pietrzyk, World of Metallurgy – ERZMETALL, 60 –5 (2007), 295

375
The Second International Congress «Non-Ferrous Metals – 2010», September 2–4, Krasnoyarsk, RussiaThe Second International Congress «Non-Ferrous Metals – 2010», September 2–4, Krasnoyarsk, Russia • Part VI • Aluminium Reduction Technology• Part VI • Aluminium Reduction Technology
The low-temperature aluminum electrolysis is a complicated task including the search of
low-melting electrolytes, electrode (anode and cathode) and construction materials. It is impos-
sible to study one of the problems listed separately because the change of one parameter influ-
ences others. Materials of the same composition show different stability in different electrolytes,
one can be almost inert anode in certain electrolyte and it has a high corrosion rate in another
melt. Only a complex solution of such questions as electrolyte and materials search can bring us
to the final step of cell design.
For the several years researchers of IHTE study the low-temperature aluminum electrolysis
problems as a complex task.
Construction materials
Traditionally anode, cathode and construction stuff are made of carbon materials because
of its high corrosion resistance in aggressive fluoride medium. But the industrial carbon materi-
als have a low stability against electrolyte penetration due to the porosity that leads to the cath-
ode and bath lining degradation. Modifying of electrolyte by potassium and lithium fluorides
or complete change of sodium cryolite by potassium one leading to the working temperature
decrease (down to 700–800 oC) are the prospective ways of technology development. But the
potassium cryolite is inconsistent with carbon materials [1], therefore new construction materi-
als stable against this electrolyte are required.
The results of investigations [2, 3] showed that refractory carbides and nitrides are pro-
spective construction materials for use in fluoride melts, for example SiC-Si3N4. In paper [4]
the interaction of SiC-Si3N4 with the NaF (12)-KF (30)-LiF (3)-AlF3 (55), mas. % melt was stud-
ied. The gravimetry and the 72-hours lab-scale electrolysis results showed that corrosion of
the SiC-Si3N4 block in the electrolyte investigated at 800 °C five times lower than in traditional
sodium cryolite at 960 oC. The presence of metal aluminum does not influence the materials
corrosion significantly and alumina dissolved leads in slight decrease of corrosion.
The aluminum nitride also is one of the prospective materials for aluminum electrolysis cells.
It is stable in presence of liquid Al and fluorides, and under air atmosphere due to the α-Al2O3 dense
film formed on its surface [4, 5]. The sintered aluminum nitride was shown not to interact with
the alumina saturated electrolyte in absence of oxidant. Moreover aluminum nitride has a high
thermal conductivity (close to copper) allowing formation of stable side wall crust.
At the present time the refractory high-alumina concretes are often used in presence of
aluminum and its alloys in furnaces and mixers of aluminum industry. In paper [6] the experi-
mental results of interaction of the refractory high-alumina concrete with potassium electrolyte
(CR=1.3) depending on the concrete composition, preliminary sintering and electrolyte tem-
perature are presented. The materials sintered preliminary at 1000 oC did not corrode virtu-
ally in the KF-AlF3-Al2O3 electrolyte with alumina concentration no less than 2.5 mas. %. Labo-
ratory 100-hours aluminum electrolysis from the same melt at 750 oC using the vessel of the
refractory high-alumina concrete showed stability and corrosion resistance of the material.
Inert anode for the low-temperature electrolysis
The simplicity of production and mechanical strength make the metal alloys the most pro-
spective materials for inert anode from the economic and technological point of view comparing
with oxide ceramics and cermets. Our experience of long-term tests of anodes with different
CONSTRUCTION AND ELECTRODE MATERIALS FOR LOW TEMPERATURE ALUMINUM ELECTROLYSIS
A.E. Dedyukhin, V.A. Kovrov, A.P. Khramov, A.Yu. Chuikin, Yu.P. Zaikov
Institute of High Temperature Electrochemistry,
Ural branch of Russian Academy of Sciences, Yekaterinburg, Russia

376
The Second International Congress «Non-Ferrous Metals – 2010», September 2–4, Krasnoyarsk, RussiaThe Second International Congress «Non-Ferrous Metals – 2010», September 2–4, Krasnoyarsk, Russia • Part VI • Aluminium Reduction Technology• Part VI • Aluminium Reduction Technology
structure and composition at 960 oC (most of the samples were alloys), showed the necessity
of their resource increasing [8]. The operating temperature decreasing allows anode service
life increase due to the anode components solubility reduction in electrolyte and the alloy oxi-
dation rate lowering [9]. For the optimal work of anode with the surface oxide layer the salt
mixtures of KF, NaF, AlF3 can be proposed for low-temperature electrolysis [7]. The suitable alu-
mina solubility in such electrolyte and the dissolution rate influencing the anode dissolving rate
(cathode Al purity) allow choosing current load and anode current density. Taking into account
the metal oxide dissolution rate depending on the alumina concentration the electrolyte choose
will play a great role in the problem of inert anode durability increase.
The temperature lowering creates new requirements to the metal-oxide anode composition
because the electrical conductivity of oxides possessing semi-conducting nature decreases. In
paper [9] was shown that Ni content increasing in initial alloy > 80 mas. % leads to the electri-
cal conductivity decrease of oxide layer forming during the electrolysis at 960 oC. At that the
cell voltage and the local current density at 3-phase anode border rise. The increase of cumula-
tive Fe and Cu content (for Cu-Fe-Ni system) at initial alloy leads to the Fe 3+ and Cu+ cations
fraction rise substituting Ni 2+ in the NiO lattice, as a result the electrical conductivity of ox-
ide layer based on NiO rises. At Ni content in initial alloy less than 40÷60 mas. %, oxide layer
formed on the anode during the electrolysis at 700÷850 oC, excepting binary oxides based on
NiO, contained Cu2O, Fe3O4 и NiFe2O4 having appropriate conductivity.
There are literature data relating the use of Cu-Al [10–12], Cu-Fe-Ni и Cu-Ni-Al [13] for elec-
trolysis at 700–850 oC. We investigated alloys (mas. %): Cu-Al(3÷5) [9, 14, 16] и Cu(14÷65)-
Fe(13÷30)-Ni(63÷12), Cu-Fe(6)-Ni(4)-Al(6) [9, 11]. The electrolysis was carried out in an open
two-electrode cell under galvanostatic conditions. Alundum crucible was used. The electrolyte
(500–700 g) was prepared from the salts of technical grade. Liquid aluminum at the bottom of
the crucible was used as a cathode. The cathode current lead was made of W or Mo. The anode in
experiments were studied at the 0.4÷0.5 current А/сm 2 density. Alumina concentration in elec-
trolyte during the electrolysis was maintained close to the saturation level (4.0÷5.5 mas. %) by
hourly additions. The experiment was performed from 2 to 80 hours up to the anode essential
degradation. The current, cell voltage and temperature data were registered.
Table 1
Calculated parameters n, K, VOX, ylim, τinit; experimental values VD and oxide thickness after 72 hours electrolysis, y72.
№ Anode,
mas. %
*Ele
ctro
lyte
t ±
10
, °C
n K,
mm⋅h–n
VОX (τ),
сm/year
** VD,
сm/year
y 72,
mm
of
all
oy
y lim
,m
m o
f a
llo
y
τinit,hrs
τ = 4 τ =72 а b
1 Cu-Fe(32)-Ni(20) 1 850 0.66 0.025 12 5.3 3.5 2.7 0.29 0.67 ≥1500
2 Cu-Fe(32)-Ni(20) 2 800 0.68 0.01 4.2 1.8 0.9 0.13 0.51 ≥3000
3 Cu-Fe(6)-Ni(4)-Al(6) 2 800 0.47 0.220 45 11 5.3 3.9 1.4 2.8 ≥2000
4 Cu-Al(4) 2 800 0.59 0.071 22 8.2 5.1 2.1 0.58 1.2 ≥1500
5 Cu-Al(4) 1 850 0.69 0.086 40 22 19 16 0.60 0.76 ≥300
* (mas. %): 1. NaF(34)-KF(12)-AlF3(50)-CaF2(4); 2. NaF(13)-KF(29)-AlF3(58).
** Dissolution rate (VD)) was calculated by approximate method 3 [1] (a), and with chemical
analysis data of thе electrolyte and cathode aluminum by method 1 [15] (b), [alloy cm/year].
To characterize the corrosion stability of the metallic anode the new research and calcula-
tion technique of testing the oxide layer protective function (on the value of parameter n) was
suggested in [15]. The method allows predicting the steady state (within the initial period τinit)
characterized by the constant similar rates of the metallic anode oxidation, VOX, and dissolu-
tion/erosion of its oxide layer, VD (VD (τinit)≈VОX, [cm alloy/year]), and also the constant steady
state oxide layer thickness ylim in the case when it possess an ability to decelerate further oxida-
tion (constant value n<1). The technique allows forecasting of the metal anode service life by
means of extrapolation of experimental results (oxidation depth, x, and oxide layer thickness
y [mm/year]). In paper [16] calculated values of VOX, VD, x, y based on experimental data (τ≤72 h),

377
The Second International Congress «Non-Ferrous Metals – 2010», September 2–4, Krasnoyarsk, RussiaThe Second International Congress «Non-Ferrous Metals – 2010», September 2–4, Krasnoyarsk, Russia • Part VI • Aluminium Reduction Technology• Part VI • Aluminium Reduction Technology
forecast and calculated oxidation parameters n, K (estimated by (10) – [8]), oxide layer limit-
ing thickness ylim, τinit for alloys based on Cu (see table., № 1, 3, 4, 5). Alloy Cu-Fe(32)-Ni(20),
mas. %, that showed the least oxidation and dissolution rates, was studied at 800 oC dur-
ing 196 h. The results of calculation using technique [15] are given in table (experiment 2)
and in fig. 1.
Anode appearance after experiment is shown in fig. 4. The х–τ and y–τ dependences can
be used for the anode mass and size change forecasting (fig. 2). The density of complex oxide
compaunds was calculated according the additivity rule using the individual oxide densities.
Oxide layer was consisted of Cu2O, Fe3O4 and NiFe2O4 (XRDA and MRSA), the thickness of
partly oxidized metal layer was less than 200 mkm (fig. 3). Thus, temperature decrease from
850 to 800 oC allowed essential decreasing of the anode oxidation and dissolution rate (average
1 and 2 tables), the results are approved by 196 h experiment.
The investigation of anode and construction materials performed in the low temperature
electrolytes showed encouraging results. The new technique of corrosion rate calculation for
anode materials was proposed and successfully used at analysis of experimental results.
The work was financially supported by the Program of the Ural Division of the Russian
Academy of Sciences.
Fig. 1. Time curves of anode oxidation
depth х, surface oxide layer thickness у, and
dissolved oxide thickness z for experiment 2
(table). х, у points – experimental values. z
points and z–τ curve – calculated by (3)- [15].
Long dotted curves – forecast
Fig. 3. Surface layer microstructure of anode
Cu-Fe (32)-Ni (20), mas. % in cross-section
after electrolysis, τ =196 h
Fig. 2. Calculated linear half-size downsizing
of metal anodes with surface oxide layer.
Curve numbers correspond to experiments
number in table
Fig. 4. Appearance of anode Cu-Fe (32)-
Ni (20), mas. % after electrolysis, τ =196 h.
Dotted line- immersion depth
0,01
0,10
1,00
1 10 100 1000 10000
τ, h
x,
y, z
, A
llo
y m
m
- x
- y
- z
ylim
0,001
0,01
0,1
1
10
1 10 100 1000 10000
τ, h
mm
1 25
4
3

378
The Second International Congress «Non-Ferrous Metals – 2010», September 2–4, Krasnoyarsk, RussiaThe Second International Congress «Non-Ferrous Metals – 2010», September 2–4, Krasnoyarsk, Russia • Part VI • Aluminium Reduction Technology• Part VI • Aluminium Reduction Technology
REFERENCES
1. A.I. Belyaev, «Influence of potassium compounds on the degradation if the carbon bot-
tom of aluminum cell», Tsvetnie metally (шт Russian), 1946, № 3, p. 34–40.
2. А.N. Naumchik, С.V. Alexandrovsky. The use of new refractory materials in aluminum
electrolysis. Text of lectures (in Russian). – Leningrad.: LGI, 1985. 44 p.
3. E. Skybakmoen, H. Gudbrandsen and L.I. Stoen, «Chemical resistance of sidelining ma-
terials based on SiC and carbon in cryolitic melts – a laboratory study», Light Metals 1999, pp.
215–222.
4. А.Yu. Chuikin, D.А. Beketov, V.B. Malkov et al. Corrosion of sintered aluminum nitride
under air. (in Russian) Vestnik UGTU. Seriya himicheskaya. Yekaterinburg: GOU VPO UGTU-
UPI. 2005. pp. 82–86.
5. A. Chuikin, Y. Zaikov. Interaction of composite based on AlN materials with chloride
and oxide-fluoride melts (In Russian). XXV scientific conference in RHTU D. I. Mendeleeva. Pro-
ceedings, 2 part Novomoskovsk, 2006. – pp. 14–15.
6. A. Chuikin, Y. Zaikov, A. Redkin, et al. Interaction Of Heat Resistance Concrete With Low
Melting Electrolyte KF-AlF3 (CR=1.3). Light Metals 2007, p. 369–372.
7. Alexei Apisarov, Alexander Dedyukhin, Elena Nikolaeva et al. Liquidus temperatures of
cryolite melts with low cryolite ratio. Light metals 2010, pp. 395–398.
8. V.A. Kovrov, N. I. Shurov, A.P. Khramov and Yu.P. Zaikov, Izv. VUZ. Tsvet. Metallurgiya,
2009, no. 5, 46–54 [Russ. J. Non-Ferrous Metals (Engl. Transl.), vol. 50, no. 5, 492–499].
9. V.A. Kovrov, A.P. Khramov, A.A. Redkin and Y.P. Zaikov, ECS Trans., 16 (39), 7–17 (2009).
10. J. N. Hryn and D. R. Sadoway, Light Metals 1993, Edited by Subodh K. Das, TMS (The
Minerals, Metals & Materials Society), 1992, 475–483.
11. J. Yang, J.N. Hryn, B.R. Davis, A. Roy et al., Light Metals 2004, Edited by Alton T. Tab-
ereaux, TMS (The Minerals, Metals & Materials Society), 2004, 321–326.
12. J. Yang, J. N. Hryn and G. K. Krumdick, Light Metals 2006, Edited by Alton T. Tab-
ereaux, TMS (The Minerals, Metals & Materials Society), 2006, 421–424.
13. Z. Shi, J. Xu, Z. Qiu et al., JOM 55 (11) 2003, 63–65.
14. Y. Zaikov, Khramov A., Kovrov V. et. al., Light Metals 2008, Edited by David H. DeY-
oung, TMS (The Minerals, Metals & Materials Society), 2008, 505–508.
15. A.P. Khramov, V.A. Kovrov, N. I. Shurov and Yu. P Zaikov, Elektrokhimiya, 2010, vol.
46, no. 6, p. 700 [Russ. J. Electrochem. (Engl. Transl.), vol. 46, no. 6, p.659].
16. V.A. Kovrov, A.P. Khramov, N.I. Shurov and Yu.P. Zaikov, Elektrokhimiya, 2010, vol. 46,
no. 6, p. 707 [Russ. J. Electrochem. (Engl. Transl.), vol. 46, no. 6, p.665].

379
The Second International Congress «Non-Ferrous Metals – 2010», September 2–4, Krasnoyarsk, RussiaThe Second International Congress «Non-Ferrous Metals – 2010», September 2–4, Krasnoyarsk, Russia • Part VI • Aluminium Reduction Technology• Part VI • Aluminium Reduction Technology
When developing a computer model takes into account the full range of physical and
chemical transformations of the initial substances and components of the melt electrolytic pro-
duction. The temperature range was 25–1000 oC when the process of raw material processing
and analysis of technological samples were simulated.
Simulated thermodynamic system includes: melt electrolyte with dissolved its technology
components, one-phase solid solutions and phase equilibrium with the melt mixture of gas-
es, ie substances, which are analyzed by means of physical and chemical diagrams: NaF-AlF3,
Na3AlF6-AlF3, LiF-AlF3, NaF-CaF2-AlF3, KF-AlF3, Na3AlF6-AlF3-Al2O3.
Along with the independent components (Al, Na, K, Li, Ca, Mg, Fe, Si, C, S, O, F, H), stoi-
chiometric unit (e) shows that if necessary in the system may be introduced electrically charged
particles – ions and electrons. When minimizing the free energy function G (x) thermodynamic
factors dissolution of structural components in the melt or gas mixture are taken into account by
using the mole fraction of component in a test phase, and its activity for condensed matter and
fugacity – for gases.
To bring the model experiment to real process conditions, were used samples taken at the
aluminum plant from both parties, recycled aluminum, fluorides, corrective additives, anode
materials. The results obtained by chemical analysis (CA), X-ray diffraction (XRD) and physical-
chemical model (PCM), were subjected to comparative analysis. The results of physicochemical
simulations have clarified the elemental and mineralogical composition of technology compo-
nents, depending on temperature and cryolite ratio (CR).
The composition of molten electrolyte, formed during the analytical procedures presented
compounds that differ from those that exist in processing aluminum electrolysis. Higher discrep-
ancies by fluorine, lithium and silicon associated with the release of these components in the gas
phase, which does not take into account by CA and RFA. Characteristically, the differentiation in
the definition of CR (2.28 units – according to PCM and 2.38 units – ARF) can be explained by
evolution NaAlF4 (gas) in the processing and analyzing samples of the electrolyte (to account for
this phenomenon in the model, the separate tank gas trap was used).
Computerization of the plant systems makes it possible in the process of dispensing and
consumption of raw materials to stabilize CR electrolytes, to improve the rate of alumina dis-
solution of alumina, eliminating the imbalance of sodium. Using these systems of physical and
chemical models and the simulation results allows to introduce a number of important technical
decisions which increases the overall level of electrolysis production:
When used in a shop, as well as in buildings tested software and PCM model unit can be
mounted and installed in the operation of an automated system with modern software and con-
trol the process of electrolysis (type Troll, SCAD, Delta-V and others).
PHYSICAL AND CHEMICAL MODELING FOR CONTROL AND OPTIMIZATION TECHNOLOGY RELATIONSHIP COMPONENT IN THE ALUMINIUM ELECTROLYSIS
N.V. Golovnykh 1, A.V. Mukhetdinova 1, V.A. Bychinsky 1, K.V. Chudnenko 1, I.I. Shepelev 2
1 A.P. Vinogradov Institute of Geochemistry, SB RAS, Irkutsk, Russia2 EKO-Engineering Ltd., Achinsk, Russia
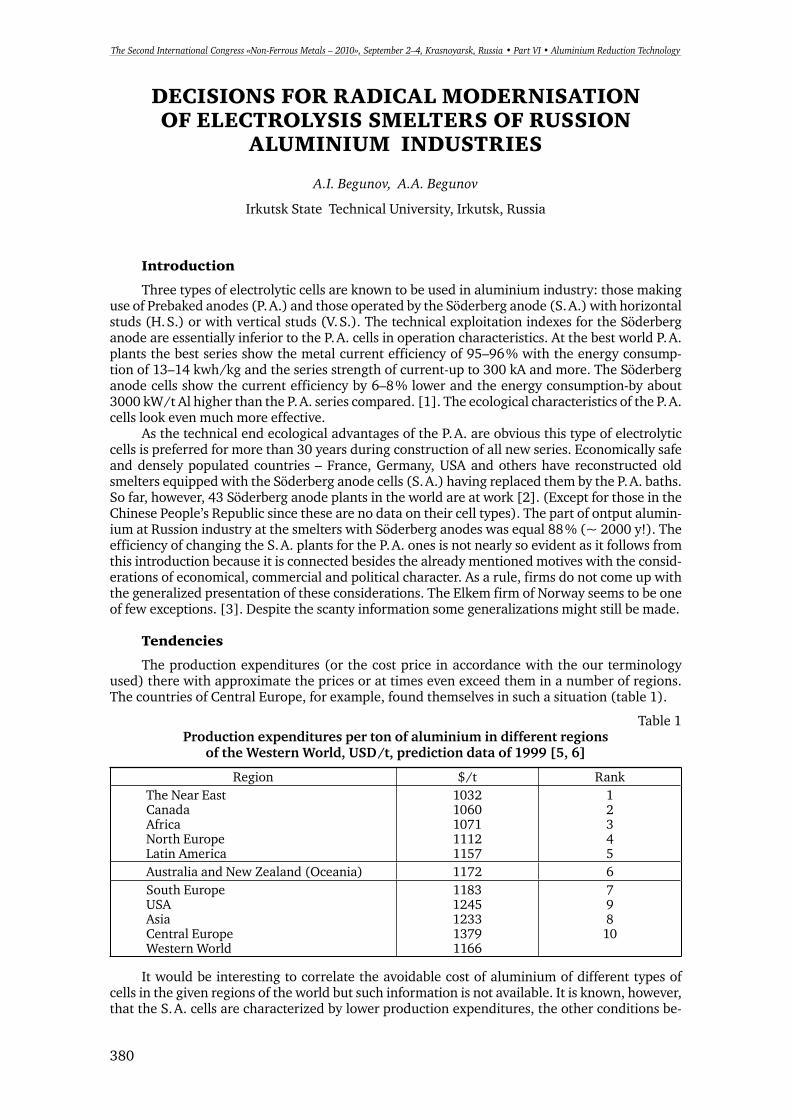
380
The Second International Congress «Non-Ferrous Metals – 2010», September 2–4, Krasnoyarsk, RussiaThe Second International Congress «Non-Ferrous Metals – 2010», September 2–4, Krasnoyarsk, Russia • Part VI • Aluminium Reduction Technology• Part VI • Aluminium Reduction Technology
Introduction
Three types of electrolytic cells are known to be used in aluminium industry: those making
use of Prebaked anodes (P. A.) and those operated by the S derberg anode (S. A.) with horizontal
studs (H. S.) or with vertical studs (V. S.). The technical exploitation indexes for the S derberg
anode are essentially inferior to the P. A. cells in operation characteristics. At the best world P. A.
plants the best series show the metal current efficiency of 95–96 % with the energy consump-
tion of 13–14 kwh/kg and the series strength of current-up to 300 kA and more. The S derberg
anode cells show the current efficiency by 6–8 % lower and the energy consumption-by about
3000 kW/t Al higher than the P. A. series compared. [1]. The ecological characteristics of the P. A.
cells look even much more effective.
As the technical end ecological advantages of the P. A. are obvious this type of electrolytic
cells is preferred for more than 30 years during construction of all new series. Economically safe
and densely populated countries – France, Germany, USA and others have reconstructed old
smelters equipped with the S derberg anode cells (S. A.) having replaced them by the P. A. baths.
So far, however, 43 S derberg anode plants in the world are at work [2]. (Except for those in the
Chinese People’s Republic since these are no data on their cell types). The part of ontput alumin-
ium at Russion industry at the smelters with S derberg anodes was equal 88 % (~ 2000 y!). The
efficiency of changing the S. A. plants for the P. A. ones is not nearly so evident as it follows from
this introduction because it is connected besides the already mentioned motives with the consid-
erations of economical, commercial and political character. As a rule, firms do not come up with
the generalized presentation of these considerations. The Elkem firm of Norway seems to be one
of few exceptions. [3]. Despite the scanty information some generalizations might still be made.
Tendencies
The production expenditures (or the cost price in accordance with the our terminology
used) there with approximate the prices or at times even exceed them in a number of regions.
The countries of Central Europe, for example, found themselves in such a situation (table 1).
Table 1
Production expenditures per ton of aluminium in different regions of the Western World, USD/t, prediction data of 1999 [5, 6]
Region $/t Rank
The Near EastCanadaAfricaNorth EuropeLatin America
10321060107111121157
12345
Australia and New Zealand (Oceania) 1172 6
South EuropeUSAAsiaCentral EuropeWestern World
11831245123313791166
798
10
It would be interesting to correlate the avoidable cost of aluminium of different types of
cells in the given regions of the world but such information is not available. It is known, however,
that the S. A. cells are characterized by lower production expenditures, the other conditions be-
DECISIONS FOR RADICAL MODERNISATION OF ELECTROLYSIS SMELTERS OF RUSSION
ALUMINIUM INDUSTRIES
A.I. Begunov, A.A. Begunov
Irkutsk State Technical University, Irkutsk, Russia

381
The Second International Congress «Non-Ferrous Metals – 2010», September 2–4, Krasnoyarsk, RussiaThe Second International Congress «Non-Ferrous Metals – 2010», September 2–4, Krasnoyarsk, Russia • Part VI • Aluminium Reduction Technology• Part VI • Aluminium Reduction Technology
ing equal. In this case the lowest avoidable cost of the metal is reached at old smelters with H. S.
Using the [5 and 6] data makes it possible to calculate the production avoidable cost depend-
ing on the share of efficiencies cells with the S. A. and prebaked anodes cells (fig. 1). As is seen,
this dependency manifests itself very distinctly and tangibly relative to the quantity.
Fig. 1. Dependence of production expenditures
from part of ontput cells nith different tipe.
ϕPA – part of ontput with P. A.; ϕZA– part of ontput with Z.A
Regions: 1 – Near Eeast; 2 Canada; 3 – Africa; 4 – Noth Europ;
5 – Latin’s America; 6 – Australia; 7 – Sonch Europe;
8 – Asia; 9 – USA; 10 – Central Europe
Any increase in the share of the efficiencies (powers) with P. A. is uniquely accompanied by
a considerable growth in production expenditures. These additional expenditures are meant for:
1) anode pressing;
2) anode baking;
3) equipment for anode rearrangement;
4) candle-end treatment.
Three regions in the world are the exceptions from the figure1 dependency. They are Austra-
lia and New Zealand treating the local alumina from the Australian richest deposits of hydroargil-
lite bauxites (p. 6, fig. 1), the Near East with not less unique oil reserves (p. 1, fig. 2) and Africa
with the highly favorable complex of conditions for the development of industry (p. 3, fig. 1).
The figure 1 dependence can be explained in some other way. To lower the avoidable costs
the share of the S derberg anode cells efficiencies (powers) should be considerable. In other
words it is impossible to reequip the S. A. plants with the P. A. technology. This was, evidently
clear for the ALCOA, ALCAN, ELKEM, Hydro Alum. and other firms’ managers long ago.
The task is to test and introduce such technologies on radical modernization of old S. A.
smelters which will help heighten the technical indices of these latter to the work indices of the
new and best P. A. series without replacing the type of the current lead.
Prerequisites
The level of production profitableness by the Hall-Heroult method is relatively low and the
existing exceptions do not rule out this statement. Australia, the Near East, Africa and Russia
develop concurrent with the other regions of the world. «Equalization» of the production avoid-
able costs for this regions with the prices will take place later, bat «the planning of the future»
should be of interest to any firm and region of the world.
The P. A. cells were being intensively improved for the last 30–40 years by the world sci-
entific-technical community. As to the S. A. bath series, they attracted considerably less atten-
tion. Russian plants both with H. S. and V. S. gained the most outstanding results in strength of
current, current efficiency, energy consumption and ecological characteristics. The metal cur-
rent efficiency with the S. A. cells reaches ~90 % at the direct current energy consumption of
15500 kwh/t. These results were achieved by means of a constant strict control over the state
of each electrolytic cell by using modern information systems, introducing acid electrolytes, de-
creasing the frequencies of anode effects and other. However, the designs of the electrolytic cells
themselves remained practically unchanged. Further progress with the S. A. cells is possible in

382
The Second International Congress «Non-Ferrous Metals – 2010», September 2–4, Krasnoyarsk, RussiaThe Second International Congress «Non-Ferrous Metals – 2010», September 2–4, Krasnoyarsk, Russia • Part VI • Aluminium Reduction Technology• Part VI • Aluminium Reduction Technology
case of abandoning their transfer to the P. A. baths when developing and introducing the radical
modernization of the electrolytic cells on retention of the type of the current lead.
In the course of our investigations new concepts of the mechanism of metal loss in indus-
trial cryolite-alumina melt electrolysis were formed [8–11].
It’s known that metal losses in industrial aluminum cell has been in region of diffusion
kinetics. The velocity of interaction depend of form and dimensions of apparatus in this region.
We investigated macrokinetics of phenomena’s on the physical models of the vertical cross-sec-
tion of cell. We founded the new conception about mechanism and macrokinetics of processes.
It’s established that stage of dispersing of aluminum from the crest of standing wave near the
edge of anode is principal. The experimental dependences with a relative error of ≤ 20 % are
approximated by the next equations:
А = 3.5⋅10–3 (1+1.74 lnВ)
С = 13.68⋅10–3 ⋅ А 1.5
jm/f = –6⋅10–5 + 1⋅10–4 В – 2⋅10–5 ⋅ В 2
jm/f = 3.78⋅10–5 + 2.44⋅10–4 Н + 0.1 Н 2
Nud = 6.38⋅10–4 (Re – 3650) 0.47.
There are A –amplitude of wave, m; C – concentr.of metallic dispersion into electrolyte, kg⋅m –3;
jm/f – metal flow density, transferred to electrolyte, kg⋅m–2⋅h –1; B – width of anode, m;
H – anode immersion depth, m; Nud – the diffusion number of Nusselt; Re –number of
Reynolds. (fig’s 2, 3, 4).
We offered the constructions of cell witch SA, in witch current efficiency and cell current
will be on 7–8 % each other more, then for existing cells. We have invention too, with using it
energy consumption may be less on ~ 2 kWh⋅kg–1 for cell SA with VS.
They showed that metal losses occurred as a result of physical processes of emulsifica-
tion and the transfer of dispersed metal particles to electrolyte under the influence of not only
magnetodynamic factors but the gas hydrodynamic ones as well. When in use the S. A. of about
2 m width at H. S. and of 2.85 m width at V. S. the last factors play the prevailing part. The flow
density of the metal transferred to the electrolyte with the anode width of more than ~0.6 m is
the function of the anode width. The outstanding results of the efficiency of the P. A. cells are
due to the application of anodes of small characteristics size (usually not more than 0.7–0.8 m)
and real elimination of the dynamics factors of the gas phase and the electrolyte [12].
Proposals
According to the results of our studies the S. A. cells will have the indices for the metal
current efficiency not less than 95–96 % in case of replacing their anodes by those with the
width nearing that of P. A., the type of the current lead being the same. In actual practice it is
a 2-anode scheme for the H. S. and a 3-anode scheme for the V. S. with the 2-or 3-anode block
Fig. 2. Dependence of the mean
standing wave amplitude
n the anode width
Fig. 3. Dependence of the
«metal in electrolyte» concentra-
tion on the averaged amplitude
of the wave
Fig. 4. Dependence of the
density of the mass flow of
the metal transferred into
electrolyte on the anode
width
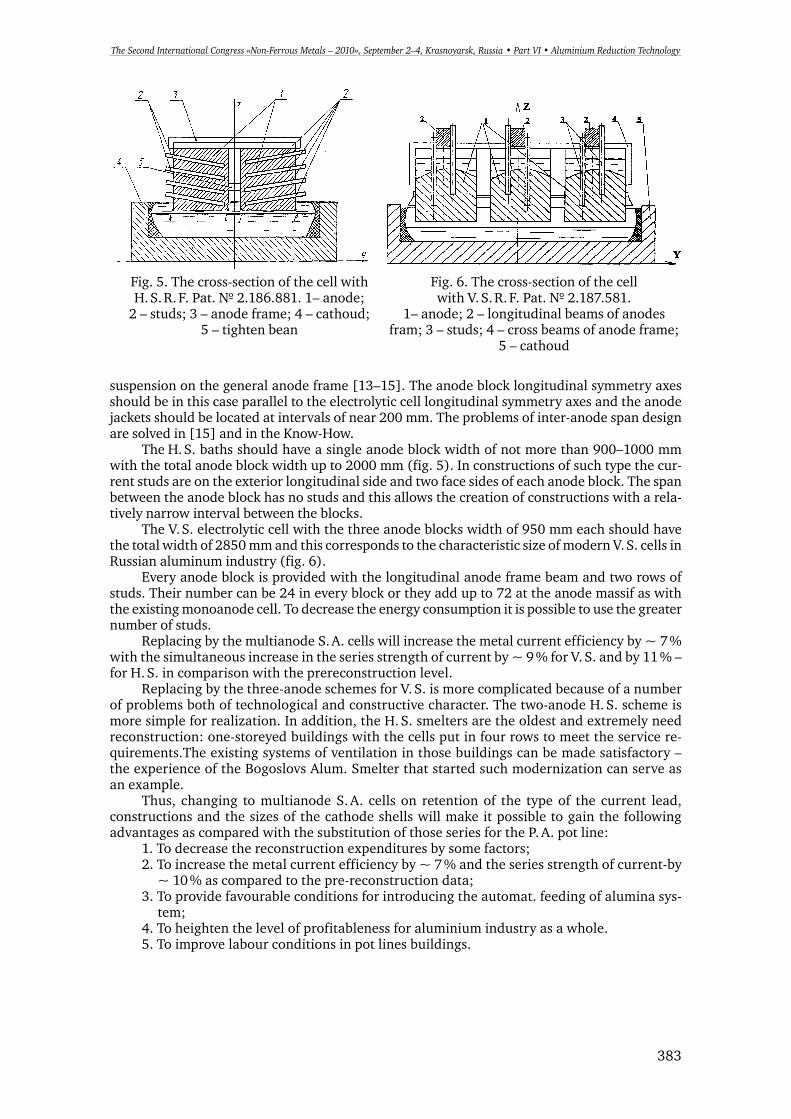
383
The Second International Congress «Non-Ferrous Metals – 2010», September 2–4, Krasnoyarsk, RussiaThe Second International Congress «Non-Ferrous Metals – 2010», September 2–4, Krasnoyarsk, Russia • Part VI • Aluminium Reduction Technology• Part VI • Aluminium Reduction Technology
suspension on the general anode frame [13–15]. The anode block longitudinal symmetry axes
should be in this case parallel to the electrolytic cell longitudinal symmetry axes and the anode
jackets should be located at intervals of near 200 mm. The problems of inter-anode span design
are solved in [15] and in the Know-How.
The H. S. baths should have a single anode block width of not more than 900–1000 mm
with the total anode block width up to 2000 mm (fig. 5). In constructions of such type the cur-
rent studs are on the exterior longitudinal side and two face sides of each anode block. The span
between the anode block has no studs and this allows the creation of constructions with a rela-
tively narrow interval between the blocks.
The V. S. electrolytic cell with the three anode blocks width of 950 mm each should have
the total width of 2850 mm and this corresponds to the characteristic size of modern V. S. cells in
Russian aluminum industry (fig. 6).
Every anode block is provided with the longitudinal anode frame beam and two rows of
studs. Their number can be 24 in every block or they add up to 72 at the anode massif as with
the existing monoanode cell. To decrease the energy consumption it is possible to use the greater
number of studs.
Replacing by the multianode S. A. cells will increase the metal current efficiency by ~ 7 %
with the simultaneous increase in the series strength of current by ~ 9 % for V. S. and by 11 % –
for H. S. in comparison with the prereconstruction level.
Replacing by the three-anode schemes for V. S. is more complicated because of a number
of problems both of technological and constructive character. The two-anode H. S. scheme is
more simple for realization. In addition, the H. S. smelters are the oldest and extremely need
reconstruction: one-storeyed buildings with the cells put in four rows to meet the service re-
quirements.The existing systems of ventilation in those buildings can be made satisfactory –
the experience of the Bogoslovs Alum. Smelter that started such modernization can serve as
an example.
Thus, changing to multianode S. A. cells on retention of the type of the current lead,
constructions and the sizes of the cathode shells will make it possible to gain the following
advantages as compared with the substitution of those series for the P. A. pot line:
1. To decrease the reconstruction expenditures by some factors;
2. To increase the metal current efficiency by ~ 7 % and the series strength of current-by
~ 10 % as compared to the pre-reconstruction data;
3. To provide favourable conditions for introducing the automat. feeding of alumina sys-
tem;
4. To heighten the level of profitableness for aluminium industry as a whole.
5. To improve labour conditions in pot lines buildings.
Fig. 5. The cross-section of the cell with
H. S. R. F. Pat. № 2.186.881. 1– anode;
2 – studs; 3 – anode frame; 4 – cathoud;
5 – tighten bean
Fig. 6. The cross-section of the cell
with V. S. R. F. Pat. № 2.187.581.
1– anode; 2 – longitudinal beams of anodes
fram; 3 – studs; 4 – cross beams of anode frame;
5 – cathoud

384
The Second International Congress «Non-Ferrous Metals – 2010», September 2–4, Krasnoyarsk, RussiaThe Second International Congress «Non-Ferrous Metals – 2010», September 2–4, Krasnoyarsk, Russia • Part VI • Aluminium Reduction Technology• Part VI • Aluminium Reduction Technology
Energy consumption
Table 2
Comparison of some articles of electric balance cells with VS and P. A., mv
№
Items
Articles of balance VS PA Distinction
1 The anode ~ 600 ~ 300 + 300
2 Ohmic losses in electrolyte ~ 1750–1850 1650–1700 + 100
3 On gassy a layer ~ 400 ~ 250 + 150
4 From anodic effect 70–80 ~ 30 + 50
In total + 600
With reference to a total energy consumption these 600 mv answer the additional charge in
2100–2200 kW⋅h⋅ton of metal.
We have invention under the patent R. F. № 2.200.213 [12], in uhich the anodal cas-
ing is included in an electric circuit in parallel studs. For cells with VS on 160 kA ohmic resis-
tance of studs make ~ 87⋅10–8 Ohm anel resistance of a serial anodic shirt ≈ 133 ⋅10–8 Ohm and
resistance of a strengthe ned shirt with a bimetallic top part 58 ⋅10–8 Ohm. The current throngh
a shirt at presence of good its contact to the anode can reach 60 kA and more, what answer the
additional charge in 2100–2200 kW⋅h ton of metal.
Conclusion
The development of a new highly economical and ecologically pure method for produc-
ing aluminium is the most important strategical task. Before such a method suitable for intro-
duction appears it is appropriate to make a major effort to the reconstruction of the H. S. and
then V. S. electrolytic cells without changing the type of their current lead.
REFERENCES
1. A.I. Begunov. Problems of Aluminium Cells Modernization, Irkutsk, 2000, 105 p.
2. Primary Aluminium Smelters of the World. Aluminium Times. July-August 2000, pp.
13–15.
3. A.K. Syrdal. The S derberg cell technology-future challenges and possibilities. Light
Metals 2002, TMS, USA, pp. 319–324.
4. LME 89 2002.
5. K.J. Driscol. S. Saraf, and j.. P. Martin An Assessment of the Avoidable Costs of Produc-
tion for Western World Aluminium Smelters. Light Metals 1998, TMS, USA, pp. 1273–1277.
6. Primary Aluminium Smelting Costs to 1999: Aluminium Costs Service 1996–1997,
CRU International Ltd, 1997, pp. 81–96.
7. A.I. Begunov. R. F. Patent № 2.138.582 prior.17.04.97.
8. A.I. Begunov. Technological Hydrodynamics of Electrolytic Cells with Horizontal Elec-
trodes, Irkutsk, 1983, 351 p. Dep. in VINITY, № 963–84 Dep.
9. A.I. Begunov. Gas Hydrodynamics and Metal Losses in Aluminium Electrolytic Cells, Ir-
kutsk,, IGU, 1992, 288 p.
10.A.I. Begunov, B. S. Gromov. Light Metals 1994, TMS, USA, pp/295–304.
11. A.I. Begunov, Tsimbalov S. D. Macrokinetics of Metal Losses in Aluminium Electrolytic
Cells. St. Petersburg, «Nauka», 1994, 77 p.
12. A.I. Begunov, Tke Influence of Anode Width on Metal Losses in Industrial Electrolytic
Cells for Al. production. Siberian aluminium 2002, Book of rep. VIII Internat. conf., Krasno-
yarsk, 2002, p.34–37.
13. Begunov A.I. Electrolytic Cell for Al production by Horizontal studs. R. F. Patent
№ 2.186.881 prior. 20.11.2000. Publ.10.08.2002, Bul. № 22.
14. Begunov A.I. Electrolytic Cell to Production Aluminium R. F. Patent № 2.187.581 pri-
or.27.07.2000, Publ.20.08.2002, Bul. № 23.
15. Begunov A.I. Electrolytic Cell to Production Aluminium. R. F. Patent № 2.188.257. pri-
or. 23.11.1999 г. Publ, 27.08.2002, Bul. № 24.


