An Initiative of the Government of the Philippines implemented An Initiative of the Government of the Philippines implemented An Initiative of the Government of the Philippines implemented An Initiative of the Government of the Philippines implemented by the Department of Environment and Natural Resources and by the Department of Environment and Natural Resources and by the Department of Environment and Natural Resources and by the Department of Environment and Natural Resources and the LGUs of Camiguin the LGUs of Camiguin the LGUs of Camiguin the LGUs of Camiguin with funding support from New Zealand with funding support from New Zealand with funding support from New Zealand with funding support from New Zealand Agency for International Development Agency for International Development Agency for International Development Agency for International Development Management Service Management Service Management Service Management Services Con Con Con Contractor tractor tractor tractor, Tetra Tech EMI , Tetra Tech EMI , Tetra Tech EMI , Tetra Tech EMI PARTICIPATORY RESOURCE ASSESSMENT PARTICIPATORY RESOURCE ASSESSMENT PARTICIPATORY RESOURCE ASSESSMENT PARTICIPATORY RESOURCE ASSESSMENT OF THE COASTAL AND MARINE OF THE COASTAL AND MARINE OF THE COASTAL AND MARINE OF THE COASTAL AND MARINE HABITATS OF CAMIGU HABITATS OF CAMIGU HABITATS OF CAMIGU HABITATS OF CAMIGUIN ISLAND N ISLAND N ISLAND N ISLAND
Transcript
An Initiative of the Government of the Philippines implemented An Initiative of the Government of the Philippines implemented An Initiative of the Government of the Philippines implemented An Initiative of the Government of the Philippines implemented by the Department of Environment and Natural Resources and by the Department of Environment and Natural Resources and by the Department of Environment and Natural Resources and by the Department of Environment and Natural Resources and the LGUs of Camiguin the LGUs of Camiguin the LGUs of Camiguin the LGUs of Camiguin with funding support from New Zealand with funding support from New Zealand with funding support from New Zealand with funding support from New Zealand
Agency for International DevelopmentAgency for International DevelopmentAgency for International DevelopmentAgency for International Development
unicipality of Sagay …………………………………unicipality of Sagay …………………………………unicipality of Sagay …………………………………unicipality of Sagay …………………………………
Results …………………………………………………
ations ……………………………………………………
g, Sagay …………………………………………………
a, Sagay …………………………………………………
ion, Sagay ………………………………………………
n, Sagay …………………………………………………
lan, Sagay ………………………………………………
og, Sagay ………………………………………………
Sagay ……………………………………………………
unicipality of Catarman ………………………………unicipality of Catarman ………………………………unicipality of Catarman ………………………………unicipality of Catarman ………………………………
Results …………………………………………………
ations ……………………………………………………
n, Catarman ......………………………………………
c, Catarman ......………………………………………
n, Catarman ......………………………………………
iawan, Catarman ......…………………………………
ol, Catarman ......………………………………………
ion, Catarman ......……………………………………
atarman …….....………………………………………
ro, Catarman .....………………………………………
unicipality of Mahinog ………………………………unicipality of Mahinog ………………………………unicipality of Mahinog ………………………………unicipality of Mahinog ………………………………
Results …………………………………………………
ations ……………………………………………………
Pequeño, Mahinog …………………………………
gan, Mahinog ……………………………………….
al Report), page - iiiiiiii
Page
……. ……. ……. ……. 1111
…….. 11
……… 17
…….…….…….……. 22221111
……... 23
…….. 30
……... 32
…….. 36
…….. 40
…….. 43
…… 47
……… 51
…….. 55
…….…….…….……. 59595959
……... 63
…….. 71
…... 73
…..... 78
…... 83
……. 88
…... 93
……. 98
……... 103
……... 107
……...……...……...……... 112112112112
……... 115
…….. 125
…..... 128
…..... 133
Section
4 Brgy. Hubangon
Brgy. San Jose, M
Brgy. Binaliwan
Brgy. Poblacion
Brgy. San Roque
Brgy. Benoni, M
Brgy. San Migue
5555 PRA of the MunPRA of the MunPRA of the MunPRA of the Mun
General PRA Re
Recommendatio
Brgy. Naasag, M
Brgy. Yumbing,
Brgy. Agoho, M
Brgy. Bug-ong, M
Brgy. Kuguita, M
Brgy. Baylao, M
Brgy. Poblacion
Brgy. Balbagon,
Brgy. Anito, Ma
Brgy. Magting, M
Brgy. Tupsan Gr
6666 PRA of the MunPRA of the MunPRA of the MunPRA of the Mun
General PRA Re
Recommendatio
Brgy. Maac, Gu
Brgy. Cabuan, G
Brgy. Cantaan, G
Brgy. North Pob
Brgy. South Pob
Brgy. Liong, Gu
Participatory Resource Assessment of Camiguin, 2008 (Final
gon, Mahinog ………………………………............
se, Mahinog ……………………………………….....
an, Mahinog …………………………………………
ion, Mahinog ………………………………………...
que, Mahinog …………………………………….....
i, Mahinog …………………………………………….
iguel, Mahinog …………………..…………………..
unicipality of Mambajao ……………………………unicipality of Mambajao ……………………………unicipality of Mambajao ……………………………unicipality of Mambajao ……………………………
Results …………………………………………………
ations ……………………………………………………
g, Mambajao ..……………..…………………............
ng, Mambajao ..……………..………………….........
, Mambajao ..……………..…………………............
g, Mambajao .……………..…………………...........
a, Mambajao ..……………..…………………...........
, Mambajao ..……………..…………………............
ion, Mambajao ..……………..………………….......
on, Mambajao ..……………..…………………........
Mambajao ..……………..…………………..............
g, Mambajao ..……………..…………………..........
Grande, Mambajao ..……………..…………………
unicipality of Guinsiliban ……………………………unicipality of Guinsiliban ……………………………unicipality of Guinsiliban ……………………………unicipality of Guinsiliban ……………………………
Results …………………………………………………
ations ……………………………………………………
Guinsiliban ..……………..…………………..............
n, Guinsiliban ..……………..…………………...........
n, Guinsiliban ..……………..…………………..........
Poblacion, Guinsiliban ..……………..………………
Poblacion, Guinsiliban ..……………..…………………
Guinsiliban ..……………..…………………..............
al Report), page - iiiiiiiiiiii
Page
......... 138
......... 143
…..... 148
....... 153
......... 158
…..... 165
....... 171
…………………… 171717177777
……... 180
…….. 191
.......... 193
.......... 197
.......... 201
.......... 205
.......... 209
......... 213
.......... 218
.......... 223
......... 228
.......... 232
…... 237
…………………….... 242242242242
……... 244
…….. 252
.......... 254
.......... 259
.......... 264
……. 271
……. 277
.......... 283
The Participatory Resource Assessment (PRA) of marine habitats of the five municipalities of
Camiguin Island was conducted from May 12
shown in Appendix 1.
Composing the PRA team were
• Janet S. Estacion, Ph.D. (Team Leader, CCRMP Monitoring and Evaluation
Specialist - Biophysical)
• Oliver R. T. Paderanga (Camiguin State Polytechnic State College)
• Bernardo L. Jasma, Jr. (PRA and MPA monitoring Research Assistant)
• Jean O. Polo (Department of Environment and Natural Resources, Region X)
The PRA process involved three days per municipality wherein selected local participants from
the community (ranging from fisherfolks to members of the
trained in PRA methods (Day 1)
presented their results (Day 3)
• Coral reef cover survey
• Reef fish composition and biomass
• Seagrass cover and its associated macroinvertebrates
belt-method, respectively,
Participatory Resource Assessment of Camiguin, 2008 (Final Report)
SectionSectionSectionSection 1: 1: 1: 1:
THE PRA ACTIVITYTHE PRA ACTIVITYTHE PRA ACTIVITYTHE PRA ACTIVITY
The Participatory Resource Assessment (PRA) of marine habitats of the five municipalities of
was conducted from May 12-31, 2008. A detailed schedule of activities is
team were the following:
Janet S. Estacion, Ph.D. (Team Leader, CCRMP Monitoring and Evaluation
Biophysical)
Oliver R. T. Paderanga (Camiguin State Polytechnic State College)
Bernardo L. Jasma, Jr. (PRA and MPA monitoring Research Assistant)
Jean O. Polo (Department of Environment and Natural Resources, Region X)
Diwata Amida Macansantos (CCRMP Project Officer)
Julie Jadman (CCRMP Technical Assistant)
Ron Kirby B. Manit (Volunteer)
Ryan A. Neri (Volunteer)
Evelyn Deguit (CCRMP Field Coordinator)
The PRA process involved three days per municipality wherein selected local participants from
from fisherfolks to members of the ‘barangay’ (village
(Day 1), conducted actual field surveys (Day 2) and analy
presented their results (Day 3). The PRA training included the following:
oral reef cover survey using point-intercept method,
eef fish composition and biomass using fish visual census method,
eagrass cover and its associated macroinvertebrates using the transect
method, respectively,
(Final Report), page - 1111
The Participatory Resource Assessment (PRA) of marine habitats of the five municipalities of
. A detailed schedule of activities is
Janet S. Estacion, Ph.D. (Team Leader, CCRMP Monitoring and Evaluation
Oliver R. T. Paderanga (Camiguin State Polytechnic State College)
Bernardo L. Jasma, Jr. (PRA and MPA monitoring Research Assistant)
Jean O. Polo (Department of Environment and Natural Resources, Region X)
The PRA process involved three days per municipality wherein selected local participants from
village) council were
and analyzed and
using the transect-quadrat and
• Mangrove forest status
measurement of the circumference at breast height, and
• Fish catch enumeration
Since not all of the municipalities had seagrass beds and mangrove forests, t
training depended upon habitats present in
determined in a separate PCRA
Common to all the municipalities were coral reef and reef fish survey, and fish catch
enumeration.
Day 1: TrainingDay 1: TrainingDay 1: TrainingDay 1: Training. At the beginning of each 3
connection of the PRA Habitat Assessment with the general scheme of the Project’s objectives
(Fig. 1.1) and the PRA team members introduced. Lect
methodologies that will be used (Fig.
module (Appendix 2), a copy of which was
training. After the lecture, participants were
census, fish enumeration and others)(Fig.
methods that will be used. This encouraged more participation and allowed more interaction
between the team members and the participants.
Participatory Resource Assessment of Camiguin, 2008 (Final Report)
angrove forest status using species identification, density determination and
measurement of the circumference at breast height, and
ish catch enumeration using interview guide questions.
Since not all of the municipalities had seagrass beds and mangrove forests, the coverage of the
nded upon habitats present in the different municipalities. These were previously
in a separate PCRA habitat mapping exercise conducted prior to this activity.
Common to all the municipalities were coral reef and reef fish survey, and fish catch
. At the beginning of each 3-day activity, the participants were oriented on the
connection of the PRA Habitat Assessment with the general scheme of the Project’s objectives
) and the PRA team members introduced. Lectures were then conducted on the
methodologies that will be used (Fig. 1.2). All the methodologies were provided
, a copy of which was provided for each barangay at the onset of the
After the lecture, participants were then divided into teams (coral survey, fish visual
census, fish enumeration and others)(Fig. 1.3) for more detailed instruction on the specific
methods that will be used. This encouraged more participation and allowed more interaction
ers and the participants.
(Final Report), page - 2222
ation, density determination and
he coverage of the
These were previously
prior to this activity.
Common to all the municipalities were coral reef and reef fish survey, and fish catch
day activity, the participants were oriented on the
connection of the PRA Habitat Assessment with the general scheme of the Project’s objectives
ures were then conducted on the
provided for in a
at the onset of the
then divided into teams (coral survey, fish visual
3) for more detailed instruction on the specific
methods that will be used. This encouraged more participation and allowed more interaction
Figure Figure Figure Figure 1.1.1.1.1. Orientation of participants by Project Staff, Evelyn Deguit at Catar1. Orientation of participants by Project Staff, Evelyn Deguit at Catar1. Orientation of participants by Project Staff, Evelyn Deguit at Catar1. Orientation of participants by Project Staff, Evelyn Deguit at Catar
Diwata Macansantos at Mambajao (B).Diwata Macansantos at Mambajao (B).Diwata Macansantos at Mambajao (B).Diwata Macansantos at Mambajao (B).
AAAA
BBBB
Participatory Resource Assessment of Camiguin, 2008 (Final Report)
1. Orientation of participants by Project Staff, Evelyn Deguit at Catar1. Orientation of participants by Project Staff, Evelyn Deguit at Catar1. Orientation of participants by Project Staff, Evelyn Deguit at Catar1. Orientation of participants by Project Staff, Evelyn Deguit at Catarmmmman (A) and an (A) and an (A) and an (A) and
Diwata Macansantos at Mambajao (B).Diwata Macansantos at Mambajao (B).Diwata Macansantos at Mambajao (B).Diwata Macansantos at Mambajao (B).
AAAA
Figure Figure Figure Figure 1.1.1.1.2. Formal lectures on habitat 2. Formal lectures on habitat 2. Formal lectures on habitat 2. Formal lectures on habitat
assessment at the Municipality of assessment at the Municipality of assessment at the Municipality of assessment at the Municipality of
Guinsiliban (A) and Mahinog (B)Guinsiliban (A) and Mahinog (B)Guinsiliban (A) and Mahinog (B)Guinsiliban (A) and Mahinog (B)
Dr. Janet EstacionDr. Janet EstacionDr. Janet EstacionDr. Janet Estacion....
(Final Report), page - 3333
an (A) and an (A) and an (A) and an (A) and
BBBB
2. Formal lectures on habitat 2. Formal lectures on habitat 2. Formal lectures on habitat 2. Formal lectures on habitat
assessment at the Municipality of assessment at the Municipality of assessment at the Municipality of assessment at the Municipality of
Guinsiliban (A) and Mahinog (B)Guinsiliban (A) and Mahinog (B)Guinsiliban (A) and Mahinog (B)Guinsiliban (A) and Mahinog (B) by by by by
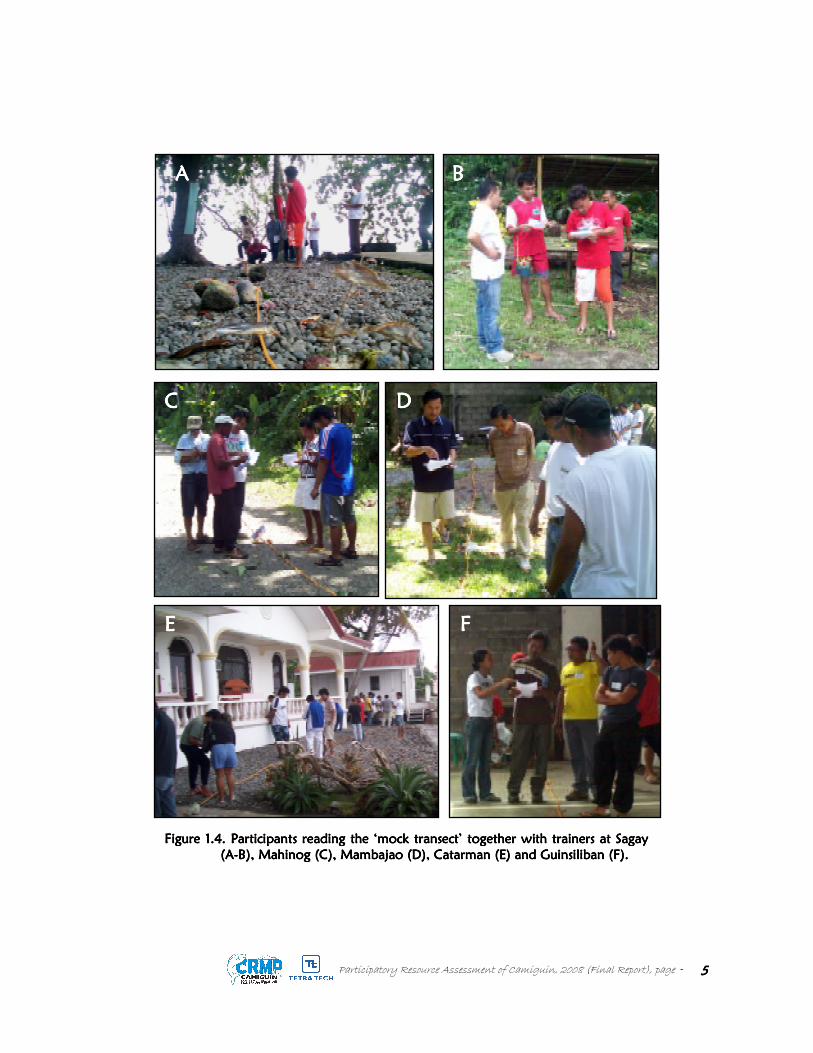
After the group instruction, participants
transects’ (Fig. 1.4) and fish catch enumeration in role
the methods, the land-based exercise also familiarized the participants with the forms that will
be used in the actual survey. After participants readings of
verified by the trainers. If their readings were not accurate, they had to repeat the exercise. At
the end of Day 1, arrangements were made for the logistics of the actual survey: participants
who will conduct the various as
boats and the member of the team who will be assigned to the area.
AAAA
Figure Figure Figure Figure 1.1.1.1.3. Group instruction for fish visual census lead by Bernardo Jasma, Jr at Sagay (A), coral 3. Group instruction for fish visual census lead by Bernardo Jasma, Jr at Sagay (A), coral 3. Group instruction for fish visual census lead by Bernardo Jasma, Jr at Sagay (A), coral 3. Group instruction for fish visual census lead by Bernardo Jasma, Jr at Sagay (A), coral
survey with Oliver Paderanga at Mambajao (B), fish catch survey with Oliver Paderanga at Mambajao (B), fish catch survey with Oliver Paderanga at Mambajao (B), fish catch survey with Oliver Paderanga at Mambajao (B), fish catch
at Guinsiliban (C) and seagrass survey with Janet Estacion (D) at Mahinog.at Guinsiliban (C) and seagrass survey with Janet Estacion (D) at Mahinog.at Guinsiliban (C) and seagrass survey with Janet Estacion (D) at Mahinog.at Guinsiliban (C) and seagrass survey with Janet Estacion (D) at Mahinog.
CCCC
AAAA
Participatory Resource Assessment of Camiguin, 2008 (Final Report)
articipants then applied the methods for habitat survey
4) and fish catch enumeration in role-playing exercises. Apart from practicing
based exercise also familiarized the participants with the forms that will
be used in the actual survey. After participants readings of the ‘mock transects’ were then
verified by the trainers. If their readings were not accurate, they had to repeat the exercise. At
the end of Day 1, arrangements were made for the logistics of the actual survey: participants
who will conduct the various aspects of the survey, materials needed such as small outrigger
boats and the member of the team who will be assigned to the area.
BBBB
3. Group instruction for fish visual census lead by Bernardo Jasma, Jr at Sagay (A), coral 3. Group instruction for fish visual census lead by Bernardo Jasma, Jr at Sagay (A), coral 3. Group instruction for fish visual census lead by Bernardo Jasma, Jr at Sagay (A), coral 3. Group instruction for fish visual census lead by Bernardo Jasma, Jr at Sagay (A), coral
survey with Oliver Paderanga at Mambajao (B), fish catch survey with Oliver Paderanga at Mambajao (B), fish catch survey with Oliver Paderanga at Mambajao (B), fish catch survey with Oliver Paderanga at Mambajao (B), fish catch enumeration with Julie Jadman enumeration with Julie Jadman enumeration with Julie Jadman enumeration with Julie Jadman
at Guinsiliban (C) and seagrass survey with Janet Estacion (D) at Mahinog.at Guinsiliban (C) and seagrass survey with Janet Estacion (D) at Mahinog.at Guinsiliban (C) and seagrass survey with Janet Estacion (D) at Mahinog.at Guinsiliban (C) and seagrass survey with Janet Estacion (D) at Mahinog.
DDDD
BBBB
(Final Report), page - 4444
the methods for habitat survey in ‘mock
Apart from practicing
based exercise also familiarized the participants with the forms that will
the ‘mock transects’ were then
verified by the trainers. If their readings were not accurate, they had to repeat the exercise. At
the end of Day 1, arrangements were made for the logistics of the actual survey: participants
pects of the survey, materials needed such as small outrigger
3. Group instruction for fish visual census lead by Bernardo Jasma, Jr at Sagay (A), coral 3. Group instruction for fish visual census lead by Bernardo Jasma, Jr at Sagay (A), coral 3. Group instruction for fish visual census lead by Bernardo Jasma, Jr at Sagay (A), coral 3. Group instruction for fish visual census lead by Bernardo Jasma, Jr at Sagay (A), coral
enumeration with Julie Jadman enumeration with Julie Jadman enumeration with Julie Jadman enumeration with Julie Jadman
at Guinsiliban (C) and seagrass survey with Janet Estacion (D) at Mahinog.at Guinsiliban (C) and seagrass survey with Janet Estacion (D) at Mahinog.at Guinsiliban (C) and seagrass survey with Janet Estacion (D) at Mahinog.at Guinsiliban (C) and seagrass survey with Janet Estacion (D) at Mahinog.
AAAA
EEEE
CCCC
Figure Figure Figure Figure 1.1.1.1.4. Participants reading the ‘mock transect’ together with 4. Participants reading the ‘mock transect’ together with 4. Participants reading the ‘mock transect’ together with 4. Participants reading the ‘mock transect’ together with
(A(A(A(A----B), Mahinog (C), Mambajao (D), Catarman (E) and Guinsiliban (F).B), Mahinog (C), Mambajao (D), Catarman (E) and Guinsiliban (F).B), Mahinog (C), Mambajao (D), Catarman (E) and Guinsiliban (F).B), Mahinog (C), Mambajao (D), Catarman (E) and Guinsiliban (F).
Participatory Resource Assessment of Camiguin, 2008 (Final Report)
FFFF
BBBB
DDDD
4. Participants reading the ‘mock transect’ together with 4. Participants reading the ‘mock transect’ together with 4. Participants reading the ‘mock transect’ together with 4. Participants reading the ‘mock transect’ together with trainers at Sagay trainers at Sagay trainers at Sagay trainers at Sagay
B), Mahinog (C), Mambajao (D), Catarman (E) and Guinsiliban (F).B), Mahinog (C), Mambajao (D), Catarman (E) and Guinsiliban (F).B), Mahinog (C), Mambajao (D), Catarman (E) and Guinsiliban (F).B), Mahinog (C), Mambajao (D), Catarman (E) and Guinsiliban (F).
(Final Report), page - 5555
trainers at Sagay trainers at Sagay trainers at Sagay trainers at Sagay
B), Mahinog (C), Mambajao (D), Catarman (E) and Guinsiliban (F).B), Mahinog (C), Mambajao (D), Catarman (E) and Guinsiliban (F).B), Mahinog (C), Mambajao (D), Catarman (E) and Guinsiliban (F).B), Mahinog (C), Mambajao (D), Catarman (E) and Guinsiliban (F).
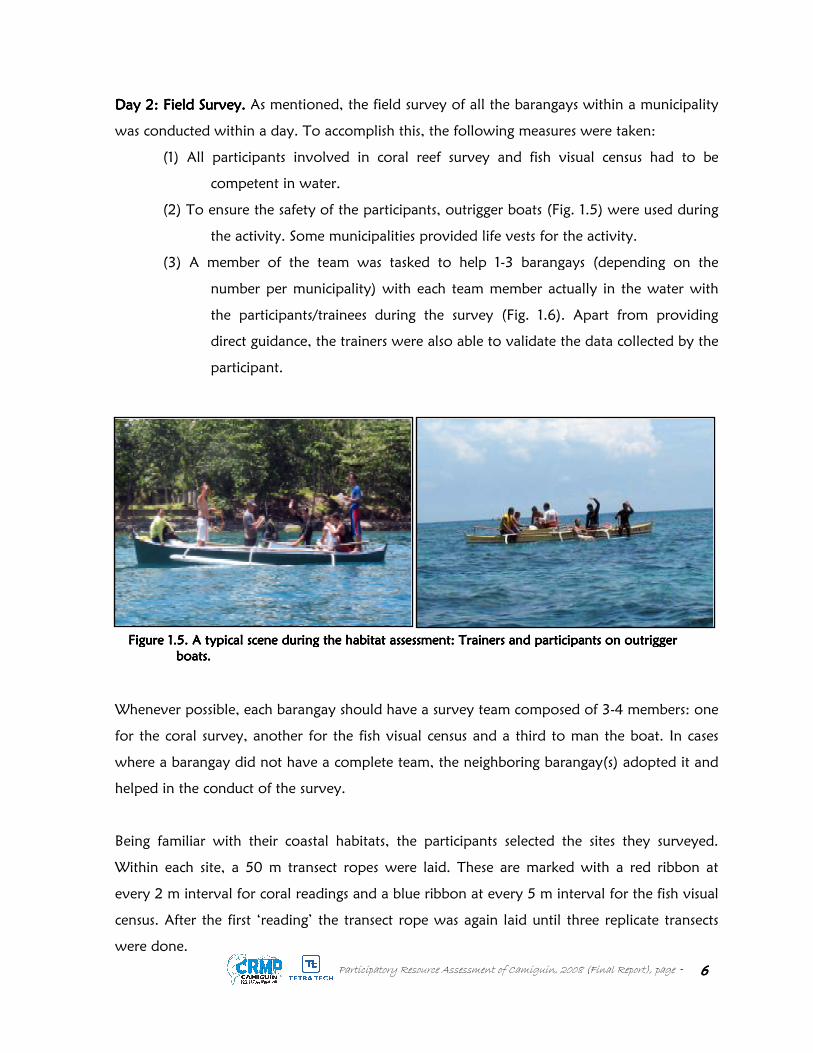
Day 2: Field Survey. Day 2: Field Survey. Day 2: Field Survey. Day 2: Field Survey. As mentioned, the field survey of all the barangays within a municipality
was conducted within a day. To
(1) All participants involved in coral reef survey and fish visual census had to be
competent in water.
(2) To ensure the safety of the participants, outrigger boats (Fig.
the activity. Some municipalities provided life vests for the activity.
(3) A member of the team was tasked to help 1
number per municipality) with each team member actually in the water with
the participants/trainees during the s
direct guidance, the trainers were also able to validate the data collected by the
participant.
Whenever possible, each barangay should have a survey team composed of 3
for the coral survey, another for the fish visual census and a third to man the boat. In cases
where a barangay did not have a complete team, the neighboring baranga
helped in the conduct of the survey.
Being familiar with their coastal habitats, the participants selected the sites they surveyed.
Within each site, a 50 m transect ropes were laid. These are marked with a red ribbon at
every 2 m interval for coral readings and a blue ribbon at every 5 m interval for the fish visual
census. After the first ‘reading’ the transect rope was again laid until three replicate transects
were done.
Figure Figure Figure Figure 1.1.1.1.5. A typical scene during the habitat assessment: Trainers and participants on outrigger 5. A typical scene during the habitat assessment: Trainers and participants on outrigger 5. A typical scene during the habitat assessment: Trainers and participants on outrigger 5. A typical scene during the habitat assessment: Trainers and participants on outrigger
boats.boats.boats.boats.
Participatory Resource Assessment of Camiguin, 2008 (Final Report)
As mentioned, the field survey of all the barangays within a municipality
was conducted within a day. To accomplish this, the following measures were taken:
(1) All participants involved in coral reef survey and fish visual census had to be
competent in water.
(2) To ensure the safety of the participants, outrigger boats (Fig. 1.5) were used during
activity. Some municipalities provided life vests for the activity.
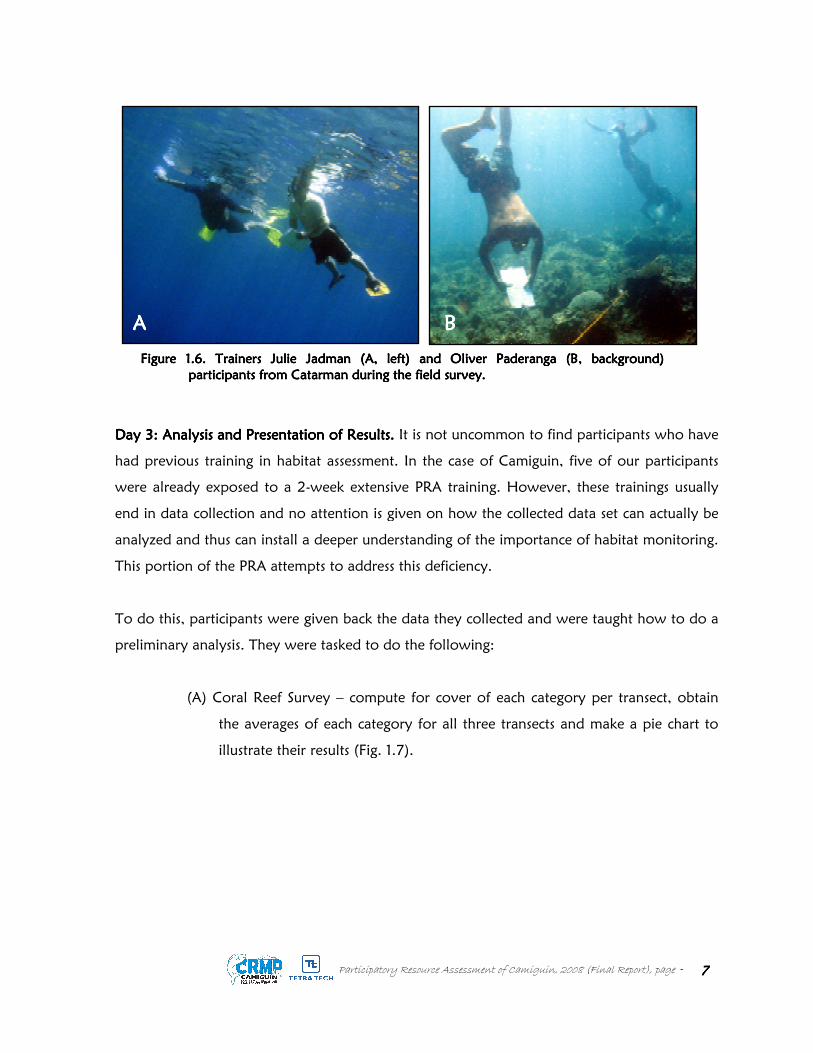
member of the team was tasked to help 1-3 barangays (depending on the
number per municipality) with each team member actually in the water with
the participants/trainees during the survey (Fig. 1.6). Apart from providing
direct guidance, the trainers were also able to validate the data collected by the
, each barangay should have a survey team composed of 3
for the coral survey, another for the fish visual census and a third to man the boat. In cases
where a barangay did not have a complete team, the neighboring barangay(s) adopted it and
helped in the conduct of the survey.
Being familiar with their coastal habitats, the participants selected the sites they surveyed.
Within each site, a 50 m transect ropes were laid. These are marked with a red ribbon at
erval for coral readings and a blue ribbon at every 5 m interval for the fish visual
census. After the first ‘reading’ the transect rope was again laid until three replicate transects
5. A typical scene during the habitat assessment: Trainers and participants on outrigger 5. A typical scene during the habitat assessment: Trainers and participants on outrigger 5. A typical scene during the habitat assessment: Trainers and participants on outrigger 5. A typical scene during the habitat assessment: Trainers and participants on outrigger
(Final Report), page - 6666
As mentioned, the field survey of all the barangays within a municipality
accomplish this, the following measures were taken:
(1) All participants involved in coral reef survey and fish visual census had to be
5) were used during
activity. Some municipalities provided life vests for the activity.
3 barangays (depending on the
number per municipality) with each team member actually in the water with
Apart from providing
direct guidance, the trainers were also able to validate the data collected by the
-4 members: one
for the coral survey, another for the fish visual census and a third to man the boat. In cases
y(s) adopted it and
Being familiar with their coastal habitats, the participants selected the sites they surveyed.
Within each site, a 50 m transect ropes were laid. These are marked with a red ribbon at
erval for coral readings and a blue ribbon at every 5 m interval for the fish visual
census. After the first ‘reading’ the transect rope was again laid until three replicate transects
5. A typical scene during the habitat assessment: Trainers and participants on outrigger 5. A typical scene during the habitat assessment: Trainers and participants on outrigger 5. A typical scene during the habitat assessment: Trainers and participants on outrigger 5. A typical scene during the habitat assessment: Trainers and participants on outrigger
Day 3: Analysis and Presentation of Results.Day 3: Analysis and Presentation of Results.Day 3: Analysis and Presentation of Results.Day 3: Analysis and Presentation of Results.
had previous training in habitat assessment. In the case of Camiguin, five of our participants
were already exposed to a 2-
end in data collection and no attention is given on how the collected data set can actually be
analyzed and thus can install a deeper understanding of the importance of habitat monitoring.
This portion of the PRA attempts to address this deficiency.
To do this, participants were given back the data they collected and were taught how to do a
preliminary analysis. They were tasked to do the following:
(A) Coral Reef Survey
the averages of each category for all three tran
illustrate their results (Fig.
Figure Figure Figure Figure 1.1.1.1.6666.... Trainers Julie Jadman (A, left) and Oliver Paderanga (B, background) Trainers Julie Jadman (A, left) and Oliver Paderanga (B, background) Trainers Julie Jadman (A, left) and Oliver Paderanga (B, background) Trainers Julie Jadman (A, left) and Oliver Paderanga (B, background)
participants from Catarman during the field survey.participants from Catarman during the field survey.participants from Catarman during the field survey.participants from Catarman during the field survey.
AAAA
Participatory Resource Assessment of Camiguin, 2008 (Final Report)
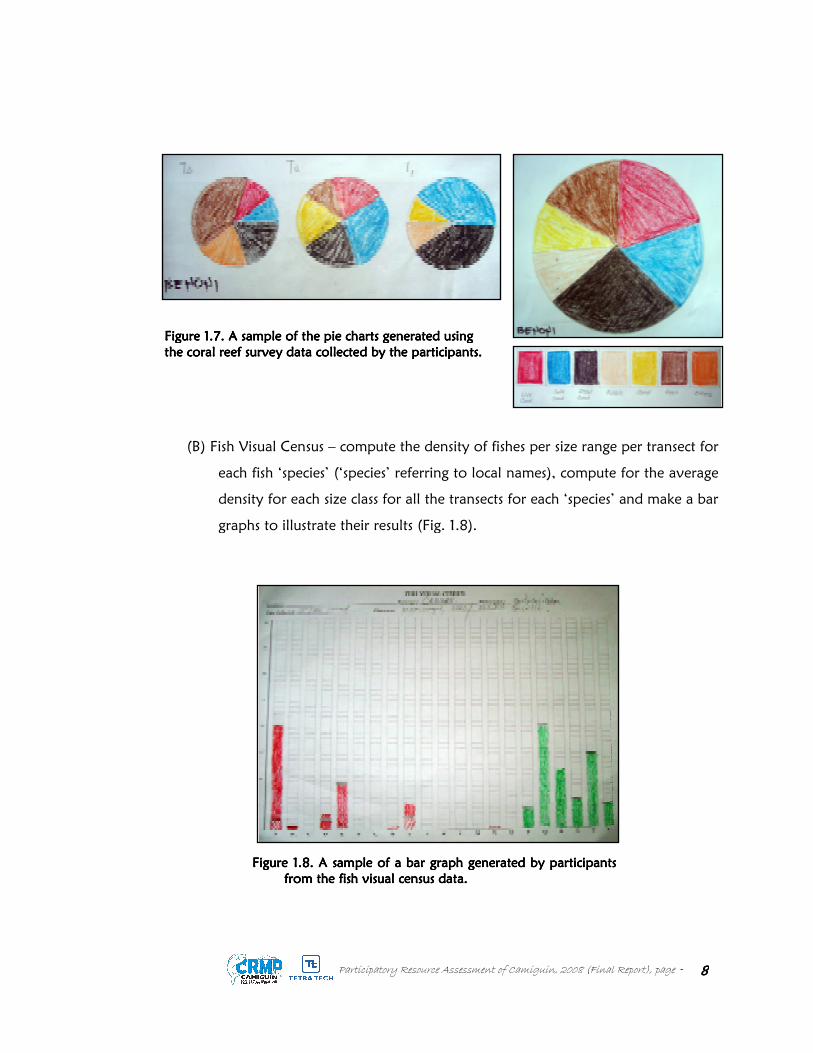
Day 3: Analysis and Presentation of Results.Day 3: Analysis and Presentation of Results.Day 3: Analysis and Presentation of Results.Day 3: Analysis and Presentation of Results. It is not uncommon to find participants who have
had previous training in habitat assessment. In the case of Camiguin, five of our participants
-week extensive PRA training. However, these trainings usually
n and no attention is given on how the collected data set can actually be
analyzed and thus can install a deeper understanding of the importance of habitat monitoring.
This portion of the PRA attempts to address this deficiency.
ere given back the data they collected and were taught how to do a
preliminary analysis. They were tasked to do the following:
Survey – compute for cover of each category per transect, obtain
the averages of each category for all three transects and make a pie chart to
illustrate their results (Fig. 1.7).
Trainers Julie Jadman (A, left) and Oliver Paderanga (B, background) Trainers Julie Jadman (A, left) and Oliver Paderanga (B, background) Trainers Julie Jadman (A, left) and Oliver Paderanga (B, background) Trainers Julie Jadman (A, left) and Oliver Paderanga (B, background)
participants from Catarman during the field survey.participants from Catarman during the field survey.participants from Catarman during the field survey.participants from Catarman during the field survey.
BBBB
(Final Report), page - 7777
It is not uncommon to find participants who have
had previous training in habitat assessment. In the case of Camiguin, five of our participants
week extensive PRA training. However, these trainings usually
n and no attention is given on how the collected data set can actually be
analyzed and thus can install a deeper understanding of the importance of habitat monitoring.
ere given back the data they collected and were taught how to do a
compute for cover of each category per transect, obtain
sects and make a pie chart to
Trainers Julie Jadman (A, left) and Oliver Paderanga (B, background) Trainers Julie Jadman (A, left) and Oliver Paderanga (B, background) Trainers Julie Jadman (A, left) and Oliver Paderanga (B, background) Trainers Julie Jadman (A, left) and Oliver Paderanga (B, background)
(B) Fish Visual Census
each fish ‘species’ (‘species’ referring to local names), compute for the average
density for each size
graphs to illustrate their results (Fig.
Figure Figure Figure Figure 1.1.1.1.7. A sample of the pie charts generated using 7. A sample of the pie charts generated using 7. A sample of the pie charts generated using 7. A sample of the pie charts generated using
the coral reef survey data collected by the participants.the coral reef survey data collected by the participants.the coral reef survey data collected by the participants.the coral reef survey data collected by the participants.
Figure Figure Figure Figure 1.1.1.1.8. A sample of a bar graph generated by 8. A sample of a bar graph generated by 8. A sample of a bar graph generated by 8. A sample of a bar graph generated by
from the fish visual census data.from the fish visual census data.from the fish visual census data.from the fish visual census data.
Participatory Resource Assessment of Camiguin, 2008 (Final Report)
(B) Fish Visual Census – compute the density of fishes per size range per transect for
each fish ‘species’ (‘species’ referring to local names), compute for the average
density for each size class for all the transects for each ‘species’ and make a bar
graphs to illustrate their results (Fig. 1.8).
7. A sample of the pie charts generated using 7. A sample of the pie charts generated using 7. A sample of the pie charts generated using 7. A sample of the pie charts generated using
the coral reef survey data collected by the participants.the coral reef survey data collected by the participants.the coral reef survey data collected by the participants.the coral reef survey data collected by the participants.
8. A sample of a bar graph generated by 8. A sample of a bar graph generated by 8. A sample of a bar graph generated by 8. A sample of a bar graph generated by participants participants participants participants
from the fish visual census data.from the fish visual census data.from the fish visual census data.from the fish visual census data.
(Final Report), page - 8888
compute the density of fishes per size range per transect for
each fish ‘species’ (‘species’ referring to local names), compute for the average
class for all the transects for each ‘species’ and make a bar
After they were oriented on how to do their analysis, they were groups and were guided by
the trainer who was assigned to them during the field survey. Materials used t
illustrations were simple, using just calibrated empty pie charts and bar graphs which they
colored using crayons. This method hopefully made the participants understand that the lack
of technology (i.e. computers) should not be deterrence f
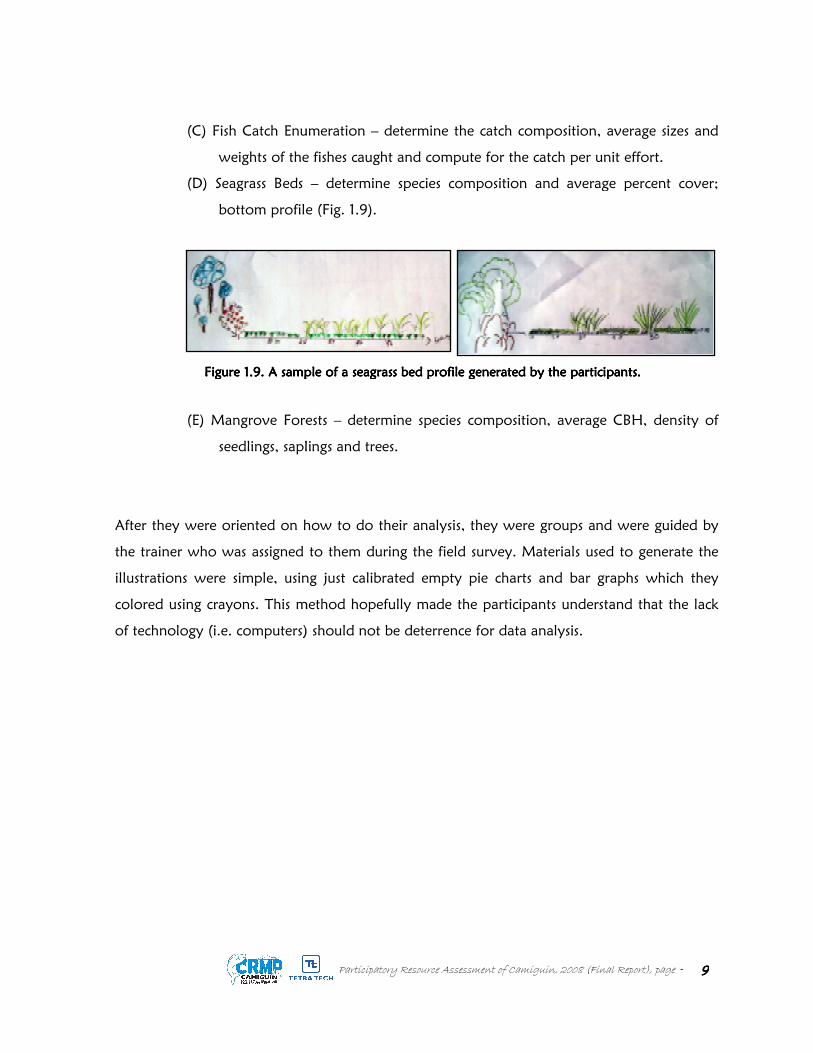
Figure Figure Figure Figure 1.1.1.1.9. A sample of a seagrass bed profile generated by the participants.9. A sample of a seagrass bed profile generated by the participants.9. A sample of a seagrass bed profile generated by the participants.9. A sample of a seagrass bed profile generated by the participants.
Participatory Resource Assessment of Camiguin, 2008 (Final Report)
(C) Fish Catch Enumeration – determine the catch composition, average sizes and
weights of the fishes caught and compute for the catch per unit effort.
(D) Seagrass Beds – determine species composition and average percent cover;
bottom profile (Fig. 1.9).
(E) Mangrove Forests – determine species composition, average CBH, density of
seedlings, saplings and trees.
After they were oriented on how to do their analysis, they were groups and were guided by
the trainer who was assigned to them during the field survey. Materials used t
illustrations were simple, using just calibrated empty pie charts and bar graphs which they
colored using crayons. This method hopefully made the participants understand that the lack
of technology (i.e. computers) should not be deterrence for data analysis.
9. A sample of a seagrass bed profile generated by the participants.9. A sample of a seagrass bed profile generated by the participants.9. A sample of a seagrass bed profile generated by the participants.9. A sample of a seagrass bed profile generated by the participants.
(Final Report), page - 9999
determine the catch composition, average sizes and
for the catch per unit effort.
determine species composition and average percent cover;
determine species composition, average CBH, density of
After they were oriented on how to do their analysis, they were groups and were guided by
the trainer who was assigned to them during the field survey. Materials used to generate the
illustrations were simple, using just calibrated empty pie charts and bar graphs which they
colored using crayons. This method hopefully made the participants understand that the lack
9. A sample of a seagrass bed profile generated by the participants.9. A sample of a seagrass bed profile generated by the participants.9. A sample of a seagrass bed profile generated by the participants.9. A sample of a seagrass bed profile generated by the participants.
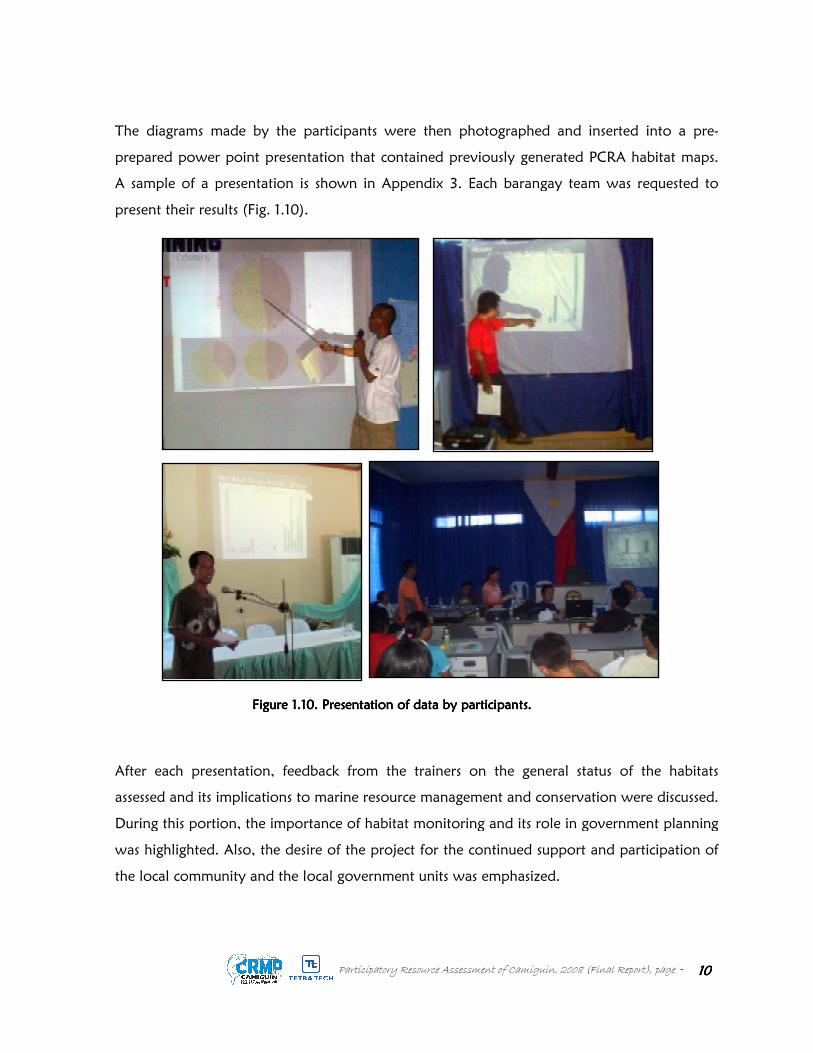
The diagrams made by the participants were then photographed and inserted into a pre
prepared power point presentation that contained previously generated PCRA habitat maps.
A sample of a presentation is shown in Appendix 3.
present their results (Fig. 1.10).
After each presentation, feedback from the trainers on the general status of the habitats
assessed and its implications to marine resource management and conservation were discussed.
During this portion, the importance of habitat monitoring and its role in government planning
was highlighted. Also, the desire of the project for the continued su
the local community and the local government units was emphasized.
Figure Figure Figure Figure 1.1.1.1.10. Presentation of data by participants.10. Presentation of data by participants.10. Presentation of data by participants.10. Presentation of data by participants.
Participatory Resource Assessment of Camiguin, 2008 (Final Report)
The diagrams made by the participants were then photographed and inserted into a pre
prepared power point presentation that contained previously generated PCRA habitat maps.
A sample of a presentation is shown in Appendix 3. Each barangay team was requested to
10).
After each presentation, feedback from the trainers on the general status of the habitats
assessed and its implications to marine resource management and conservation were discussed.
During this portion, the importance of habitat monitoring and its role in government planning
was highlighted. Also, the desire of the project for the continued support and participation of
the local community and the local government units was emphasized.
10. Presentation of data by participants.10. Presentation of data by participants.10. Presentation of data by participants.10. Presentation of data by participants.
(Final Report), page - 10101010
The diagrams made by the participants were then photographed and inserted into a pre-
prepared power point presentation that contained previously generated PCRA habitat maps.
Each barangay team was requested to
After each presentation, feedback from the trainers on the general status of the habitats
assessed and its implications to marine resource management and conservation were discussed.
During this portion, the importance of habitat monitoring and its role in government planning
pport and participation of
Overview of the Marine Ecosystems of Camiguin ProvinceOverview of the Marine Ecosystems of Camiguin ProvinceOverview of the Marine Ecosystems of Camiguin ProvinceOverview of the Marine Ecosystems of Camiguin Province
Five distinct marine habitats were observed
reefs, seagrass beds, mangrove forests, rocky communities and sandy communities.
Areas with distinct and extensive coral reefs
limited to only some barangays at Mahinog (Tupsan Pequeño to Hubagon),
(Sunken Cemetery) and Mambajao (Tupsan Grande to Magting)
generally coral patches interspersed with sand.
were generally rocky (composed of terrestrial boulders and stones) with smal
(often small submassive to massive types) struggling to grow on top of the
The more fragile corals (example the tabular acroporids)(commonly called ‘payong
are not common and if seen are often uprooted, up
indicators are good indicators that an area is often exposed to strong wave action.
beaches of Catarman and Sagay also show the extent of wave action they experience
indicated by areas have steep-
colonies litter the beaches where they have been tossed by the waves.
Mambajao is generally sandy with either the green algae,
brown algae, Sargassum and/or
These results are not surprising as Camiguin Island is
base required for the establishment of a
extensive reef areas requires a stable substrate and the often sandy and/or rock base coupled
with exposure to wave action brought about by monsoons and storms is not favorable to
extensive reef formation.
The absence of extensive reefs in some areas should not detract LGUs from recognizing their
intrinsic importance in the local economy. Sandy beaches are the main attraction for bathers
and picnickers, of which a good proportion of local tourists belong.
front properties with sandy shorelines are highly sought by resorts and hotel owners.
Participatory Resource Assessment of Camiguin, 2008 (Final Report)
GENERAL RESULTSGENERAL RESULTSGENERAL RESULTSGENERAL RESULTS
Overview of the Marine Ecosystems of Camiguin ProvinceOverview of the Marine Ecosystems of Camiguin ProvinceOverview of the Marine Ecosystems of Camiguin ProvinceOverview of the Marine Ecosystems of Camiguin Province
Five distinct marine habitats were observed within the mainlandwithin the mainlandwithin the mainlandwithin the mainland of Camiguin Province:
reefs, seagrass beds, mangrove forests, rocky communities and sandy communities.
Areas with distinct and extensive coral reefs were commonly seen at Guinsiliban and yet were
limited to only some barangays at Mahinog (Tupsan Pequeño to Hubagon),
(Sunken Cemetery) and Mambajao (Tupsan Grande to Magting)(Table 1.
generally coral patches interspersed with sand. The marine habitats of Catarman and Sagay
were generally rocky (composed of terrestrial boulders and stones) with smal
(often small submassive to massive types) struggling to grow on top of the
The more fragile corals (example the tabular acroporids)(commonly called ‘payong
are not common and if seen are often uprooted, up-ended, fragmented or dead.
indicators are good indicators that an area is often exposed to strong wave action.
beaches of Catarman and Sagay also show the extent of wave action they experience
-angled, pebbled beaches. In some areas, remnants of small coral
colonies litter the beaches where they have been tossed by the waves. The marine habitat of
Mambajao is generally sandy with either the green algae, Enteromorpha (‘lumot’), or the
and/or Turbinaria, growing on rocks or stones scattered in the sand.
These results are not surprising as Camiguin Island is of volcanic origin and thus the limestone
required for the establishment of a large, continuous reef is absent. The establishment of
extensive reef areas requires a stable substrate and the often sandy and/or rock base coupled
with exposure to wave action brought about by monsoons and storms is not favorable to
xtensive reefs in some areas should not detract LGUs from recognizing their
intrinsic importance in the local economy. Sandy beaches are the main attraction for bathers
and picnickers, of which a good proportion of local tourists belong. Apart from this, b
front properties with sandy shorelines are highly sought by resorts and hotel owners.
(Final Report), page - 11111111
Camiguin Province: Coral
reefs, seagrass beds, mangrove forests, rocky communities and sandy communities.
were commonly seen at Guinsiliban and yet were
limited to only some barangays at Mahinog (Tupsan Pequeño to Hubagon), Catarman
1.1). Reefs were
The marine habitats of Catarman and Sagay
were generally rocky (composed of terrestrial boulders and stones) with small coral growths
(often small submassive to massive types) struggling to grow on top of the larger boulders.
The more fragile corals (example the tabular acroporids)(commonly called ‘payong-payong’)
fragmented or dead. These are
indicators are good indicators that an area is often exposed to strong wave action. The
beaches of Catarman and Sagay also show the extent of wave action they experience as
. In some areas, remnants of small coral
The marine habitat of
(‘lumot’), or the
growing on rocks or stones scattered in the sand.
and thus the limestone
is absent. The establishment of
extensive reef areas requires a stable substrate and the often sandy and/or rock base coupled
with exposure to wave action brought about by monsoons and storms is not favorable to
xtensive reefs in some areas should not detract LGUs from recognizing their
intrinsic importance in the local economy. Sandy beaches are the main attraction for bathers
Apart from this, beach
front properties with sandy shorelines are highly sought by resorts and hotel owners.
Furthermore, they are also important to local fishers and tourist boat operators as docking
sites. Thus LGUs should incorporate these areas into their CRM plans sinc
major source of resource conflict.
Table Table Table Table 1.1.1.1.1. PRA results of mean live coralcover (in percent), their classification (C) based on 1. PRA results of mean live coralcover (in percent), their classification (C) based on 1. PRA results of mean live coralcover (in percent), their classification (C) based on 1. PRA results of mean live coralcover (in percent), their classification (C) based on
Gomez et al (1991) for all the barangays (brgy) of the five municipalities of Camiguin Gomez et al (1991) for all the barangays (brgy) of the five municipalities of Camiguin Gomez et al (1991) for all the barangays (brgy) of the five municipalities of Camiguin Gomez et al (1991) for all the barangays (brgy) of the five municipalities of Camiguin
Province. Legend: NAProvince. Legend: NAProvince. Legend: NAProvince. Legend: NA = not applicable.= not applicable.= not applicable.= not applicable.
Extensive seagrass beds were present at Mahinog (Benoni
South Poblacion). At Benoni-San Miguel, the bed extends 500m from the shore with a pure
Enhalus acoroides bed at the first 300 m followed by a mixed bed of
Halodule pinifolia, Cymodocea rotundata, Thalassia hemprichii and Enhalus acoroides
Guinsiliban, the beds were primarily
found at South Poblacion. Apart from
species were recorded: Cymodocea rotundata
Large mangrove forests were
(Cantaan). These sites have portions with primary forests that are composed of large, old
trees. It is imperative that existing primary forests be conserved since this
distribution at Camiguin.
Participatory Resource Assessment of Camiguin, 2008 (Final Report)
important to local fishers and tourist boat operators as docking
sites. Thus LGUs should incorporate these areas into their CRM plans since these can be a
major source of resource conflict.
1. PRA results of mean live coralcover (in percent), their classification (C) based on 1. PRA results of mean live coralcover (in percent), their classification (C) based on 1. PRA results of mean live coralcover (in percent), their classification (C) based on 1. PRA results of mean live coralcover (in percent), their classification (C) based on
Gomez et al (1991) for all the barangays (brgy) of the five municipalities of Camiguin Gomez et al (1991) for all the barangays (brgy) of the five municipalities of Camiguin Gomez et al (1991) for all the barangays (brgy) of the five municipalities of Camiguin Gomez et al (1991) for all the barangays (brgy) of the five municipalities of Camiguin
= not applicable.= not applicable.= not applicable.= not applicable.
Extensive seagrass beds were present at Mahinog (Benoni-San Miguel) and Guinsiliban (North
San Miguel, the bed extends 500m from the shore with a pure
at the first 300 m followed by a mixed bed of Halophila ovalis,
Halodule pinifolia, Cymodocea rotundata, Thalassia hemprichii and Enhalus acoroides
primarily Thalassia-Enhalus beds, the most extensive of which was
found at South Poblacion. Apart from Thalassia hemprichii and Enhalus acoroides
Cymodocea rotundata, Halodule pinifolia and Halophila ov
angrove forests were found at Mahinog (Benoni-San Miguel) and Guinsiliban
These sites have portions with primary forests that are composed of large, old
trees. It is imperative that existing primary forests be conserved since this ecosystem has limited
(Final Report), page - 12121212
important to local fishers and tourist boat operators as docking
e these can be a
1. PRA results of mean live coralcover (in percent), their classification (C) based on 1. PRA results of mean live coralcover (in percent), their classification (C) based on 1. PRA results of mean live coralcover (in percent), their classification (C) based on 1. PRA results of mean live coralcover (in percent), their classification (C) based on
Gomez et al (1991) for all the barangays (brgy) of the five municipalities of Camiguin Gomez et al (1991) for all the barangays (brgy) of the five municipalities of Camiguin Gomez et al (1991) for all the barangays (brgy) of the five municipalities of Camiguin Gomez et al (1991) for all the barangays (brgy) of the five municipalities of Camiguin
GUINSILIBANGUINSILIBANGUINSILIBANGUINSILIBAN
BrgyBrgyBrgyBrgy CCCC
Live Live Live Live
CoralCoralCoralCoral
Maac P 1.3
Cabuan P 17.3
Cantaan G 52.0
North
Pob F 28.0
South
Pob F 28.0
Liong F 42.7
Guinsiliban (North-
San Miguel, the bed extends 500m from the shore with a pure
Halophila ovalis,
Halodule pinifolia, Cymodocea rotundata, Thalassia hemprichii and Enhalus acoroides. At
beds, the most extensive of which was
Enhalus acoroides, three other
Halophila ovalis.
San Miguel) and Guinsiliban
These sites have portions with primary forests that are composed of large, old
ecosystem has limited
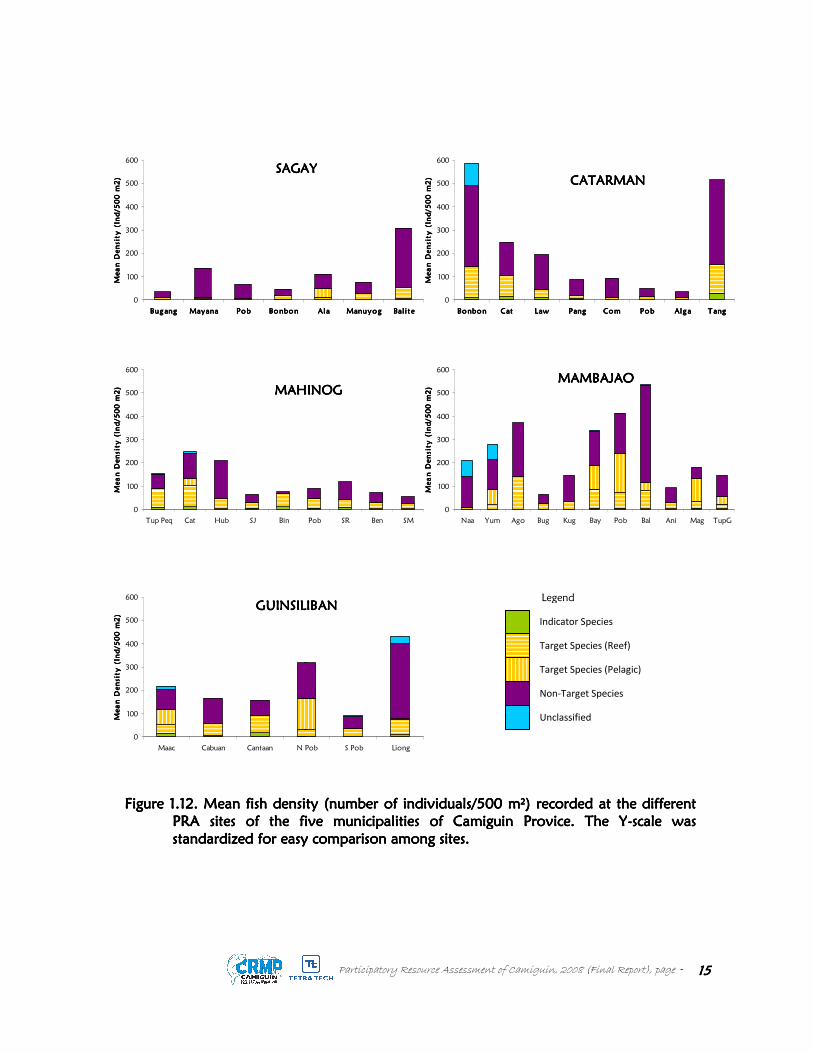
CompositionCompositionCompositionComposition, , , , Density Density Density Density and Size Classes and Size Classes and Size Classes and Size Classes
The PRA survey made the participants realize three general trends of the fish
within the surveyed reefs:
(A) Fish diversity (total number of kinds of fishes) was low for several sites, particularly
at Sagay with target having higher representation (Fig.
(B) The fishes within the surveyed sites were mainly composed of non
(Fig. 1.12), and
(C) Fishes within the sites were generally small, belonging to the 1
1.13).
The results of the fish visual census are discussed in detail
municipality.
Participatory Resource Assessment of Camiguin, 2008 (Final Report)
and Size Classes and Size Classes and Size Classes and Size Classes of of of of Fishes at Fishes at Fishes at Fishes at PRA Sites PRA Sites PRA Sites PRA Sites
The PRA survey made the participants realize three general trends of the fish
Fish diversity (total number of kinds of fishes) was low for several sites, particularly
at Sagay with target having higher representation (Fig. 1.11),
The fishes within the surveyed sites were mainly composed of non
within the sites were generally small, belonging to the 1-10 cm size rage (Fig.
The results of the fish visual census are discussed in detail in the sections devoted to each
(Final Report), page - 13131313
The PRA survey made the participants realize three general trends of the fish population
Fish diversity (total number of kinds of fishes) was low for several sites, particularly
The fishes within the surveyed sites were mainly composed of non-target species
10 cm size rage (Fig.
in the sections devoted to each
Figure Figure Figure Figure 1.1.1.1.11. Number of fish ‘species’ (based on local names) recorded at the different PRA 11. Number of fish ‘species’ (based on local names) recorded at the different PRA 11. Number of fish ‘species’ (based on local names) recorded at the different PRA 11. Number of fish ‘species’ (based on local names) recorded at the different PRA
sites of the five municipalities of Camiguin Provice. sites of the five municipalities of Camiguin Provice. sites of the five municipalities of Camiguin Provice. sites of the five municipalities of Camiguin Provice.
easy comparison among sites.easy comparison among sites.easy comparison among sites.easy comparison among sites.
Participatory Resource Assessment of Camiguin, 2008 (Final Report)
11. Number of fish ‘species’ (based on local names) recorded at the different PRA 11. Number of fish ‘species’ (based on local names) recorded at the different PRA 11. Number of fish ‘species’ (based on local names) recorded at the different PRA 11. Number of fish ‘species’ (based on local names) recorded at the different PRA
sites of the five municipalities of Camiguin Provice. sites of the five municipalities of Camiguin Provice. sites of the five municipalities of Camiguin Provice. sites of the five municipalities of Camiguin Provice. The YThe YThe YThe Y----scale was standardized for scale was standardized for scale was standardized for scale was standardized for
easy comparison among sites.easy comparison among sites.easy comparison among sites.easy comparison among sites.
AlaAlaAlaAla ManuyogManuyogManuyogManuyog Bal i teBal i teBal i teBal i te
SAGAYSAGAYSAGAYSAGAY
Indicator Species
Target Species (Reef)
Non-Target Species
Unclassified
Target Species (Pelagic)
Legend
(Final Report), page - 14141414
11. Number of fish ‘species’ (based on local names) recorded at the different PRA 11. Number of fish ‘species’ (based on local names) recorded at the different PRA 11. Number of fish ‘species’ (based on local names) recorded at the different PRA 11. Number of fish ‘species’ (based on local names) recorded at the different PRA
scale was standardized for scale was standardized for scale was standardized for scale was standardized for
Figure Figure Figure Figure 1.1.1.1.12. Mean fish density (number of individuals/500 m12. Mean fish density (number of individuals/500 m12. Mean fish density (number of individuals/500 m12. Mean fish density (number of individuals/500 m
PRA sites of the five municipalities of Camiguin Provice. The YPRA sites of the five municipalities of Camiguin Provice. The YPRA sites of the five municipalities of Camiguin Provice. The YPRA sites of the five municipalities of Camiguin Provice. The Y
standardized for easy comparison among sites.standardized for easy comparison among sites.standardized for easy comparison among sites.standardized for easy comparison among sites.
Participatory Resource Assessment of Camiguin, 2008 (Final Report)
AlaAlaAlaAla ManuyogManuyogManuyogManuyog Bal i teBal i teBal i teBal i te
12. Mean fish density (number of individuals/500 m12. Mean fish density (number of individuals/500 m12. Mean fish density (number of individuals/500 m12. Mean fish density (number of individuals/500 m2222) recorded at the different ) recorded at the different ) recorded at the different ) recorded at the different
PRA sites of the five municipalities of Camiguin Provice. The YPRA sites of the five municipalities of Camiguin Provice. The YPRA sites of the five municipalities of Camiguin Provice. The YPRA sites of the five municipalities of Camiguin Provice. The Y
standardized for easy comparison among sites.standardized for easy comparison among sites.standardized for easy comparison among sites.standardized for easy comparison among sites.
) recorded at the different ) recorded at the different ) recorded at the different ) recorded at the different
PRA sites of the five municipalities of Camiguin Provice. The YPRA sites of the five municipalities of Camiguin Provice. The YPRA sites of the five municipalities of Camiguin Provice. The YPRA sites of the five municipalities of Camiguin Provice. The Y----scale was scale was scale was scale was
Figure Figure Figure Figure 1.1.1.1.13. Size composition of fishes recorded at 13. Size composition of fishes recorded at 13. Size composition of fishes recorded at 13. Size composition of fishes recorded at
municipalities of Camiguin Provice. The Ymunicipalities of Camiguin Provice. The Ymunicipalities of Camiguin Provice. The Ymunicipalities of Camiguin Provice. The Y
comparison among sites.comparison among sites.comparison among sites.comparison among sites.
Participatory Resource Assessment of Camiguin, 2008 (Final Report)
13. Size composition of fishes recorded at 13. Size composition of fishes recorded at 13. Size composition of fishes recorded at 13. Size composition of fishes recorded at the different PRA sites of the five the different PRA sites of the five the different PRA sites of the five the different PRA sites of the five
municipalities of Camiguin Provice. The Ymunicipalities of Camiguin Provice. The Ymunicipalities of Camiguin Provice. The Ymunicipalities of Camiguin Provice. The Y----scale was standardized for easy scale was standardized for easy scale was standardized for easy scale was standardized for easy
comparison among sites.comparison among sites.comparison among sites.comparison among sites.