Particle acceleration in laser-driven magnetic reconnection S. R. Totorica, T. Abel, and F. Fiuza Citation: Physics of Plasmas 24, 041408 (2017); doi: 10.1063/1.4978627 View online: http://dx.doi.org/10.1063/1.4978627 View Table of Contents: http://aip.scitation.org/toc/php/24/4 Published by the American Institute of Physics Articles you may be interested in Formation of high-speed electron jets as the evidence for magnetic reconnection in laser-produced plasma Physics of Plasmas 24, 041406041406 (2017); 10.1063/1.4978883 Electron holes in phase space: What they are and why they matter Physics of Plasmas 24, 055601055601 (2017); 10.1063/1.4976854 Particle dynamics in the electron current layer in collisionless magnetic reconnection Physics of Plasmas 23, 102102102102 (2016); 10.1063/1.4963008 Energy conversion mechanism for electron perpendicular energy in high guide-field reconnection Physics of Plasmas 24, 032901032901 (2017); 10.1063/1.4977908 On the generation of magnetized collisionless shocks in the large plasma device Physics of Plasmas 24, 041405041405 (2017); 10.1063/1.4978882 Dynamo-driven plasmoid formation from a current-sheet instability Physics of Plasmas 23, 120705120705 (2016); 10.1063/1.4972218
Transcript
Particle acceleration in laser-driven magnetic reconnectionS. R. Totorica, T. Abel, and F. Fiuza
Citation: Physics of Plasmas 24, 041408 (2017); doi: 10.1063/1.4978627View online: http://dx.doi.org/10.1063/1.4978627View Table of Contents: http://aip.scitation.org/toc/php/24/4Published by the American Institute of Physics
Articles you may be interested in Formation of high-speed electron jets as the evidence for magnetic reconnection in laser-produced plasmaPhysics of Plasmas 24, 041406041406 (2017); 10.1063/1.4978883
Electron holes in phase space: What they are and why they matterPhysics of Plasmas 24, 055601055601 (2017); 10.1063/1.4976854
Particle dynamics in the electron current layer in collisionless magnetic reconnectionPhysics of Plasmas 23, 102102102102 (2016); 10.1063/1.4963008
Energy conversion mechanism for electron perpendicular energy in high guide-field reconnectionPhysics of Plasmas 24, 032901032901 (2017); 10.1063/1.4977908
On the generation of magnetized collisionless shocks in the large plasma devicePhysics of Plasmas 24, 041405041405 (2017); 10.1063/1.4978882
Dynamo-driven plasmoid formation from a current-sheet instabilityPhysics of Plasmas 23, 120705120705 (2016); 10.1063/1.4972218
Particle acceleration in laser-driven magnetic reconnection
S. R. Totorica,1,2,3 T. Abel,1,2,4 and F. Fiuza3,a)
1Kavli Institute for Particle Astrophysics and Cosmology, Stanford University, Stanford, California 94305, USA2Department of Physics, Stanford University, Stanford, California 94305, USA3High Energy Density Science Division, SLAC National Accelerator Laboratory, Menlo Park, California94025, USA4SLAC National Accelerator Laboratory, Menlo Park, California 94025, USA
(Received 7 November 2016; accepted 25 January 2017; published online 3 April 2017)
Particle acceleration induced by magnetic reconnection is thought to be a promising candidate for
producing the nonthermal emissions associated with explosive phenomena such as solar flares,
pulsar wind nebulae, and jets from active galactic nuclei. Laboratory experiments can play an
important role in the study of the detailed microphysics of magnetic reconnection and the dominant
particle acceleration mechanisms. We have used two- and three-dimensional particle-in-cell simu-
lations to study particle acceleration in high Lundquist number reconnection regimes associated
with laser-driven plasma experiments. For current experimental conditions, we show that nonther-
mal electrons can be accelerated to energies more than an order of magnitude larger than the initial
thermal energy. The nonthermal electrons gain their energy mainly from the reconnection electric
field near the X points, and particle injection into the reconnection layer and escape from the finite
system establish a distribution of energies that resembles a power-law spectrum. Energetic elec-
trons can also become trapped inside the plasmoids that form in the current layer and gain addi-
tional energy from the electric field arising from the motion of the plasmoid. We compare
simulations for finite and infinite periodic systems to demonstrate the importance of particle escape
on the shape of the spectrum. Based on our findings, we provide an analytical estimate of the maxi-
mum electron energy and threshold condition for observing suprathermal electron acceleration in
terms of experimentally tunable parameters. We also discuss experimental signatures, including the
angular distribution of the accelerated particles, and construct synthetic detector spectra. These
results open the way for novel experimental studies of particle acceleration induced by reconnec-
tion. Published by AIP Publishing. [http://dx.doi.org/10.1063/1.4978627]
I. INTRODUCTION
Magnetic reconnection is a fundamental plasma process
that converts magnetic field energy into plasma energy
through the breaking and rearrangement of magnetic field
lines.1 The energy released as the magnetic field changes
topology drives plasma flows, heats the plasma, and acceler-
ates energetic particles. Reconnection is important in the
dynamics of magnetized plasmas in space physics, astro-
physics, and laboratory nuclear fusion devices.2–4 It is
believed to play a key role in frontier problems in physics,
including the origin of cosmic rays, and is also relevant for
applications such as space weather and nuclear fusion
energy. Observations of explosive events in astrophysics and
space physics, such as solar flares, pulsar wind nebulae,
gamma-ray bursts, and jets from active galactic nuclei, often
indicate rapid energy dissipation and efficient particle accel-
eration, and these systems are likely composed of magne-
tized plasma. Reconnection is a promising candidate to
explain the fast and efficient dissipation of magnetic energy
and the production of the nonthermal particle distributions
inferred to be present in these systems.5
Recently, several groups have used numerical simulations
to investigate the particle acceleration properties of
reconnection over the large range of conditions spanned by
systems where reconnection is expected to play an important
role.6–12 The environment in many magnetized astrophysical
outflows of interest is expected to be in the relativistic regime,
where the magnetization parameter r ¼ B2=4pnimic2 is
greater than one, meaning that the magnetic energy per parti-
cle exceeds the rest mass energy. Studies in this regime have
clearly shown that relativistic reconnection is an efficient
mechanism for converting magnetic energy into relativistic
nonthermal particles. These energetic particles contain the
majority of the total energy released, and the energy spectra
show power-laws with hard slopes that can approach 1 for
large r.6,7 In the non-relativistic regime, reconnection has
been shown to energize nonthermal populations of particles,
but it is not clear whether the resulting energy spectra form
power-laws.8–12
These studies have identified many distinct acceleration
mechanisms. The points where the reconnecting magnetic
field vanishes are known as X points, and here the particles
are unmagnetized and can be freely accelerated by the elec-
tric field associated with reconnection. Magnetic island
structures known as plasmoids form as a result of the current
sheet tearing instability,13 and these can have important con-
sequences for the particle acceleration. Particles can be
accelerated by a first-order Fermi process as they bouncea)Electronic mail: [email protected]
1070-664X/2017/24(4)/041408/12/$30.00 Published by AIP Publishing.24, 041408-1
between the ends of a contracting plasmoid,11 and they can
also be accelerated in secondary reconnection layers that
form as two plasmoids merge together.8 The relative impor-
tance of these processes and which are responsible for form-
ing the power-law is not fully understood. It is also
important to note that the majority of the studies of particle
acceleration and reconnection use the kinetic Harris equilib-
rium as initial conditions and employ fully periodic bound-
ary conditions. These very idealized initial conditions
include a preformed current sheet, and recent simulations
without preformed current sheets have shown important dif-
ferences such as significantly softer spectral indices.14 It thus
remains an active area of research to determine the efficiency
of reconnection in accelerating nonthermal particles and how
this depends on the plasma conditions. The ability to study
this process in a finite sized laboratory system with relevant
plasma conditions would be very valuable for advancing our
understanding of reconnection and determining whether it
can account for observational data.
High energy laser facilities, such as the OMEGA laser at
the University of Rochester and the National Ignition Facility
at Lawrence Livermore National Laboratory, can focus kJ to
MJ energies onto sub-millimeter spot sizes over nanosecond
time scales and create high-energy-density (HED) plasma
states in the laboratory. These lasers can ablate plasmas with
keV temperatures when focused onto solid targets. While
the spatial and temporal scales of laboratory plasmas are
extremely different from those in astrophysical systems, the
plasma conditions produced can reach a regime where Ohmic
dissipation is negligible and the governing equations are invari-
ant under scaling transformations.15,16 This allows the design
of laboratory experiments whose results can be used for the
interpretation of astrophysical phenomena, which has given
rise to the field of HED laboratory astrophysics.17 Over the
past ten years several experiments have been performed using
laser-driven HED plasmas to study magnetic reconnection in
the laboratory.18–26 For a review of laboratory reconnection
experiments see Ref. 27. By focusing kilojoule per nanosecond
lasers onto solid targets, expanding plasma bubbles are pro-
duced that self-generate megagauss scale toroidal magnetic
fields due to misaligned density and temperature gradients (the
Biermann battery rn�rT mechanism28–30). The expansion
of two nearby plasma bubbles can then drive reconnection
between these self generated magnetic fields, or alternatively
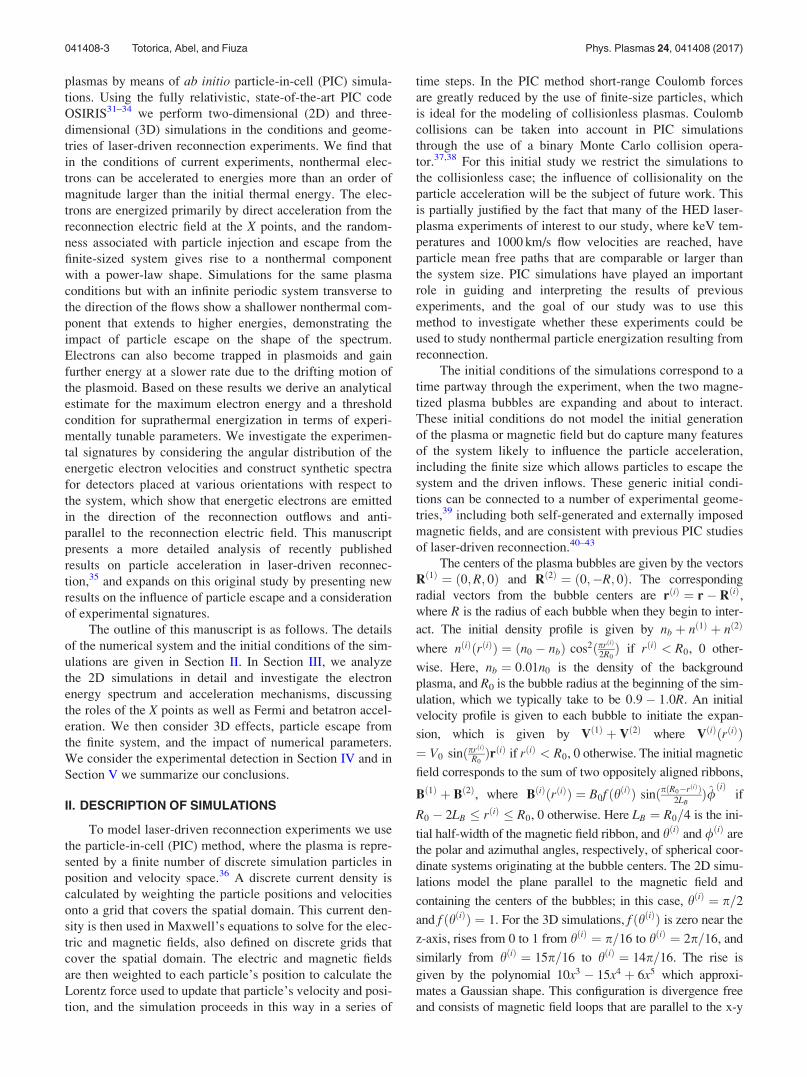
an externally imposed magnetic field can be used24 (Fig. 1(a)).
Diagnostics such as proton radiography and Thompson scatter-
ing allow the detailed measurement of the magnetic field and
plasma conditions during the experiments. Several prominent
features of reconnection have been observed in these experi-
ments, including changes in magnetic field topology,19 plasma
heating,23 and the formation of plasma jets.18 Reconnection in
laser-driven plasmas takes place in a strongly driven regime,
where the inflow speeds are larger than both the Alfv�en and
sound speeds. The high Lundquist number and large system
size relative to the ion inertial length allows a comparison with
astrophysical systems via the previously mentioned scaling
laws. However, it has remained unclear whether nonthermal
particle acceleration could be studied in these systems, and this
is one of the most important signatures of reconnection for
connecting to systems in astrophysics.
In this manuscript, we investigate the particle accelera-
tion properties of magnetic reconnection in laser-driven
FIG. 1. (a) Experimental geometry of magnetic reconnection in laser-driven plasmas. (b) Out-of-plane current jz, with overlaid magnetic field lines. (c) Out-of-
plane magnetic field Bz, showing the quadrupolar signature of Hall-mediated reconnection. (d) Out-of-plane electric field Ez, showing the motional electric
field in the body of the bubble and the reconnection electric field at the X points.
041408-2 Totorica, Abel, and Fiuza Phys. Plasmas 24, 041408 (2017)
plasmas by means of ab initio particle-in-cell (PIC) simula-
tions. Using the fully relativistic, state-of-the-art PIC code
OSIRIS31–34 we perform two-dimensional (2D) and three-
dimensional (3D) simulations in the conditions and geome-
tries of laser-driven reconnection experiments. We find that
in the conditions of current experiments, nonthermal elec-
trons can be accelerated to energies more than an order of
magnitude larger than the initial thermal energy. The elec-
trons are energized primarily by direct acceleration from the
reconnection electric field at the X points, and the random-
ness associated with particle injection and escape from the
finite-sized system gives rise to a nonthermal component
with a power-law shape. Simulations for the same plasma
conditions but with an infinite periodic system transverse to
the direction of the flows show a shallower nonthermal com-
ponent that extends to higher energies, demonstrating the
impact of particle escape on the shape of the spectrum.
Electrons can also become trapped in plasmoids and gain
further energy at a slower rate due to the drifting motion of
the plasmoid. Based on these results we derive an analytical
estimate for the maximum electron energy and a threshold
condition for suprathermal energization in terms of experi-
mentally tunable parameters. We investigate the experimen-
tal signatures by considering the angular distribution of the
energetic electron velocities and construct synthetic spectra
for detectors placed at various orientations with respect to
the system, which show that energetic electrons are emitted
in the direction of the reconnection outflows and anti-
parallel to the reconnection electric field. This manuscript
presents a more detailed analysis of recently published
results on particle acceleration in laser-driven reconnec-
tion,35 and expands on this original study by presenting new
results on the influence of particle escape and a consideration
of experimental signatures.
The outline of this manuscript is as follows. The details
of the numerical system and the initial conditions of the sim-
ulations are given in Section II. In Section III, we analyze
the 2D simulations in detail and investigate the electron
energy spectrum and acceleration mechanisms, discussing
the roles of the X points as well as Fermi and betatron accel-
eration. We then consider 3D effects, particle escape from
the finite system, and the impact of numerical parameters.
We consider the experimental detection in Section IV and in
Section V we summarize our conclusions.
II. DESCRIPTION OF SIMULATIONS
To model laser-driven reconnection experiments we use
the particle-in-cell (PIC) method, where the plasma is repre-
sented by a finite number of discrete simulation particles in
position and velocity space.36 A discrete current density is
calculated by weighting the particle positions and velocities
onto a grid that covers the spatial domain. This current den-
sity is then used in Maxwell’s equations to solve for the elec-
tric and magnetic fields, also defined on discrete grids that
cover the spatial domain. The electric and magnetic fields
are then weighted to each particle’s position to calculate the
Lorentz force used to update that particle’s velocity and posi-
tion, and the simulation proceeds in this way in a series of
time steps. In the PIC method short-range Coulomb forces
are greatly reduced by the use of finite-size particles, which
is ideal for the modeling of collisionless plasmas. Coulomb
collisions can be taken into account in PIC simulations
through the use of a binary Monte Carlo collision opera-
tor.37,38 For this initial study we restrict the simulations to
the collisionless case; the influence of collisionality on the
particle acceleration will be the subject of future work. This
is partially justified by the fact that many of the HED laser-
plasma experiments of interest to our study, where keV tem-
peratures and 1000 km/s flow velocities are reached, have
particle mean free paths that are comparable or larger than
the system size. PIC simulations have played an important
role in guiding and interpreting the results of previous
experiments, and the goal of our study was to use this
method to investigate whether these experiments could be
used to study nonthermal particle energization resulting from
reconnection.
The initial conditions of the simulations correspond to a
time partway through the experiment, when the two magne-
tized plasma bubbles are expanding and about to interact.
These initial conditions do not model the initial generation
of the plasma or magnetic field but do capture many features
of the system likely to influence the particle acceleration,
including the finite size which allows particles to escape the
system and the driven inflows. These generic initial condi-
tions can be connected to a number of experimental geome-
tries,39 including both self-generated and externally imposed
magnetic fields, and are consistent with previous PIC studies
of laser-driven reconnection.40–43
The centers of the plasma bubbles are given by the vectors
Rð1Þ ¼ ð0;R; 0Þ and Rð2Þ ¼ ð0;�R; 0Þ. The corresponding
radial vectors from the bubble centers are rðiÞ ¼ r� RðiÞ,where R is the radius of each bubble when they begin to inter-
act. The initial density profile is given by nb þ nð1Þ þ nð2Þ
where nðiÞðrðiÞÞ ¼ ðn0 � nbÞ cos2ðprðiÞ
2R0Þ if rðiÞ < R0, 0 other-
wise. Here, nb ¼ 0:01n0 is the density of the background
plasma, and R0 is the bubble radius at the beginning of the sim-
ulation, which we typically take to be 0:9� 1:0R. An initial
velocity profile is given to each bubble to initiate the expan-
sion, which is given by Vð1Þ þ Vð2Þ where VðiÞðrðiÞÞ¼ V0 sinðprðiÞ
R0ÞrðiÞ if rðiÞ < R0, 0 otherwise. The initial magnetic
field corresponds to the sum of two oppositely aligned ribbons,
Bð1Þ þ Bð2Þ, where BðiÞðrðiÞÞ ¼ B0f ðhðiÞÞ sinðpðR0�rðiÞÞ2LB
Þ/̂ðiÞ if
R0 � 2LB � rðiÞ � R0, 0 otherwise. Here LB ¼ R0=4 is the ini-
tial half-width of the magnetic field ribbon, and hðiÞ and /ðiÞ are
the polar and azimuthal angles, respectively, of spherical coor-
dinate systems originating at the bubble centers. The 2D simu-
lations model the plane parallel to the magnetic field and
containing the centers of the bubbles; in this case, hðiÞ ¼ p=2
and f ðhðiÞÞ ¼ 1. For the 3D simulations, f ðhðiÞÞ is zero near the
z-axis, rises from 0 to 1 from hðiÞ ¼ p=16 to hðiÞ ¼ 2p=16, and
similarly from hðiÞ ¼ 15p=16 to hðiÞ ¼ 14p=16. The rise is
given by the polynomial 10x3 � 15x4 þ 6x5 which approxi-
mates a Gaussian shape. This configuration is divergence free
and consists of magnetic field loops that are parallel to the x-y
041408-3 Totorica, Abel, and Fiuza Phys. Plasmas 24, 041408 (2017)
plane. For the case of reconnection between self-generated
magnetic fields, these initial conditions are idealized and
neglect small-scale field structures that can arise. In particular,
recent work has suggested the possibility of coupling with elec-
tron scale kinetic instabilities.44,45 We note that for typical
laser-ablated plasma conditions (e.g., at OMEGA or OMEGA
EP19,24–26,40,41), where near the foils we have Te � 100 eV and
ne � 1021 � 1022 cm�3, the electron collisional mean free path
is �0:03� 0:3lm, which is of the order of or smaller than the
electron skin depth. It is thus not clear whether electron scale
instabilities can develop for such conditions. However, this
deserves more detailed investigation that is beyond the scope
of the current work. The electric field is initialized as
E ¼ �V� B=c, consistent with the initial motion of the mag-
netized plasma, where V ¼ Ve ¼ Vi at t¼ 0. An initial out-of-
plane current Jz is included that is consistent with r� B
¼ 4pc J and distributed to the electrons and ions by the inverse
of their mass ratio. The majority of the simulations use a box of
size 8R� 2R evolved to t=td ¼ 0:5 for 2D, and a box of size
4R� 2R� 4R evolved to t=td ¼ 0:25 for 3D. Here td ¼ R=V0
is the relevant timescale for the interaction and the experimen-
tal measurements. The boundaries along the outflow directions,
x (and z for 3D), are thermal re-emitting for the background
plasma particles, absorbing for the plasma bubble particles, and
an absorbing layer46 for the electromagnetic fields. The anti-
symmetry of the system allows the use of periodic boundaries
along the inflow (y) direction. We also perform simulations
with larger domains and without periodic boundaries along the
inflow direction (i.e., modeling the entire bubbles) which con-
firm that the boundaries are not significantly affecting the
results. The open boundaries for the plasma bubble particles
and the electromagnetic fields prevent energetic particles and
radiation from the reconnection outflows from artificially recir-
culating in the system. Many of the previous reconnection sim-
ulation studies use periodic boundaries in the direction of the
reconnection outflows and thus may suffer unphysical effects
from recirculating particles and radiation. If particle accelera-
tion could be studied in the finite-sized systems of laser-driven
plasmas it would yield critical insight for understanding the
role of boundary conditions and particle escape in models of
reconnection.
To enable a study of the particle acceleration process
without the effects of particle escape from the finite sized
system, in Sec. III G we also use an idealized 2D configura-
tion where the plasma flows are infinite and periodic trans-
verse to the flow. This corresponds to the same initial
conditions as described above, but with the radial vectors
changed to rð1Þ ¼ ð0; y� R; 0Þ and rð2Þ ¼ ð0; yþ R; 0Þ.These simulations use a spatial domain of size 2Lx � 2Ly �53c=xpi � 53c=xpi and fully periodic boundary conditions.
We further simplify this system in Sec. III E by assuming
uniformity along the x-direction, which suppresses reconnec-
tion and allows us to isolate the process of betatron
acceleration.
To model the plasma conditions relevant for recent laser-
driven reconnection experiments (e.g., those generated with
the OMEGA EP laser24) we directly match many of the
plasma parameters to their laboratory values. See Table I for
values of the dimensionless plasma parameters estimated
from recent experimental measurements41 and for the simula-
tions studied below. We model a range of Alfv�enic and sonic
Mach numbers within the experimentally accessible range,
MA ¼ V0=VA ¼ 4� 64 and MS ¼ V0=CS ¼ 2� 8, where VA
the sound speed. We also match the high experimental plasma
beta, which characterizes the dynamical importance of the
magnetic field, be ¼ n0Te
B20=8p ¼ 2 MA
MS
� �2
¼ 8� 128. The bubble
radii at the time of interaction are chosen to be R=ðc=xpiÞ ’26:5 for the 2D simulations and R=ðc=xpiÞ ’ 20� 26:5 for
the 3D simulations, which are within the experimentally
accessible range41 of R=ðc=xpiÞ ¼ 10� 100. The initial tem-
peratures Te and Ti are taken to be equal and uniform through-
out the plasma. Due to computational expense, the parameters
CS=c and mi=meZ (where c is the speed of light, mi and me the
ion and electron masses, and Z the ion charge) are not directly
matched to experimental values. Instead, in the majority of
the simulations we use V0=c ¼ 0:1 and mi=meZ ¼ 128, with
CS chosen to correctly match MS. Using artificial values for
these parameters is a commonly used approximation that
effectively reduces the speed of light and increases the elec-
tron mass, but can still allow for an adequate separation of the
relevant temporal and spatial scales to accurately model the
physical processes. In Sec. III G we show how we have varied
these parameters in the range of V0=c ¼ 0:025� 0:1 and
mi=meZ ¼ 32� 512 to verify that the main results of this
study are relatively insensitive to their exact values. The field
quantities are represented on a spatial grid with a resolution of
Dx ¼ 0:5c=xpe ’ 0:04c=xpi and cubic interpolation is used
to weight between the particle and field quantities. The 2D
simulations use a timestep of Dt ¼ 0:35 x�1pe and 64 particles
per cell per species, whereas the 3D simulations use a time-
step of Dt ¼ 0:285 x�1pe and 8 particles per cell per species.
III. SIMULATION RESULTS
A. General features
To illustrate the main results, we use as a representative
case of the 2D simulation with MS¼ 2 and MA¼ 4 and ana-
lyze it in detail. The overall evolution of the system is con-
sistent with previous PIC studies using similar initial
conditions.40–43 As the plasma flows carry the magnetic flux
into the interaction region at super-Alfv�enic speeds, the
TABLE I. Values of the dimensionless plasma parameters estimated from
recent experimental measurements41 and for the simulations studied in this
manuscript. Here S ¼ LVA=g is the Lundquist number. � While PIC simula-
tions nominally model collisionless systems, in reality a finite numerical col-
lisionality arises from the discrete nature of the simulation particles.
Parameter Experimental Simulation
MS 0.65–2 2–8
MA 1.3–20 4–64
B 8–150 8–128
R=ðc=xpiÞ 10–80 20–26.5
S 80–200 1�
041408-4 Totorica, Abel, and Fiuza Phys. Plasmas 24, 041408 (2017)
plasma is compressed by the ram pressure and the amplitude
of the magnetic field increases by a factor of �1:65. A cur-
rent sheet forms (Fig. 1(b)) with a width on the order of the
ion skin depth, c=xpi, which is the scale at which electrons
and ions decouple. This decoupling enables fast reconnection
mediated by the Hall effect,47 and the quadrupolar out-
of-plane magnetic field signature of Hall reconnection is
clearly visible in the fields (Fig. 1(c)). The current sheet is
then unstable to the tearing instability and a single plasmoid
is formed that slowly drifts in the direction of the reconnec-
tion outflows as reconnection proceeds. The formation of a
single plasmoid is consistent with linear theory for the tear-
ing instability48 which predicts the fastest growing mode to
be given by kmaxd ¼ 0:55, where d � 1:41 c=xpi is the half-
width of the current sheet measured in the simulation. For
the range of Alfv�enic and sonic mach numbers simulated we
typically observe magnetic field enhancement by a factor of
1.5–5 and the formation of 1–3 plasmoids.
An out-of-plane electric field is present in the current
sheet (Fig. 1(d)), and we have calculated the various terms
in the generalized Ohms law (E ¼ � 1c
ni
nevi � Bþ 1
enec J� B
�r�Pe
ene� me
edve
dt ) to confirm that the electric field in the diffu-
sion region is predominantly supported by the Hall and off-
diagonal electron pressure tensor terms. This is in agreement
with previous kinetic studies of reconnection starting from
the Harris equilibrium47 and laser-driven reconnection.40 At
the X points, where the magnetic field vanishes, this electric
field is almost completely supported by the off-diagonal
electron pressure tensor terms and can be identified as the
reconnection electric field; this is distinct from the motional
electric field that arises from the expansion of the magne-
tized plasma bubble, which is self-consistently included in
our initial conditions. We observe the typical value of the
reconnection electric field in the diffusion region to be
E � 0:5V0B0. In terms of the local Alfv�en speed and com-
pressed magnetic field, we find E � 0:3VAB at t=td ¼ 0:25,
when the plasmoid is just beginning to form, which is similar
to the reconnection rates typically measured in simulations
of collisionless reconnection.47
After the onset of reconnection, the reconnected field
lines drive plasma outflows that escape the interaction region
due to the finite size of the system, similar to the jets that
have been measured in the experiments. An in-plane polari-
zation electric field directed away from the plasma bubbles
is set up as the hot electrons expand faster than the ions
(Figs. 2(a) and 2(b)). For the system size and magnetic field
strength of this simulation, the electrons are strongly magne-
tized, whereas the ions are not. This is visible in Figs. 2(c)
and 2(d) which show the longitudinal component of the
momentum, py, as a function of the y-axis for the ions and
the electrons. The ions are able to easily penetrate across the
interaction region whereas the electrons are strongly affected
by the magnetic field.
B. Electron spectrum
Figure 3(a) shows the temporal evolution of the electron
energy spectrum, with the different colored lines correspond-
ing to the spectrum at equally spaced times throughout the
duration of the simulation, showing the clear development of
a high energy component that resembles a steep power-law
with energies extending up to �50 kBTe. In Figure 3(b) we fit
the low-energy portion of the electron spectrum at t=td ¼ 0:25
to a Maxwell–Boltzmann distribution, and observe that the
FIG. 2. (a) Ex and (b) Ey, showing the in-plane polarization electric field resulting from the expansion of the hot electrons. Longitudinal momentum py along
the direction of the reconnection inflows for (c) ions, showing the interpenetration of the streams and (d) electrons, showing that the electrons are strongly
affected by the magnetic field in the interaction region.
041408-5 Totorica, Abel, and Fiuza Phys. Plasmas 24, 041408 (2017)
remaining nonthermal component resembles a power-law
with an index of �5:3 that starts at �5kBTe and with an expo-
nential cutoff at �20kBTe. At the end of the simulation (t=td
¼ 0:5), the nonthermal component contains �8% of the initial
energy of the electrons that reach the interaction region,
�24% of the energy stored in the initial magnetic field, and
�1% of the total number of electrons initially in the bubbles.
Figures 3(c) and 3(d) show the distribution of electron
energies along the direction of the reconnection outflows at
t=td ¼ 0:25 and 0.5, respectively. In Figure 3(c) there is a
broad peak centered near x¼ 0, which is approximately the
location of the X point before the plasmoid forms. Figure
3(d) shows a later time, after the plasmoid has formed, where
energetic electrons are seen both to escape in the direction of
the reconnection outflows and to become localized near the
position of the single plasmoid that forms. At this time the
most energetic electrons in the system are seen to be inside
the plasmoid. In a realistic 3D system (which we discuss
below) the electrons trapped inside the plasmoid would also
eventually escape the reconnection region, but orthogonal to
the reconnection plane along the z-direction.
C. Acceleration mechanism
To determine the acceleration mechanism responsible
for producing the high energy tail, we have tracked the
detailed motion of the electrons that attain the highest energy
by the end of the simulation. This has revealed two main
distinct types of behavior, which are illustrated in Figs. 4(a)
and 4(b) by representative example electron trajectories
plotted over the magnitude of the in-plane magnetic field.
Figure 4(a) shows the magnetic field at an early time
(t=td ¼ 0:25), Fig. 4(b) shows a later time after the plasmoid
has formed (t=td ¼ 0:5), and the diamonds show the initial
position of the electrons. The inlays show the energy of the
electrons as a function of position along the x-axis, which
shows that in both cases the electrons gain the majority of
their energy in a narrow region along the x-axis. This corre-
sponds to when they interact with an X point, where the mag-
netic field vanishes and the unmagnetized electrons can be
freely accelerated. To separate the contributions to the
energization from the out-of-plane reconnection electric
field and the in-plane polarization electric field, we have
calculated the work done on the electron by each electric
field component individually throughout the simulation
as Wi ¼Ð t
0dt0ðpi=c meÞð�e EiÞ. The evolution of the total
energy and the work done by each electric field component
for the two example electrons is plotted in Figs. 4(c) and
4(d). These plots show that it is the out-of-plane component
of the electric field associated with reconnection at the
X points that is primarily responsible for energizing the elec-
trons. As the electrons oscillate inside the current sheet, they
alternately gain and lose energy from the polarization elec-
tric field, which leads to the oscillations seen in the total
energy superimposed over the growth from the reconnection
electric field. After the electrons have acquired a large out-
of-plane velocity, the in-plane magnetic field rotates their
velocities into the plane where the electrons will either
escape the system (Figure 4(a)), become trapped inside a
plasmoid (Figure 4(b)), or continue to travel along the field
lines circling the bubbles. The example electron that leaves
FIG. 3. (a) Temporal evolution of the electron energy spectrum, with a power-law of index p ¼ �5:3 plotted for reference (dashed line). (b) Best fit of the low
energy portion of the spectrum to a Maxwell–Boltzmann distribution, and the remaining nonthermal component. Distribution of electron energies along the
direction of the reconnection outflows at (c) t=td ¼ 0:25 and (d) t=td ¼ 0:5.
041408-6 Totorica, Abel, and Fiuza Phys. Plasmas 24, 041408 (2017)
the system loses some of its energy when it escapes as it
crosses the polarization electric field (Figure 4(c)), whereas
the electron that becomes trapped inside the plasmoid gains
further energy but at a slower rate (Figure 4(d)).
The energization inside the plasmoid is due to the drift
motion of the plasmoid in the direction of the reconnection
outflows, which leads to the trapped electrons being exposed
to an out-of-plane motional electric field with alternating
polarity (Figure 1(c)) as they circle inside the plasmoid.8
Plasma flowing into the drifting plasmoid from the bounding
X points reduces the bulk flow velocity on one side and
increases it on the other. The net result is that the trapped
electrons are exposed to an average field in the same direc-
tion as the reconnection electric field over each approxi-
mately circular orbit inside the plasmoid, allowing them to
gain further energy. Other particle tracks also show that the
energy gain from the direct acceleration at the X points is
much more significant than the energy gain inside the plas-
moid, and this slow energization is not seen to change the
shape of the spectrum significantly. We also note that we
have simulated the expansion of a single plasma bubble to
confirm that the motional electric field arising from the bub-
ble expansion alone does not significantly energize particles.
D. Fermi acceleration
Previous work has shown that the presence of plasmoids
in the current sheet may give rise to Fermi-acceleration pro-
cesses that can lead to power-law energy spectra.11
However, for the conditions of our simulations, direct accel-
eration by the reconnection electric field at the X points is
the primary energization mechanism, rather than the interac-
tion with plasmoids which only leads to a small energy gain.
The acceleration while trapped inside a single plasmoid can
be considered as a series of Fermi type B reflections,49 but is
not a stochastic acceleration process (e.g., diffusive shock
acceleration). Significant Fermi acceleration from the inter-
action with multiple plasmoids is likely to require a larger
system size with a larger number of plasmoids and thus a
more energetic laser drive than that used in current experi-
ments. Our simulation results thus indicate that the power-
law is the result of direct acceleration at X points rather than
interaction with plasmoids. A power-law may result as the
electrons are injected into the current layer at varied distan-
ces from the X points. They will then be accelerated by the
reconnection electric field for varied amounts of time before
the in-plane magnetic fields direct them out of the diffusion
region, establishing a distribution of energies.7 This argu-
ment is supported by calculating the spectrum of the elec-
trons in the plasmoid and subtracting it from the spectrum
including all electrons, as shown in Fig. 5. The high energy
tail has a similar shape for the electrons inside and outside of
the plasmoid, indicating that it is established by the initial
acceleration at the X points rather than through interaction
with the plasmoid.
E. Betatron acceleration
In addition to the energization resulting from reconnec-
tion, the electrons can also be energized by betatron acceler-
ation50 as a result of the compression of the magnetic field as
the plasma bubbles expand into each other. This contribution
to the acceleration can be isolated by performing 1D simula-
tions with the configuration described in Sec. II, where the
particles are constrained to move only along the y-axis and
the system is assumed to be uniform along the x- and z-
directions. In this case, the magnetic field is still compressed
as the flows expand, but the uniformity along the x-direction
suppresses reconnection. Figure 6(a) shows the evolution of
the energy of an electron as a function of its position along
the y-axis, which is representative of the energized electrons
in the simulations and illustrates the energy gain from the
betatron acceleration process. The electron gains energy pri-
marily during reflections rather than at the center of the cur-
rent sheet. As the magnetic field enhancement saturates, the
a similar plot for an electron from a 2D simulation where
reconnection does occur. This plot reveals three phases to
FIG. 4. (a) Trajectory of an escaping
electron, plotted over the magnitude of
the magnetic field at t=td ¼ 0:25, and
(b) trajectory of a trapped electron,
plotted over the magnitude of the mag-
netic field at t=td ¼ 0:5. Inlays show
each electron’s energy as a function of
its position along the x-axis. (c) and
(d) The temporal evolution of the total
change in energy and the work done by
each electric field component for the
electrons in (a) and (b), respectively.
041408-7 Totorica, Abel, and Fiuza Phys. Plasmas 24, 041408 (2017)
the acceleration. Initially, the particle gains a small amount
of energy by betatron acceleration (region I). Once reconnec-
tion initiates, the particle interacts with an X point and gains
energy from the reconnection electric field, which is clearly
visible as a nonzero slope when the particle is at the center
of the current sheet (region II). The final phase shows the
small net energy gain once the particle has entered the plas-
moid (region III). For the conditions of our simulations, Xpoint acceleration is the dominant energization mechanism,
as can be seen in Figure 6(b). For different plasma condi-
tions, betatron acceleration may be the dominant accelera-
tion mechanism.51 A detailed study of the relative
importance of X point, betatron, and plasmoid related accel-
eration mechanisms and how this depends on the plasma
conditions will be the subject of future work.
F. 3D effects
This 2D model system does not capture the finite size of
the system in the out-of-plane direction. As this is also the
direction the electrons are accelerated along, it is critical to
consider the 3D effects. Using the initialization described in
Sec. II, we have performed full 3D simulations of reconnec-
tion between expanding plasma bubbles for the conditions
MS¼ 2, MA¼ 4, and R=ðc=xpiÞ ’ 20. Figure 7(a) shows the
electron energy spectrum at t=td ¼ 0:25, which exhibits a
high-energy tail with a similar shape to the 2D case, sugges-
ting that the acceleration mechanisms are similar in 2D and
3D. An important difference is that the maximum electron
energy is smaller for the 3D case, which is due to the finite
out-of-plane size limiting the distance over which the elec-
trons can be accelerated by the reconnection electric field to
approximately the diameter of the bubble.
To derive a scaling of the maximum electron energy as
a function of the plasma conditions, we first determine the
effective electric field accelerating the electrons by analyzing
four 2D simulations and one 3D simulation with MS¼ 2 and
MA ranging from 4 to 32. Figure 7 shows a comparison of
the electron energy spectra at t=td ¼ 0:25 for some of these
simulations. The increase in maximum electron energy with
FIG. 5. (a) Magnetic field amplitude, with a box showing the region used for calculating the plasmoid spectrum. (b) Electron energy spectrum including all
electrons (total), only electrons outside the box in (a) (total-plasmoid), and only those inside the box in (a) (plasmoid).
FIG. 6. (a) Energy as a function of y-position for an example betatron accelerated electron in a 1D simulation. (b) Energy as a function of y-position for an
example electron accelerated by reconnection in a 2D simulation. Regions of betatron acceleration (I), X point acceleration (II), and plasmoid related accelera-
tion (III) are visible.
041408-8 Totorica, Abel, and Fiuza Phys. Plasmas 24, 041408 (2017)
initial magnetic field amplitude is consistent with the recon-
nection electric field being primarily responsible for energiz-
ing the electrons, and the similar shapes of the spectra
suggest the acceleration mechanisms are similar across these
conditions. From the evolution of the spectra over the dura-
tion of the simulation we obtain an effective electric field
Eeff energizing the electrons.35 In all cases the effective elec-
tric field is Eef f � 0:5V0B0, which is consistent with the typi-
cal value of the reconnection electric field measured in the
simulations. The effective electric field is slightly smaller in
the 3D case, which is due to the electrons not being exposed
to a uniform value of the reconnection electric field as they
travel in the out-of-plane direction.
An estimate for the maximum electron energy can be
obtained using the effective value of the reconnection electric
field, Eef f � 0:5V0B0, and the fact that the maximum distance
over which an electron can be accelerated is approximately
the diameter of the bubble. In terms of experimentally tunable
parameters, this gives �max=kBTe ¼ ðM2S=MAÞðRb=ðc=xpiÞÞ.
These parameters can be chosen in future experiments to opti-
mize the particle acceleration. For the parameters of the 3D
simulation presented above, this expression gives �max=kBTe
� 20, which agrees with the location of the cutoff of the spec-
trum as shown in Figure 7. The condition for electrons to be
accelerated by reconnection to suprathermal energies is then
ðM2S=MAÞðRb=ðc=xpiÞÞ > 1, which is easily satisfied by
current laboratory conditions. Using the conditions of two
laser-driven reconnection experiments performed at the
Omega Laser Facility24,41 which are estimated to be MS
� 2:5; 5:6; MA � 20; 9:2, and Rb=ðc=xpiÞ � 80; 22, this
model predicts maximum electron energies of �max=kBTe
� 25; 75. The electron temperatures in these experiments are
typically 1 keV, so these would be 25–75 keV electrons.
G. Particle escape and impact of numericalparameters
The finite probability for a given electron to escape the
system is another important factor that affects the shape of the
spectrum. To determine the influence of particle escape, we
perform 2D simulations with the configuration described in
Sec. II where the system is periodic and infinite transverse to
the plasma inflows, as shown in Figure 8(a). The spectrum for
this configuration compared with the finite case previously
discussed is shown in Figure 8(b), with both simulations hav-
ing the conditions MS¼ 2, MA¼ 4, and R ¼ 27:5c=xpi. For
the case of the infinite system, the high energy tail is steeper,
contains more particles, and extends to higher energies, dem-
onstrating the importance of particle escape for establishing
the shape of the spectrum in the finite sized system. This also
suggests that larger system sizes, such as may be produced in
future experiments with more energetic laser drives, may pro-
vide more favorable conditions for measuring the particle
acceleration.
To determine the influence of the numerical parameters
that are not directly matched to their laboratory values due to
computational expense, we have performed a set of simula-
tions varying these parameters in the range V0=c ¼ 0:025–0:1and mi=meZ ¼ 32� 512. A comparison of the results of these
simulations is shown in Figure 9. By the end of the simulation
at t=td ¼ 0:5, all simulations have formed a number of plas-
moids in the range 6–8 and of similar size, as shown in Figs.
9(a)–9(c). The electron energy spectra for five simulations
with different numerical parameters are given in Fig. 9(d),
showing similar indices for the power-law tails and only small
variations in the cutoff energy.
IV. EXPERIMENTAL SIGNATURES
The proposed model of particle acceleration for these sys-
tems predicts a number of important experimental signatures
FIG. 8. (a) Out-of-plane current den-
sity jz with overlaid magnetic field
lines for a transversely infinite system
simulation. (b) Comparison of the elec-
tron energy spectra for a transversely
infinite simulation and a standard finite
system simulation.
FIG. 7. Comparison of the electron energy spectra at t=td ¼ 0:25 for three
2D simulations and one 3D simulation with MS¼ 2 and MA ranging from 4
to 16.
041408-9 Totorica, Abel, and Fiuza Phys. Plasmas 24, 041408 (2017)
that could be used to identify the electrons accelerated by
reconnection. Since the electrons are accelerated along the
z-axis while being deflected by the in-plane magnetic field,
the energetic electrons should escape the system in a fan-like
profile, being emitted both in the direction of the reconnection
outflows and in the direction opposite to that of the reconnec-
tion electric field. The most energetic electrons are expected
to be those that are accelerated by the reconnection electric
field over the longest distance, which would be those that start
from the bottom of the system, are accelerated upwards, and
escape nearly vertically. When the trajectories of the 1000
most energetic electrons from a 3D simulation are plotted
(Figure 10) these features are clearly visible.
The spectra previously presented have been integrated
over all of the electrons initially in the plasma bubbles. To
create synthetic spectra similar to what might be measured
by a detector in an actual experiment, we calculate the pitch
angle of each electron’s velocity relative to the direction of
the desired detector location and keep only those particles
within a maximum acceptance angle, which we take to be
10. Figures 11(a) and 11(b) show the spectra obtained in
this way for detectors receiving electrons from the 6x direc-
tions (reconnection outflows) and the 6z directions (parallel
and antiparallel to the reconnection electric field). As
expected, the detector receiving the electrons accelerated by
the reconnection electric field shows a high energy compo-
nent in the spectrum, whereas the detector on the opposing
side does not. The detectors in the direction of the reconnec-
tion outflows show a high energy component but with fewer
particles than for the þz detector. The slight asymmetry
between the 6x detectors is likely due to the motion of the
plasmoid in the þx direction, resulting in a bump at slightly
higher energies in the spectrum for the þx detector.
Figure 11(c) shows the distribution of energetic elec-
trons with �=kBTe 15 as a function of the direction of their
velocity, parametrized by the azimuthal and polar angles hand /. This shows the expected features of energetic elec-
trons escaping vertically (h near 0) and in the reconnection
outflows (/ near 0 and 6p). The electrons escaping in the
outflows have a significant divergence of their velocity
angles, which is responsible for the lowering of the level of
energetic electrons detected by the 6x detectors compared to
the total spectrum. The typical angle of escape can be esti-
mated for an electron energy of �max=2 ¼ 1=2meV2f as
0:034 for the reduced mass ratio used in the simulation,
FIG. 9. (a)–(c) Magnitude of the mag-
netic field at t=td ¼ 0:5 for three simula-
tions with MS¼ 2, MA¼ 4, and
R=ðc=xpiÞ ¼ 26:5, but differing values
for V ¼ V0=c and M ¼ mi=meZ. (d)
Electron energy spectra at t=td ¼ 0:5 for
five simulations with MS¼ 2, MA¼ 4,
and R=½ðc=xpiÞ� ¼ 26:5, but differing
numerical parameters in the range V ¼0:025� 0:1 and M ¼ 32� 512.
FIG. 10. Energetic electron trajectories, colored by energy, plotted over an
isocontour of the magnetic field for a 3D simulation with MS¼ 2 and MA¼ 4.
041408-10 Totorica, Abel, and Fiuza Phys. Plasmas 24, 041408 (2017)
which is in reasonable agreement with Fig. 11(c). Factors
contributing to the underestimation are the intrinsic velocity diver-
gence due to the radial bubble expansion and the broadening due
to the in-plane magnetic field pulling escaping electrons away
from the x-axis and towards the bubbles. For a realistic ratio of
mi=meZ ¼ 3672 for fully ionized ions we estimate / � 0:0065,
i.e., energetic electrons escape along the outflow axis.
V. CONCLUSIONS
In summary, by means of ab initio kinetic simulations
of magnetic reconnection in laser-driven plasmas, we have
shown that these systems can accelerate nonthermal elec-
trons with sufficient energy and quantity to be detected in the
conditions of current experiments. A nonthermal component
that resembles a power-law spectrum is established as elec-
trons are accelerated by the X points for varied amounts of
time due to injection into and escape from the current layer.
For the current experimental conditions a few plasmoids
(�1� 3) can be formed, and particles trapped in the plas-
moids can be further, but slowly, accelerated due to the elec-
tric field associated with the motion of the plasmoid. For the
modeled plasma conditions we do not observe plasmoid
merging and the associated acceleration mechanisms. This
would require significantly larger plasma bubbles, which
may be produced at facilities like NIF and will be studied in
future work. These results clearly indicate that laser-driven
plasmas can play an important role in the study of particle
acceleration induced by reconnection.
ACKNOWLEDGMENTS
This work was supported by the U.S. Department of
Energy SLAC Contract No. DE-AC02-76SF00515 and by
the DOE Office of Science, Fusion Energy Sciences under
FWP 100237. The authors acknowledge the OSIRIS
Consortium, consisting of UCLA and IST (Portugal) for the
use of the OSIRIS 3.0 framework and the visXD framework.
S.T. was supported by the Department of Defense through
the NDSEG fellowship program, and by the NCSA through
the Blue Waters Graduate Fellowship program. This work
was also supported by the SLAC LDRD program and by the
NSF Grant (PICKSC), AC11339893. Simulations were run
on Mira (ALCF supported under Contract No. DE-AC02-
06CH1135) through an INCITE award, on Blue Waters, and
on the Bullet Cluster at SLAC.
FIG. 11. Synthetic spectra measured by spectrometers receiving electrons traveling in the (a) 6z directions and (b) 6x directions with a 10 acceptance angle.
(c) Distribution of velocity angle for electrons with �=kBTe 15, where h¼ 0 corresponds to the þz direction and / ¼ 0 corresponds to the þx direction.
041408-11 Totorica, Abel, and Fiuza Phys. Plasmas 24, 041408 (2017)
1E. G. Zweibel and M. Yamada, Annu. Rev. Astron. Astrophys. 47, 291
(2009).2H. Ji and W. Daughton, Phys. Plasmas 18, 111207 (2011).3A. S. Joglekar, A. G. R. Thomas, W. Fox, and A. Bhattacharjee, Phys.
Rev. Lett. 112, 105004 (2014); e-print arXiv:1507.03629v1.4J. B. Taylor, Rev. Mod. Phys. 58, 741 (1986).5M. Hoshino and Y. Lyubarsky, Space Sci. Rev. 173, 521 (2012).6F. Guo, H. Li, W. Daughton, and Y. H. Liu, Phys. Rev. Lett. 113, 155005
(2014).7L. Sironi and A. Spitkovsky, Astrophys. J. 783, L21 (2014); e-print
arXiv:1401.5471.8M. Oka, T.-D. Phan, S. Krucker, M. Fujimoto, and I. Shinohara,
Astrophys. J. 714, 915 (2010); e-print arXiv:1004.1154.9X. R. Fu, Q. M. Lu, and S. Wang, Phys. Plasmas 13, 012309 (2006).
10M. Hoshino, T. Mukai, T. Terasawa, and I. Shinohara, J. Geophys. Res.
106, 25979, doi:10.1029/2001JA900052 (2001).11J. F. Drake, M. Swisdak, H. Che, and M. A. Shay, Nature 443, 553
(2006).12J. T. Dahlin, J. F. Drake, and M. Swisdak, Phys. Plasmas 21, 092304
(2014); e-print arXiv:1406.0831.13N. F. Loureiro, A. A. Schekochihin, and S. C. Cowley, Phys. Plasmas 14,
100703 (2007); e-print arXiv:0703631 [astro-ph].14K. Nalewajko, J. Zrake, Y. Yuan, W. E. East, and R. D. Blandford,
Astrophys. J. 826, 115 (2016); e-print arXiv:1603.04850.15D. D. Ryutov, R. P. Drake, and B. A. Remington, Astrophys. J., Suppl.
Ser. 127, 465 (2000).16D. D. Ryutov, N. L. Kugland, H. S. Park, C. Plechaty, B. A. Remington,
and J. S. Ross, Plasma Phys. Controlled Fusion 54, 105021 (2012).17B. A. Remington, R. P. Drake, and D. D. Ryutov, Rev. Mod. Phys. 78, 755
(2006).18P. M. Nilson, L. Willingale, M. C. Kaluza, C. Kamperidis, S. Minardi,
M. S. Wei, P. Fernandes, M. Notley, S. Bandyopadhyay, M. Sherlock,
R. J. Kingham, M. Tatarakis, Z. Najmudin, W. Rozmus, R. G. Evans,
M. G. Haines, A. E. Dangor, and K. Krushelnick, Phys. Rev. Lett. 97,
255001 (2006).19C. K. Li, F. H. S�eguin, J. A. Frenje, J. R. Rygg, R. D. Petrasso, R. P. J.
Town, O. L. Landen, J. P. Knauer, and V. A. Smalyuk, Phys. Rev. Lett.
99, 055001 (2007).20P. M. Nilson, L. Willingale, M. C. Kaluza, C. Kamperidis, S. Minardi, M. S.
Wei, P. Fernandes, M. Notley, S. Bandyopadhyay, M. Sherlock, R. J.
Kingham, M. Tatarakis, Z. Najmudin, W. Rozmus, R. G. Evans, M. G.
Haines, A. E. Dangor, and K. Krushelnick, Phys. Plasmas 15, 092701 (2008).21L. Willingale, P. M. Nilson, M. C. Kaluza, A. E. Dangor, R. G. Evans, P.
Fernandes, M. G. Haines, C. Kamperidis, R. J. Kingham, C. P. Ridgers,
M. Sherlock, A. G. R. Thomas, M. S. Wei, Z. Najmudin, K. Krushelnick,
S. Bandyopadhyay, M. Notley, S. Minardi, M. Tatarakis, and W. Rozmus,
Phys. Plasmas 17, 043104 (2010).22J. Zhong, Y. Li, X. Wang, J. Wang, Q. Dong, C. Xiao, S. Wang, X. Liu, L.
Zhang, L. An, F. Wang, J. Zhu, Y. Gu, X. He, G. Zhao, and J. Zhang, Nat.
Phys. 6, 984 (2010).23Q. L. Dong, S. J. Wang, Q. M. Lu, C. Huang, D. W. Yuan, X. Liu, X. X.
Lin, Y. T. Li, H. G. Wei, J. Y. Zhong, J. R. Shi, S. E. Jiang, Y. K. Ding, B.
B. Jiang, K. Du, X. T. He, M. Y. Yu, C. S. Liu, S. Wang, Y. J. Tang, J. Q.
Zhu, G. Zhao, Z. M. Sheng, and J. Zhang, Phys. Rev. Lett. 108, 215001
(2012); e-print arXiv:1203.4036v1.24G. Fiksel, W. Fox, A. Bhattacharjee, D. H. Barnak, P.-Y. Chang, K.
Germaschewski, S. X. Hu, and P. M. Nilson, Phys. Rev. Lett. 113, 105003
(2014).25M. J. Rosenberg, C. K. Li, W. Fox, A. B. Zylstra, C. Stoeckl, F. H. S�eguin,
J. A. Frenje, and R. D. Petrasso, Phys. Rev. Lett. 114, 205004 (2015).26M. Rosenberg, C. Li, W. Fox, I. Igumenshchev, F. S�eguin, R. Town, J. Frenje,
C. Stoeckl, V. Glebov, and R. Petrasso, Nat. Commun. 6, 6190 (2015).27M. Yamada, R. Kulsrud, and H. Ji, Rev. Mod. Phys. 82, 603 (2010).28M. Haines, Phys. Rev. Lett. 78, 254 (1997).29J. A. Stamper, Laser Part. Beams 9, 841 (1991).30L. Gao, P. M. Nilson, I. V. Igumenshchev, M. G. Haines, D. H. Froula, R.
Betti, and D. D. Meyerhofer, Phys. Rev. Lett. 114, 215003 (2015).31R. G. Hemker, e-print arXiv:1503.00276.32R. A. Fonseca, L. O. Silva, F. S. Tsung, V. K. Decyk, W. Lu, C. Ren, W.
B. Mori, S. Deng, S. Lee, T. Katsouleas, and J. C. Adam, Lect. Notes
Comput. Sci. 2331, 342 (2002).33R. A. Fonseca, S. F. Martins, L. O. Silva, J. W. Tonge, F. S. Tsung, and
W. B. Mori, Plasma Phys. Controlled Fusion 50, 124034 (2008); e-print
arXiv:0810.2460.34R. A. Fonseca, J. Vieira, F. Fiuza, A. Davidson, F. S. Tsung, W. B. Mori,
and L. O. Silva, Plasma Phys. Controlled Fusion 55, 124011 (2013);
e-print arXiv:1310.0930.35S. R. Totorica, T. Abel, and F. Fiuza, Phys. Rev. Lett. 116, 095003 (2016);
e-print arXiv:1601.05845.36J. M. Dawson, Rev. Mod. Phys. 55, 403 (1983).37T. Takizuka and H. Abe, J. Comput. Phys. 25, 205 (1977).38K. Nanbu and S. Yonemura, J. Comput. Phys. 145, 639 (1998).39D. D. Ryutov, N. L. Kugland, M. C. Levy, C. Plechaty, J. S. Ross, and H.
S. Park, Phys. Plasmas 20, 032703 (2013).40W. Fox, A. Bhattacharjee, and K. Germaschewski, Phys. Rev. Lett. 106,
215003 (2011); e-print arXiv:1104.0605.41W. Fox, A. Bhattacharjee, and K. Germaschewski, Phys. Plasmas 19,
056309 (2012).42S. Lu, Q. Lu, Q. Dong, C. Huang, S. Wang, J. Zhu, Z. Sheng, and J.
Zhang, Phys. Plasmas 20, 112110 (2013).43S. Lu, Q. Lu, C. Huang, Q. Dong, J. Zhu, Z. Sheng, S. Wang, and J.
Zhang, New J. Phys. 16, 083021 (2014).44K. M. Schoeffler, N. F. Loureiro, R. A. Fonseca, and L. O. Silva, Phys.
Rev. Lett. 112, 175001 (2014).45K. M. Schoeffler, N. F. Loureiro, R. A. Fonseca, and L. O. Silva, Phys.
Plasmas 23, 056304 (2016).46J.-L. Vay, J. Comput. Phys. 165, 511 (2000).47P. L. Pritchett, J. Geophys. Res.: Space Phys. 106, 3783, doi:10.1029/
1999JA001006 (2001).48P. L. Pritchett, F. V. Coroniti, R. Pellat, and H. Karimabadi, J. Geophys.