ELSEVIER Powder Technology 96 ( i 998) i 48-157 . . . . . . .
P cle normM stress distribution around a rising bubble in a fluidized bed
Masayuki Horio, Yuki lwadate *, Tomoki Sugaya I)epclrlment ¢!t'Chemical I':ngitteeriplg, Tokyo U~ffversiB' of Agricuhure and Technology. Kogam'i. Tokyo 184. ,lal~an
Received 19 May ItY)7; revi.~ed 20 August Iqq7; accepted 30 September 1997
Keywords: Particle pressure: Fluidized beds: Single huhhlc: Analytical ,,,~duli~m
I. Introduction
The behaviour of solids in a fluidizcd bed has been rec- ognized as significant and critical for reliability, improve- ments and new developments ot" Iluidized.bed processes, Some typical examples arc prevention of particle attrition in catalytic processes, elimination el" defluidization and control of agglomeration in combustion, incineration, gasification and materials processing, Some important areas ol" materials p ~ s s i n g include olelin polymerization, silicon chemical vapour deposition (CVD), spnw granulation and/or pressure swing granulation [ I I, Erosion of immersed structures such as heat-transfer tubes is also closely related to solids motion in the bed,
The i~,~ue of solids behaviour is a signiticanl I'undamcnlal research problem in the science of fluidization. More specil: ically, a rational expression for the particle stress tensor has been a central problem in the direct numerical simulation of fluidized beds, However, the progress oFour scientilic knowl- edge concerning the particle-stress issues has been made quite slowly over decades, As is widely known, the solid motion in a bubbling fluidiz~ bed is mainly induced by bubbles, During the 1960s the mechanistic description of fluidized beds in terms of bubble hydrodynamics showed good pro-
gress with the initiatives of Davidson 12 I. Nevertheless. the particle-stress issue was not considered by Davidson 12l because his concern was mainly focused on the .gas exchange into tile emulsion phase. Davidson and Harrison 131 solved t'or total pressure (P=p, +p~,) along the bubble axis. The t|leoretical pressure Ih and total pressure P distribution above a spherical bubble have been shown graphically. However, part ic le pressu re wa,~ not show n separate l y. Furthermore, they pointed out that "the graphs (o1" Pt and P) show remarkable similarity at intermediate values, showing that pp, the inter- particle pressure, is small at all points on the axis above the bubble', This is in fact no! correct, because as shown later in this paper, both "'hanges in i}t and p, caused by the passage of a bubble are of the same order of magnitude.
Assuming a potential Ilow for particles as a continuum and D'An:y flow Ior interstitial gases, Davidson 12 ] derived a set of solutions for gas and solid flow lields. The gas-pressure lield predicted by the Davidson model was examined and mostly conlirmed hy Reuter 141, Stewart 151 and Littman and Homolka 16 I.
The motion of Iluidized solids was investigated in the light of the potential flow theory in the 1960s (¢.f. Collins 17], Toei et al. 18] and others). It has been found that the drift motion of solids can be fairly explained by the assumption of potential flow. However, the term for particle stress was not taken into consideration except by Stewart and Davidson [ 9 ] for two-dimensional slugging fluidization. They just pre-
M. Hnrin el ed. / Pnwdt, r Technnh~g)" 96 f199,~j 14~i-157 149
sented approximate solutions for both gas and particle pres- sures. Based on computation, they showed the presence of a negative particle-pressure region above a gas slug. Also, they found a positive particle-pressure region on the column wall close to the slug. They further discussed the negative particle pressure and bed expansion, but their arguments were focused only on the upper half of the region around the gas slug. Furthermore, no direct measurement on solid pressure was conducted. Rietema 110l pointed out the importance of solid-solid interaction in a fluidized bed and proposed to apply the soil mechanics approach to the problem. His sug- gestion, however, was too early because even the rigorous tbrmulation of dense particle-ituid systems was just about to be constructed at that time.
Instead ot' Davidson's approximate two-fluid formttlation. Anderson and Jackson [ I I ] rigorously derived a set t.,l' two- Iluid equations starting from the continuity equation Ibr ,~as. the Navier~Stokes equation and the equation el' motion Ior particles. In the 1970s the direct numerical simulation of a Iluidized bed wits attempted by S ~ Ltd. (e.g.. Pritchet el al. [121) where the empirical expression el" Rietema and Musters I 131 was adopted I'or the constitutiotl equation.
A constitutkm equation based on kinetic theory was a new paradigm el" the 1980s in the numerical simulation circle. Based on the early theoretical work by Bagnold 1141 and/or Chapman and Cowling [ 15 ] and introducing a closure equa- lion for 'granular temperature'. Ding and Gidaspow l l61 performed a numerical simulation of bubbling Iluidized beds. However. their model cannot reproduce realistic bubble shape but produces bubbles with a pointed nose. Furthermore. the present kinetic-theory approach has difficulty in handling the boundary between iluidizcd and delluidized zones. A lurther dilliculty comrnon to the two-Ituid rnodels is thai the derivation of the constitution equation for different particles requires complicated stochastic mechanical analysis or tedi- ous experiments for developing empirical correlations. In this respect, the discrete element model ( DEM ) of Iluidized beds proposed by Tsuji el al. I 17 I. based on the soil-sphere model. is easy to access experimentally. Mikami el al. I ! 81 recently demonstrated that with an extension el' the DEM the wet particle behaviour can be well simulated.
In accordance with the recent theom'elical developments. experimental measurements of particle normal stress :rod tan- gential stress have been attempted. Campbell and Wang I 19] measured the particle normal stress on the wall of a bed of Geldart group B particles and found that with the increasing gas velocity the particle normal stress decreases in the non- fluidized conditions, reaching a minimum value and then increasing again due to the increased particle iluctuation asso- ciated with bubbling. Polashenski and Chen 1201 conducted similar experiments but with a smaller probe and with Geldar! group A, B and D particles, and found that in a honlogene- ously fluidized bed of group A particles the particle pressure remains at the minimum value. From the observed normal particle stress they estimated solids viscosity by utilizing the kinetic-theory expressions. However. the predicted solids vis-
cosily was an order of magnitude smaller than the experi- mental values so far obtained directly by different authors. Rathbone et ai. 1211 measured both tangential and normal particle slresses and panicle velocity on the surface of an immersed tube. Although they discussed the effect of bubble approach and bubble coalescence, no precise data on the effect of individual bubbles were presented.
In the recent reviews on the present issue. Cliff 122] pointed out the difficulty of the 'thermalization' closure with the energy equation tbr *granular temperature'. Jackson [ 23 ] sounds as il' he did not know of the work of Campbell and Wang [ 19 ] and says that the particle-pressure measurements would be difficult. Here, it must be pointed out that the par- title-pressure measurement was done much earlier by Horio el al. J241 to obtain its el'l~ct on horizontal .jet penetration. On the other hand. measurements of forces acting on individ- ual particles were done by Kono el al. 125 I. who used tracer parlicles el" difl'erenl strengths known in advance and sam- pling ti~cn| al'tcr sorne period of fluidization. They also dis- cussed the relationship between pressure Iluctuation and tl'|c kinetic I'orce acting on particles, Campbell and Wang 1191 also I'ound a relationship between their average particle pres- sure :rod the mean bubble size at corresponding heidus in the bed.
All the above evidence indicates the research need for a more precise approach to the particle-stress issue in connec- lion with the fundaniental behaviour of bubbles in fluidizvd beds. Accordingly. the present paper intends to investigate theoretically with experimental validation on
{ I } the elTecI oJ o. single bubble on panicle pressure in a l|uidized bed. and
(2) a rnore realislic syslern that takes inlo accotlnt the essential features and concepts of the Davidson model along with solid pressure.
Our viewpoin! on item (2! above is that Ihe i)avidson model is sul'liciently realistic. Nguyen el al. 1261 experimerJ- tally conlirmed thai the Davidson model can predict even the gas velocity in a bubble accurately. Accordingly. the solids viscosity p, is neglected so that we can separate the tangential stress el'l'ecl I'rom the nornlal stress for l'uture discussions.
2. T h e o r e t i c a l ana lys i s
2. h Gm'erning eqm, hms.l'nr a steady rising mnli~,l ¢?l'tl single bubble in isnh~linn
The governing equations of the two-ituid model derived by Anderson and Jackson I II I are given as tbllows:
Iluid ccmtinuily equ,'ttion:
oe + d i v ( e d ) () ( I ) a0
parlicle continuity equation:
a( I - e......_~} + divl ( I - e)F] =l) (2)
150 M. Horio et aL /Powth'r Technology 96 (1998) 148-157
fluid momentum equation:
+ ( if- grad) = - p ~ . g - egradp - /~
particle momentum equation:
n,: = - ( 1 - e)gradp
(3)
-pp( I-~)~, + R + V.P, ( 4 )
where p is the fluid pressure and P, the particle stress tensor. The acceleration vector of gravit} ff is defined with the gravity potential q ~ as
,~e (0 . 0. ,tt) ~ gradq~,, ( 5 )
Since the gas-solid interaction term/~ in Eqs. ( 3 ) and ( 4 ) is a functkm of voida~e e mid relative velocity ( i f - i:), we can wri te
/¢= e/J(e, ta~= :1 )(t~= t") (7)
Here, let us introduce the l'ollowing assumptions lbr a single bubble equivalent to the Davidson modeh
( I ) A spherical (3D) or circular (2D) bubble is rising steadily in complete isolation.
(2) The particle viscosity #, is negligible and the particle stress ten.,,or, P,. is given as
- p . 0 1) P, = O - I ) , () ' ( 8 )
() () = p .
Accordingly, we can write
T , t), ~ = grad/), ( 9 )
( 3 ) The motion ot' the particle phase is irrotational, and
I I ( r', grad ) : ~ "~gead IF]" + i '~ x (8 = ~grad I : l " ( I 0 )
I,) ,s=,
! 4 ) The voidage in the particulate phase is assumed at e,,,,. the voidage at minimum lluidization condition.
Then the momentum ~uations expressed by a coordinate system moving with the bubble locating it~ origin at the centre of the bubble reduce to Ihe following:
grind/) = = )6( i f - i") ( I I )
g r a d / ~ 1:1: +1, + 1,,( I--e,,,, )g: +1 , ,1 - , () (12)
By integrat ing Eq. ( 12 ):
f i : I - e'"r) ' l : l~" + P + Or( I - e , , , )g : +1)~ =cons t . ( I ' ~ ' )
if= (0, O, u,.,./%,r)
:= (0. O, - u h ~ )
p = O at r=Rh
and
p~=O at r = ~
at r = ~ (13)
at r = ~ (14)
(15)
( 1 6 )
where uh~ is the rising velocity of a single isolated bubble of diameter Dr. expressed by
= 1 0 . 5 0 ~ ( f o r 2D)
"""-lO.Ti (for 3D) ( 1 7 )
2.2. Solution.for partich, pressure p,
From Davidson and Harrison's solutions [ 3] I'or r, and e, listed in Append=x A, we obtain I'or a 2D bubble
Ir"l : = I',~ + t',; ~ = u~;~.. I + ~_RI;; .~ cos2 ( for 21) ) ( 18 ) Z ,4 l , ~
Since at r - -* ~ we have grad I : l 2 ._., 0 and p, ---. O. Eqs. ( I I ) and ( 12 ) reduce to the fo l l ow ing :
/=~ I l m l - grad/; = pet I - ,~,,,t ),q = ~ ( 19 )
Subst i tu t ing Eqs. ( A I ) and ( 18 ) in Eel. ( 12' ). we obtain:
p. = pp( I - e,,,; ),q r - . c o s 0 - p. ( I - e,,. )
x + R,: g= I + r ~ - 2 cos21 + consl.
( f o r 2D) ( 2 0 )
Fur thermore, app ly ing Eq. ( 17 ) t'ur u~ .... and tak ing into account boundary condition (16), we have
IL = - .~ c o s O - ~ . - ~ cos2 ( for 2D ) ( 2 I - I )
Through the same procedure, we oblair l the fo l l ow ing expres- sion for a 3D bubble:
. :' ,{÷ /L = - - ~ c o s 0 - : ( I - 3cos:0) } + ~ ( I + 3cos:0)
(for 3D) (21-2)
where i i, and ~are dimensionless particle pressure and dimen- siunless radius, respectively, defined by
I i, = !)~ p~,( I - e,,,r)gRb ( 22 )
Boundary conditions for a bubble of diameter Dh = 2Rh rising at a velocity u~ are
r
"~= R'~b (23)
M. Horio et al. / Powder Tecimology 96 ¢ 19981 148-157 151
To obtain Eq. ( 2 !-2) u.~ ---0.7 l"-gD. -- gR,, was assumed. Accordingly, the zero-particle-pressure contour can be
determined by
cos#= I+ I + ~ + (for2D) (24-I)
3(4 , -~-4'4 l) [ l + ~ l 3 ~ 5 ] cos/9= _ - i - -~ + (Ibr 3D)
( 24-2 )
On the bubble surface !~. dl~/dO and d2fiJdO ~ and are expressed by the lbllowing:
, I I /~ I,.~ ~, = ~ cos20- cos0 - ~, (for 2D) (25-1)
dfi~ I =-s in2O+sinO, (Ibr2D) (26-11 dO I,,:~.h,,,
d ~-fi, i
[ = - 2cos20+ cos#. ( for 2D) ( 27- I ) d(F , :~/,,,,
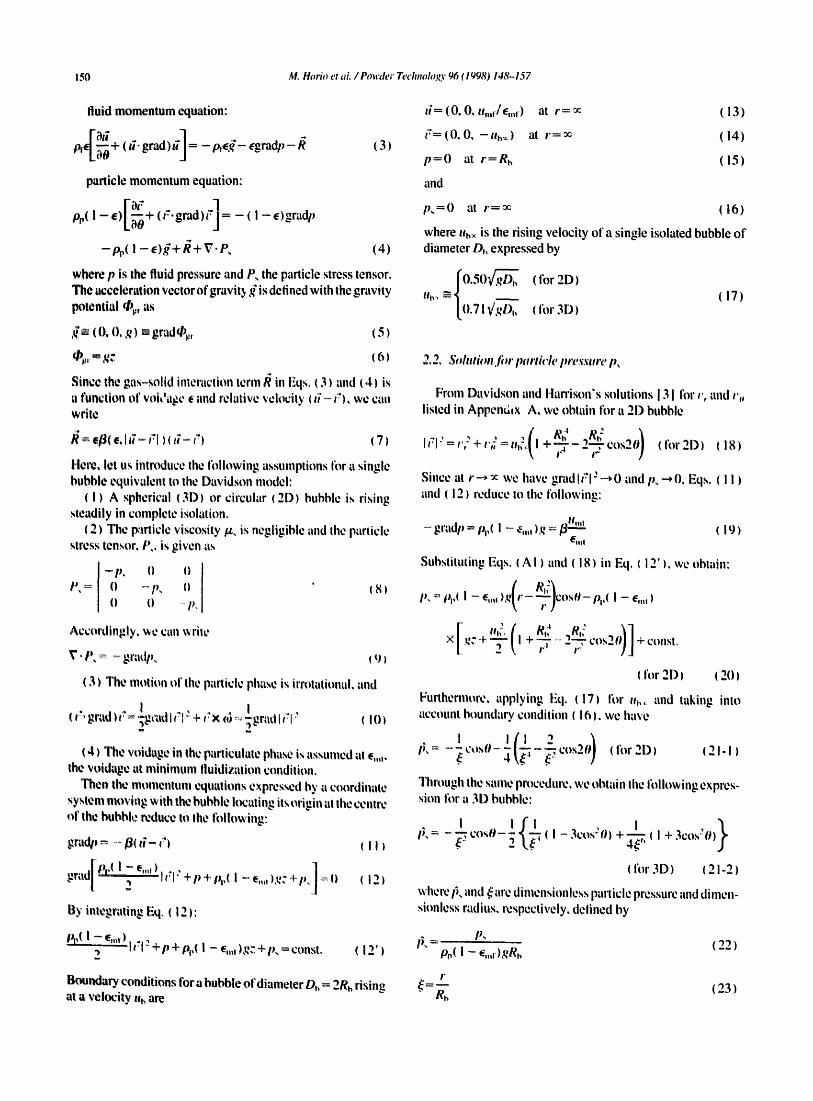
From tile above expresi.;ions we obtain Table I and Fig. i for the variation ofl~, with 0 on the bubble surface. Thus, p, = 0 at 0=20. /3 (2D) and 0=2.01 (3D).anddpJd#=Oat O=0, ~'/3 and 0. (2D) and O= O, I. I ! and 0. (3D). The maximum compression stress and the maximum expansion stress are obtained as #,.,.,,~.,.,,,,.~,., = 5/4 at O= rr (2D) and 3/2 at O= zr (3D), and I~,..,,,~.¢~p,.,,,,,. = - i at O= zr/3 (2D) and -0 .843 at O= I.II (3D).
Theoretical predictions of particle pressure around a bub- ble for both 2D and 3D beds are shown in Fig. 2. Here. it is interesting to note that at about O= 20"/3 fronl the bubble nose the particle pressure becon|es zero. This may be the
Table I Variation o1' dl~,/d0, d:l),ldO: and i ~, will) 0 on the bubble surf:|¢e: (a) lwo- ditnensional bubble: (b) three-dimensional bubble
(a)
0 0 0.068 rd3 2rd3
a~#dO 0 - 0 +
" , o + . , +
'~s -3 /4 - -1 0
(b) -i 2 0 0.597 1.11 2.01 ]
dPdde 0 - 0 + d~dde' "~ 0 ~ + J +
Ps -1/2 - -0.847 0
J
J
2.21 n
+ 0
0 ~ -
+ 5/4
2.22 n
+ 0 0 t " + 3/4
, , , , , , ,
2
5141L~ 1
0.5 "7" g. o
-0.5
-1
-1.5 ' ~ 4 r,/2 3rd4 z (a) O[rad]
2 ,
_ , o.5
" 0 . 8 4 3 ~ ~ J ! " ' [ ~/1.';'1 :/2.01
' 0 rd4 rd2 3~4 (b) e[rad]
Fig. I. I,)islrihulion , f ! ), on the buhble sul'l',ce: Ill) 21)htd~ble. (b) 31) huhhle.
reason why real bubbles have a kidney shape and at an angle of nearly 20./3. When 0> 2rr/3 fora 2D bubble and O> 2.01 tor a 3D bubble, the particle pressure increases and shows a maximum value at the bubble bottom, it may be worth noting here that with the presence of a wake high particle pressure around the bubble bottom can be compensated. The maxi- mum value of the dimensionless particle pressure is 5/4 Ibr a 2D bubble and 3/2 for a 3D bubble, in other words, particle compression creates a normal stress roughly equivalent to the vertical pressure drop of the bed over a bubble radius.
Oi1 the other hand, a negative particle pressure exists in the upper region of a bubble. The maximum absolute value of the negative pressure is - I lbr a 2D bubble and - 0.843 for a 3D bubble. The negative dimensionless pressure may indi- cate the limitation of the constant-voidage assumption of the present analysis. Nevertheless. the larger negative value ot'#, above a bubble can be understood to correspond to the higher potential of bed expansion. Moreover. if the bed voidage is maintained at e,., by particle cohesion force, tile negative pressure obtained above would really exist.
The high particle pressure below a bubble was already indicated by the high granular temperature in the bubble wake in numerical simulation results 118.271. However. most of the previous theoretical findings on particle behaviour around a bubble were focused on its upper region. As investigated by Jackson 128 ! lbr a spherical bubble and recently by Gera and Gautam 1291 for an ellipsoidal 2D bubble, by Lockett and Harrison 1301. Leung and Sandlbrd 13 i 1, Yates et al. [ 32 ] e 2erimentally and Buyevich et al. 133 ] Ibr.a 3D sphero ical bubble, bed expansion takes pl,ace right above a bubble. Buvevich 134 ] derived the granular temper.',ure distribution in the upper expanded region taking into account particle and
152 M. Horio el al, / Powder TeclmohJ,~y 96 f 19981 148-157
fluid fluctu;itions. It may be noted that the present classical I)Crl'ormed to measur~ particle pressure directly for a single hydrodynamic appn)ach was not noliced for a long period, risi,g bubble in a 3D Iluidized bed.
3, Experimentul validation 3. I. Partich'-pressure probe
To validate the alx)ve theoretical result for the particle- pressure distribution aix)und a bubble, an experimcm was
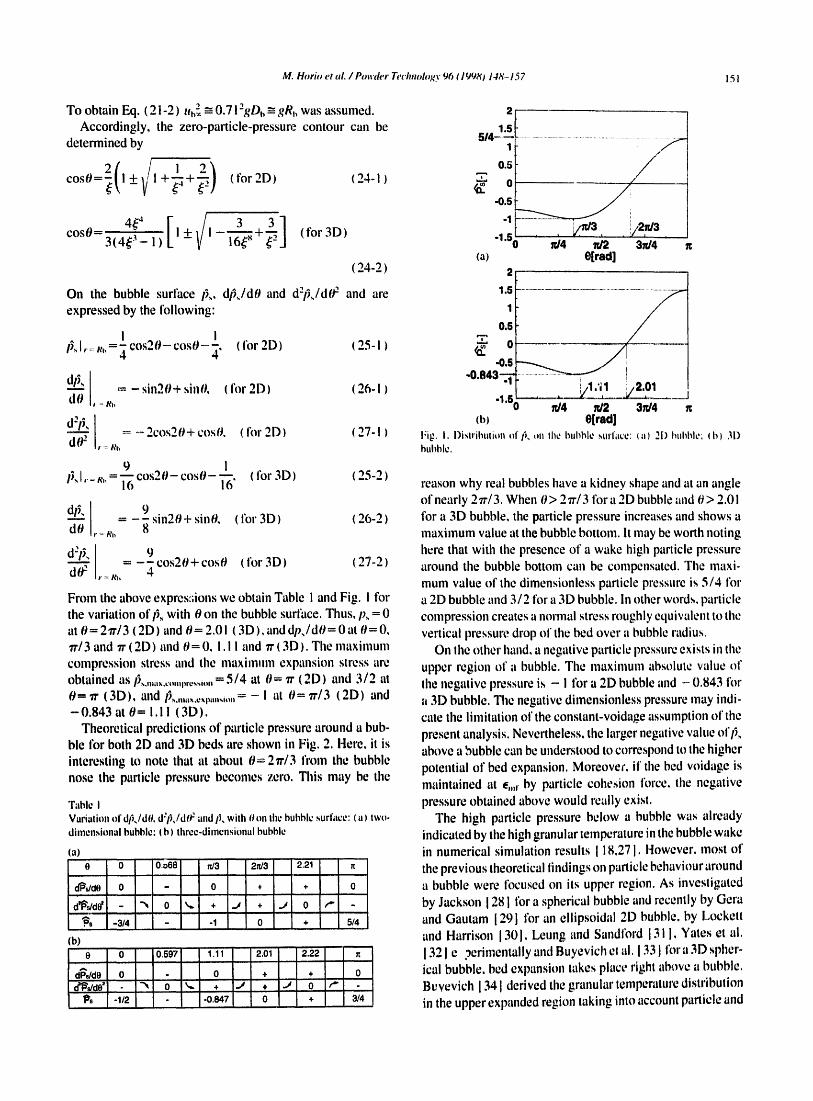
Fig. 3 shows (a) a photograph of the fn)nt view of the probe. (b) a photograph of th(; probe back plate and the
(a)
. . . . . . . I
1
J •
• ' ~mm (f 11
(c) 3 4 (d) 7 (e) F;g. 3, ~a.,,- and I '~ni¢le-prcs~re prol~.,: I a) pn)l)e fronl: (b) probe hack plate (left) and diaphragm wilh strain-gauge ,,,ensor~ as viewed from inside the c "haml~r ( righ!); ( c ) lh)nl-side elevation: (d) rear-side elevation: ( e t side devation: (f) details o f gas-pressure probe, t I ) Diaphragm. ( 2 ) air hole for Ivalancing. i o p ~ , d ) . | 3) stainless gauze. ! 4) strain gauges. (5) front llange. ! 6) chamber Ilange. (7) back cover. (8) air hole lbr calibration (clo.'~,d), (9) s "haft. ( IO~, plasuc" " "" g.as-pressure" " probe. ( I I l air hole for static gas pressure: all components except for ( IO ) were made of SUS304 stainless sled.
M. Horio el aL / Powder Technology 96 ~ 19~8J 148-157 153
1. PMMA |luidized bed column 2. fluidized bed at minimum
U ~umm Fig. 4. Schematic of Iluidized-bed apparatus,
. . . . . .
6 7
it [ /is .i..I ® ®1
• ql •
"'~ (b) r ...... ~ i '~ . . . . . . . " I .
I
' / 6
3
(c) .... 71 r~gg 4 1
Fig. 5. Probe modilicat,on Ibr calibration by gas pressure: (a) fi'ont-side elevation: (b) rear-side elevation: (c) side elevation, ( I ) Diaphragm. (2) air hole for balancing ( closed ). ( 3 ) stainless gauze. ( 4 ) .strain gauges. ( 5 ) air hole for calibration ( opened ), ( 6 ) gas-pressure probe. ( 7 ) plastic tube Io the atmo,~pherc,
2,500| 2,000~ 1,500f P=1.12XV ........ /
°o-'~ . o " 4oo eoo " eoo '~,~00'~,~;0o'~,i00 v[mv]
Fig. 6, Calibralion of particle-pressure probe.
diaphragm with strain gauges as viewed from the right inner side of the chamber and (c) - ( f ) the details of the particle- pressure probe designed and made for the present study. The probe consistcd of a diaphragm sensing part made of 60 p,m thick stainless-~t~el toil (SUS304, CSP-H). The diaphragm was fixed between a 2 mm thick stainless-steel front flange and I mm thick chamber flange. The back plate was a I mm thick stainless-steel plate. A shaft where the leads of strain gauges were passed was attached to the square section. Four strain gauges were put on the diaphragm, i.e., two at the centre and the other two at the opposite edges connected to tbrm a Wheatstone bridge circuit.
To eliminate the gas-pressure effect by balancing the gas pressure inside and outside of the chamber, two holes of 0.5 mm I.D. were provided at the same height from the centre of the diaphragm. The gas-pressure probe was made of a plastic tube of ! mm I.D. A side hole of i mm diameter was drilled and then covered with 300 mesh (84.7 p.m opening) stain- less-steel gauze. The gas pressure was sensed by a solid-state pressure sensor ($enSym, 142SC05D).
Fig. 4 illustrates the fluidized bed, the bubble-injection system, the pressure probe and the data-recording system, The bed diameter was 196 mm I.D. Glass beads of mean diameter 162 ~m ( u,,,= 0.0224 m s- ~ ) were fluidized by air at ambient conditions.
For the calibration of the particle-pressure probe, gas pres- sure was measured by both the particle-pressure probe and the gas-pressure probe. Fig. 5 shows the set-up ot'the particle- pressure probe for calibration. The two front holes to balance the gas-pressure effect were closed with small pieces of steel wires and plastic glue. in order to measure the gas-pressure differential with respect to atmosphere, a hole of 0.5 mm diameter was ope,~ed at the centre of the back cover to which a plastic tube of I mm I.D. leading to the atmosphere was
154 M. Horio el a L / Pow+h'r Technology 96 f 1998) 148-157
E
(a)
2,000
1,SOl!
1,000
SO0
e time[=]
4,~+ ii
, =
(b) = o ~s ~ ~.s time[g]
Iq~,, 7. Comparison of dyllanlic dntra~:teristic.~ ,)/particle-pre.,,sure probe with gas-pressure probe by gas-i)ressure measurement: ( a ) p~lrti¢le=l~rc~ure probe with side hole plut~l~ed for ga~qvessure Illeasuremem; ( b ) gas-pre~,- ,~ure proh~,
connected, "; he gas pressure was changed by wtrying the gas velociw from zero to a certain value but less than the mini- mum fluidization velocity. Fig. 6 shows the calibration line for the panicle-pressure probe showing a satisfactory linear relationship between output voltage and particle pressure.
The transient gas-pressure change when a bubble was injected into the bed was measured by both the particle- pressure probe with the particle protection gauze and the gas- pressure probe. This enabled the dynamic characteristics of the particle-pressure probe to be tested. Fig. 7 shows an exam pie of the re,+ponses tYom the two probes. The major pressure wave associated with the bubble iltjection and its passage were also detected correctly hy the particle probe. 1"here wa,,, only one n l o m e n t after the bubble passage wl:en the gas- probe signal was slower than Ihat of the particle pa)be. This may be due to the particle probe, which had a Ilat, large and simple surface, But the gas probe at the back of the particle pro~ created a slightly complicated structure and the parti- cles at the bubble bottom were less aerated and hence some tt~)k time to tbllow the bubble nmtion,
The details of experimental condition,~ are summarized in Table 2.
3, 2. R,,suhs and ,list'++ssion
As demonstrated by Reuter 14 l. the gas pressure in the wake detected |)y a probe lixed at a height remain,~ constant. Fig. 8 illustrates the probable gas- and particle-pressure dis- tributi(ms around a bubble accompanied by a wake.
Fig, 9 shows an example of the set of gas- and particle- pressure data for single-bubble passage detected by the probe, the centre of which was located at 0,3 I0 in above the distrib- utor, and at 0280 m above the injection nozzle outlet. Here, ,~tion a corresponds to the pressure wave caused by bubble in, k'ction from the nozzle, section b to the bubble and section c to the wake, From the rate of decreasing pressure dpIdt in
Table 2 Experimental conditions
Bed materials glass heads dp= 125-177 I o.ml p,, = 2.52 X 16 I kg m ~l u,,,, = 0.0224 I m s i I
Fluidizing gas compressed air, ambient temp. and pressure th) =O,O2OO l m s I]
Injected bubble volume Vh = 2.25 X I0-' I m~l
o ....... ' i! -R' I ............................................. ~-~
- 0 + - 0 + gee pressure particle pressure
Fig, 8. Probable ga~- and patlicle-pre,~,~ure distributions arouml a I)nbble accompanied by a wake.
i'ig. 9. I:xalnple ol gas- and particle-pressure oulpul~ ;,11 J :~l ' l r , ' r l l lJ ' l ; , l iOIl OJ' huhhh., ,,i/e, velocity and v, ake h.,ugth I'rtml gas-i)re,,,.,,ure U;di,~i¢111,
section b of the response, the bubble rise velocity can be obtained as
u,,. = ( d p I d t ) I ( dp ld : ) , , , , .,,,, (28)
The bubble length I,, pierced by the probe is then obtained using the period. A t , of section b as
/i, - u,, oAt,, (29)
On tile other haud. tile volume of a bubble VI, was experi- mentally determined by injecting the air into water. The bub- ble volume V, Ibr the present experiment was determined to be 3.35 x 10 • .sm'. from which we have Dh =4.00 X 1 0 " m. The value of uh, determined from the data of Fig. 9 is 0.417 m s I and the corresponding value of D, determined from Eq. (17) is 3.52 x I 0--" m. The pierced wake period obtained from Fig. 9 is 4.76 X 10⁻² s and the corresponding wake length is i .98 x ! 0- ~ m. Assuming that the wake fraction.t,,
M. Horio el al. /Pon'&,r Teclmoh,g.v 96 ¢ 199,~j 14~--157 155
2
1.5
1
"~" 0.5
0
-0.5
"1~
~,;B P" pp(1-Zmt)gFle
bubble ̧
........ e' : theoretical (moving average over probe diameter)
I
~ a : theoretic~ ' ~ ' - " I
bubble A wake
I . . . i . i I , i , i I
-3 -2 -1 0 1 2 3 4 ~,[-]
Fig. I0. Comparison of experimental and theorelical particle pressures.
is I/3, we obtain D~,', the diameter el'bubble sphere including the wake, as
D,,' = ( I +,I',, )~/~Dt, = I, IOD,, = 3,87 X 1 0 : m (30)
This agrees well with the sum ot' tile bubble length and tile wake length, i.e., It, +/,, = 2.98 × l 0 -~ + 1.98 × I 0 : = 4,96 × 10- -~ m. Accordingly, the present bubble data are con- firmed to be reasonable and also realistic.
Section d in Fig. 9 is the particle pressure lbr the bed very close to minimunl fluidization. Even in the minimum-fluidi- zation condition there exist certain particle collisions as already indicated by data from Campbell and Wang 119]. in the following comparison of our experimental data with the Iheory, the zero-particle-pressure level around the bubble was set at the average value in section d (Fig. 9).
The measured particle pressure was divided by ( I -e,, , , .)p~,gDh'/2 and compared with the theoretical value ill Fig. 10. Since the probe has a diaphragnl section of a finite size, the observed particle pressure is not exactly a local one
but an average value. The dotted line in Fig. I0 indicates such a moving average value ()f the theoretical prediction. Except for the bubble edge area there is not much difference between the moving average and original theoretical value. In Fig. 10 the negative particle pressure above the bubble should be due to the bed expansion. In the case of sticky panicles, the bias of particle pressure (cf. section d in Fig. 9) az u. = ,,,, (dry particles) should disappear and accordingly the real negative particle pressure would be created.
Further comparisons of tile theozetical and experimental value are found in Fig. i] for two other runs. The baseline for particle pressure was adjusted so that the initial particle pressure before bubble injection was zero. A fair agreement can be found between tile experimental data and tile theoret- ical prediction. Particularly, the peak value, which is quite important ctmcen'ning attrition or ag~domeration, is as high as theoretically predicted and the time constant for Ihe decaying part o1' particle pressure al/er tile bubble passage is almost tile same. However, there is a slight phase shift and the offset of tile steady particle pressure after tile event, which indicates that the bed shrank slightly. The simple model developed in the present paper has thus been proved valid by exl~eriment.~..
4. Conclusions
Tile nonTlal particle-sttvss distr ibut ion around an isolated Davidson's bubble was predicted analytically. At about O= 2~'/3 f rom the bubble nose in 2D bubbles and about 2.01 in 3D bubbles the particle pressure reaches zero. in the region right below tile bubble ~ high particle-pressure region exists. At tile bot tom of tile bubble tile i l laxirntul l i'~article pres- sure is as Il i~h a,~ (5 /4)pp( I -e , , , , )gRh ror a 21 )bubb le
bubble B bubble C
ooo i lll ,o I I: 0o ,,.or
~ 1'000[ gee pressure I I d~p~dt-'i4"41X10a[P~'s)i [1 , ,000 [ ,p : : , : r , : , , , , u r l l ~ , . , , ~ t . . . e . .X . ,O , Zp,,,: I 1'337'z:::/= -- ,L , , ,, . . . . . " . . . . : .-:~:
! pe.acle lilly I ,oo t
O ~ 0 0.2 0.4 0.8 o.e 1 1.2 1.4 1.6 1.8 2 t ime [e]
2 bubble iwake ....
1 ;
o.s
o 7' ......... ~ ........ ~ - , ~ ~ 1 1 4),5
.14 " .~ . . . . . . . . . . . . . . 0 2 4 ~[-]
,,,"% . . . . .
,4 .2 ~[-]
Fig. I I. Further examples of ¢Oml'Y;.lrison.
time [s]
t ut le weke ' "
/
i .
" 2 4
156 M, Horio er aL /Powder Tectmoh~gy 96 (1998) 148-157
and (3/2)pp( I -~,,,r)gRb for a 3D bubble. Right above the bubble there exists a negative particle-pressure region, the maximum absolute value of which is as high as ( - ! )pp- ( I - e , . r )gRs for a 2D bubble and ( - 0.843)pt,( I - e . , r )gRb for a 3D bubble. The negative particle pressure may indicate the potential of ~ expansion, in order to validate the above p~icf ions , a particle-pressure probe was developed. The vertical distribution of the particle pressure around a bubble detemfined by the probe agreed fairly well with the model prediction. ~ simple classical hydrodynamic description thus tbund would be valuable in describing the panicle-com- pression stress as well as the bed-expansion stress for further de:~ript~on of particle attrition and agglomeration,
5. List o f s y m b o l s
Dh'
g
I,,
P I},
I } , I ) I01
F
Rh
ff
l ib
tlu~l
V
3:
C
panicle diameter (i!) ) diameter of enveloping bubble sphere/circle ( i n ) equivaleut spheri~:al bubble diameter ( m ) wake t'ri¢tion ( - ) acceleration due to gravi ty ( m s -' ) acceleration vector o f gravi ty ( m s - " ) bubble length ( m )
wake length ( m )
gas pressure (Pa) particle pressure (Pa) dimensionless panicle pressure ( - ) total pressure (Pa) radiat coordinate ( m ) gas=solid interaction ternl ( kg nl "s ") bubble radius (nil l ime ( ~ ) gas velo~:ily vector t in ,s ~) r ising velt~:ily of a bubble ( m s ~ ) rising vek~ity of a single isolated bubble ( In s i) minimum lluidization vek~ily ( m s ' ) particle veltr:ity vector ( m s ' t radial component ol' panicle velocity ( m s i t angular component o f particle v e h ~ i l y ( ill ~ i )
output signal Ih~11~ probes ( mV volume o1" one bubble ( m ~ I vertical c~)rdinate ! m ) height Ibm1 the distributor plate, horizuntal c(~wdinale ( nl t
(;r~,~,k letters
..~th
o
gas=solid lunction c ~ t l i c i e n t ,, kg m ' s time length ot" a bubble ( s bed voidage ( - ) bed voidage at minimum Iluidization ( - ) gravity potential ( nr" s ~-" ) solid viscosity ( Pa s) angular coordinate ( tad ) gas density ( kg m - 3 )
Pp o~
particle density (kg m- 3) vorticity vector { m s- ' ) dimensionless radius ( - )
A c k n o w l e d g e m e n t s
The authors thank Dr Hidehiro Kamiya for his kind advice and discussions.
Appendix A
Davidson and Harrison's 13] solutions I'or p. r,. and r , in a 2D bed are written ;is fol lows:
gas pressure:
h h p = - ~ r - o s O = - pp( I - e,,,I )g r - cos0
~'¢uII \ "
IAI)
radial component of panicle velocity:
h r , = - u , , ~ I - . cos0 (A21
angular component of particle velocity:
(5) r,0= - u,,. I + sin0 ~ A3)
References
I I I K. Nb, hii. Y. Ituh, N. Kawal, ami aud M. Horiu, Powder T~dmolu~y, 24 ~ 19~31 I.
121 J,F, I)avidsou, Trans. hlsln, f~'h¢ln, Lllgrs,, ?p) ! ly(+I I 2311. I ]1 J,F. I)a~idsou and D. Harrisun. Fluidized Parlicles, Cmnhridge
Umversity Press, Loudun, ItJ63. t 41 H. Reuler, ('heroic Ing. I'¢chu., 35 ( 19h31 ~)r. 151 P.S,B, S1¢~'~.11"1, TraIls. hlsln. Choll. l:mgrs., 40 ( 1968 ) TOO. I (~1 H. I.htm,m and G,AJ. Holllulka, (Thou, I'llg, S¢i., 2,~ I 19"1), ) 22.t I, 171 R, Ctdl;.ns, Cheul, Eng, S¢i,, 211 ( 19651 74"/. I ,~ I R. T~:., R. Malstll|u alld Y, Nagai. Kagaku Kogaku, 31 ( 1907 ) 457. I ~j I P.S,B, Slewarl and J,I ' David.~uu, Powder Technulogy, I ( 1967 ) 61.
I I I l l K, Rh,'Icma, Proc, hll, Syrup, I-hudization, Eiudhoven. Netherhmd,,,. I~J67, p. 154.
I I I I T,B, Auderson and R. Jacksun, i and EC I-undaulenlals, 6 (1967) 527. 1121 ,I,W. Pri ld le l . T,R, lllak¢ aud S.K. Garg. AIChI" Sy.np. Set.. 74 ( 176 )
I131 K. Ril:h:lllil illid M,P. Mtlntels, m D.L. Keair.l,~ (ed.), t:luidizatiou T~clmulugy, Vul. I, lleuli,Hlhel'e Publ. Cul'p., Washinglon. DC, 1976, p. 5,t,
1141 R.A, Bagnold, Pr~. Roy. Sci., A225 (1954) 49. 1151 S. Cllapman and T.G. Cowling, The Mathemalical Theory of Nor-
unifurm Gases, Cambridge University Press, Cambridge, UK. 2nd edn., 1961.
1161 J. Ding and D. Gidaspow, AIChE J., 36 (1990) 523. I 171 Y. Tsuji, T. Kawaguchi and T. Tanaka, PowderTechnology, 77 ( 1993 )
79.
M. Hm'io et al. / Powder Technoh~gy 96 ( 19981 148-157 ! 57
1181
1191 1201
T. Mikami, H. Kamiya and M. Horio, Numerical Simulation of Cohesive Powder Behavior in a Fluidized Bed, paper accepted by Chem. Eng. Sci., (1997). C.S. Campbell and D.G. Wang, J. Fluid Mech., 227 ( 1991 ) 495. W. Polashenski and J.C. Chen, Powder Technology, 9{) (1997) 13.
! 2 i I R.R. Rathbone, M. Ghadiri and R. Cliff, in J.R. Grace, L.W. Shemilt and M.A. Bergougnou (eds.), Fluidization VI, Banff, Canada. Engineering Foundation, New York, 1989, p. 629.
1221 R. Cliff, AIChE Syrup. Set., 89 (296) ( 1993 ) I. 1231 R. Jackson, AIChE Symp. Ser., 91) ( 30 ! ) ( 1994 ) I. 1241 M. Horio, A. Nishiyama, J. Liu and !. Muchi, Kagaku Kogaku
Ronbunshu, 9 ( 1983} 6(19. 1251 H.O. Kono, A. Soltani-Ahmadi and M. Suzuki, Powder Technology,
52 (1987) 49.
1261
1271
1281 1291 1301
1311 1321
1331
1341
X.T. Nguyen, I..S. Leung and R.H. Wetland. m DL. Kearirn.,, ( ed. j, Fluidization Technology, Vol. I. p. 2t)7, Hemi,,phere Pull. Corp.. Washington, DC, 1976. G. Blazer, A. Boelle and O. Simonm. in J.-F. l,arge and C. Laguerie reds.), Fluidizafion Viii, Engineering Foundatilm. New York. 1996. p. 409. R. Jackson, Trans. lnstn. Chem. Engr.,,.. 41 ( 19fi3j 22. D. Gera and M. Gautam, Powder Technology, 79 ( i 994 ) ! 59. ]. Lockett and D. Harrison, in A.A.H. Drinkenhurg ( ed. ), Pr()c. Syrup. Fluidization, Netherlands University Press, Amsterdam, 1987, p. 257. L.S. Leung and C. Sandford, Chem. Eng. Sci., 24 ( 1969 ) ! 39 I, J.G. Yates, D.J. Cheesman and Y.A. Sergeev, Chem. Eng. Sci.. 49 (1994) 1885. Y.A. Buyevich, |.G. Yates, D.J. Cheesman and K.-T. Wu, Chem. Eng. Sci., 50 (1995) 3155. Y.A. Buyevich, Chem. Eng. Sci., 52 ( I t)97 ) 123.