49
Partitioning Soil Respiration through Vertical Profiles of Forests in MOFEP Rachel Henderson April 11, 2007 Thesis Defense
| Date post: | 02-Jan-2016 |
| Category: |
Documents |
| Upload: | jerome-logan |
| View: | 215 times |
| Download: | 1 times |

Partitioning Soil Respiration through Vertical Profiles of
Forests in MOFEP
Rachel Henderson
April 11, 2007
Thesis Defense

2
• Introduction– Climate Change– Soil Profiles and Efflux– Timber Harvest Management– Objectives
• Methods
• Results and Discussion
• Conclusions
• Acknowledgments

3
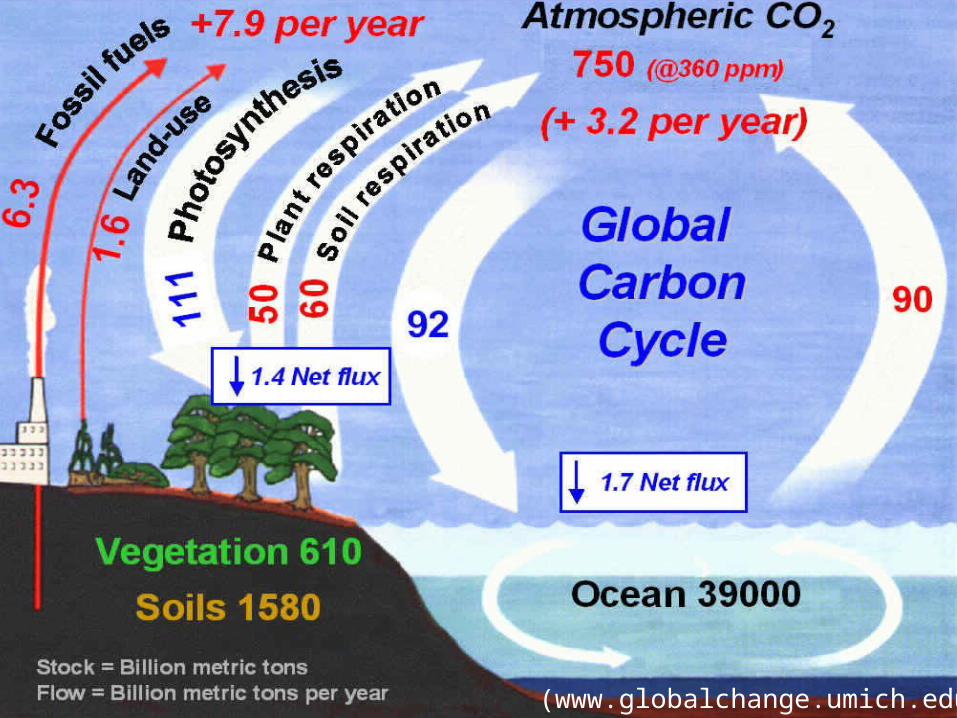
Climate Change
4
(www.globalchange.umich.edu)

5
Temperate Ecosystems
• Active management may enhance C sequestration
• Studies on how C is partitioned will allow for better predictions
• Temperate terrestrial ecosystems may be able to sequester C, especially forests (Ciais et al. 1995, Myneni et al. 2001)

6
Soil Profiles
• Soils are often many meters deep, contain a large quantity of organic C, and are poorly understood
• C dynamics cannot be determined only by the rooting zone
• Soil stores an estimate 2/3 of the terrestrial C (Hibbard et al. 2005)

7
Soil Efflux• Soil efflux (SEF) is the combined CO2 flux
from roots and microorganisms• Soil temperature, moisture, and texture, root
N concentrations, and substrate quantity and quality all affect SEF (Raich and Schlesinger 1992, Grant
and Rochette 1994, Boone et al. 1998, Pregitzer et al. 1998) • Factors influencing SEF vary vertically and
display the greatest temporal variability toward the surface (Davidson et al. 2006)
8
Roots and Microbes
• Root respiration may account for as much as 70% of SEF and fine roots respire more (Pregitzer et al. 1998, Kuzyakov and
Cheng 2001, Lee et al. 2003) • Bacterial richness, diversity, and total
microbial biomass decrease with soil depth (Fierer et al. 2003, LaMontagne et al. 2003)
• Subsurface microbial communities in a grassland ecosystem differ from surface communities (LaMontagne et al. 2003)

9
Management Effects
• Managed natural forest growth rates are not enough to sustainably produce enough wood and fiber (Fox 2000)
• If stands grow at 2 m/ha/year, then approximately 1.6 billion ha are needed (Fox
2000) • After a disturbance, ecosystems are a source
of C to the atmosphere and eventually reforestation turns the stand into a C sink

10
Objectives
• To better understand the effect timber harvest management has on subsurface soil horizons, I hypothesized: – Surface horizons would have the highest
SEF and SEF would decrease exponentially with depth
– Surface horizons would have different SEF and the deeper soil horizons would be similar
11
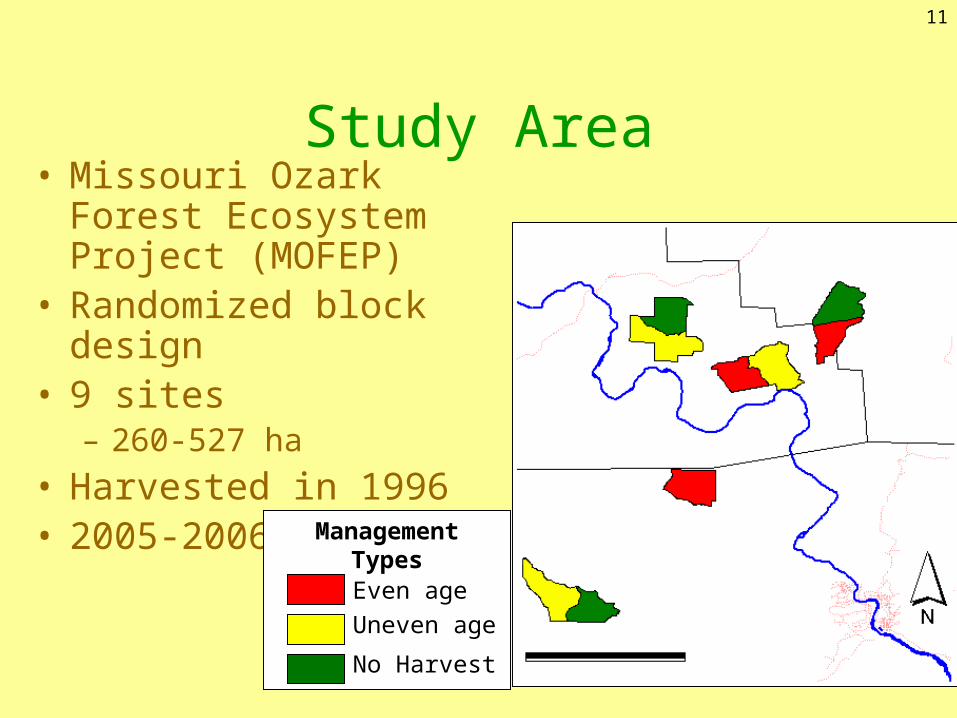
Study Area• Missouri Ozark Forest
Ecosystem Project (MOFEP)
• Randomized block design
• 9 sites – 260-527 ha
• Harvested in 1996• 2005-2006 Manageme
nt TypesEven age
Uneven age
No Harvest

12
Timber Harvest
Uneven-age Harvest (UAM)
Even-age Harvest (EAM)
No-Harvest (NHM)

13
Soil Properties
• Clarksville soil series (Mesic Typic Paleudults)
• Strongly acidic
• Silt loam to clay down soil profile
• Parent material: gravelly colluvium over clayey residuum from cherty dolstone

14
Soil Pits
• Stopped at bedrock (60-120 cm)
• Fine root (cores)– Weight (g)– C (%)– N (%)– C/N ratio
• Coarse root (pit)– Weight
}10 cm}10 cm}10 cm
}30 cm
}30 cm
}30 cm
120 cm

15
Soil Pits (con’t)• Soil
– C (%)– N (%)– C/N ratio
• Soil Efflux • Soil Moisture• Soil Temperature
– Thermometer (instantaneous)
– Hobo datalogger (continuous)
• 3 control pits
}30 cm
}30 cm
120 cm
}30 cm
}30 cm

16
Instruments
PP Systems EGM-4Soil Efflux
TDR 100 and AllegroSoil Moisture

17
Statistical Analysis
• Natural log: soil efflux, temperature, fine root weight, and soil C, N, and C/N ratio
• Log10: coarse root weight• Inverse: soil moisture• Soil levels were averaged before
analysis• ANOVA and Tukey’s• Stepwise regression
18
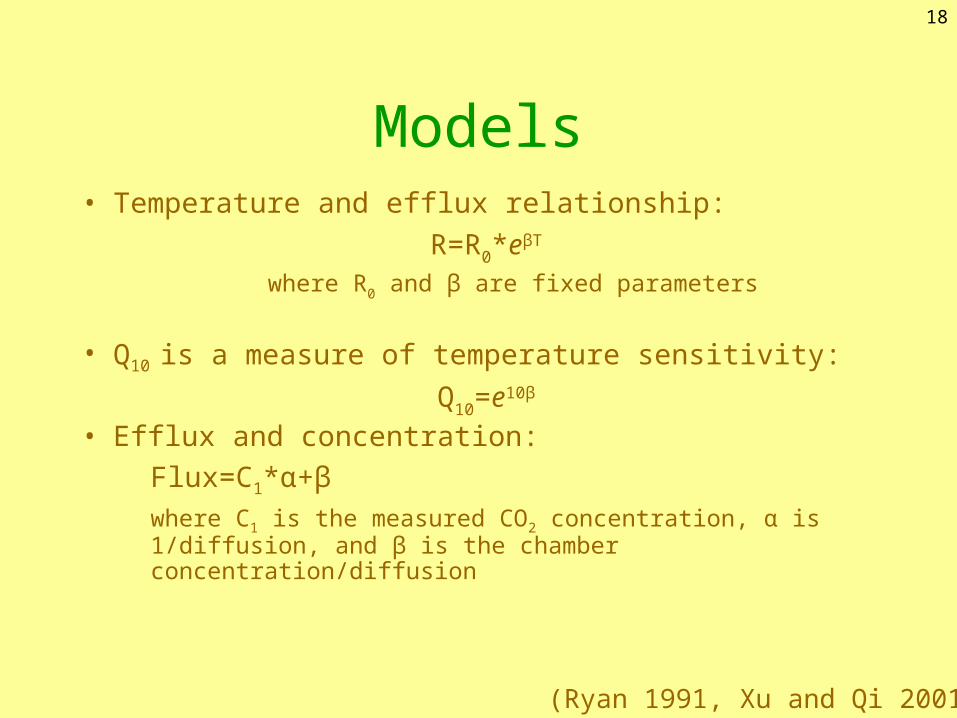
Models• Temperature and efflux relationship:
R=R0*eβT
where R0 and β are fixed parameters
• Q10 is a measure of temperature sensitivity:
Q10=e10β • Efflux and concentration:
Flux=C1*α+βwhere C1 is the measured CO2 concentration, α is 1/diffusion, and β is the chamber concentration/diffusion
(Ryan 1991, Xu and Qi 2001)

19
Theoretical Soil Efflux

20
Assumptions
• SEF follows a declining exponential trend
• Surface SEF is the sum of the depths
• Opening the soil pit may increase the diffusion deeper in the profile

21
Models• Theoretical respiration with depth:
R=α*e-βD where D is depth and α and β are fixed
• Excess SEF = Measured - Theoretical

22
Surface Soil Efflux

23
Soil Efflux

24
Soil Efflux
• CO2 may increase through the profile
– high CO2 production rates
– slow CO2 diffusion rates out of the
subsurface horizons– combination of the two (Hamada and Tanaka 2001,
Cattanio et al. 2002, Fierer et al. 2005)

25
Soil CO2 Concentration

26
Alpha - BetaFlux=C1*α+β

27
Diffusivity

28
Chamber CO2 Concentration

29
Soil Estimated Efflux

30
CO2 Concentration
• Increased with depth, but not as much as would be expected (Jing et al. 2005)
• Alpha was affected by soil moisture in the summer and soil moisture and temperature in the winter
• Beta did not have a single factor affecting it

31
Soil Temperature

32
Soil Temperature
• EAM affects the microclimate more than UAM (Zheng et al. 2000)
• The open pit temperature raised 0.05-1.33 ºC than the closed pit– 0.4-0.9 ºC temperature increase can raise
SEF by 20% (Bergner et al. 2004)

33
Q10 Values
Depth NHM EAM UAM
D0 2.6738 2.2707 1.2773
D15 5.2492 1.8991 3.4507
D45 3.0868 1.1618 2.1479
D75 3.5220 9.7451 5.4946
D105 1.1331 1.0049 3.3842

34
Efflux - Temperature

35
Q10
• Q10 may be underestimated in field
conditions (Gu et al. 2004)
• A lower Q10 value may occur in the in
the soil C horizon (Davidson et al. 2006)
• A low Q10 may be because of easily
metabolized C, differences in microbial communities, decreases in C quality, or interaction between CO2 production and
nutrient availability (Fierer et al. 2003)

36
Soil Moisture

37
Root Biomass
38
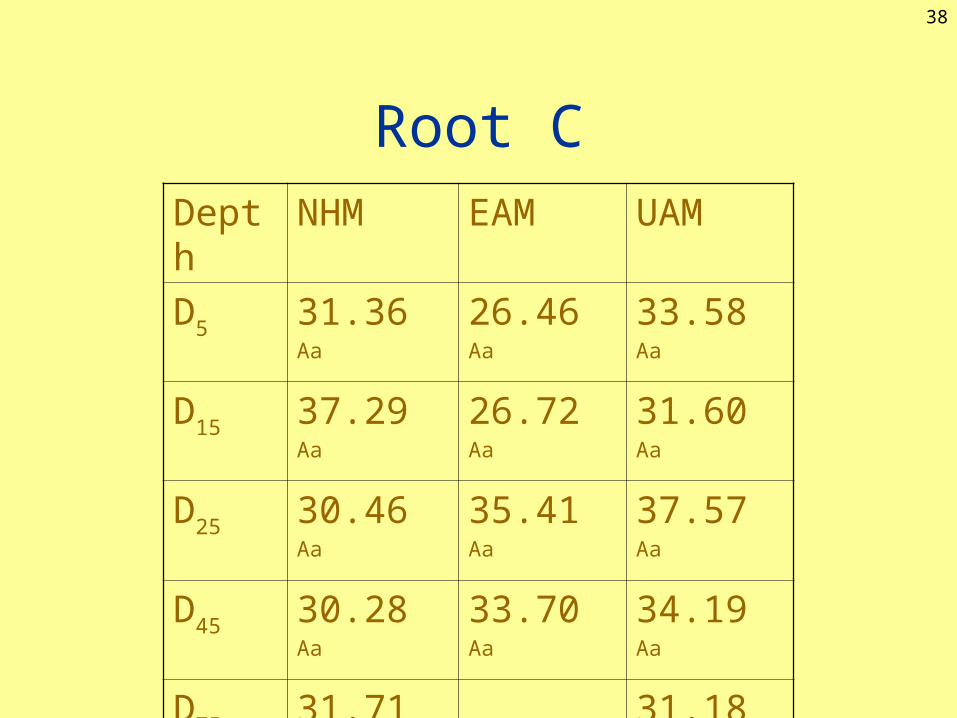
Root CDepth NHM EAM UAM
D5 31.36 Aa 26.46 Aa 33.58 Aa
D15 37.29 Aa 26.72 Aa 31.60 Aa
D25 30.46 Aa 35.41 Aa 37.57 Aa
D45 30.28 Aa 33.70 Aa 34.19 Aa
D75 31.71 Aa 31.18 Aa
D105 38.49 Aa 42.13 Aa 34.66 Aa

39
Root N
Depth NHM EAM UAM
D5 0.73 Aa 0.78 Aa 0.88 Aa
D15 0.39 Ba 0.42 Ba 0.44 Ba
D25 0.35 Ba 0.64 ABb 0.41 Bab
D45 0.25 Bac 0.51 ABb 0.29 Bac
D75 0.44 ABa 0.27 Ba
D105 0.22 Ba 0.22 Ba 0.35 Ba
40
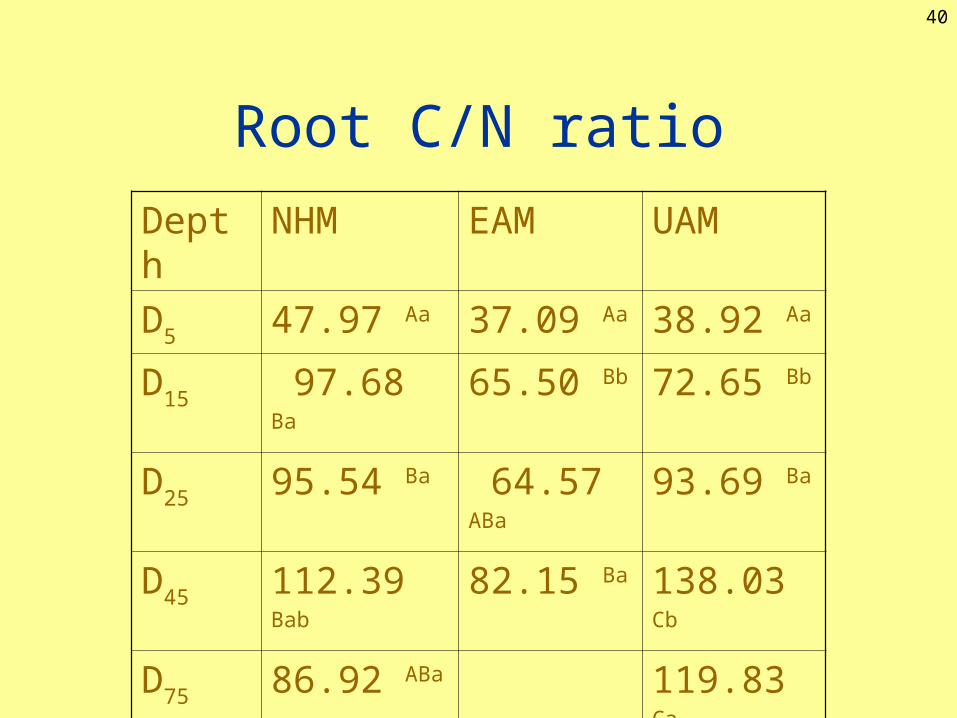
Root C/N ratio
Depth NHM EAM UAM
D5 47.97 Aa 37.09 Aa 38.92 Aa
D15 97.68 Ba 65.50 Bb 72.65 Bb
D25 95.54 Ba 64.57 ABa 93.69 Ba
D45 112.39 Bab 82.15 Ba 138.03 Cb
D75 86.92 ABa 119.83 Ca
D105 180.64 Cab 195.70 Ca 101.93 Bb

41
Soil ChemistryTreatment Depth C (%) N (%) C/N ratioNHM D15 1.35 Aa 0.13 Aa 11.19 Aa
D45 0.51 Ba 0.09 Aa 7.39 ABa
D75 0.31 Ba 0.13 Aa 5.19 Ba
D105 0.41 ABa 0.06 Aa 7.40 ABa
EAM D15 1.23 Aa 0.10 Aa 12.12 Aa
D45 0.49 Ba 0.08 ABa 6.98 Ba
D75 0.27 BCa 0.42 Ba 6.37 BCa
D105 0.29 Ca 0.11 ABa 3.59 Cb
UAM D15 1.47 Aa 0.10 Aa 14.14 Aa
D45 0.48 Ba 0.05 Bb 8.92 Ba
D75 0.39 Ba 0.08 Ba 6.19 Ba
D105 0.28 Ba 0.06 Ba 4.94 Bab

42
Stepwise Regression• NHM (R=0.9512, p=0.033):
– root C– root N– soil C– fine root weight
• EAM (R=0.4194, p=0.0037):– root C
• UAM (R=0.9240, p=0.0137): – root C – soil N

43
Stepwise Regression
• More roots were in the surface soils and should be less descriptive of SEF down the profile, but this is not what I found
• Temperature affects microbial respiration, but not roots (Lee et al. 2003)
• None of these variables explained the treatment differences seen in SEF

44
Theoretical SR

45
Estimated Difference

46
Estimated Difference
• Predicted UAM was an overestimation, which may be a mistake in the method or an unknown factor making measured UAM lower than it should be
• EAM had the lowest predicted SR, which may be why EAM had high diffusion

47
Further Studies
• Soil analysis of the porosity, particle size, bulk density, and texture
• Measure other variables, such as microbial communities, total microbial biomass, stable isotopes, etc. to determine other important factors
• Deeper into the soil profile to see if the EAM and UAM trend continues

48
Conclusions
• Timber harvesting raised SEF in soil deeper than a meter
• Soil temperature, moisture, C, N, C/N ratio, and root C, N, and C/N ratio did not explain this pattern
• Both deep soil C aspects and timber harvesting affects may alter climate change predictions

49
Acknowledgements
• Funding: MDC and The University of Toledo
• LEES lab• MDC employees: Randy Jensen, Kyle
Steele, and Brandon Kell• Field Assistants: Taylor Troiani, Ashley
Rhea, and Sally Betz• Committee: Jiquan Chen, Chris Mayer,
Mike Weintraub


