Label-free compound profiling in K562 leukemia cells by MALDI-TOF mass spectrometry using heme B as response marker Bruker’s very fast rapifleX MALDI PharmaPulse solution has been successfully used in pharmaceutical research for compound screening in various cell-free biochemical assays that measure distinct mass changes of synthetic or recombinant substrates that are affected by small molecule inhibitors. Abstract In this application note, we demon- strate a rapid cell-based assay with partly automated sample preparation for the profiling of BCR-ABL kinase inhibitors in K562 leukemia cells. Heme B, a marker for drug-induced redifferentiation of these cells and, hence, a suitable drug response marker, was used to establish concentration-response relation- ships for three drugs. The Bruker rapifleX MALDI PharmaPulse approach allowed for automated and label-free measurements of the response marker in treated cells at high speed. Authors: Sandra Schulz 1 , David Weigt 1 , Carsten Hopf 1 ; 1 Center of Mass Spectrometry and Optical Spectroscopy (CeMOS), Mannheim Technical University. Keywords: rapifleX MALDI PharmaPulse, MALDI compound screening, cell-based assay, concentration-response, drug response marker
Transcript
Label-free compound profiling in K562 leukemia cells by MALDI-TOF mass spectrometry using heme B as response marker
Bruker’s very fast rapifleX MALDI PharmaPulse solution has been successfully used in pharmaceutical research for compound screening in various cell-free biochemical assays that measure distinct mass changes of synthetic or recombinant substrates that are affected by small molecule inhibitors.
Abstract
In this application note, we demon- strate a rapid cell-based assay with partly automated sample preparation for the profiling of BCR-ABL kinase inhibitors in
K562 leukemia cells. Heme B, a marker for drug-induced redifferentiation of these cells and, hence, a suitable drug response marker, was used to establish concentration-response relation-ships for three drugs. The Bruker
rapifleX MALDI PharmaPulse approach allowed for automated and label-free measurements of the response marker in treated cells at high speed.
Authors: Sandra Schulz 1, David Weigt 1, Carsten Hopf 1; 1 Center of Mass Spectrometry and Optical Spectroscopy (CeMOS), Mannheim Technical University.
Matrix-assisted laser desorption/ ionization (MALDI) time-of-flight (TOF) mass spectrometry (MS) is a versatile technology for the label-free analysis of various classes of molecules. Also in the field of compound screening in drug discovery, MALDI-TOF MS has become a powerful alternative approach due to recent technical advances in speed, automation and
specificity of sample analysis. In contrast to common high throughput screening methods, there is no need for specific antibodies, probe development or labelling. Further-more, typical pitfalls in fluorescence assays like autofluorescence or fluorescence quenching, can be avoided.
Recently, rapifleX MALDI Pharma-Pulse has successfully been used in
various biochemical assays measuring mass changes upon compound treatment in pharmaceutical (incl. industrial) research [1-4]. In contrast, MALDI-MS-based cellular assays are still underexplored in pharmacology and chemical biology. Recent studies of whole mammalian cell analysis by MALDI-TOF MS [5,6] demonstrate that this technique can also be applied to monitor pharmacodynamics effects in cells. Concentration- dependent molecular changes can be measured for known and directly affected abundant proteins (e.g. polyacetylated histones) or low molecular mass molecules. More importantly, MALDI-TOF MS offers the opportunity to identify pharmaco-dynamic effects on a lipid or metabolic level by computational workflows, since hundreds of molecules can be scanned simultaneously. Here, we describe a fast and automated cellular phenotypic assay for heme inducers such as BCR-ABL inhibitors using the rapifleX MALDI PharmaPulse. This class of tyrosine kinase inhibitors blocks the detrimental function of the BCR-ABL fusion protein, the onco-genic driver in chronic myelogenous leukemia (CML) [7].
HTX TM sprayer conditions
MALDI Matrix20 mg/mL 2,5-Dihydroxy benzoic acid (DHB) in ACN/water (1:1 v/v) supplemented with 0.5% TFA
Temperature 50°C
Solvent flow rate 60 µL/min
Nozzle velocity 1000 mm/min
Line distance 2 mm
Number of passes 4
MS conditions rapifleX MALDI-TOF
Mass range 500-1000 Da
Ion mode Reflector positive
Laser frequency 2 kHz
Laser focus MS thin layer
Accumulated laser shots 4000 in random walk
Sampling rate 2.5 GS/s
MS conditions solariX MRMS
Mass range 150 - 3000 Da
Ion mode Reflector positive
Laser frequency 1 kHz
Laser focus Minimum
Accumulated laser shots 100
Scans 15
Transient length 1.47 s
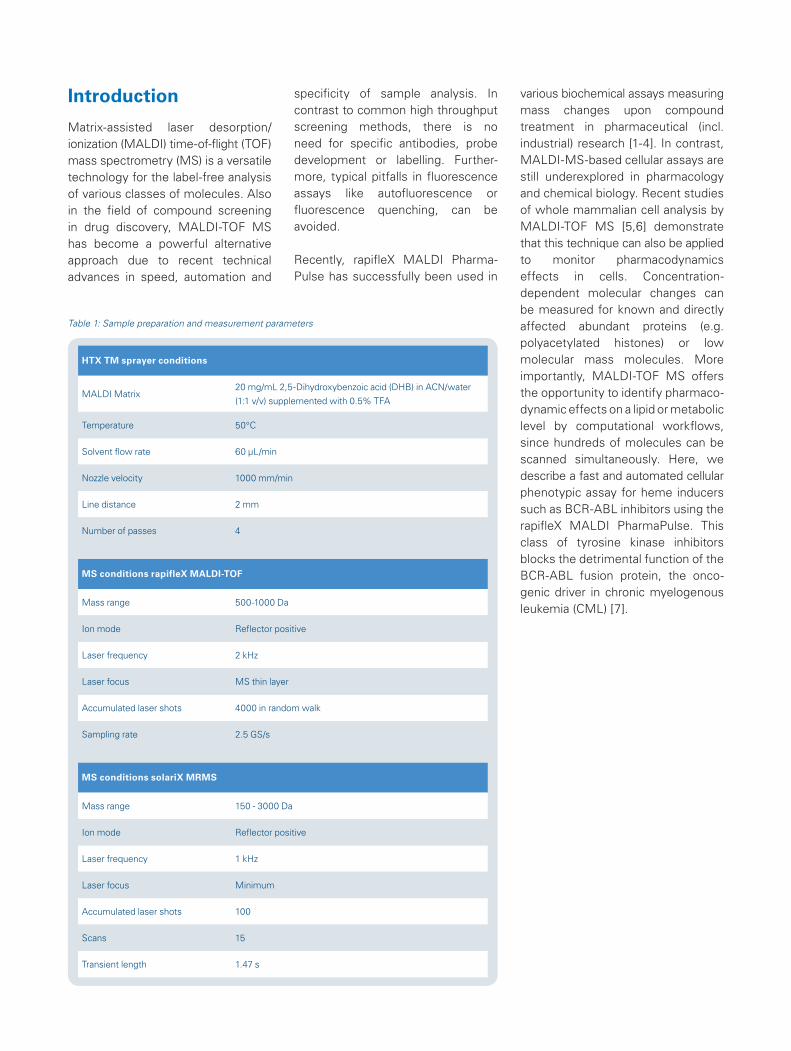
Table 1: Sample preparation and measurement parameters
MethodsK562 cells were cultured in RPMI-1640 medium supplemented with 10% FCS, 1 mM sodium pyruvate and 2 mM L-Glutamine. For the drug response assay, cells were seeded in 96-well plates at a density of 0.1*106
cells per mL. After 16 hours, cells were treated with either dasatinib, imatinib, chloroquine or the vehicle control DMSO for 48 hours. Cells were then harvested by centrifugation at 800 rpm, aspiration of the supernatant and snap-freezing of the 96-well plate in liquid nitrogen. Cells were resuspended in 40 µL of water and two µL from each well were transferred to a MALDI steel target in 384-format in four technical
replicates. For this study, four biological replicates were assessed.
Compound addition to the assay plate and transfer of resuspended treated cells to the MALDI target was performed by a CyBio FeliX automated liquid handling robot (Analytik Jena AG, Germany) to enhance assay reproducibility.
For MALDI-TOF MS, the target plate was spray-coated with DHB matrix (20 mg/mL in ACN/water (1:1 v/v) supplemented with 0.5% TFA) using a TM-sprayer (HTX Technolo- gies LLC, Chapel Hill, NC, USA). The sample plate was subsequently measured on a rapifleX MALDI-TOF mass spectrometer (Bruker Daltonics).
For detailed method parameters see Table 1.
Signal validation was performed on a solariX XR 7T MALDI magnetic resonance mass spectrometer (MRMS; Bruker Daltonics).
After recalibration in flexAnalysis 3.4, spectra were processed and analyzed as described previously [5]. Heme B signal intensities of technical replicates were averaged and the fold change to the vehicle control was calculated. The data was subsequently fitted to a non-linear regression dose-response model with variable slope using GraphPad Prism 5 (GraphPad Software, San Diego, USA).
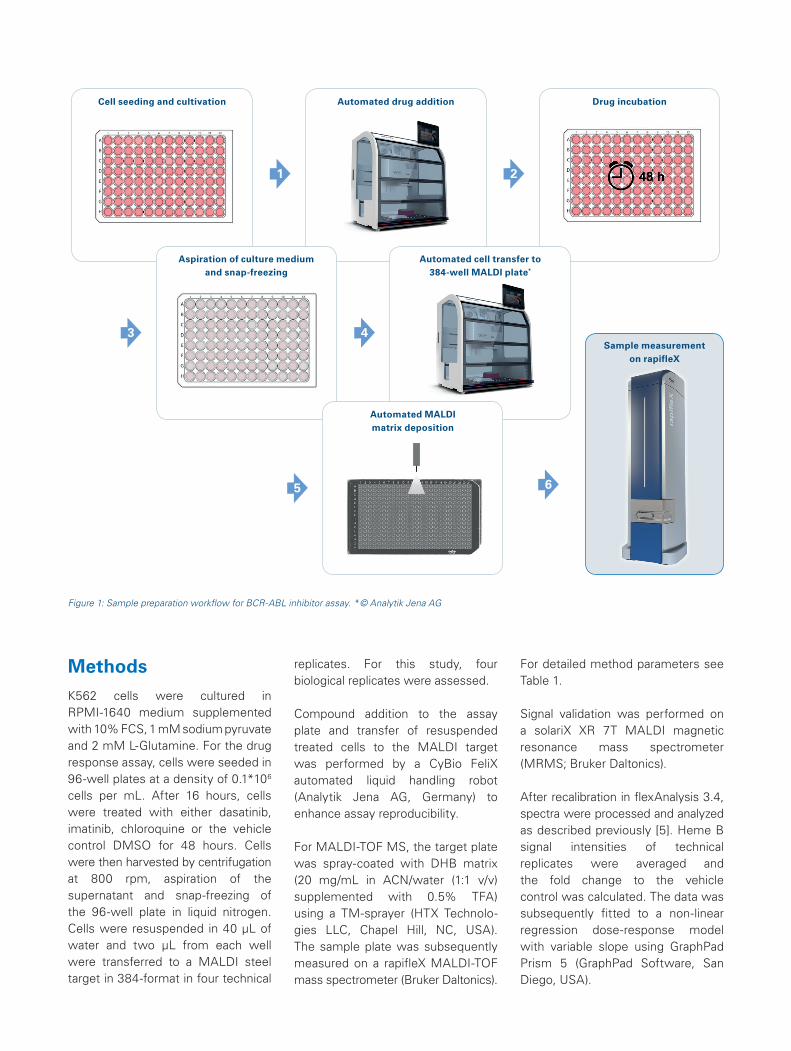
Cell seeding and cultivation Automated drug addition Drug incubation
BCR-ABL inhibitors are the first-line treatment of BCR-ABL-positive CML patients. In order to establish a MALDI-TOF-based inhibitor screen, we treated K562 leukemia cells with various concentrations of the two BCR-ABL inhibitors imatinib and dasatinib. The disease unrelated malaria inhibitor chloroquine was included as a control substance.
Cells are used directly from the cultivation plate for this MALDI-TOF assay and no sample cleanup steps are required. Drug addition to the cells and cell transfer to the MALDI target plates were carried out in an automated manner using the CyBio FeliX pipetting robot to ensure high reproducibility and to enable a higher sample throughput for potential drug screenings. After MALDI matrix application, the sample measurement
was performed automatically on a rapifleX MALDI-TOF MS. The schematic workflow is displayed in Figure 1.
As candidate pharmacodynamic markers that could be measured in a cell assay, we identified concentration-dependent molecular changes at the lipid and metabolic level in response to treatment of K562 cells with the two BCR-ABL
A
B
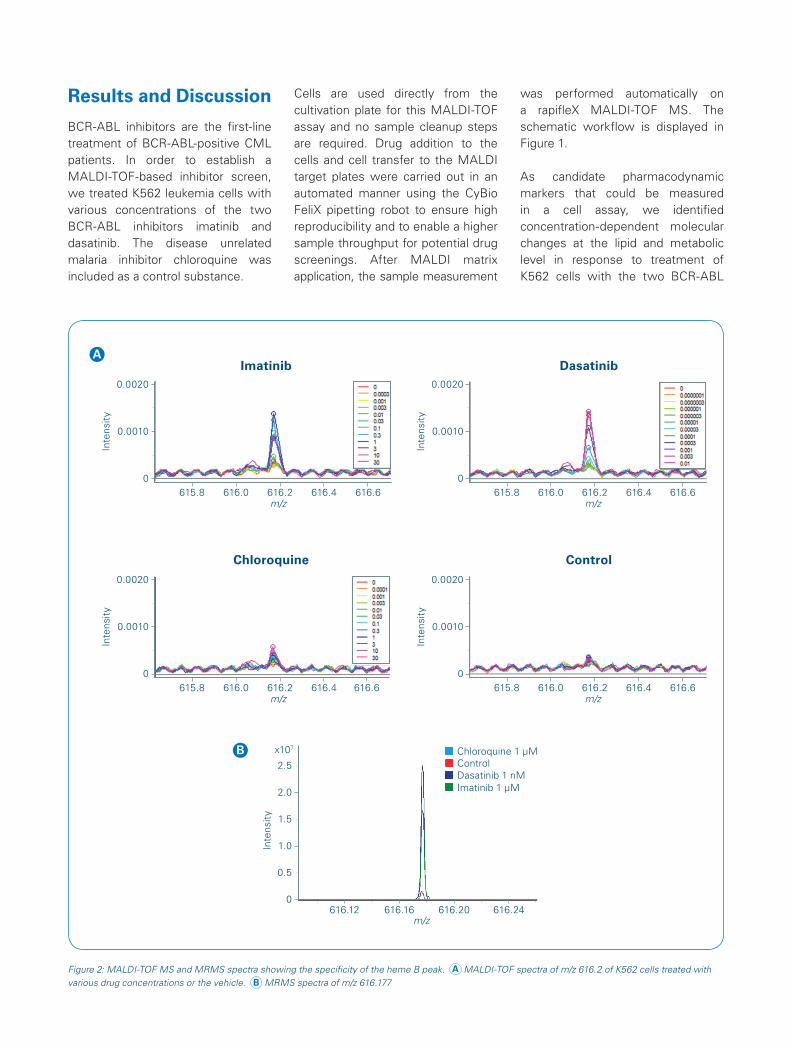
Figure 2: MALDI-TOF MS and MRMS spectra showing the specificity of the heme B peak. A MALDI-TOF spectra of m/z 616.2 of K562 cells treated with various drug concentrations or the vehicle. B MRMS spectra of m/z 616.177
tyrosine kinase inhibitors but not with the unrelated compound.
The m/z value 616.2 was selected as a suitable response read-out although other m/z values showed equally a concentration-dependent change in signal intensity (see [5]). Using ultra-high resolving power MRMS (solariX, Bruker Daltonics), the response marker was identified as heme B. Heme B is a known marker for erythroid differentiation and therefore a functional measure of drug response in CML cells.
The specificity of the response signal was evaluated in the rapifleX MS spectra and additionally at higher mass resolution in the MRMS spectra measured on the same MALDI target plate (figure 2). No interfering
signals were detected showing that the measured response was solely due to heme B induction.
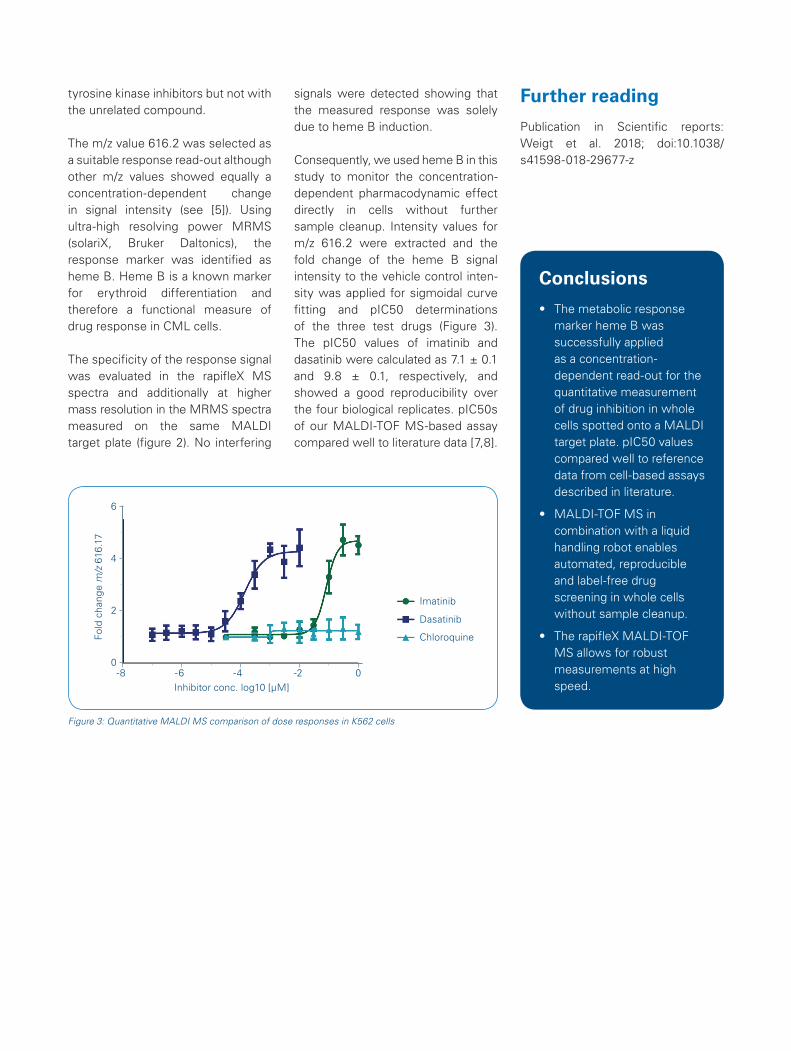
Consequently, we used heme B in this study to monitor the concentration- dependent pharmacodynamic effect directly in cells without further sample cleanup. Intensity values for m/z 616.2 were extracted and the fold change of the heme B signal intensity to the vehicle control inten-sity was applied for sigmoidal curve fitting and pIC50 determinations of the three test drugs (Figure 3). The pIC50 values of imatinib and dasatinib were calculated as 7.1 ± 0.1 and 9.8 ± 0.1, respectively, and showed a good reproducibility over the four biological replicates. pIC50s of our MALDI-TOF MS-based assay compared well to literature data [7,8].
Further reading
Publication in Scientific reports: Weigt et al. 2018; doi:10.1038/s41598-018-29677-z
Conclusions
• The metabolic response marker heme B was successfully applied as a concentration-dependent read-out for the quantitative measurement of drug inhibition in whole cells spotted onto a MALDI target plate. pIC50 values compared well to reference data from cell-based assays described in literature.
• MALDI-TOF MS in combination with a liquid handling robot enables automated, reproducible and label-free drug screening in whole cells without sample cleanup.
• The rapifleX MALDI-TOF MS allows for robust measurements at high speed.
Figure 3: Quantitative MALDI MS comparison of dose responses in K562 cells
You are looking for further Information? Check out the link or scan the QR code for more details.
www.bruker.com/mpp
References
[1] Beeman K, Baumgartner J, Laubenheimer M, Hergesell K, Hoffmann M, Pehl U, Fischer F, Pieck JC (2017). Integration of an In Situ MALDI-Based High-Throughput Screening Process: A Case Study with Receptor Tyrosine Kinase c-MET. SLAS Discov, 22:1203-1210.
[2] Haslam C, Hellicar J, Dunn A, Fuetterer A, Hardy N, Marshall P, Paape R, Pemberton M, Resemannand A, Leveridge M (2016). The Evolution of MALDI-TOF Mass Spectrometry toward Ultra-High-Throughput Screening: 1536-Well Format and Beyond. J Biomol Screen, 21:176-186.
[3] Winter M, Bretschneider T, Kleiner C, Ries R, Hehn JP, Redemann N, Luippold AH, Bischoff D, Büttner FH (2018). Establishing MALDI-TOF as Versatile Drug Discovery Readout to Dissect the PTP1B Enzymatic Reaction. SLAS Discov: Advancing Life Sciences R&D, 23:561-573.
[4] De Cesare V, Johnson C, Barlow V, Hastie J, Knebel A, Trost M (2018). The MALDI-TOF E2/E3 Ligase Assay as Universal Tool for Drug Discovery in the Ubiquitin Pathway. Cell chemical biology, 25:1117-1127.e1114.
[5] Weigt D, Sammour DA, Ulrich T, Munteanu B, Hopf C (2018) Automated analysis of lipid drug-response markers by combined fast and high-resolution whole cell MALDI mass spectrometry biotyping. Sci Rep, 8:11260.
[6] Munteanu B, Meyer B, von Reitzenstein C, Burgermeister E, Bog S, Pahl A, Ebert MP, Hopf C (2014). Label-free in situ monitoring of histone deacetylase drug target engagement by matrix-assisted laser desorption ionization-mass spectrometry biotyping and imaging. Anal Chem, 86:4642-4647.
[7] Deininger M, Buchdunger E, Druker BJ (2005). The development of imatinib as a therapeutic agent for chronic myeloid leukemia. Blood, 105:2640-2653.
[8] Hegedus C, Ozvegy-Laczka C, Apáti A, Magócsi M, Német K, Orfi L, Kéri G, Katona M, Takáts Z, Váradi A, et al. (2009). Interaction of nilotinib, dasatinib and bosutinib with ABCB1 and ABCG2: implications for altered anti-cancer effects and pharmacological properties. British journal of pharmacology, 158:1153-1164.