Partners in Batching Productivity with: Q.iMPACT WebEx Session #6: •Q.iMPACT Support Tools Whitt, Mettler-Toledo Q.i Product Support Engineer t Haimerl, Mettler-Toledo Q.i Product Manager September 24, 2008
Transcript
Partners in Batching Productivitywith:
Q.iMPACT WebEx Session #6:•Q.iMPACT Support Tools
Mark Whitt, Mettler-Toledo Q.i Product Support EngineerScott Haimerl, Mettler-Toledo Q.i Product Manager
September 24, 2008
Tool Name Where can I find it?
What does it do? How does it work? What tool(s) is it similar to?
Why should I use it?
DMT_Controller FTP Site Transfer files to or from a Q.i or JagXtreme.
See WEBEX #1 - Backup & Recovery Procedures
FreeFTP, Internet Explorer
•Most reliable DMT file transfer method.•Verification mode available.•Can upload files from multiple units with a single click.•Automatic Backup Feature available.
FreeFTP http://www.brandyware.com/freeftp.htm
Transfer files to or from a Q.i or JagX.
Not supported by Mettler-Toledo. Contact Brandyware.
DMT_Controller, Internet Explorer
More reliable than Internet Explorer FTP.
E-Flash FTP Site Update the firmware on a Q.i or JagXtreme
E-Flash Procedure Document
None To update firmware in your Q.i (or JagXtreme).
MT_Port_Monitor FTP Site Records detailed troubleshooting information and Feed History Records.
This WEBEX! HyperTerminal Q.i365
In case you need to send detailed information to Mettler-Toledo for analysis and troubleshooting.Automatically compresses and archives data.Automatically generated exception report to speed analysis.Monitors for unexpected terminal resetsMonitors an entire cluster at once!
MT_Datamonitor FTP Site Records changes to specified Shared Data variables to a log file.
This WEBEX! None Unofficial tool to assist in troubleshooting:Drain Time ProblemsUnstable Scaleetc..
HyperTerminal Various Internet Download sites. No longer free from Hillgraeve!
Records troubleshooting information and Feed History Records.
How to setup HyperTerminal to capture data
MT_Port_Monitor, Q.i365
Already installed on most systems (comes with many Windows Packages). Easy to use, but very limited functionality.
Set_PC FTP Site Sets personality code on Controller card so specified version of Q.i firmware will run.
Set_PC Tool Instructions None Required to run the Q.i firmware!
Prevents accidental usage of incorrect firmware in Q.i unit.
Personality code PRESET at the factory. Rarely needs modification.
Problem Report FTP Site Allows user to collect information about a problem in a structured way and send it to MT.
Problem Report None Helps MT support personnel understand the architecture of your system so they are better able to assist in solving problems.
Better problem definition.
Q.i365 FTP Site Records Feed History Information.
Upcoming WEBEX on Q.i365!
MT_Port_Monitor, HyperTerminal
Stores feed information into a database.
Provides SPC and trend analysis for preventative maintenance.
Provides detailed troubleshooting information for each feed.
1. Select all records in the History file (NotePad)2. Copy the records.3. In Excel spread sheet, paste at column A.4. Find the "Menu" icon and select "Use Text Import Wizard"5. Uncheck "Space", check "Other" and specify "^"6. Click "Finish"7. Allow overwrite of destination contents.
This sorts by Material Path
MT_Port_Monitor can NOT run on the same PC at the same time that other monitoring programs are running, such as MT_Datamonitor and Q.i365 due to resource conflicts.
Sometimes we only need the “Command_Feed_StatusCheck.txt” file to diagnose a problem.
The ErrHist.Log file on each Matroller contains the same information as the “Command_Feed_StatusCheck.txt” file.
Detailed help function available!
Tool Tips on all objects!
Problem: How to access and collect Shared Data variable data directly from a Q.i (or JagXtreme) so that the information can be used to troubleshoot a process or Terminal problem?
ANSWER: MT_Datamonitor!
• Monitor Scale or Flowmeter variables and flags
• Monitor multiple terminals at the same time.
• Logging Interlock allows stored data to be narrowed to the area of interest.
• Information stored in a file on the PC for later analysis, or so it can be sent to Mettler-Toledo support personnel.
NOTE: MT_Datamonitor is an UNOFFICIAL tool that has been found to be very useful. But documentation and help are limited. It is usually used under the direction of an MT Engineer.
Purpose:
Record changes to Shared Data variables on a Terminal or a Cluster of Terminals.
Uses:1. Validate a Process2. Troubleshoot a Process3. Troubleshoot a Terminal
Produces a sequential record of changes to the specified Shared Data variables.
Use the same procedure as for MT_Port_Monitor:
•Download from the FTP site: MT_DataMonitor
•Extract into a temporary directory
•Run the Setup.exe – No 7-zip to install this time!
Run it
Or double click on the Desktop Icon
From the Start Menu…
Enter IP Addresses to be monitored (just like MT_Port_Monitor).
• Type in new IP Address
• Click “Add IP Address”
Select Variable from List
Select Update Mode
Click “Add Variable” to add it to the list.
Default Log File Name
How do I figure out what Shared Data Variables to look at?
Use ShareData.doc !
Select the file to use for logging by clicking “Browse”
Accept the new Default name, or type in your own.
The new file name is shown here.
Define the Multiple
Define the base units:• 0.1 Seconds• Seconds• Minutes• Hours• Days
Defines how often a record will be written to the log file, NOT how often the variable will be checked. Controls the size of the Log File.
Polling Rate defines how often all of the variables in the list should be read from EACH of the Q.i’s being monitored. Controls the amount of Network Traffic generated.
Click here to start logging Click here to stop logging
How many updates were written to the log file
Log File data
Note the following info:• Time Stamp• IP Address• Shared Data Name• Shared Data Value
Clears Update Count – restart at zero.
A way to restrict data based on value
Checking this enables the Logging Interlock
Enter the value above which data should be recorded.
Current Value of First Item in the list.
Red indication shows that values are NOT being recorded.
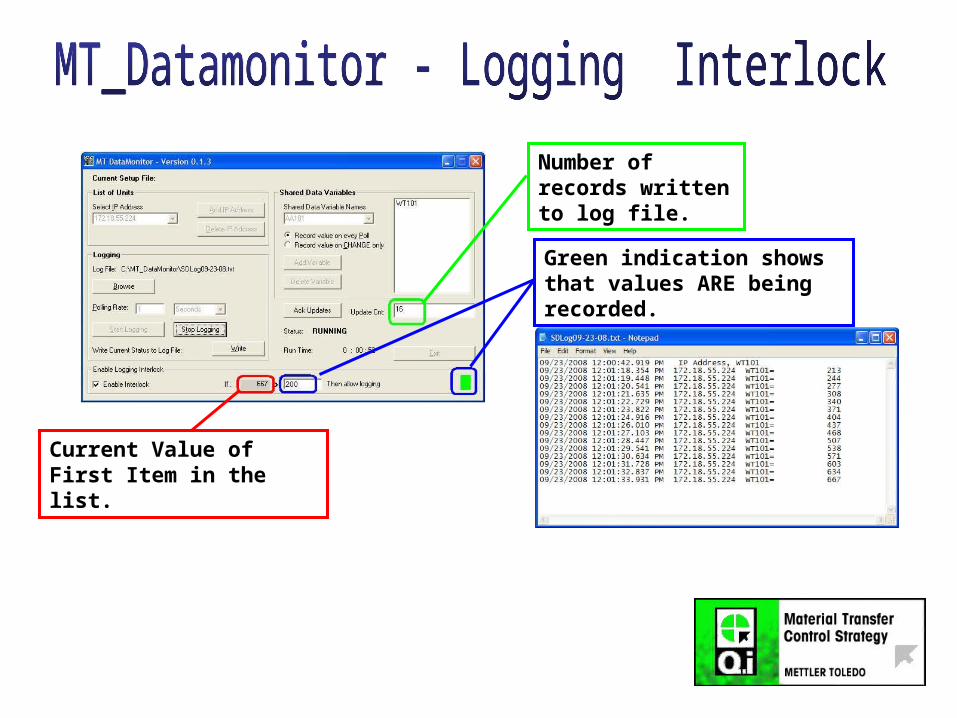
Number of records written to log file.
Current Value of First Item in the list.
Green indication shows that values ARE being recorded.
MT_Datamonitor can NOT run on the same PC at the same time that other monitoring programs are running, such as MT_Port_Monitor and Q.i365 due to resource conflicts.
Questions?
1. Backup recovery procedures MarchMark Whitt and Scott Haimerl
2. New features in A.0 firmware (plus earlier versions and options) April
Mark Whitt and Scott Haimerl
3. Optimizing material paths and channels MayBradley Timm and Scott Haimerl


![Whitt - [3]](https://static.documents.pub/doc/80x56/577cd3561a28ab9e789708cd/whitt-3.jpg)


