Parts per million (ppm) 10 −6 This is a way of expressing very dilute concentrations of substances. Just as per cent means out of a hundred, so parts per million or ppm means out of a million. Usually describes the concentration of something in water or soil. One ppm is equivalent to 1 milligram of something per liter of water (mg/l) or 1 milligram of something per kilogram soil (mg/kg). ppm (parts-per-million, 10 −6 ), ppb (parts-per-billion, 10 −9 ), ppt (parts-per-trillion, 10 −12 ) and ppq (parts-per-quadrillion, 10 −15 ). One part per million (ppm) denotes one part per 1,000,000 parts, one part in 10 6 , 1/1,000,000 * 100% = 0.0001% (or 1% = 10,000 ppm), and a value of 1 × 10 −6 . This is equivalent to one drop of water diluted into 50 liters (roughly the fuel tank capacity of a compact car) or about 32 seconds out of a year. Tetramethylsilane Tetramethylsilane is the organosilicon compound with the formula Si(CH₃)₄. It is the simplest tetraorganosilane. Like all silanes, the TMS framework is tetrahedral. What is Single-crystal X-ray Diffraction Single-crystal X-ray Diffraction is a non-destructive analytical technique which provides detailed information about the internal lattice of crystalline substances, including unit cell dimensions, bond-lengths, bond-angles, and details of site-ordering. Directly related is single-crystal refinement, where the data generated from the X-ray analysis is interpreted and refined to obtain the crystal structure. The single crystal diffractometer and associated computer package is used mainly to elucidate the molecular structure of novel compounds, either natural products or man made molecules. Powder diffraction is mainly used for “finger print identification” of various solid materials, e.g. asbestos, quartz. In powder or polycrystalline diffraction it is important to have a sample with a smooth plane surface. If possible, we normally grind the sample down to particles of about 0.002 mm to 0.005 mm cross section. The ideal sample is homogeneous and the crystallites are randomly distributed (we will later point out problems which will occur if the specimen deviates from this ideal state). The sample is pressed into a sample holder so that we have a smooth flat surface.
Transcript
Parts per million (ppm) 10−6
This is a way of expressing very dilute concentrations of substances. Just as per cent means out of a hundred, so parts per million or ppm means out of a million. Usually describes the concentration of something in water or soil. One ppm is equivalent to 1 milligram of something per liter of water (mg/l) or 1 milligram of something per kilogram soil (mg/kg).
One part per million (ppm) denotes one part per 1,000,000 parts, one part in 106, 1/1,000,000 * 100% = 0.0001% (or 1% = 10,000 ppm), and a value of 1 × 10⁻⁶. This is equivalent to one drop of water diluted into 50 liters (roughly the fuel tank capacity of a compact car) or about 32 seconds out of a year.
Tetramethylsilane
Tetramethylsilane is the organosilicon compound with the formula Si(CH₃)₄. It is the simplest tetraorganosilane. Like all silanes, the TMS framework is tetrahedral.
What is Single-crystal X-ray Diffraction
Single-crystal X-ray Diffraction is a non-destructive analytical technique which provides detailed information about the internal lattice of crystalline substances, including unit cell dimensions, bond-lengths, bond-angles, and details of site-ordering. Directly related is single-crystal refinement, where the data generated from the X-ray analysis is interpreted and refined to obtain the crystal structure. The single crystal diffractometer and associated computer package is used mainly to elucidate the molecular structure of novel compounds, either natural products or man made molecules. Powder diffraction is mainly used for “finger print identification” of various solid materials, e.g. asbestos, quartz. In powder or polycrystalline diffraction it is important to have a sample with a smooth plane surface. If possible, we normally grind the sample down to particles of about 0.002 mm to 0.005 mm cross section. The ideal sample is homogeneous and the crystallites are randomly distributed (we will later point out problems which will occur if the specimen deviates from this ideal state). The sample is pressed into a sample holder so that we have a smooth flat surface.
In powder xrd, you have crystals at every possible orientation, so instead of getting spots you get rings. The difference is in the diffraction pattern. For a single crystal you get spots at defite locations. For powder. the crystals forming the powder have random orientations and the patterns tend to be circles. Spectroscopy Theoretical Background
Since spectroscopy is based on the interaction of electromagnetic radiation (EMR) with a molecule, an understanding of electromagnetic radiation is a must.
Spectroscopy monitors the changes in energy states of a molecule, so one must be familiar with the important energy states and concept of quantisation of energy within a molecule.
• Electromagnetic Radation • Important energy states within a molecule • Quantisation of Energy
Electromagnetic Radiation (EMR)
The part of the electromagnetic radiation spectrum that you are most familar with is "visible light" but this is just a small portion of all the possible types. QUESTION : Can you think of common applications of other regions of the electromagnetic spectrum ? ANSWER
Electromagnetic radiation has both particle and wave properties.
QUESTION Can you think of an example of each ? ANSWER
X-ray = medical imaging, ultra-violet = tanning lamps, infra red = heat lamps, microwaves = ovens, radio = communication
Wave-like properties: It is important to understand wavelength, l, and frequency, n, and how they relate to each other: c = l n (c = speed of light)
Particle-like properties: A particle of energy is called a photon. Each photon has a discrete amount of energy: a quantum, E = h n = h c / l (h = Planck's constant)
Energy States There are many energy 'states' in a molecule. Of particular interest to the organic chemist will be those relating to the energy associated with the nuclear spin state, the vibration of a bond or an electronic energy levels (orbitals)
Quantisation of Energy
The absorption of energy causes an atom or molecule to go from an initial energy state (the ground state) to another higher energy state (an excited state). The energy changes are frequently described using an energy level diagram.
The energy states are said to be quantised because there are only certain discrete values that are possible, there is not a continuous spread of energy levels available.
Spectroscopic methods
Infra-Red (IR) Spectroscopy
• Basic priciples of IR • Hookes' Law model • Important absorptions • Sample spectra
Basics: Infra red (IR) spectroscopy deals with the interaction between a molecule and radiation from the IR region of the EM spectrum (IR region = 4000 - 400 cm-1). The cm-1 unit is the wave number scale and is given by 1 / (wavelength in cm).
IR radiation causes the excitation of the vibrations of covalent bonds within that molecule. These vibrations include the stretching and bending modes.
An IR spectrum show the energy absorptions as one 'scans' the IR region of the EM spectrum. As an example, the IR spectrum of butanal is shown below.
In general terms it is convienient to split an IR spectrum into two approximate regions:
• 4000-1000 cm-1 known as the functional group region, and • < 1000 cm-1 known as the fingerprint region
• Most of the information that is used to interpret an IR spectrum is obtained from the functional group region.
• In practice, it is the polar covalent bonds than are IR "active" and whose excitation can be observed in an IR spectrum.
• In organic molecules these polar covalent bonds represent the functional groups. • Hence, the most useful information obtained from an IR spectrum is what functional
groups are present within the molecule (NMR spectroscopy typically gives the hydrocarbon fragments).
• Remember that some functional groups can be "viewed" as combinations of different bond types. For example, an ester, CO2R contains both C=O and C-O bonds, and both are typically seen in an IR spectrum of an ester.
• In the fingerprint region, the spectra tend to be more complex and much harder to assign.
Nuclear Magnetic Resonance (NMR) Spectroscopy
• Basic principles of NMR • Chemical shift scale • Different types of H • Shielding in H-NMR
o due to electronegativity
o magnetic anisotropy o hydrogen bonding
• Table of H-NMR chemical shifts • H-NMR spectra I • Coupling in H-NMR • H-NMR spectra II • Complex coupling patterns • Interpreting H-NMR • C-NMR spectra basics • Interpreting C-NMR • DEPT C-NMR • 2D-NMR
Basics Nuclei with an odd mass or odd atomic number have "nuclear spin" (in a similar fashion to the spin of electrons). This includes 1H and 13C (but not 12C). The spins of nuclei are sufficiently different that NMR experiments can be sensitive for only one particular isotope of one particular element. The NMR behaviour of 1H and 13C nuclei has been exploited by organic chemist since they provide valuable information that can be used to deduce the structure of organic compounds. These will be the focus of our attention.
Since a nucleus is a charged particle in motion, it will develop a magnetic field. 1H and 13C have nuclear spins of 1/2 and so they behave in a similar fashion to a simple, tiny bar magnet. In the absence of a magnetic field, these are randomly oriented but when a field is applied they line up parallel to the applied field, either spin aligned or spin opposed. The more highly populated state is the lower energy spin state spin aligned situation.
Two schematic representations of these arrangements are shown below:
Basic Principles
In NMR, electromagnetic (EM) radiation is used to "flip" the alignment of nuclear spins from the low energy, spin aligned state to the higher energy spin opposed state.
The energy required for this transition depends on the strength of the applied magnetic field (see below). The energy difference between the spin states is quite small and corresponds to the radio frequency range of the EM spectrum.
As this diagram shows, the energy required to cause the spin-flip, DE, depends on the magnetic field strength at the nucleus. With no applied field, there is no energy difference between the spin states, but as the field increases, so does the separation of energies of the spin states and therefore so does the frequency required to cause the spin-flip.
DE' > DE since Ho' > Ho
The basic arrangement of an NMR spectrometer is shown to the left. The sample is positioned in the magnetic field and excited via pulsations in the radio frequency input circuit. The realigned magnetic fields induce a radio signal in the output circuit which is used to generate the output signal. Fourier analysis of the complex output produces the actual spectrum. The pulse is repeated as many times as necessary to allow the signals to be identified from the background noise.
Chemical Shift
• An NMR spectrum is a plot of the radio frequency applied against absorption. • A signal in the spectrum is referred to as a resonance. • The frequency of a signal is known as its chemical shift, d
The chemical shift in absolute terms is defined by the frequency of the resonance expressed with reference to a standard compound which is defined to be at 0 ppm. The scale is made more manageable by expressing it in parts per million (ppm) and is indepedent of the spectrometer frequency.
It is often convienient to describe the relative positions of the resonances in an NMR spectrum. For example, a peak at a chemical shift, δ, of 10 ppm is said to be downfield or deshielded with respect to a peak at 5 ppm, or if you prefer, the peak at 5 ppm is upfield or shielded with respect to the peak at 10 ppm. The terms shielded and deshielded will be explained later.
Typically for a field strength of 4.7 T the resonance frequency of a proton will occur around 200MHz and for a carbon, around 50.4MHz. The reference compound is the same for both, tetramethysilane (Si(CH3)4).
QUESTIONS
• What would be the chemical shift of a peak that occurs 655.2 Hz downfield of TMS on a spectrum recorded using a 90 MHz spectrometer? ANSWER
655.2 Hz / 90 MHz = 7.28 ppm (the chemical shift of chloroform)
• At what frequency would the chemical shift of chloroform (CHCl3, δ = 7.28 ppm) occur relative to TMS on a spectrum recorded on a 300 MHz spectrometer? ANSWER
7.28 ppm x 300 MHz = 2184 Hz.
• A 1 GHz (1000 MHz) NMR spectrometer is being developed, at what frequency and chemical shift would chloroform occur? ANSWER
Chemical shift = 7.28 ppm Frequency = 7280 Hz
Different types of Hydrogen
The issues to understand from this page are:
• What do we mean by different types of hydrogen? • Counting types of hydrogen • Terminology
This may seem a trivial concept, but the idea of establishing the number of kinds of hydrogens (or other atoms such as C) is a very important useful concept, especially in NMR spectroscopy where for example, different types of H typically give rise to a different signal.
What do we mean? A hydrogen atom is "different" to another hydrogen atom if it is not in an identical environment to the other hydrogen. This could mean it's attached to a different type of atom (e.g. CH vs OH, or sp3 CH vs sp2 CH) or due to the number of adjacent H (e.g. CH3- vs -CH2- ) or just at a different point in a chain (e.g. compare the H in the methylene (CH2) groups in CH3CH2CH2OH
Counting different types of Hydrogen There are three methods that can be used to count the number of kinds of H (each achieve the
same result). You will probably find it best to master the first of these methods and over time you will find yourself moving towards the 3rd method)
1. Substitution method (simplest but slowest) The idea is that you replace each H in the molecule in turn with a "dummy" atom (for example a -Cl) to see if you get a different product (i.e. one that will require a different name). Each new product, indicates a different type of H. This idea is related to the radical chlorination of alkanes where some of each possible product is usually obtained.
For example:
Qu : If you remove one H atom from chloroethane and substitute it for another Cl atom, how many different molecules can you make ? Ans : Two products, 1,1-dichloroethane and 1,2-dichloroethane. Hence there are two types of H in chloroethane
2. Verbal description The verbal method requires that you describe the position of each H within the molecule. If you need to use different words to describe two H atoms, then they represent different types of H.
For example:
• an -OH is different to a -CH (based on what they are attached to) • a -CH3 is different to a -CH2- (because the number of H at that C are different) • an sp3C-H is different to an spC-H. • Other differences could be position on a chain, across a ring or double bond etc.
3. Symmetry (most difficult but fastest) The symmetry method is the most sophisticated but the quickest method and requires that you look for mirror planes, rotation axes or inversion centers that interchange H atoms. H atoms that can be interchanged are equivalent to each other.
CAUTION
• Remember that rotation about σ-bonds produces different conformations only and not different molecules.
• Remember to consider the three dimensional nature of the molecule
QUESTIONS
• How many different types of H are there in each of the following hydrocarbons:
propane, 2-methylbutane and propene ?
ANSWER ANSWER ANSWER
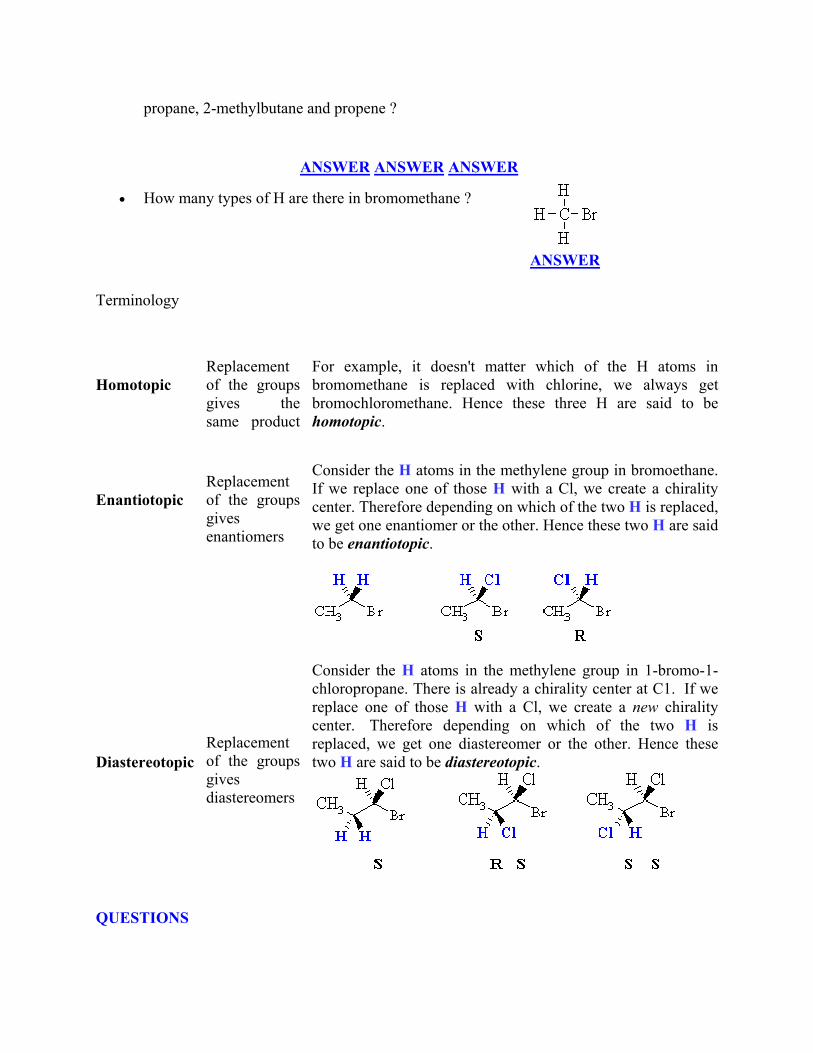
• How many types of H are there in bromomethane ?
ANSWER
Terminology
Homotopic
Replacement of the groups gives the same product
For example, it doesn't matter which of the H atoms in bromomethane is replaced with chlorine, we always get bromochloromethane. Hence these three H are said to be homotopic.
Enantiotopic
Replacement of the groups gives enantiomers
Consider the H atoms in the methylene group in bromoethane. If we replace one of those H with a Cl, we create a chirality center. Therefore depending on which of the two H is replaced, we get one enantiomer or the other. Hence these two H are said to be enantiotopic.
Diastereotopic Replacement of the groups gives diastereomers
Consider the H atoms in the methylene group in 1-bromo-1-chloropropane. There is already a chirality center at C1. If we replace one of those H with a Cl, we create a new chirality center. Therefore depending on which of the two H is replaced, we get one diastereomer or the other. Hence these two H are said to be diastereotopic.
QUESTIONS
• How are the H in bromoiodomethane related ? ANSWER • How are the H in the methyl group in bromoethane related ? ANSWER
Shielding in H-NMR
• Structural factors cause changes in the magnetic field experienced by the nucleus • As we have seen, this changes the resonance frequency and hence the chemical shift
The structural factors mean that different types of proton will occur at different chemical shifts. This is what makes NMR so useful for structure determination, otherwise all protons would occur at the same frequency, limiting the information to the presence of H.
The various factors that influence the field include:
• inductive effects by electronegative groups • magnetic anisotropy of π-systems • hydrogen bonding
Electronegativity
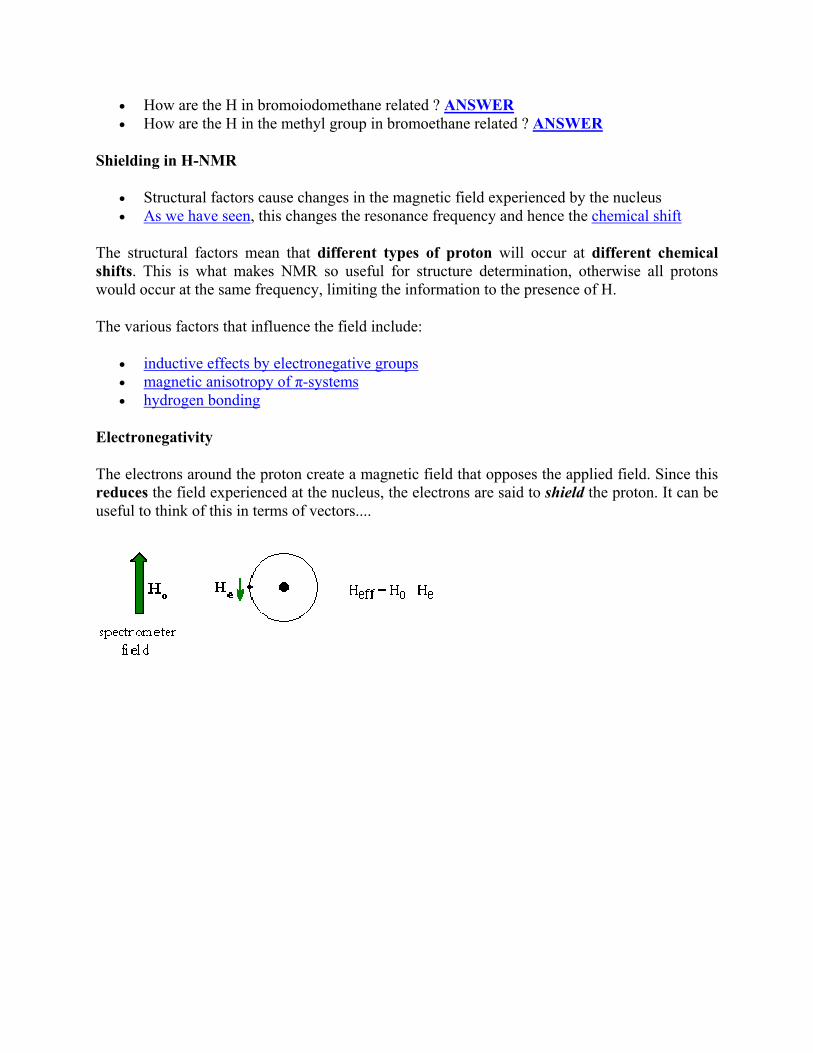
The electrons around the proton create a magnetic field that opposes the applied field. Since this reduces the field experienced at the nucleus, the electrons are said to shield the proton. It can be useful to think of this in terms of vectors....
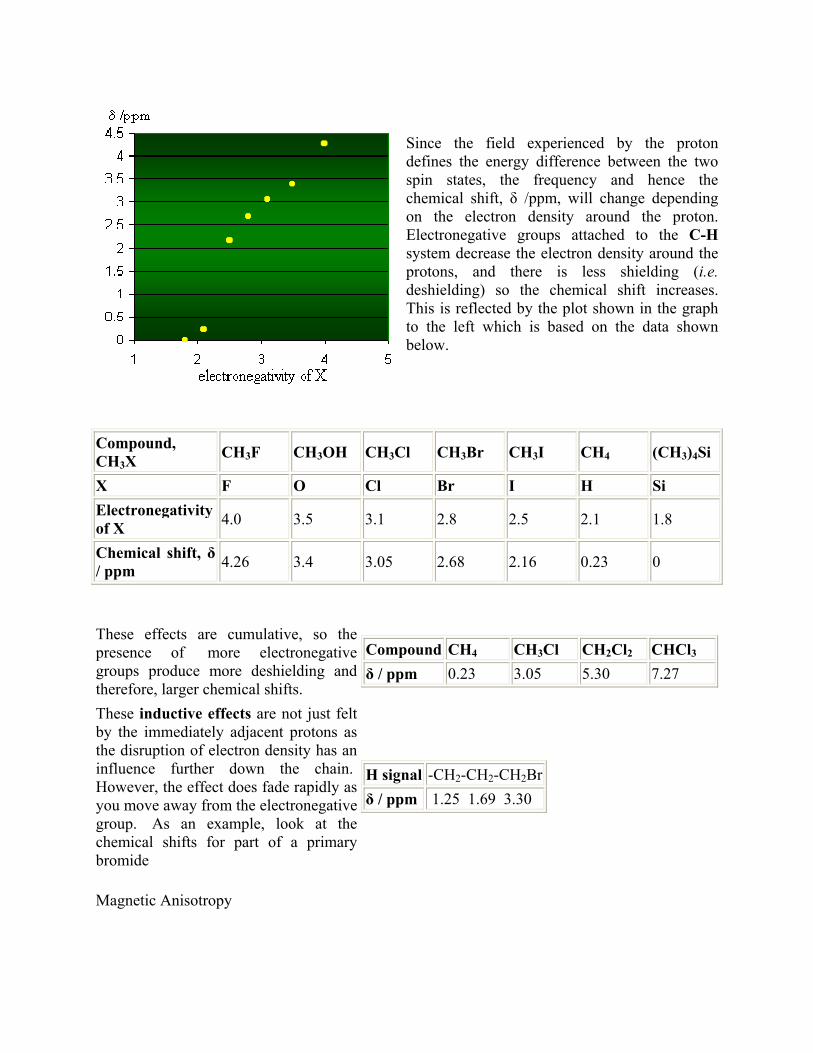
Since the field experienced by the proton defines the energy difference between the two spin states, the frequency and hence the chemical shift, δ /ppm, will change depending on the electron density around the proton. Electronegative groups attached to the C-Hsystem decrease the electron density around the protons, and there is less shielding (i.e.deshielding) so the chemical shift increases. This is reflected by the plot shown in the graph to the left which is based on the data shown below.
These effects are cumulative, so the presence of more electronegative groups produce more deshielding and therefore, larger chemical shifts.
Compound CH4 CH3Cl CH2Cl2 CHCl3
δ / ppm 0.23 3.05 5.30 7.27
These inductive effects are not just felt by the immediately adjacent protons as the disruption of electron density has an influence further down the chain. However, the effect does fade rapidly as you move away from the electronegative group. As an example, look at the chemical shifts for part of a primary bromide
H signal -CH2-CH2-CH2Br δ / ppm 1.25 1.69 3.30
Magnetic Anisotropy
The word "anisotropic" means "non-uniform". So magnetic anisotropy means that there is a "non-uniform magnetic field". Electrons in π systems (e.g. aromatics, alkenes, alkynes, carbonyls etc.) interact with the applied field which induces a magnetic field that causes the anisotropy. As a result, the nearby protons will experience 3 fields: the applied field, the shielding field of the valence electrons and the field due to the π system. Depending on the position of the proton in this third field, it can be either shielded (smaller d) or deshielded (larger d), which implies that the energy required for, and the frequency of the absorption will change.
Hydrogen Bonding
Protons that are involved in hydrogen bonding (this usually means -OH or -NH) are typically observed over a large range of chemical shift values. The more hydrogen bonding there is, the more the proton is deshielded and the higher its chemical shift will be. However, since the amount of hydrogen bonding is susceptible to factors such as solvation, acidity, concentration and temperature, it can often be difficult to predict.
HINT : It is often a good idea to leave assigning -OH or -NH resonances until other assignments have been made.
Experimentally, -OH and -NH protons can be identified by carrying out a simple D2O (deuterium oxide, also known as heavy water) exchange experiment. These H atoms are said to be exchangeable.
• Run the regular H-NMR experiment • Add a few drops of D2O
• Re-run H-NMR experiment • Compare the two spectra and look for peaks that have "disappeared"
Why would a peak disappear ?
Consider the alcohol case for example: R-OH + D2O <=> R-OD + HOD During the hydrogen bonding, the alcohol and heavy water can "exchange" -H and -D each other, so the alcohol becomes R-OD. Although D is NMR active, its signals are of different energy and are not seen in the H-NMR, hence the peak due to the -OH disappears. (Note that the HOD will appear...)
QUESTION
• Suggest a reason why the acidic protons in a carboxylic acid appear so far downfield (about 12 ppm) ? ANSWER
H-NMR Chemical shifts
• The chemical shift is the position on the δ scale (in ppm) where the peak occurs. • Typical δ /ppm values for protons in different chemical environments are shown in the
schematic figure below. • There are two major factors that influence chemical shifts
(a) deshielding due to reduced electron density (due electronegative atoms) and (b) anisotropy (due to magnetic fields generated by π bonds).
Note that the figure shows the typical chemical shifts for protons being influenced by a single group. In cases where a proton is influenced by more than one group, the effects are essentially cumulative.
Coupling in H-NMR
So far the H-NMR spectra that we have looked at have all had different types of protons that are seen as singlets in the spectra. This is not the normal case.... spectra usually have peaks that appear as groups of peaks due to coupling with neighbouring protons, for example, see the spectra of 1,1-dichloroethane shown below.
Before we look at the coupling, lets review the assignment of the peaks first:
• δ = 5.9 ppm, integration = 1H deshielded : agrees with the -CHCl2 unit • δ = 2.1 ppm, integration = 3H : agrees with -CH3 unit
Now, what about the coupling patterns ?
Coupling arises because the magnetic field of vicinal (adjacent) protons influences the field that the proton experiences.
To understand the implications of this we should first consider the effect the -CH group has on the adjacent -CH3.
The methine -CH can adopt two alignments with respect to the applied field. As a result, the signal for the adjacent methyl -CH3 is split in two lines, of equal intensity, a doublet.
Now consider the effect of the -CH3 group has on the adjacent -CH .
The methyl -CH3 protons give rise to 8 possible combinations with respect to the applied field. However, some combinations are equivalent and there are four magnetically different effects. As a result, the signal for the adjacent methine -CH is split into four lines, of intensity ratio 1:3:3:1, a quartet.
• The proximity of "n" equivalent H on neighbouring carbon atoms, causes the signals to be split into "n+1" lines.
• This is known as the multiplicity or splittingorcoupling pattern of each signal. • Equivalent protons (or those with the same chemical shift) do not couple to each other. • If the neighbours are not all equivalent, more complex patterns arise. • To a first approximation, protons on adjacent sp3 C tend to behave as if they are
equivalent.
Now we can do more a complete analysis, including the application of the "n+1" rule to 1,1-dichloroethane:
• δ = 5.9 ppm, quartet, integration = 1H, deshielded : agrees with the -CHCl2 unit next to a -CH3 unit (n = 3, so n + 1 = 4 lines)
• δ = 2.1 ppm, doublet, integration = 3H : agrees with -CH3 unit, next to a -CH- (n = 1, so n + 1 = 2 lines)
Coupling Constant, J
The coupling constant, J (usually in frequency units, Hz) is a measure of the interaction between a pair of protons. In a vicinal system of the general type, Ha-C-C-Hb then the coupling of Ha with Hb, Jab, MUST BE EQUAL to the coupling of Hb with Ha, Jba, therefore Jab = Jba. The implications are that the spacing between the lines in the coupling patterns are the same as can be seen in the coupling patterns from the H-NMR spectra of 1,1-dichloroethane (see left).
Pascal's Triangle
The relative intensitites of the lines in a coupling pattern is given by a binomial expansion or more conviently by Pascal's triangle. To derive Pascal's triangle, start at the apex, and generate each lower row by creating each number by adding the two numbers above and to either side in the row above together. The first six rows are shown to the right. So for H-NMR a proton with zero neighbours, n = 0, appears as a single line, a proton with one neighbours, n =1 as two lines of equal intensity, a proton with two neighbours, n = 2, as three lines of intensities 1 : 2 : 1, etc.
QUESTIONS
• What would the multiplicity and the relative intensitites be for the secondary H in propane ? ANSWER
• What is the multiplicity for the tertiary H in 2-methylpropane ? ANSWER
Summary
• Individual resonances are split due to coupling with "n" adjacent protons
• Number of lines in coupling pattern, L = n + 1
C-NMR Spectroscopy
It is useful to compare and contrast H-NMR and C-NMR as there are certain differences and similarities:
• 13C has only about 1.1% natural abundance (of carbon atoms) • 12C does not exhibit NMR behaviour (I=0) • 13C nucleus is also a spin 1/2 nucleus • 13C nucleus is about 400 times less sensitive than H nucleus to the NMR phenomena • Due to the low abundance, we do not usually see 13C-13C coupling • Chemical shift range is normally 0 to 220 ppm • Chemical shifts are also measured with respect to tetramethylsilane, (CH3)4Si (i.e. TMS) • Similar factors affect the chemical shifts in 13C as seen for H-NMR • Long relaxation times (excited state to ground state) mean no integrations • "Normal" 13C spectra are "broadband, proton decoupled" so the peaks show as single
lines • Number of peaks indicates the number of types of C
The general implications of these points are that 13C-NMR spectra take longer to acquire than H-NMR, though they tend to look simpler. Accidental overlap of peaks is much less common than for H-NMR which makes it easier to determine how many types of C are present.
What does broadband, proton decoupled mean ?
The resonances due to 13C nuclei are split by neighbouring H atoms. These splittings would complicate the appearance of the spectra making them harder to interpret. Therefore, in a "normal" 13C spectra, these couplings are "removed" by applying a continuous second radio frequency signal of a broad frequency range that excites all the H nuclei and cancels out the coupling patterns due to the interaction of the H with the 13C. This means that each C is seen as a single line. Of course information is being lost by doing this, such as how many H are attached to each C.
In off-resonance decoupling the one bond C-H couplings are retained so the signal for a particular C is given by the number of attached H in accord with n+1 rule. So, for example, a -CH3 shows as a quartet and a -CH2- as a triplet.
QUESTIONS
• How many lines in the peak for a C-H (i.e. methine) group in an off-resonance decoupled spectra ? ANSWER
• What about a quaternary C with no H attached ? ANSWER
13C chemical shifts The most significant factors affecting the chemical shifts are:
• Electronegativity of the groups attached to the C • Hybridisation of C
A simple correlation table of 13C chemical shifts is shown below.
Interpretting C-NMR Spectra The following information is to be gained from a typical broadband decoupled 13C-NMR spectrum:
How many types of C ? Indicated by how many signals there are in the spectra
What types of C ? Indicated by the chemical shift of each signal
Here are some examples of 13C-NMR spectra.
2D-NMR Spectra
• So far the NMR spectral methods we have discussed have been one dimensional (since they have a single chemical shift x coordinate axis).
• With the development of more advanced spectroscopic methods as computational power has increased, it has become possible to obtain two dimensional spectra.
• In two dimensional experiments, both the x and the y axes have chemical shift scales and the 2D spectra are plotted as a grid like a map.
• Information is obtained from the spectra by looking at the peaks in the grid and matching them to the x and y axes.
• COSY - Correlation Spectroscopy o both axes correspond to the proton nmr spectra. o the COSY spectra indicates which H atoms are coupling with each other. o An example of a COSY is provided below.
• HETCOR - Heteronuclear Correlation Spectroscopy o proton nmr spectra on one axis and the 13C nmr spectra on the other. o the HETCOR spectra matches the H to the appropriate C.
COSY spectra
• The information on the H that are coupling with each other is obtained by looking at the peaks inside the grid. These peaks are usually shown in a contour type format, like height intervals on a map.
• In order to see where this information comes from, let's consider an example shown
below, the COSY of ethyl 2-butenoate • First look at the peak marked A in the top left corner. This peak indicates a coupling
interaction between the H at 6.9 ppm and the H at 1.8 ppm. This corresponds to the coupling of the CH3 group and the adjacent H on the alkene.
• Similarly, the peak marked B indicates a coupling interaction between the H at 4.15 ppm and the H at 1.25 ppm. This corresponds to the coupling of the CH2 and the CH3 in the ethyl group.
• Notice that there are a second set of equivalent peaks, also marked A and Bon the other side of the diagonal.
(COSY spectra recorded by D. Fox, Dept of Chemistry, University of Calgary on a Bruker Advance DRX-400 spectrometer)
HETCOR spectra
• The information on how the H are C are matched is obtained by looking at the peaks inside the grid. Again, these peaks are usually shown in a contour type format, like height intervals on a map.
• In order to see where this information comes from, let's consider an example shown below, the HETCOR of ethyl 2-butenoate.
• First look at the peak marked A near the middle of the grid. This peak indicates that the H at 4.1 ppm is attached to the C at 60 ppm. This corresponds to the -OCH2- group.
• Similarly, the peak marked B towards the top right in the grid indicates that the H at 1.85 ppm is attached to the C at17 ppm. Since the H is a singlet, we know that this corresponds to the CH3- group attached to the carbonyl in the acid part of the ester and not the CH3- group attached to the -CH2- in the alcohol part of the ester.
• Notice that the carbonyl group from the ester has no "match" since it has no H attached in this example.
(HETCOR spectra recorded by D. Fox, Dept of Chemistry, University of Calgary on a Bruker Advance DRX-400 spectrometer) Ultraviolet-Visible (uv-vis) Spectroscopy Basics Ultraviolet-visible spectropscopy (uv = 200-400 nm, visible = 400-800 nm) corresponds to electronic excitations between the energy levels that correspond to the molecular orbitals of the systems. In particular, transitions involving π orbitals and lone pairs (n = non-bonding) are important and so uv-vis spectroscopy is of most use for identifying conjugated systems which tend to have stronger absorptions. The lowest energy transition is that between the highest occupied molecular orbital (HOMO) and the lowest unoccupied molecular orbital (LUMO) in the ground state. The absorption of the EM radiation excites an electron to the LUMO and creates an excited state. The more highly conjugated the system, the smaller the HOMO-LUMO gap, DE, and therefore the lower the frequency and longer the wavelength, l. The colours we see in inks, dyes, flowers etc. are
typically due to highly conjugated organic molecules. The unit of the molecule that is responsible for the absorption is called the chromophore, of which the most common are C=C (π to π*) and C=O (n to π*) systems.
Mass Spectroscopy (MS)
What should you be able to do with MS ?
• Identify the molecular ion in order to determine the molecular weight • Determine the presence of common isotopes such as Cl and Br • More advanced skills allow one to identify fragments ions
Basics
Mass spectrometry is based on slightly different principles to the other spectroscopic methods.
The physics behind mass spectrometry is that a charged particle passing through a magnetic field is deflected along a circular path on a radius that is proportional to the mass to charge ratio, m/e. In an electron impact mass spectrometer, a high energy beam of electrons is used to displace an electron from the organic molecule to form a radical cation known as the molecular ion. If the molecular ion is too unstable then it can fragment to give other smaller ions. The collection of ions is then focused into a beam and accelerated into the magnetic field and deflected along circular paths according to the masses of the ions. By adjusting the magnetic field, the ions can be focused on the detector and recorded.
• Probably the most useful information you should be able to obtain from a MS spectrum is the molecular weight of the sample.
• This will often be the heaviest ion observed from the sample provided this ion is stable enough to be observed.
Terminology
Molecular ion The ion obtained by the loss of an electron from the molecule
Base peak The most intense peak in the MS, assigned 100% intensity
M+ Symbol often given to the molecular ion
Radical cation +ve charged species with an odd number of electrons
Fragment ions Lighter cations formed by the decomposition of the molecular ion. These often correspond to stable carbcations.
Getting Structures from Spectra
Good problem solving skills are often based on a good method of attack. Here is some general advice of how to go about determining structures from spectral data, be it from real spectra of an experimental sample, or in the context of a question. The order of events here works towards using the H-NMR at the last stage since it is potentially the most useful for "assembling" the structure. However, at each stage it is a good idea to use information in other spectra (if available) to seek support your interpretation or address any doubts. Try to get a molecular formula at the earliest possible opportunity and then calculate the index of hydrogen deficiency (IHD).
• MS o determine the molecular weight o identify the presence of isotopes patterns for Cl or Br
• UV o is the system conjugated ?
• IR o identify the functional groups that are present
• 13C-NMR o how many types of carbon ? o what types of carbon ?
• H-NMR o how many types of hydrogen ? o how many of each type ? o what types of hydrogen ? o how are they connected ?
Having completed an analysis of the available spectra,
• list the pieces that have been identifed • check the pieces the MW and / or molecular formula and refine the pieces to fit • assemble the pieces paying particular attention to H-NMR chemical shifts and coupling
In the ionic CFT, it is assumed that the ions are simple point charges. When applied to alkali metal ions containing a symmetric sphere of charge, calculations of bond energies are generally quite successful. The approach taken uses classical potential energy equations that take into account the attractive and repulsive interactions between charged particles (that is, Coulomb's Law interactions).
The bond energy between the charges is proportional to q1 * q2/r
where q1 and q2 are the charges of the interacting ions and r is the distance separating them. This leads to the correct prediction that large cations of low charge, such as K+ and Na+, should form few coordination compounds.
For transition metal cations that contain varying numbers of d electrons in orbitals that are NOT spherically symmetric, however, the situation is quite different. The shape and occupation of these d-orbitals then becomes important in an accurate description of the bond energy and properties of the transition metal compound.
To be able to understand and use CFT then, it is essential to have a clear picture of the shapes (angular dependence functions) of the d-orbitals.
JSmol is an Open Source application for the display of molecular graphics that is capable of displaying atomic orbitals so it is possible to see the relationship between their orientation and ligands in different stereochemistries. See the cases for octahedral, tetrahedral and square planar complexes.
A cube provides a convenient reference for displaying the coordination centre of complexes since octahedral compounds have cubic symmetry i.e. the six anions sit at the centres of the faces of the cube and for tetrahedral complexes the 4 ligands sit at opposite diagonal edges.
You should be able to see that two of the d-orbitals, the dz2 and dx2-y2 meet the faces of the cube, but the remaining three (dxy, dyz and dxz) point towards the edges of the cube and actually have a node meeting the centres of the faces.
What happens then to the energy of the d-electrons if negatively charged ligands are brought in towards the metal centre to give an octahedral complex - where the ligands sit at the centre of the faces of the cube i.e. on the X, Y and Z axes? Since the d electrons are themselves negatively charged they would experience repulsion and their energies would be raised. For 's' and 'p' electrons this is of little consequence but for 'd' electrons there will be an energy difference involved depending on the orbital distribution and occupation.
Consider the simple example of TiCl63- in which six chloride ions octahedrally surround the Ti3+
cation. There is only one d-electron to be allocated to one of the five d- orbitals. If it were to occupy the dz2 or dx2-y2 orbital, both of which meet the face of the cube and thus point directly towards the chloride ligands, it would be strongly repelled. The geometry of these orbitals and their nodes would require the electron to stay near the negatively charged ligands causing even more repulsion than a spherically distributed electron would experience. On the other hand, if the electron were to occupy the dxy, dyz or dxz orbital, it would spend less time near the ligands than would a spherically distributed electron and would be repelled less.
This difference between for example the dx2-y2 orbital, the dxy orbital and a spherical distribution can be graphically represented by
The result of these differences for the d-orbitals is an energy difference between the dz2 and dx2-y2 orbitals compared to the dxy, dyz and dxz orbitals.
The CFT approach can be easily extended to other geometries and the next most important case is the tetrahedron. To predict the splitting pattern of the energy of the d-orbitals under a tetrahedal crystal field you may once again find it convenient to consider how the ligands can fit into a cube to give a tetrahedron.
The next step is to consider how the d-orbitals interact with these incoming ligands. For tetrahedral complexes, the energy of those orbitals which point towards the edges should now be raised higher than those which point towards the faces. That is, the exact opposite of the situation we just dealt with for the octahedral crystal field. The end result is a splitting pattern which is represented in the splitting diagram above.
The square planar case can be considered as an extension of the octahedral, where we remove the two ligands from the Z axis. Consequently, repulsion of an electron in the dz2 orbital will no longer be equivalent to that experienced by an electron in the dx2-y2 orbital, and the end result is shown above. For the first year course, the only square planar complexes will be for d8 complexes, i.e all four coordinate complexes are tetrahedral except for d8 which may be tetrahedral or square planar.
Once we accept that the energy of the 5 'd' orbitals are no longer degenerate in a coordination compound we can begin to explore some of the implications. Note that a different CFT energy splitting diagram has to be applied for each stereochemistry. In this course we will only be concerned with diagrams for octahedral, tetrahedral and square planar complexes.
One of the important aspects of CFT is that not all ligands are identical when it comes to causing a separation of the energy of the d-orbitals. For transition metal compounds, there is clear evidence for this from the multitude of colours available for a given metal ion when the ligands
or stereochemistry are varied. For octahedral complexes this is a reflection of the energy difference between the higher dz2, dx2-y2 (eg subset) and the dxy, dyz, dxz (t2g subset).
It has been established that the ability of ligands to cause a large splitting of the energy between the orbitals is essentially independent of the metal ion and the SPECTROCHEMICAL SERIES is a list of ligands ranked in order of their ability to cause large orbital separations.
< NCS- < EDTA4- < NH3 ~ pyr ~ en < bipy < phen < CN- ~ CO When metal ions that have between 4 and 7 electrons in the d orbitals form octahedral compounds, two possible electron distributions can occur. These are referred to as either weak field - strong field or high spin - low spin configurations. Take for example, Fe2+- d6.
The diagram on the left represents the case for the aqua ion (small ∆, t2g
4eg2) and on the right that
of the hexacyano ion (large ∆, t2g6).
What this means is that if we use a technique that can detect the presence of unpaired electrons in each compound, then for the first we should find 4, while in the latter none. This accounts for the names high spin compared to low spin. The terms weak field, strong field give an indication of the splitting abilities of the ligand. Water always give rise to small splittings of the enregy of the d orbitals for first row transition metal ions and hence is referred to as a weak field ligand. Conversely, CN- is a strong field ligand, since it causes large splittings of the energy of the d-orbitals.
A simple JAVA applet that shows the electronic configuration for octahedral and tetrahedral complexes and calculates the spin-only magnetic moment is available.
One method of determining the number of unpaired electrons is by looking at the magnetic properties of the compounds. A simple technique to determine a magnetic moment (the GOUY METHOD) involves weighing the sample in the presence and absence of a strong magnetic field. By careful calibration using a known standard, such as Hg[Co(SCN)4] the number of unpaired electrons can be determined.
To predict the magnetic moment, we can use the simple spin-only formula:
µ = √[4S(S+l)] Bohr Magneton (BM) where S is the spin quantum number (1/2 for each unpaired electron). An alternative representation is: µ = √[n(n+2)] Bohr Magneton (BM) where n is the number of unpaired electrons. These simple formulae give good results for most first row transition metal compounds and can be refined to include orbital contributions (COVERED IN MORE DETAIL IN CHEM2101.
It is expected that all students will be able to calculate the spin-only magnetic moment of any coordination compound. To do this, you must know the number of d-electrons in the central metal ion, the stereochemistry and whether weak field-strong field considerations are necessary.
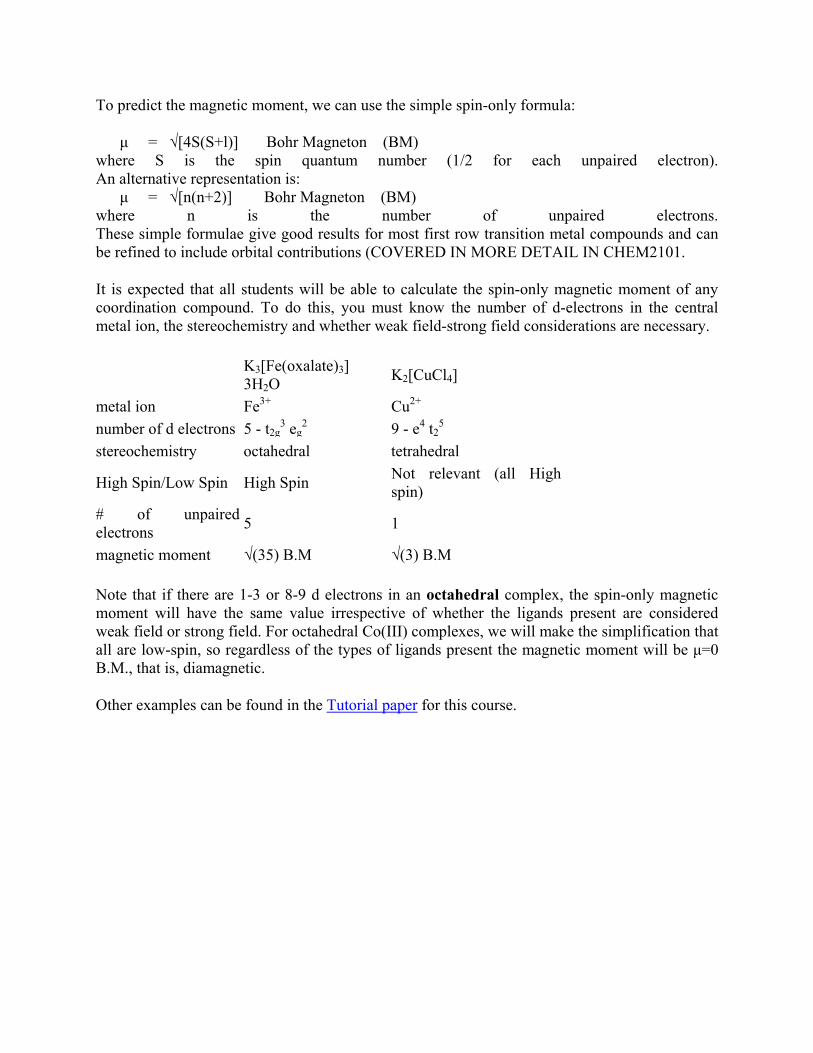
K3[Fe(oxalate)3] 3H2O K2[CuCl4]
metal ion Fe3+ Cu2+ number of d electrons 5 - t2g
3 eg2 9 - e4 t2
5 stereochemistry octahedral tetrahedral
High Spin/Low Spin High Spin Not relevant (all High spin)
# of unpaired electrons 5 1
magnetic moment √(35) B.M √(3) B.M Note that if there are 1-3 or 8-9 d electrons in an octahedral complex, the spin-only magnetic moment will have the same value irrespective of whether the ligands present are considered weak field or strong field. For octahedral Co(III) complexes, we will make the simplification that all are low-spin, so regardless of the types of ligands present the magnetic moment will be µ=0 B.M., that is, diamagnetic.
Other examples can be found in the Tutorial paper for this course.