21
PASSENGER O-D TRIP TABLE FROM FAREBOX RECEIPTS Kelly Chan [email protected] 2013 GIS in Transit Conference, October 16, 2013
| Date post: | 15-Dec-2015 |
| Category: |
Documents |
| Upload: | travis-richmond |
| View: | 215 times |
| Download: | 1 times |

PASSENGER O-D TRIP TABLE FROM FAREBOX
RECEIPTSKelly Chan
2013 GIS in Transit Conference, October 16, 2013


Up-Down method for trip length < 0.5% adult passengers, ~ 3% student passengers Richardson, AJ (2003). “Estimating Average Distance Travelled from Bus Boarding Counts.” Paper presented at
the 82nd Annual Meeting of the Transportation Research Board, Washington, DC. The Urban Transport Institute.
Société de transport de l’Outaouais (STO, Gatineau, Québec) 66% success Trépanier, M, Tranchant, N, and Chapleau, R (2007). “Individual Trip Destination Estimation in a Transit Smart
Card Automated Fare Collection System,” Journal of Intelligent Transportation System, 11: 1, 1-14.
Barry JJ, Freimer R, and Slavin H (2009). “Use of Entry-Only Automatic Fare Collection Data to Estimate Linked Transit Trips in New York City,” Transportation Research Record: Journal of the Transportation Research Board, No 2112, pp. 53-61.

Data sources for trip table
On-Board SurveyIntercept Interviews
Passenger CountManual CountingAutomated Counting
• Approximately 2,500 trips per day • (6 am ― 3 pm)
• Approximately 500 buses• Approximately 2,000 – 3,000 staff-hours to
have 70% coverage

Farebox Data

Data warehouse
DATE TIME BUS ROUTE DIR TRIP STOP FARE TYPE PASS ID
FAREBOX:
ROUTE DIR PATTERN LENGTH
STOP ID RTE DIR PATT LAT LONG
ROUTES:
STOPS:
GIS Data:

How to build a trip table
On-Board SurveyExpensiveInfrequentTime consumingSmall sample size
APC (Automated Passenger Counts)Trip ends not connected
Farebox Records–Origins only–Time of boardings–Location of boardings–Linkages of other data–Thousands of records per day

Origins (PASS) from farebox
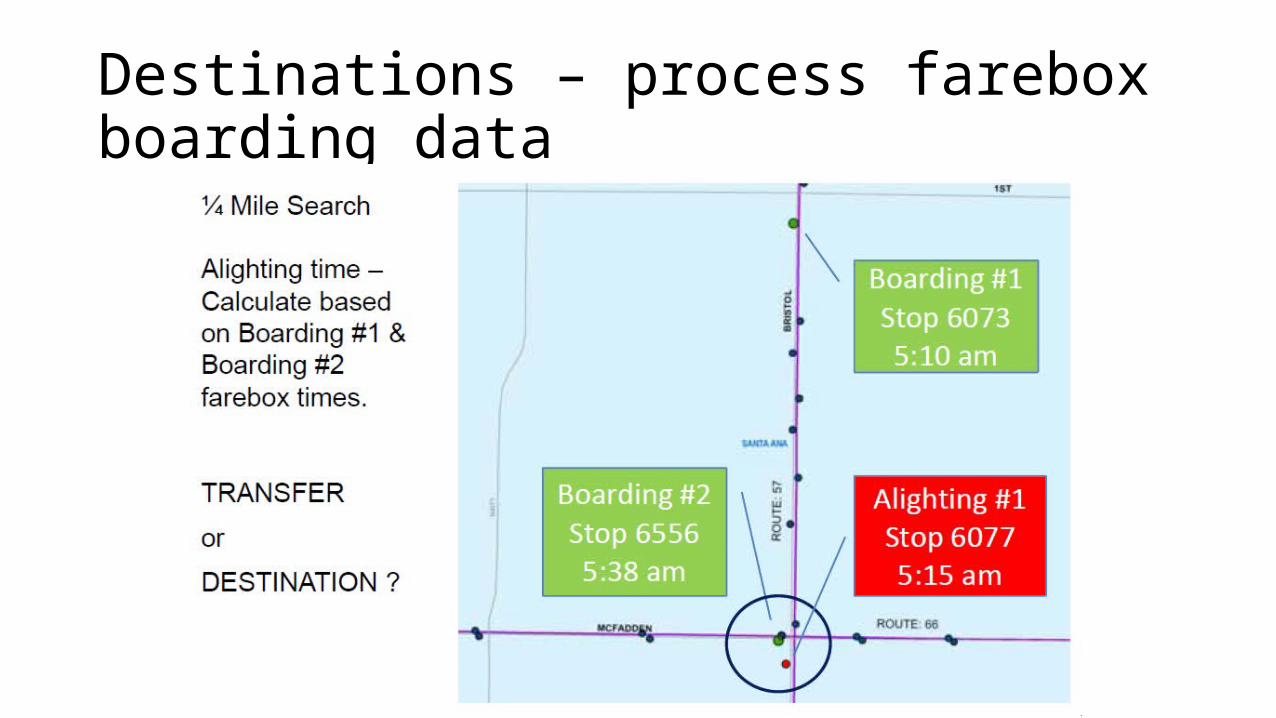
Destinations – process farebox boarding data

DistanceOpportunitiesElapsed Time

Unlinked Origins & destinations

1 2 3 4 5 6 7 8 9 10 11 12 13 14 15 16 17 18 19 20 21 22 230
20,000
40,000
60,000
80,000
100,000
120,000
140,000
160,000
180,000
200,000
10%
20%
30%
40%
50%
60%
70%
80%
90%
Total Boardings Boardings with Bus Pass Identified O-D Trips Success Rate


OCTA Advantages:Data availability
• 365 days, 24 hr/day, Free data (collected anyway)
Operational practicality
Demographics and socio-economic dataAutomobile OwnershipActivitiesTrip purposesMode Choices
Multi-modal “park-and-ride” Inter-system transfers

Jim Sterling, [email protected] Chan, [email protected]@hdrinc.com


