19
Tata Institute of Fundamental Research, Mumbai. Passive and Active cosmic ray shield for low background measurements with HPGe detector. A.Thirunavukarasu 30/11/2009

Tata Institute of Fundamental Research, Mumbai.
Passive and Active
cosmic ray shield for low
background
measurements with HPGe
detector.
A.Thirunavukarasu 30/11/2009
30/11/2009 Report on the project of shielding the HPGe detector
Tata Institute of Fundamental Research, Mumbai. A.Thirunavukarasu
2
Passive and Active cosmic ray shield for low background
measurements with HPGe detector
Introduction:
Gamma-ray spectrometry with a high-purity germanium (HPGe) detector is widely used for
the identification and activity measurements of radionuclides in a sample, impurity checks of a standard
source, determination of emission probabilities in radioactive decay, and low-level counting’s. In low-level
counting’s, a variety of techniques to reduce the background have been employed and makes it possible to
radio assay an environmental sample containing a trace of gamma-emitting radionuclides. Here in this
project we are making an active cosmic veto and passive lead shielding for HPGe detector to reduce the
background radiations.
Preliminary study of components used:
In this experiment we used many electronic components and detector components. In this
section some of the components are described in detail regarding their working, performance characteristic
etc. A scintillator is material which exhibits the property of luminescence when excited by ionizing radiation.
Luminescent materials, when struck by an incoming particle, absorb its energy and scintillate i.e. Re emit the
absorbed energy in the form of a small flash of light, typically in the visible range. If it is made of plastic then
it is called plastic scintillator (hereafter it is called as simply scintillator).
The advantage of these scintillators is:
1) The decay time of the induced luminescence is very short so that fast pulse can
be generated.
2) The medium is transparent in the optical region and hence ensures good light collection.
3) The refractive index is close to that of glass and this permits efficient coupling to the
photomultiplier tube.
In order to make the scintillator to be used for proper scientific studies, we need to couple a
photo multiplier (PMT) tube on the sides of scintillator. This PMT absorbs the light emitted by the scintillator
and converts into pulse signal with the help of High voltage (HV) given as input (The HV applied is in the
range of 0 to -2Kv). This HV is applied to the HV input of the PMT and its necessary because it accelerates
the electrons produced by photoelectric effect on the PMT. Fig-1 clearly indicates the process in a
scintillation detector.

30/11/2009 Report on the project of shielding the HPGe detector
Tata Institute of Fundamental Research, Mumbai. A.Thirunavukarasu
3
Fig-1: Process in a scintillator and Photo multiplier tube.
In this project as a first step, we analyzed the timing pulse characteristic of the scintillator as a
function of HV with the help of cobalt 60 source placed on the bar. Before that we studied the PMT parts and
coupled the scintillator(square bar) with one PMT on both sides after doing the initial preparations(i.e.
cleaning the surfaces of scintillator and PMT,wrapping white(inside) and black(outside) sheet on the sides of
the scintillator).
The PMT has 2 HV inputs (Both connected internally for cascading mode), 2 Anode and Di-
node output. For setting up the circuit the HV is applied to the HV input terminal and the Anode is connected
to the input of the oscilloscope.
Then both the PMT are biased individually and analyzed.
For PMT-A: (PMT-A & PMT-B are just for identification)
Table 1a: Pulse height variation as a function of applied voltage for PMT-A.
30/11/2009 Report on the project of shielding the HPGe detector
Tata Institute of Fundamental Research, Mumbai. A.Thirunavukarasu
4
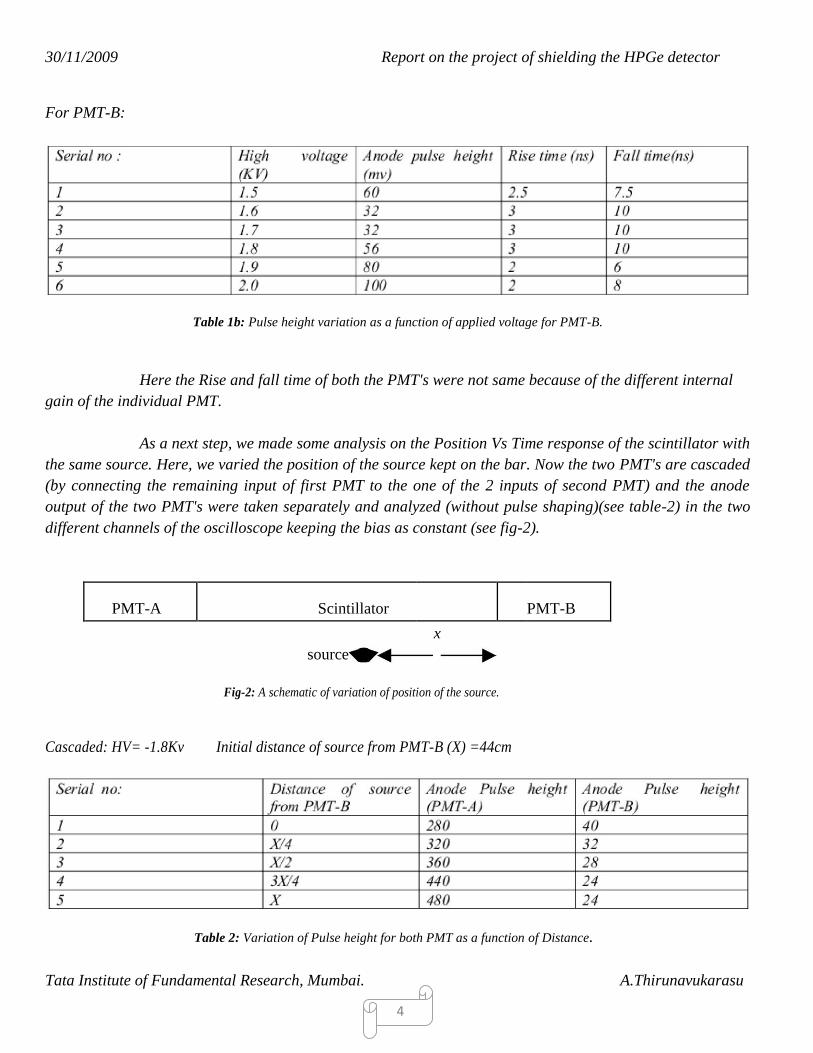
For PMT-B:
Table 1b: Pulse height variation as a function of applied voltage for PMT-B.
Here the Rise and fall time of both the PMT's were not same because of the different internal
gain of the individual PMT.
As a next step, we made some analysis on the Position Vs Time response of the scintillator with
the same source. Here, we varied the position of the source kept on the bar. Now the two PMT's are cascaded
(by connecting the remaining input of first PMT to the one of the 2 inputs of second PMT) and the anode
output of the two PMT's were taken separately and analyzed (without pulse shaping)(see table-2) in the two
different channels of the oscilloscope keeping the bias as constant (see fig-2).
PMT-A Scintillator PMT-B
source
x
Fig-2: A schematic of variation of position of the source.
Cascaded: HV= -1.8Kv Initial distance of source from PMT-B (X) =44cm
Table 2: Variation of Pulse height for both PMT as a function of Distance.

30/11/2009 Report on the project of shielding the HPGe detector
Tata Institute of Fundamental Research, Mumbai. A.Thirunavukarasu
5
After this we did some pulse shaping exercises to get familiarize with pulse shaping procedure.
In this exercise the anode output of the PMT- A is send to Timing filter amplifier (TFA) and from there to
CFD and to the start of the TAC. Similarly for the PMT-B the anode output was send to the TFA and from
there to constant fraction discriminator (CFD) and to the stop of the Time to analog converter (TAC) through
a delay. Now the output of the TAC was connected to the Analog to digital converter (ADC) and then to data
acquisition system (DAQ). Here both the PMT connections up-to TAC were separate. At TAC for analyzing
the signals the output (second output of TAC) was connected to the oscilloscope and the pulse was analyzed
for different integrators and differentiator values (see table-3).
The circuit connection looks as follows:
Fig-3: A block diagram of timing characteristics of the plastic scintillator.
Table 3: Variation of Pulse height,rise time decay time for different differentiator and integrator
values.
Then we moved to constant fraction discriminator. A discriminator circuit selects the
minimum pulse height above threshold and when the input pulse height exceeds the discriminator preset level,
the discriminator generates an output.
Anode TFA Linear Discriminator
30/11/2009 Report on the project of shielding the HPGe detector
Tata Institute of Fundamental Research, Mumbai. A.Thirunavukarasu
6
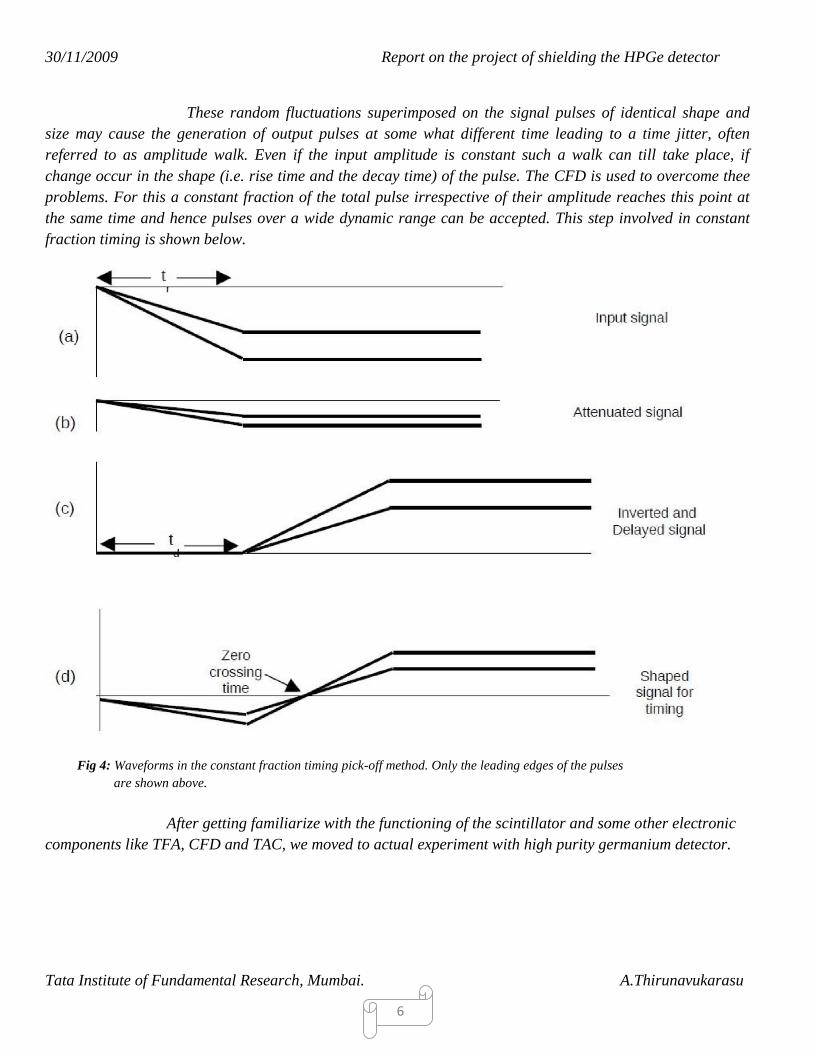
These random fluctuations superimposed on the signal pulses of identical shape and
size may cause the generation of output pulses at some what different time leading to a time jitter, often
referred to as amplitude walk. Even if the input amplitude is constant such a walk can till take place, if
change occur in the shape (i.e. rise time and the decay time) of the pulse. The CFD is used to overcome thee
problems. For this a constant fraction of the total pulse irrespective of their amplitude reaches this point at
the same time and hence pulses over a wide dynamic range can be accepted. This step involved in constant
fraction timing is shown below.
Fig 4: Waveforms in the constant fraction timing pick-off method. Only the leading edges of the pulses
are shown above.
After getting familiarize with the functioning of the scintillator and some other electronic
components like TFA, CFD and TAC, we moved to actual experiment with high purity germanium detector.
30/11/2009 Report on the project of shielding the HPGe detector
Tata Institute of Fundamental Research, Mumbai. A.Thirunavukarasu
7
Experimental details:
A germanium semiconductor detector is a device that uses a germanium semiconductor to
detect traversing charged particles or the absorption of photons. In the field of particle physics, these
detectors are usually known as germanium detectors.
Germanium detectors are mostly used for spectroscopy in nuclear physics. Germanium can
have a depleted, sensitive thickness of centimeters, and therefore can be used as a total absorption detector
for gamma rays up to few MeV. These detectors are also called High-Purity Germanium detectors (HPGe) or
Hyper pure Germanium detectors.
Germanium detectors are semiconductor diodes having a p-n structure in which the intrinsic
region is sensitive to ionizing radiation, particularly x rays and gamma rays. Under reverse bias, an electric
field extends across the intrinsic or depleted region. When photons interact with the material within the
depleted region of the detector, charge carriers (holes and electrons) are produced and these are swept by the
electric field to the p and n electrodes. This charge, which is in proportion to the energy deposited in the
detector by the incoming photon, is converted into a voltage pulse by an integral charge sensitive
preamplifier. These detectors have good energy resolutions but poor timing resolution.
The major drawback of Germanium detectors is that they must be cooled to liquid nitrogen
temperatures to produce spectroscopic data. At higher temperatures, the electrons can easily cross the Band
gap in the crystal and reach the conduction band, where they are free to respond to the electric field. The
system therefore produces too much electrical noise to be useful as a spectrometer. Cooling to liquid nitrogen
temperatures, 77.36 K reduces thermal excitations of valence electrons so that only a gamma ray interaction
can give an electron the energy necessary to cross the band gap and reach the conduction band.
To start with the cooling of the detector, it is first flushed out with dry nitrogen gas for about 1
hour. After that liquid nitrogen is to be filled in the detector. Thereon the detector should be kept cooled to
liquid nitrogen temperature till the experiment get over. This is done by filling liquid nitrogen in the detector
at an interval of every 12 hours (Care should be taken to avoid the warm up of detector and also while
filling). Once the experiment gets over the detector can be warmed up to room temperature.
In the germanium part of this project as a first step, we calibrated the energy corresponding to
channels with the help of standard cobalt- 60 and Europium -152 source. For doing this we made the circuit
as shown in the fig-5 (Note: The signal voltage to ADC should not exceed 10V). Here we adjusted the
amplifier gain in such a manner that 10V input to ADC will correspond to 3MeV of particle energy. Then
using the LAMPS software we collected the data for 15 minutes individually for both the cobalt and europium
source and stored it separately.
30/11/2009 Report on the project of shielding the HPGe detector
Tata Institute of Fundamental Research, Mumbai. A.Thirunavukarasu
8
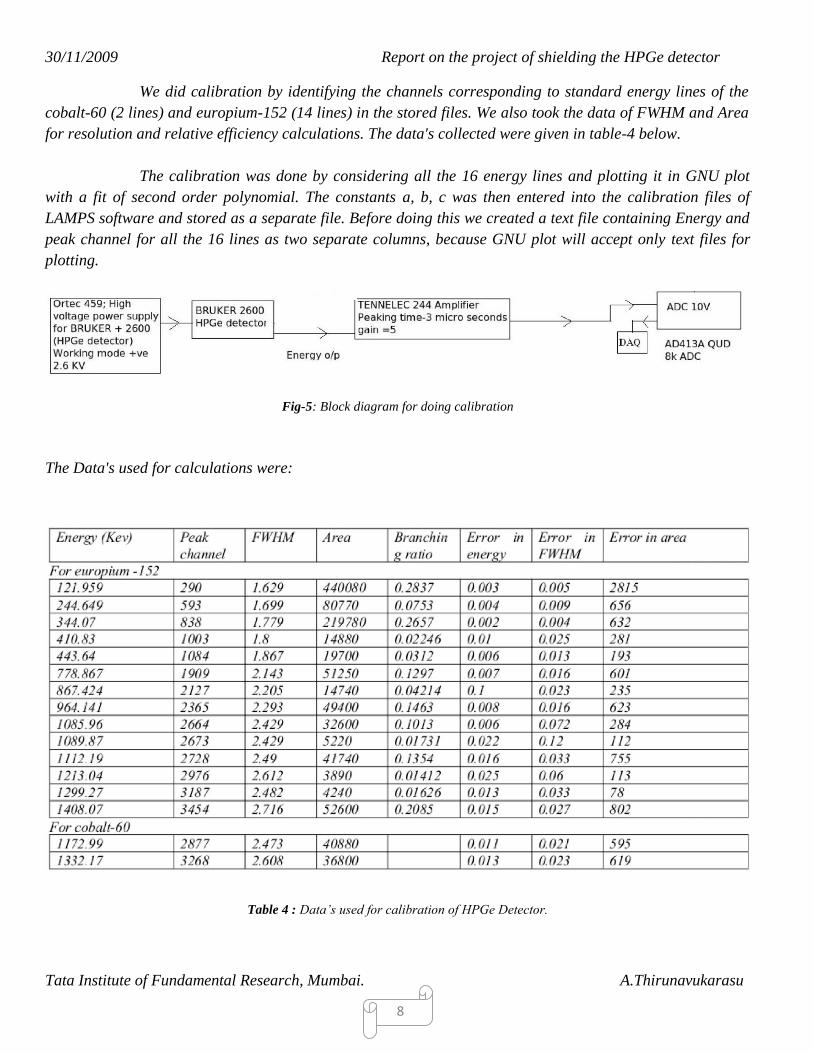
We did calibration by identifying the channels corresponding to standard energy lines of the
cobalt-60 (2 lines) and europium-152 (14 lines) in the stored files. We also took the data of FWHM and Area
for resolution and relative efficiency calculations. The data's collected were given in table-4 below.
The calibration was done by considering all the 16 energy lines and plotting it in GNU plot
with a fit of second order polynomial. The constants a, b, c was then entered into the calibration files of
LAMPS software and stored as a separate file. Before doing this we created a text file containing Energy and
peak channel for all the 16 lines as two separate columns, because GNU plot will accept only text files for
plotting.
Fig-5: Block diagram for doing calibration
The Data's used for calculations were:
Table 4 : Data’s used for calibration of HPGe Detector.
30/11/2009 Report on the project of shielding the HPGe detector
Tata Institute of Fundamental Research, Mumbai. A.Thirunavukarasu
9
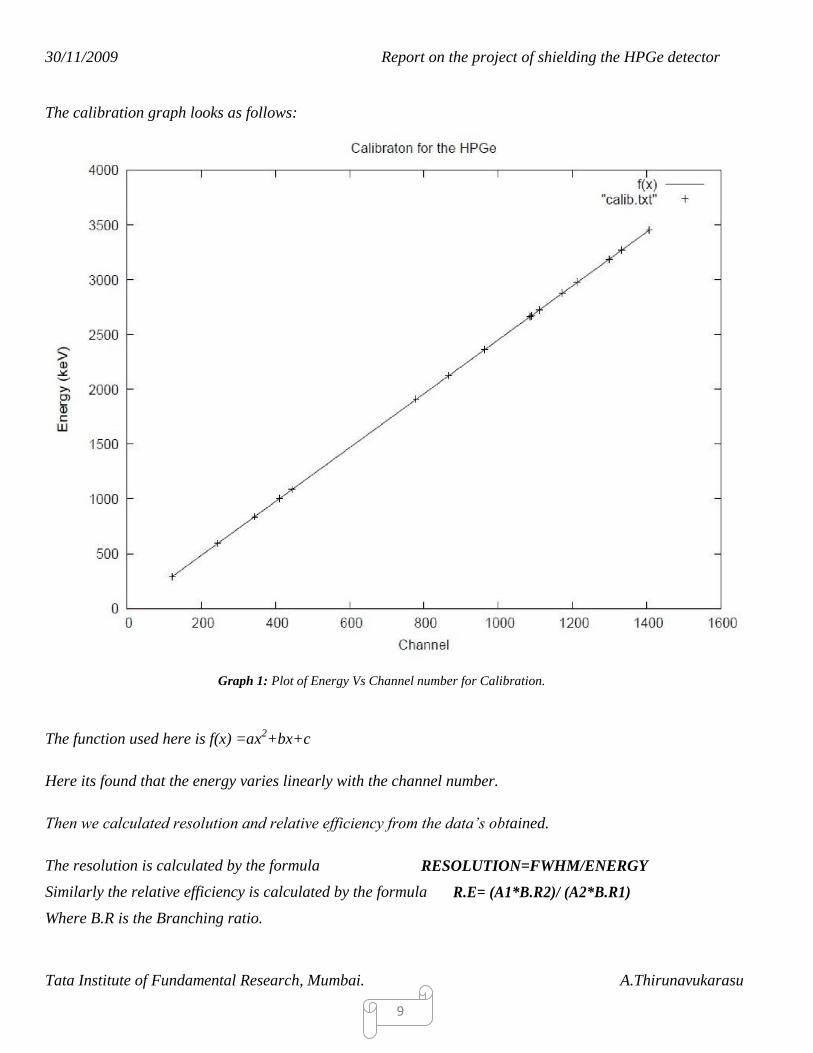
The calibration graph looks as follows:
Graph 1: Plot of Energy Vs Channel number for Calibration.
The function used here is f(x) =ax2+bx+c
Here its found that the energy varies linearly with the channel number.
Then we calculated resolution and relative efficiency from the data’s obtained.
The resolution is calculated by the formula RESOLUTION=FWHM/ENERGY
Similarly the relative efficiency is calculated by the formula R.E= (A1*B.R2)/ (A2*B.R1)
Where B.R is the Branching ratio.
30/11/2009 Report on the project of shielding the HPGe detector
Tata Institute of Fundamental Research, Mumbai. A.Thirunavukarasu
10
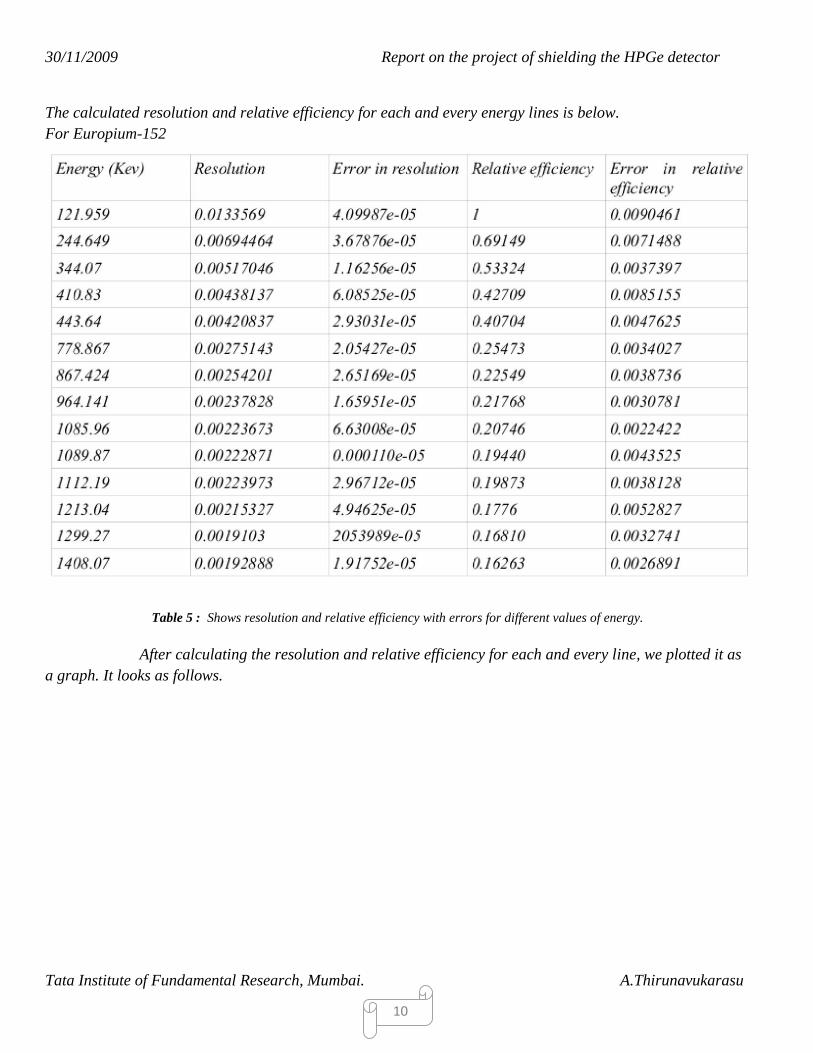
The calculated resolution and relative efficiency for each and every energy lines is below.
For Europium-152
Table 5 : Shows resolution and relative efficiency with errors for different values of energy.
After calculating the resolution and relative efficiency for each and every line, we plotted it as
a graph. It looks as follows.

30/11/2009 Report on the project of shielding the HPGe detector
Tata Institute of Fundamental Research, Mumbai. A.Thirunavukarasu
11
Energy Vs Relative efficiency:
Graph 2: Plot of Relative efficiency Vs Energy.
The function used for this fit is f(x) = (a/x2) + (b/x) +c
In general for any detector we know that the efficiency will decrease with an increase in energy. Here also we
noted from the graph that the efficiency decreases with increase in energy.

30/11/2009 Report on the project of shielding the HPGe detector
Tata Institute of Fundamental Research, Mumbai. A.Thirunavukarasu
12
Energy Vs Resolution:
Graph 3: Plot of Resolution Vs Energy.
The function used for this fit is f(x) = ) + b.
Here we noted that the resolution of the detector decreases with increase in energy. This implies that the
detector can better resolve two or more energy lines having little difference in their energy.
30/11/2009 Report on the project of shielding the HPGe detector
Tata Institute of Fundamental Research, Mumbai. A.Thirunavukarasu
13
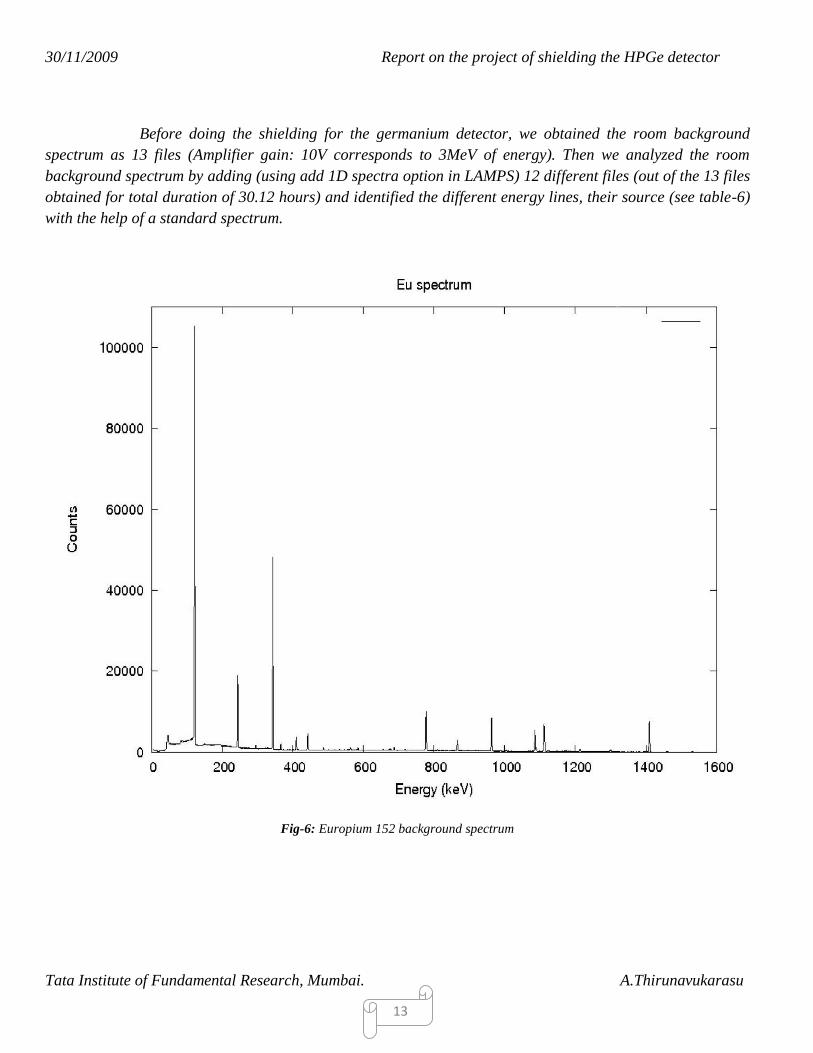
Before doing the shielding for the germanium detector, we obtained the room background
spectrum as 13 files (Amplifier gain: 10V corresponds to 3MeV of energy). Then we analyzed the room
background spectrum by adding (using add 1D spectra option in LAMPS) 12 different files (out of the 13 files
obtained for total duration of 30.12 hours) and identified the different energy lines, their source (see table-6)
with the help of a standard spectrum.
Fig-6: Europium 152 background spectrum

30/11/2009 Report on the project of shielding the HPGe detector
Tata Institute of Fundamental Research, Mumbai. A.Thirunavukarasu
14
The different energy lines and their sources are tabulated below.
Table 6: Shows Different energy lines and their sources.
Then the 12 files are added into a single file and stored in a different file name.
30/11/2009 Report on the project of shielding the HPGe detector
Tata Institute of Fundamental Research, Mumbai. A.Thirunavukarasu
15
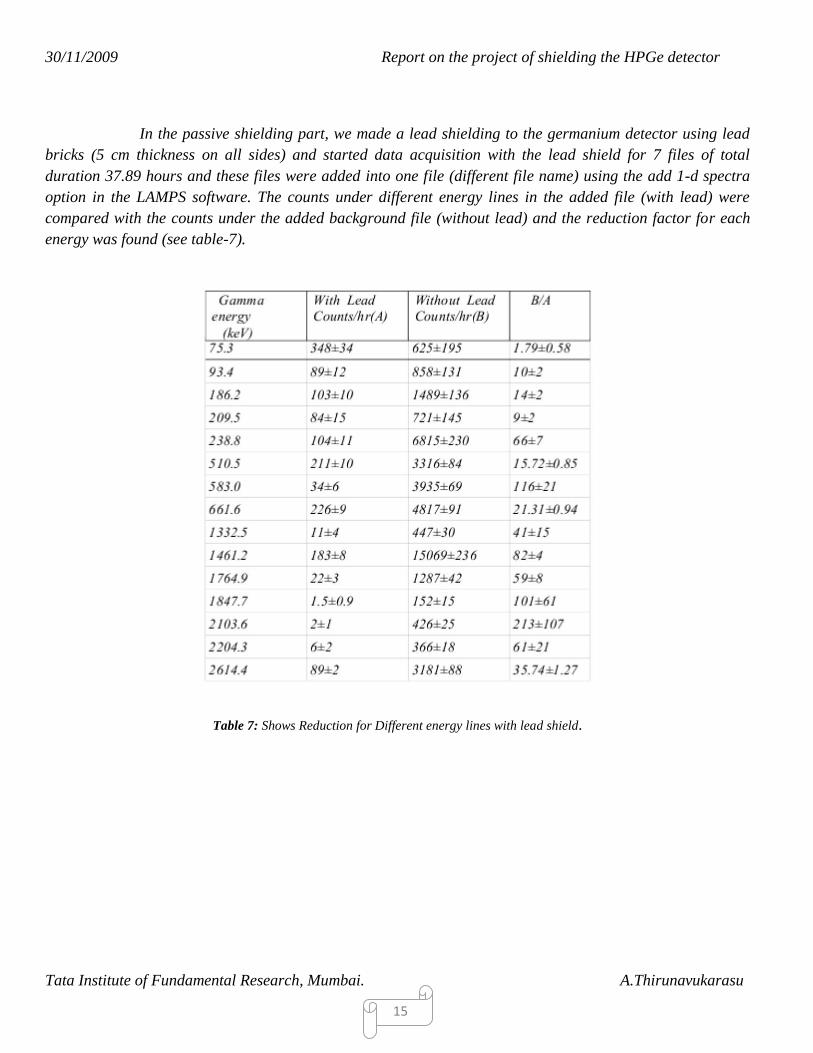
In the passive shielding part, we made a lead shielding to the germanium detector using lead
bricks (5 cm thickness on all sides) and started data acquisition with the lead shield for 7 files of total
duration 37.89 hours and these files were added into one file (different file name) using the add 1-d spectra
option in the LAMPS software. The counts under different energy lines in the added file (with lead) were
compared with the counts under the added background file (without lead) and the reduction factor for each
energy was found (see table-7).
Table 7: Shows Reduction for Different energy lines with lead shield.
30/11/2009 Report on the project of shielding the HPGe detector
Tata Institute of Fundamental Research, Mumbai. A.Thirunavukarasu
16
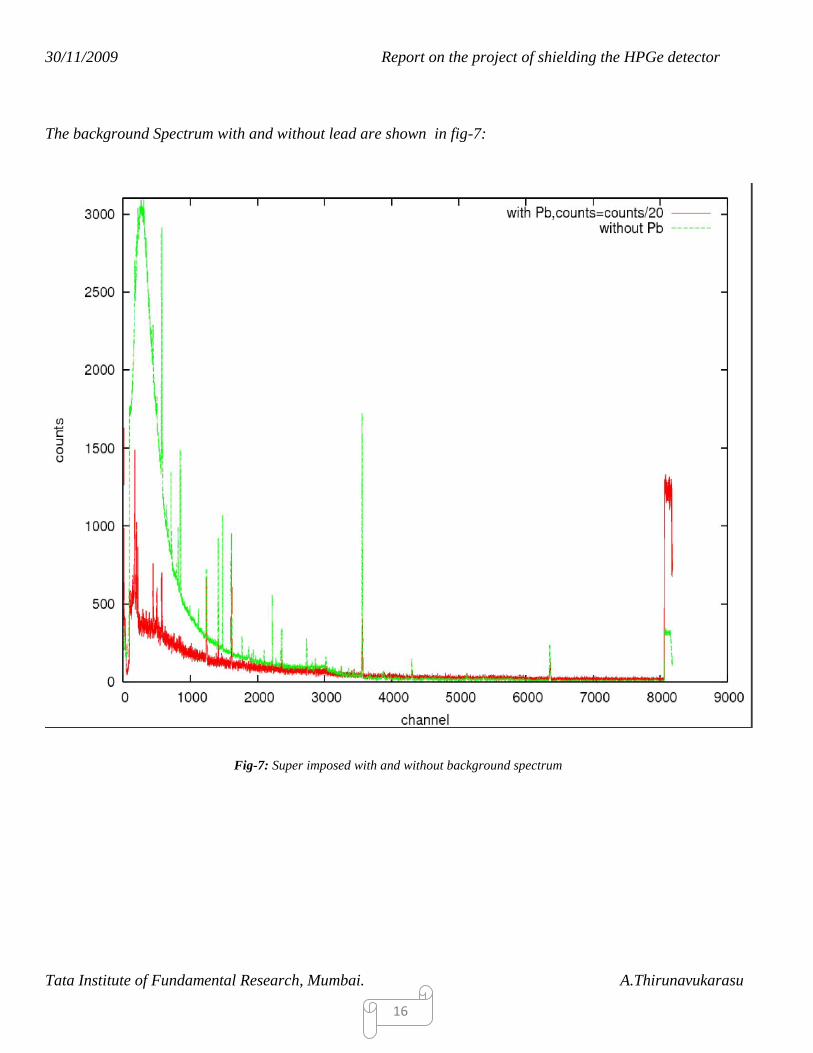
The background Spectrum with and without lead are shown in fig-7:
Fig-7: Super imposed with and without background spectrum

30/11/2009 Report on the project of shielding the HPGe detector
Tata Institute of Fundamental Research, Mumbai. A.Thirunavukarasu
17
In the active shielding part of this project, we set up a veto shield to the HPGe detector
with the help of plastic scintillator and a PMT. In this set up the scintillator is kept on the top of the
germanium detector (without touching the detector) with the help of supports. The basic thing here is that we
provided an Anti-coincidence logic (i.e. If we get signals on both the scintillator and detector then we want to
neglect that counts because these particles are high energy cosmic ray muon's and if we get signal only in
HPGe detector then we have taken that count into account). This Anti- coincidence logic is set up with the
help of basic gates like AND, OR, NOT. In order to achieve this we made the circuit as shown in fig-8.
Fig-8: Block diagram for anti-coincidence set-up.
After doing all the preliminary adjustments like pole zero settings and width settings, we
started the background data acquisition (with veto enabled) in batch file mode for 9 files of total duration
29.79 hours. Similarly after completing this we did data acquisition for background with veto disabled in
batch file mode for 4 files of total duration 6.33 hours. Initially in active shielding part the amplifier gain was
adjusted, such that 10V to ADC will correspond to 12Mev of energy. We did this in order to detect the high
energy rays in the background.
In the next step these files (with veto enabled) were added (Care should be taken for shifts of
energy line in different files) to one single file with the help of add 1-d spectra option present in LAMPS
software and saved in a different file. Similarly veto disabled files were also added and stored in a different
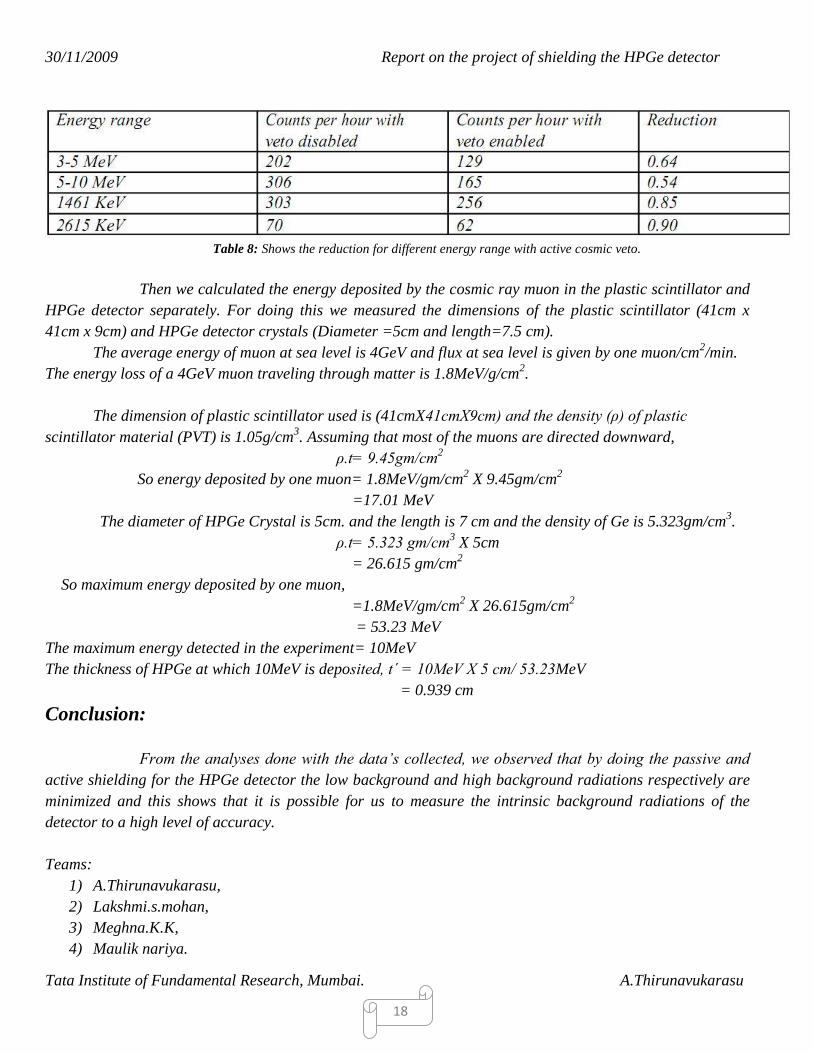
file name. Then the counts for the energy range of 3-5 Mev, 5-10 Mev, and for the energy lines of 1461, 2615
were normalized to per hour counts and compared for veto enabled and veto disabled spectrum (see table-8).
30/11/2009 Report on the project of shielding the HPGe detector
Tata Institute of Fundamental Research, Mumbai. A.Thirunavukarasu
18
Table 8: Shows the reduction for different energy range with active cosmic veto.
Then we calculated the energy deposited by the cosmic ray muon in the plastic scintillator and
HPGe detector separately. For doing this we measured the dimensions of the plastic scintillator (41cm x
41cm x 9cm) and HPGe detector crystals (Diameter =5cm and length=7.5 cm).
The average energy of muon at sea level is 4GeV and flux at sea level is given by one muon/cm2/min.
The energy loss of a 4GeV muon traveling through matter is 1.8MeV/g/cm2.
The dimension of plastic scintillator used is (41cmX41cmX9cm) and the density (ρ) of plastic
scintillator material (PVT) is 1.05g/cm3. Assuming that most of the muons are directed downward,
ρ.t= 9.45gm/cm2
So energy deposited by one muon= 1.8MeV/gm/cm2 X 9.45gm/cm
2
=17.01 MeV
The diameter of HPGe Crystal is 5cm. and the length is 7 cm and the density of Ge is 5.323gm/cm3.
ρ.t= 5.323 gm/cm3 X 5cm
= 26.615 gm/cm2
So maximum energy deposited by one muon,
=1.8MeV/gm/cm2 X 26.615gm/cm
2
= 53.23 MeV
The maximum energy detected in the experiment= 10MeV
The thickness of HPGe at which 10MeV is deposited, t΄ = 10MeV X 5 cm/ 53.23MeV
= 0.939 cm
Conclusion:
From the analyses done with the data’s collected, we observed that by doing the passive and
active shielding for the HPGe detector the low background and high background radiations respectively are
minimized and this shows that it is possible for us to measure the intrinsic background radiations of the
detector to a high level of accuracy.
Teams:
1) A.Thirunavukarasu,
2) Lakshmi.s.mohan,
3) Meghna.K.K,
4) Maulik nariya.
30/11/2009 Report on the project of shielding the HPGe detector
Tata Institute of Fundamental Research, Mumbai. A.Thirunavukarasu
19
References:
1) “Radiation detection and measurements” by Glenn F. Knoll, Wiley India Edition 2000.
2) “Techniques for nuclear and particle physics experiments: a-how-to approach” by William R. Leo.
Narosa publishing house, New Delhi.
3) F.Pointurier, J.Laurec, X.Blachard and A.Adam, APPL, Radiat Isot vol.47 No-9/10, pp-1043-
1048,1996


