1 Florida Onsite Sewage Nitrogen Reduction Strategies Study Passive Nitrogen Reduction System Life Cycle Cost Analysis Tool (PNRS LCCA) User Guide Prepared for: Florida Department of Health Division of Environmental Health Bureau of Onsite Sewage Programs 4042 Bald Cypress Way Bin #A-08 Tallahassee, FL 32399-1713 April 2015 Prepared by: In Association With:
Transcript
1
Florida Onsite Sewage Nitrogen Reduction Strategies Study
Passive Nitrogen Reduction System Life Cycle
Cost Analysis Tool (PNRS LCCA)
User Guide
Prepared for:
Florida Department of Health Division of Environmental Health
Bureau of Onsite Sewage Programs 4042 Bald Cypress Way Bin #A-08
Tallahassee, FL 32399-1713
April 2015
Prepared by:
In Association With:
2
Table of Contents
Page
Objective of Report ............................................................................................................... 3
The passive nitrogen reduction system life cycle cost analysis (PNRS LCCA) tool is a
computer spreadsheet tool that estimates the life cycle costs of passive nitrogen removal
systems for onsite wastewater treatment as well as conventional onsite wastewater treatment
and disposal systems (OSTDS). The user specifies a desired nitrogen removal efficiency
range, and PNRS LCCA provides selections for treatment processes that achieve the
selected nitrogen removal range and estimates the costs to meet the selected nitrogen
removal efficiency. PNRS LCCA includes built in cost estimates for both conventional
treatment systems (primary treatment + soil treatment and dispersal) as well as passive
nitrogen removal systems (PNRS). PNRS LCCA also can provide cost estimates for the
addition of saturated (Stage 2) biofilters to an existing nitrification treatment unit. This
report summarizes the background of PNRS LCCA, describes the structure of the model,
and provides a user guide for model application. Although the default system sizing and
cost data in PNRS LCCA are based on the OSTDS code and costs in Florida, the tool allows
user specific inputs which allow its use elsewhere, with some limitations.
PNRS LCCA Background
Passive nitrogen removal systems (PNRS) are 2-stage biofilter systems that enhance
nitrogen removal from onsite wastewater through a combination of unsaturated biofilters for
ammonia oxidation (Stage 1) and saturated biofilters with reactive media for denitrification
(Stage 2). PNRS systems increase total nitrogen removal over conventional systems, which
consist of primary treatment (i.e. septic tank) followed by a soil treatment unit. Passive two-
stage nitrogen removal has been experimentally evaluated in the PNRS I bench-scale
studies, PNRS II pilot studies, and in seven full-scale systems at individual home sites.
PNRS LCCA was developed to provide planning level life cycle cost estimates for various
passive two-stage nitrogen removal system options. The model includes capital and
installation costs for new systems or the addition of PNRS components to an existing
OSTDS system. The recurring annual costs for operation, maintenance, and compliance are
also included in the model. The costs of conventional treatment as well as the total costs for
conventional + PNRS treatment are provided.
Overall Model Structure
The PNRS LCCA is a spreadsheet consisting of a series of linked worksheets. The general
flow of PNRS LCCA deployment is summarized here. The user first specifies the
wastewater quantity based on building size and occupancy for the site, as per Florida code
(FAC 64E-6.008 Table I). The next step is to choose one of three levels of nitrogen removal
that are available for the site. Information is then entered on the characteristics of the
existing conventional treatment system including primary treatment and soil treatment and
dispersal systems, on general site characteristics that impact PNRS installation, on recurring
costs for operation, maintenance, and compliance, and net discount rate for cost projections.
4
The user then specifies the specific PNRS system for which life cycle costs will be
estimated.
PNRS LCCA then provides default cost estimates for conventional onsite treatment and
conventional + PNRS. Default cost estimates include capital and recurring costs and are
based on built-in algorithms. PNRS LCCA summarizes the default costs and presents the
user with the option to override LCCA default costs with user specified costs. Present
Worth analysis is applied to all costs, and PNRS LCCA provides a summary and breakout of
life cycle costs for conventional treatment, and total system of conventional + PNRS. PNRS
LCCA also calculates the dollar cost per mass of nitrogen removed. Results are presented in
tables that include treatment technology characteristics, individual and summarized cost
components, and corresponding pie chart cost distributions.
PNRS LCCA Worksheets
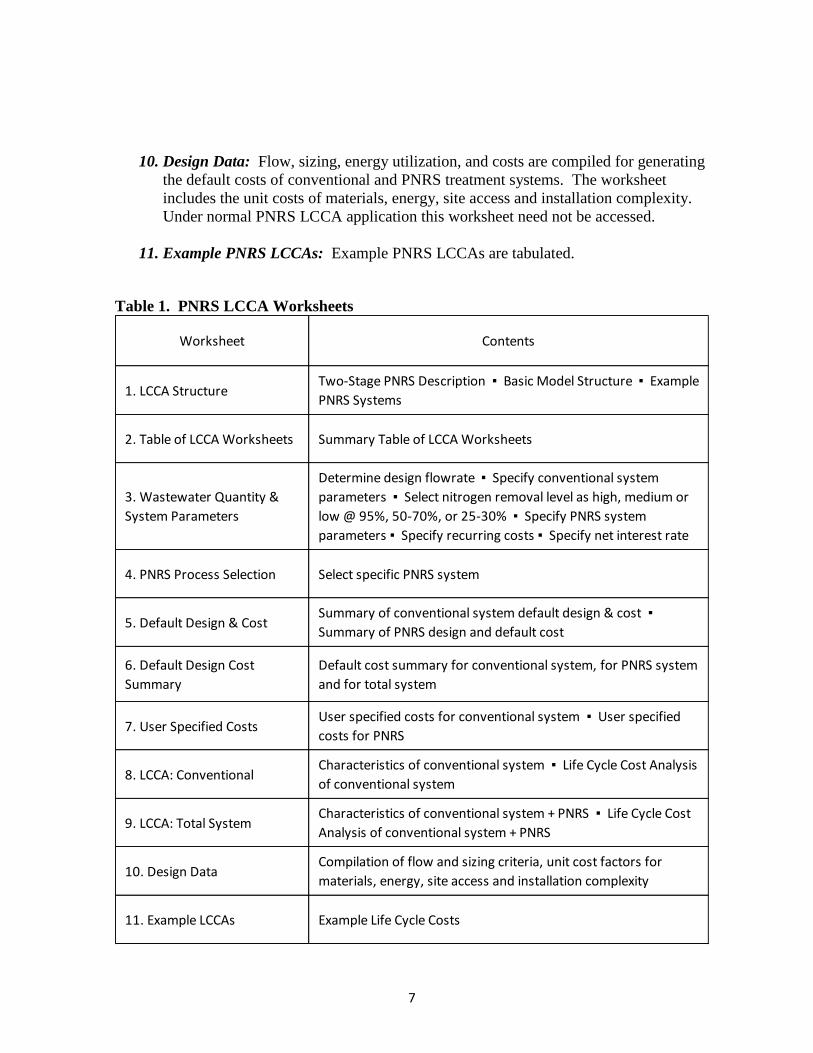
The individual PNRS LCCA worksheets are listed in Table 1. Some attributes of the PNRS
LCCA model and worksheets are described here, as well as caveats for use.
1. LCCA Structure: A description of passive two-stage biofiltration processes is
presented along with major design factors and example systems that have been
evaluated at individual home sites. Conventional treatment (primary + soil treatment
and dispersal) can reduce total nitrogen by 25-35%, and is assigned a total nitrogen
removal of 30% (Low Level) in PNRS LCCA. Stage 1 systems alone will nitrify
wastewater and if recirculation is provided can provide 50 to 70% total nitrogen
removal (Medium Level). Also, several of the simple in-ground system designs can
achieve similar reductions in total nitrogen. A 60% TN removal rate is thus assigned
for Medium Level systems. Adding Stage 2 biofilter systems will denitrify
wastewater further and can increase total nitrogen removal to a High Level (95%)
provided that they are preceded by highly effective nitrification and include a soil
treatment unit for effluent dispersal.
2. Table of LCCA Worksheets: A tabular summary is provided of the salient features
of each PNRS LCCA worksheet.
3. Wastewater Quantity and System Parameters: The user specifies building area and
number of bedrooms, which determine the design wastewater flowrate. For the
conventional system (primary treatment + soil treatment and dispersal), the primary
tank (and pump tank, if needed) is sized according to Florida Administrative Code
(FAC 64E-6.008).
The level of nitrogen treatment is selected from options of low, medium and high,
with respective total nitrogen removals of 30, 60 and 95% used for calculations.
Following the level of treatment selection, the applicable input fields are highlighted
blue.
5
Data is then entered for usable pre-existing primary tankage, configuration of soil
dispersal, surface loading rate, and depth to seasonal high water table. The soil
treatment unit is sized according to the user defined configuration and surface
loading rate (using FAC 64E-6.008 Table III for guidance). The depth to seasonal
high water table determines if a mound system is needed.
Site data is entered which affect PNRS installation including: if the onsite sewage
treatment and disposal system (OSTDS) is a new installation or retrofit to an existing
system to enhance nitrogen removal, if an existing fully nitrifying aerobic process
(Stage 1 biofilter or other nitrifying unit i.e. ATU, PBTS) is already present and
usable, the construction complexity at the site (simple, moderate or complex),
topography to determine the need for a pump, if primary effluent dispersal to a Stage
1 in-ground biofilter will use a drip system, and sophistication of the control panel
(standard or complex).
Data is entered for all recurring annual operating costs including unit electrical cost,
number of inspection visits per year by maintenance entity, the operating permit fee,
and the number of water quality monitoring events per year. In addition, data is
entered for all recurring maintenance costs including primary tank pump out
frequency, media replacement frequency, and equipment replacement frequency.
Project life and net interest rate are entered for life cycle costing. Additional
guidance and/or typical values are provided in the column to the right of the input
field.
4. PNRS Process Selection: PNRS process selection specifies the PNRS process for
which life cycle costs will be estimated. All fields should be set to zero or blank
before starting the selection process. Based on the level of nitrogen treatment the
user selected in the WW Quantity & System Parameters worksheet (options of Low,
Medium and High), the user selects from the drop down menu the desired processes:
Stage 1 + Stage 2, Stage 1 only or Stage 2 only. The user selects Stage 1 only (60%
total nitrogen removal or Medium Level), Stage 2 only (95% total nitrogen removal
or High Level) which requires a fully nitrifying aerobic process be already present,
or Stage 1 + Stage 2 (95% total nitrogen removal or High Level). Example PNRS
system configurations are included in the LCCA Structure worksheet. Following the
user defined processes selection, the applicable input fields are highlighted blue.
PNRS system sub-selections are made for Stage 1 hydraulics (single pass or
recirculation), for placement of Stage 1 in a tank or in-ground, for Stage 1 media
(sand or expanded clay), and Stage 2 media (lignocellulosic material, elemental
sulfur, or dual media). The option is offered to place lignocellulosic media
underneath the Stage 1 media in a vertically stacked system. PNRS LCCA
summarizes the PNRS system specified by the user in the PNRS Process Selection
worksheet.
6
5. Default Design & Cost: PNRS LCCA determines the capital and operating costs for
conventional treatment (primary treatment + soil treatment and dispersal), PNRS
treatment, and conventional + PNRS treatment based on built-in data in the Design
Data worksheet.
The PNRS LCCA default costs have been developed for Florida conditions and are
based on analysis of the costs of multiple conventional and PNRS systems. The
default costs should be regarded as baseline estimates suitable for planning level cost
analyses and for system comparisons.
6. Default Design Cost Summary: Capital and operating costs are summarized for
conventional treatment (primary treatment + soil treatment and dispersal), PNRS
treatment, and conventional + PNRS treatment. Costs are included for individual
item costs, for system cost groupings, and for the overall systems.
7. User Specified Costs: The user has the option of entering capital and operating costs
for specific cost items that override the LCCA default costs. All orange user
specified cost entry fields should be set to zero or blank at the start of the PNRS
LCCA application. PNRS LCCA presents the default design costs along with
adjacent fields for entering user specified cost, along with the costs that will be used
for life cycle cost analysis.
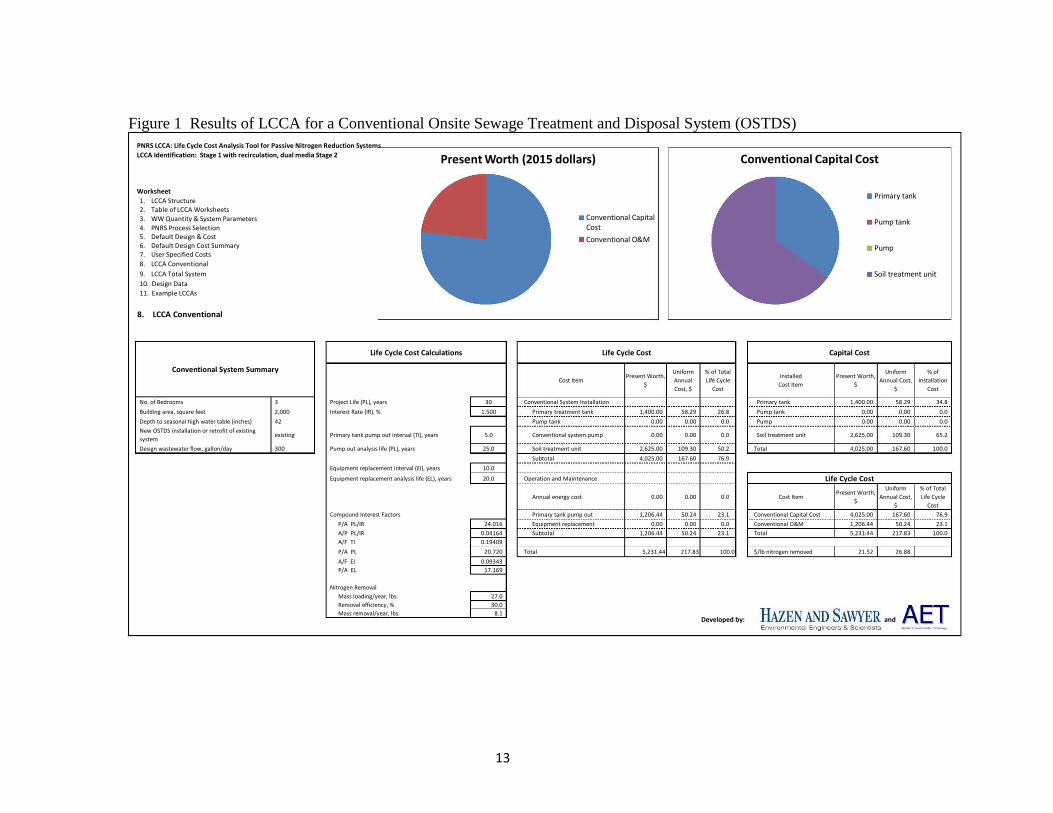
8. Life Cycle Cost Analysis, Conventional System: PNRS LCCA estimates life cycle
cost for conventional treatment (primary + soil treatment and dispersal). Present
Worth (PW) and Uniform Annual Costs (UAC) are shown. LCCA output for
conventional treatment is shown in Figure 1. Results are summarized in tables that
present the configuration of the system, individual cost components, cost groupings
and total costs. Pie chart cost distributions are included. The conventional system
LCCA results are incorporated into the life cycle costs of the total treatment system
(conventional + PNRS).
9. Life Cycle Cost Analysis, Total System: PNRS LCCA estimates life cycle cost for
the total treatment system of conventional treatment and PNRS. Present Worth (PW)
and Uniform Annual Costs (UAC) are shown. LCCA output for conventional plus
PNRS treatment is shown in Figure 2. Results are summarized in tables that present
the configuration of the system, individual cost components, cost groupings and total
costs. PNRS LCCA calculates the dollar cost per mass of nitrogen removed by the
total treatment system. Pie chart cost distributions are included.
The user can evaluate the overall cost of PNRS treatment versus conventional
treatment only and the significance of individual treatment components to the overall
system cost. The tabular and graphical results for a specific PNRS system can be
saved and compared to the results for alternative PNRS systems. The dollar cost per
mass of nitrogen removed by a PNRS can be compared to other PNRS systems or to
other nitrogen removal options in a watershed, for example.
7
10. Design Data: Flow, sizing, energy utilization, and costs are compiled for generating
the default costs of conventional and PNRS treatment systems. The worksheet
includes the unit costs of materials, energy, site access and installation complexity.
Under normal PNRS LCCA application this worksheet need not be accessed.
11. Example PNRS LCCAs: Example PNRS LCCAs are tabulated.
Table 1. PNRS LCCA Worksheets
Worksheet Contents
1. LCCA StructureTwo-Stage PNRS Description ▪ Basic Model Structure ▪ Example
PNRS Systems
2. Table of LCCA Worksheets Summary Table of LCCA Worksheets
3. Wastewater Quantity &
System Parameters
Determine design flowrate ▪ Specify conventional system
parameters ▪ Select nitrogen removal level as high, medium or
low @ 95%, 50-70%, or 25-30% ▪ Specify PNRS system
parameters ▪ Specify recurring costs ▪ Specify net interest rate
4. PNRS Process Selection Select specific PNRS system
5. Default Design & CostSummary of conventional system default design & cost ▪
Summary of PNRS design and default cost
6. Default Design Cost
Summary
Default cost summary for conventional system, for PNRS system
and for total system
7. User Specified Costs User specified costs for conventional system ▪ User specified
costs for PNRS
8. LCCA: ConventionalCharacteristics of conventional system ▪ Life Cycle Cost Analysis
of conventional system
9. LCCA: Total SystemCharacteristics of conventional system + PNRS ▪ Life Cycle Cost
Analysis of conventional system + PNRS
10. Design DataCompilation of flow and sizing criteria, unit cost factors for
materials, energy, site access and installation complexity
11. Example LCCAs Example Life Cycle Costs
8
PNRS LCCA Application
LCCA is applied as a discrete simulation for a specific case of wastewater flow, level of
nitrogen removal required, and site characteristics. Therefore, there are two worksheets that
require user input: 1) WW Quantity & System Parameters and 2) PNRS Process Selection.
A third worksheet User Specified Costs allows the user to input capital and operating costs
for specific cost items that override the PNRS LCCA default costs. The remaining model
worksheets are for informational purposes only.
Wastewater Quantity and System Parameters
The user is first asked to provide nomenclature for PNRS LCCA identification which is
referenced throughout the PNRS LCCA workbook.
Next the number or bedrooms and building area are specified by the user to determine the
design wastewater flowrate and must follow Florida statute (FAC 64E-6.008). PNRS LCCA
includes this as a built-in feature. For the conventional system of primary treatment + soil
treatment and dispersal, the primary tank size and soil dispersal field area are determined by
Florida statute (FAC 64E-6.008).
The user then specifies the level of treatment desired by selecting a nitrogen removal
efficiency percentage range of greater than 95+ (High), 50-70 (Medium) or 25-35% (Low).
The user should consider the environmental goals or regulatory requirements at the project
site. Systems with a lower percent nitrogen removal will have lower capital, operating and
life cycle costs. The user should select a higher nitrogen removal percent if there is
uncertainty in the treatment requirements.
Based on the level of treatment selected, additional user inputs are requested which are
signaled by being highlighted blue.
9
The existing conventional system infrastructure (primary tank size, pump tank size and soil
treatment unit infiltrative area) are input. Existing conventional infrastructure should only be
considered if it can be verified as being truly usable. If the site requires a new system, 0
should be entered. In addition, the soil treatment unit configuration (trench or bed), surface
loading rate and depth to seasonal high water table are input. The surface loading rate to the
soil treatment unit is determined by the soil characteristics of the site and is specified in
Florida code, as are procedures to determine the depth to seasonal high water table.
If “medium” or “high” level of treatment are selected, the PNRS parameters need to be
input. PNRS parameters include whether the nitrogen removal upgrade is to an existing
onsite system (retrofit) or a new onsite wastewater treatment system. For existing systems,
whether an existing Stage 1 biofilter or other fully nitrifying unit (ATU, PBTS) is usable. A
construction complexity factor is input which considers site characteristics that determine if
the installation is considered simple, moderate or complex. In addition, site topography to
determine whether operation by gravity is possible (is there at least an 8 foot elevation drop
from the house out 60 feet or more in the direction of the proposed system). For an in-
ground Stage 1 biofilter installation, a cost factor for drip dispersal is applied if the primary
effluent dispersal method is by a drip system rather than by gravity or low pressure
distribution. The sophistication of the control panel (standard or complex) is also input. A
complex control panel would provide remote monitoring ability.
10
The annual operating costs included in the LCCA are local unit energy costs; required
number of inspection visits and water quality monitoring events per year and associated
costs; and permitting costs.
The maintenance costs include primary tank pump out cost and frequency; media
replacement cost and frequency; and equipment replacement cost and frequency.
Lastly, the cost parameters are input which include project life, recommended at 30 years,
and net discounting rate.
11
PNRS Process Selection
The selection of a specific PNRS configuration is guided by technical factors, site factors,
and experience. The LCCA Structure worksheet contains example PNRS configurations
with varying levels of complexity.
All fields should be set to zero or blank before starting the selection process. Based on the level of nitrogen treatment and other parameters the user selected in the WW Quantity & System Parameters worksheet (options of low [25-35%], medium [50-70%] and high [95+%]), the user selects from the drop down menu the desired processes:
Stage 1 + Stage 2 (Stage1&2),
Stage 1 only (Stage1), or
Stage 2 only (Stage2).
If “Low” level of treatment is specified, no additional inputs are required. The LCCA for a
conventional system (primary tank + soil treatment unit) will be provided. If “Medium”
level of treatment is specified, the user selects either Stage1 or Stage1&2. If “High” level of
treatment is specified, the user selects Stage2 (which pertains only to where fully nitrifying
systems are already present) or Stage1&2.
Following the user defined processes selection, the applicable input fields are highlighted
blue. PNRS system sub-selections are made for placement of Stage 1 in a tank or in-ground,
for Stage 1 hydraulics (single pass or recirculation), for Stage 1 media (sand or expanded
clay), and Stage 2 media (lignocellulosic material, elemental sulfur, or dual media). The
option is offered to place lignocellulosic media underneath the Stage 1 media in a vertically
stacked system.
12
PNRS LCCA summarizes the PNRS system specified by the user in the PNRS Process
Selection worksheet.
User Specified Costs
The user has the option to enter specific costs for individual cost factors in lieu of the default
costs. The user should apply a reasonableness test to compare the user specified costs to
PNRS LCCA default costs and the relative extent of deviation.
13
Figure 1 Results of LCCA for a Conventional Onsite Sewage Treatment and Disposal System (OSTDS)
PNRS LCCA: Life Cycle Cost Analysis Tool for Passive Nitrogen Reduction Systems
LCCA Identification: Stage 1 with recirculation, dual media Stage 2
Worksheet
1. LCCA Structure2. Table of LCCA Worksheets
3. WW Quantity & System Parameters
4. PNRS Process Selection5. Default Design & Cost6. Default Design Cost Summary7. User Specified Costs
8. LCCA Conventional
9. LCCA Total System
10. Design Data
11. Example LCCAs
8. LCCA Conventional
Cost ItemPresent Worth,
$
Uniform
Annual
Cost, $
% of Total
Life Cycle
Cost
Installed
Cost Item
Present Worth,
$
Uniform
Annual Cost,
$
% of
Installation
Cost
No. of Bedrooms 3 Project Life (PL), years 30 Conventional System Installation Primary tank 1,400.00 58.29 34.8
Building area, square feet 2,000 Interest Rate (IR), % 1.500 Primary treatment tank 1,400.00 58.29 26.8 Pump tank 0.00 0.00 0.0
Depth to seasonal high water table (inches) 42 Pump tank 0.00 0.00 0.0 Pump 0.00 0.00 0.0
New OSTDS installation or retrofit of existing
systemexisting Primary tank pump out interval (TI), years 5.0 Conventional system pump 0.00 0.00 0.0 Soil treatment unit 2,625.00 109.30 65.2
Design wastewater flow, gallon/day 300 Pump out analysis life (PL), years 25.0 Soil treatment unit 2,625.00 109.30 50.2 Total 4,025.00 167.60 100.0
Subtotal 4,025.00 167.60 76.9
Equipment replacement interval (EI), years 10.0
Equipment replacement analysis life (EL), years 20.0 Operation and Maintenance
Annual energy cost 0.00 0.00 0.0 Cost ItemPresent Worth,
$
Uniform
Annual Cost,
$
% of Total
Life Cycle
Cost
Compound Interest Factors Primary tank pump out 1,206.44 50.24 23.1 Conventional Capital Cost 4,025.00 167.60 76.9
HAzEN AND SAWYER A ET Environmental Engineers ~ Scientists __ _
14
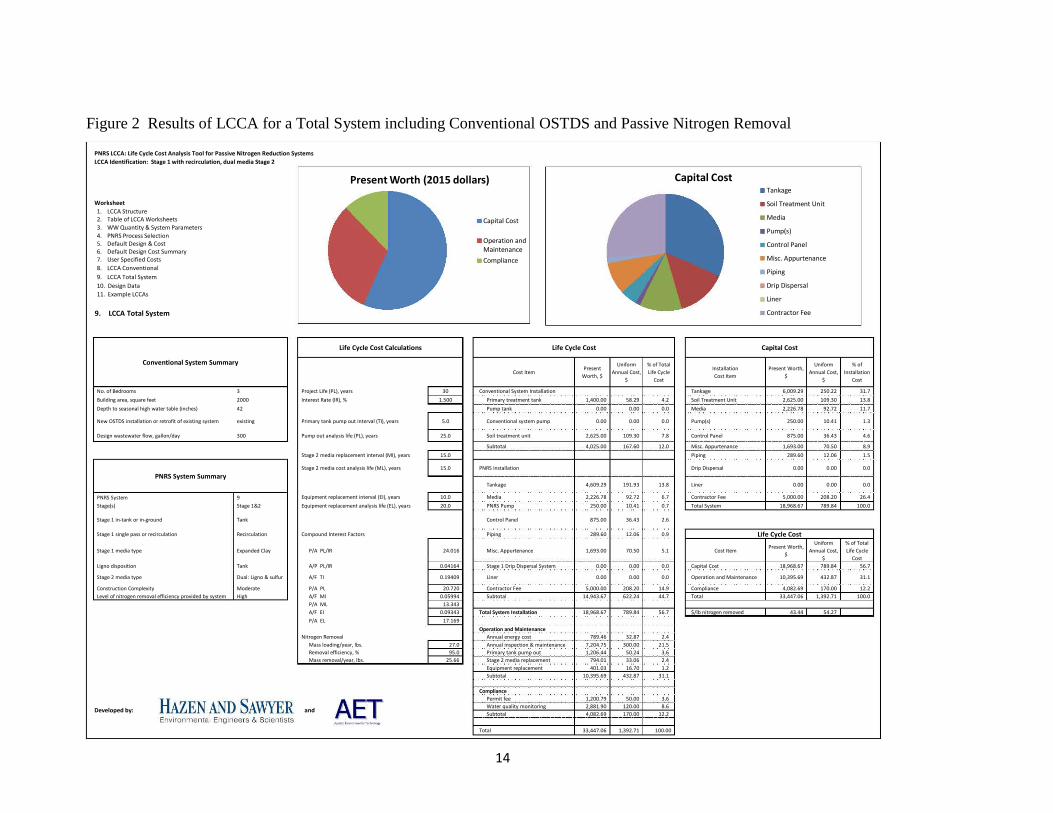
Figure 2 Results of LCCA for a Total System including Conventional OSTDS and Passive Nitrogen Removal
PNRS LCCA: Life Cycle Cost Analysis Tool for Passive Nitrogen Reduction Systems
LCCA Identification: Stage 1 with recirculation, dual media Stage 2
Worksheet
1. LCCA Structure2. Table of LCCA Worksheets3. WW Quantity & System Parameters
4. PNRS Process Selection5. Default Design & Cost6. Default Design Cost Summary7. User Specified Costs
8. LCCA Conventional
9. LCCA Total System
10. Design Data
11. Example LCCAs
9. LCCA Total System
Cost ItemPresent
Worth, $
Uniform
Annual Cost,
$
% of Total
Life Cycle
Cost
Installation
Cost Item
Present Worth,
$
Uniform
Annual Cost,
$
% of
Installation
Cost
No. of Bedrooms 3 Project Life (PL), years 30 Conventional System Installation Tankage 6,009.29 250.22 31.7
Building area, square feet 2000 Interest Rate (IR), % 1.500 Primary treatment tank 1,400.00 58.29 4.2 Soil Treatment Unit 2,625.00 109.30 13.8
Depth to seasonal high water table (inches) 42 Pump tank 0.00 0.00 0.0 Media 2,226.78 92.72 11.7
New OSTDS installation or retrofit of existing system existing Primary tank pump out interval (TI), years 5.0 Conventional system pump 0.00 0.00 0.0 Pump(s) 250.00 10.41 1.3
Design wastewater flow, gallon/day 300 Pump out analysis life (PL), years 25.0 Soil treatment unit 2,625.00 109.30 7.8 Control Panel 875.00 36.43 4.6