Ecological Applications, 21(3), 2011, pp. 817–829 Ó 2011 by the Ecological Society of America Passive sampling effects and landscape location alter associations between species traits and response to fragmentation DANIEL THORNTON, 1 LYN BRANCH, AND MEL SUNQUIST University of Florida, Department of Wildlife Ecology and Conservation, 110 Newins-Zieglar Hall, Gainesville, Florida 32611-0430 USA Abstract. As tropical reserves become smaller and more isolated, the ability of species to utilize fragmented landscapes will be a key determinant of species survival. Although several ecological and life history traits commonly are associated with vulnerability to fragmentation, the combination of traits that are most highly influential and the effectiveness of those traits in predicting vulnerability across distinct landscapes, remains poorly understood. We studied use of forest fragments by 25 mid- and large-sized neotropical mammals in Guatemala to determine how seven species traits influence vulnerability to fragmentation. We measured vulnerability in two ways: one measure that did not remove passive sampling effects (proportion of fragments occupied), and one that did (difference in occupancy rates within continuous and fragmented sites). We also examined the influence of species traits on patch occupancy rates of the same set of mammals on two landscapes in Mexico. When not accounting for passive sampling effects, body size, home range size, and vulnerability to hunting influenced how species responded to fragmentation. However, after controlling for passive sampling effects, only vulnerability to hunting strongly influenced sensitivity to fragmentation. Species that were heavily hunted were much less common in forest patches than in continuous forest sites of the same sampling size. The cross-landscape comparison revealed both similarities and differences in the species traits that influenced patch occupancy patterns on each landscape. Given the ubiquity of hunting in tropical environments, our findings indicate that management efforts in fragmented landscapes that do not account for hunting pressure may be ineffective in conserving heavily hunted tropical species. Our study also indicates that species traits may be useful in predicting relative patch occupancy rates and/or vulnerability to fragmentation across distinct landscapes, but that caution must be used as certain traits can become more or less influential on different landscapes, even when considering the same set of species. Key words: detectability; fragmentation; hunting; landscape; occupancy; passive sampling; species traits; tropical mammals; vulnerability. INTRODUCTION Preserving biodiversity in the tropics requires integra- tion of conservation efforts both within and outside of reserves. Protected areas in the tropics only cover 5–10% of remaining tropical forest (Myers 2002) and are inadequate for the protection of a large number of species (Rodrigues et al. 2004, Ceballos 2007, Jenkins and Giri 2007). Moreover, tropical reserves are becom- ing smaller and more isolated over time because of forest loss within park borders and in the surrounding landscape (deFries et al. 2005). Human-modified land- scapes outside of tropical reserves therefore will serve an increasingly important role in preserving species diver- sity (Chazdon et al. 2009). These landscapes typically consist of remnant forest patches embedded in a matrix of agriculture, cattle pasture, and secondary forest regrowth. Although recent studies have shown that a subset of forest species use agricultural and pastural habitats (e.g., Daily et al. 2003, Harvey et al. 2006), remnant forest patches are probably the most important components to conservation of biodiversity within fragmented landscapes. These patches provide critical habitat for many forest-dependent tropical species living outside of protected areas (Turner and Corlett 1996, Laurance and Bierregaard 1997). Substantial interspecies variation exists in the ability of species to occupy or use forest fragments (Laurance 1991, Gascon et al. 1999, Laurance et al. 2002). Survival of species within forest patches is determined by a combination of patch and landscape attributes and the life history or ecological traits of species (Henle et al. 2004). An understanding of how species traits influence distribution or abundance in forest patches is important for identifying generalities in response to habitat loss and fragmentation (Henle et al. 2004, Ewers and Didham 2006). Such knowledge is beneficial to predict- ing and mitigating species loss in human-dominated landscapes (Laurance 1991, Davies et al. 2000). Manuscript received 16 March 2010; revised 1 June 2010; accepted 25 June 2010. Corresponding editor: T. G. O’Brien. 1 E-mail: [email protected]817
Transcript
Ecological Applications, 21(3), 2011, pp. 817–829� 2011 by the Ecological Society of America
Passive sampling effects and landscape location alter associationsbetween species traits and response to fragmentation
DANIEL THORNTON,1 LYN BRANCH, AND MEL SUNQUIST
University of Florida, Department of Wildlife Ecology and Conservation, 110 Newins-Zieglar Hall,Gainesville, Florida 32611-0430 USA
Abstract. As tropical reserves become smaller and more isolated, the ability of species toutilize fragmented landscapes will be a key determinant of species survival. Although severalecological and life history traits commonly are associated with vulnerability to fragmentation,the combination of traits that are most highly influential and the effectiveness of those traits inpredicting vulnerability across distinct landscapes, remains poorly understood. We studied useof forest fragments by 25 mid- and large-sized neotropical mammals in Guatemala todetermine how seven species traits influence vulnerability to fragmentation. We measuredvulnerability in two ways: one measure that did not remove passive sampling effects(proportion of fragments occupied), and one that did (difference in occupancy rates withincontinuous and fragmented sites). We also examined the influence of species traits on patchoccupancy rates of the same set of mammals on two landscapes in Mexico. When notaccounting for passive sampling effects, body size, home range size, and vulnerability tohunting influenced how species responded to fragmentation. However, after controlling forpassive sampling effects, only vulnerability to hunting strongly influenced sensitivity tofragmentation. Species that were heavily hunted were much less common in forest patchesthan in continuous forest sites of the same sampling size. The cross-landscape comparisonrevealed both similarities and differences in the species traits that influenced patch occupancypatterns on each landscape. Given the ubiquity of hunting in tropical environments, ourfindings indicate that management efforts in fragmented landscapes that do not account forhunting pressure may be ineffective in conserving heavily hunted tropical species. Our studyalso indicates that species traits may be useful in predicting relative patch occupancy ratesand/or vulnerability to fragmentation across distinct landscapes, but that caution must beused as certain traits can become more or less influential on different landscapes, even whenconsidering the same set of species.
Several species traits are commonly associated with
vulnerability to fragmentation (hereafter we use the term
‘‘fragmentation’’ to denote both loss and fragmentation
of habitat). However, the combination of traits that are
most highly influential, and the degree to which those
traits determine vulnerability on distinct landscapes,
remains poorly understood for most taxa (Henle et al.
2004). Three factors confound analyses of how species
traits influence vulnerability to fragmentation. First,
studies do not always separate ‘‘passive sampling
effects’’ from actual effects of habitat fragmentation
(Johnson 2001, Haila 2002). Passive sampling effects are
apparent patterns in the relative distribution or abun-
dance of organisms among habitat fragments that are
merely artifacts of sampling. Such effects occur because
less abundant or patchily distributed species would be
expected by chance alone to be present in fewer
fragments than more abundant or evenly distributed
species (Bolger et al. 1991, Johnson 2001, Haila 2002).
These species are not necessarily more vulnerable to
habitat fragmentation, but will be categorized that way
if passive sampling effects are not taken into account in
the analysis. A second common problem is that issues of
detectability often are not considered in analyses.
Species that appear to be vulnerable could merely be
those that are harder to detect (Fleishman and Mac
Nally 2007). Inclusion of these elusive species in the
analysis without accounting for detectability will under-
estimate the actual number of patches occupied by such
species (MacKenzie et al. 2002) and make identification
of the real relationships between vulnerability of a
species and ecological or life history traits more difficult.
Finally, the ability to identify influential ecological and
life history traits is hindered by a lack of cross-landscape
comparisons. The opportunity rarely is available toexamine how the same set of species respond to habitat
fragmentation in different landscapes. This limits ourability to identify generalities in how species traitsinfluence response to habitat patchiness and to evaluate
the relative role of context-specific environmentalfactors vs. more intrinsic biological factors in controlling
response patterns.We addressed these issues with a study of mammal
distribution patterns in a fragmented tropical landscapein northern Guatemala. We studied use of forest
fragments and continuous forest sites by 25 mid- andlarge-sized mammals to determine how species traits
influence vulnerability to habitat fragmentation. Wetested the generality of these results with a comparison
of patch occupancy patterns of all 25 mammal speciesacross three distinct fragmented landscapes and ad-
dressed several specific questions related to the influenceof species traits on vulnerability:
1) What are the most important species traits influencingvulnerability to habitat fragmentation of mammals inGuatemala?
2) Does accounting for passive sampling effects alter therelative importance of species traits in determining
vulnerability to habitat fragmentation? We predictedthat traits influencing distribution of species in an
unaltered landscape (i.e., body size, home-range size,reproductive rate, trophic level) would be less
important in determining vulnerability to fragmenta-tion once sampling effects were taken into account in
the analysis.3) Do the same set of ecological and life history traits
explain interspecific variation in vulnerability tofragmentation on different landscapes? We predicted
that the same species traits would explain vulnera-bility across landscapes. To address this question, we
re-analyzed data from two studies conducted innearby Mexican landscapes with the same species(Estrada et al. 1994, Urquiza-Haas et al. 2009) so that
the results were comparable with our Guatemalanstudy. To our knowledge, this is the first attempt to
look at whether or not similar suites of ecological andlife history traits determine response to fragmentation
for the same set of species inhabiting differentlandscapes.
METHODS
Study area
We conducted this study in a 300 000-ha area in thePeten region of northern Guatemala (Fig. 1). The
northernmost part of the study area is an intactlandscape of humid subtropical forest located within
Tikal National Park, which itself is situated within thelarger Maya Biosphere Reserve (an UNESCO world
heritage site and the central section of the largestcontiguous tropical forest in Central America; V. H.
Ramos, personal communication). The southern part of
FIG. 1. The inset map shows the location of the MayaBiosphere Reserve in northern Guatemala. The enlargedportion shows the location of our study sites in relation tothe Maya Biosphere Reserve. Continuous forest sites (upperblack box) were located in the south-central portion of TikalNational Park, and forest patches (lower black box) werelocated in the buffer zone of the Maya Biosphere Reserve andprivate lands farther to the south.
DANIEL THORNTON ET AL.818 Ecological ApplicationsVol. 21, No. 3
the study area is a highly fragmented landscape located
within the buffer zone of the Maya Biosphere Reserve
and on private lands farther to the south. This area was
formerly contiguous forest, but now consists of a diverse
collection of primary rainforest patches embedded in a
matrix of secondary and regenerating forest, cattle
pasture and agricultural land (Fig. 2A). Forest destruc-
tion and fragmentation began in the late 1970s. Forest
patches are thus no more than 30 years old. Forest cover
in this area consists of subtropical humid rainforest with
scattered patches of seasonally inundated bajo forest
and a fringe of savannah forest in the south. Altitudinal
variation is minimal (130 to 400 m above sea level).
Annual average temperature of this region is 21–248C,
and annual average precipitation is 1350 mm with a
marked dry season from December to May when the
average monthly rainfall is only 60 mm.
We selected 50 primary rainforest patches that ranged
in size from 2.9 to 445.5 ha and 12 sites in continuous
forest (six sites each of 20 ha and 100 ha; Fig. 2B) as our
study sites. Rainforest patches contained a diverse
collection of tree species, but were often dominated by
some combination of Brosimum alicastrum, Manilkara
Pimenta dioica, and Cedrela odorata. We did not sample
rainforest patches that were severely degraded by
logging or fire, but we sampled a number of lightly
degraded sites. Lightly degraded sites were those that
still had a largely intact overstory of trees and where the
effects of past fires were limited to less than 25% of the
patch area. We did not sample patches of bajo forest,
savannah forest, or secondary forest. Almost all forest
patches in our study were used to some degree by local
inhabitants for collection of non-timber forest products,
hunting, or cattle grazing. Study sites in continuous
forest were similar in tree composition and density to
rainforest patches, but were surrounded by uninterrupt-
ed forest cover. Based on these characteristics, we made
the assumption that these sites in continuous forest were
analogous to pre-fragmentation conditions in the
fragmented part of the study area. Continuous forest
sites were situated greater than 500 m, but less than 3 km
from the main road in Tikal National Park (Fig. 2B).
This distance restriction was established to take
advantage of the decreased hunting pressure on mam-
mals close to the main road and archaeological ruins
(which are patrolled more heavily by park guards), while
minimizing disturbance related to traffic and human
visitors to the park.
Species ecological and life history traits
We determined values of seven life history and
ecological traits for each species using field guides and
FIG. 2. (A) Map showing a small portion of our fragmented study area, with forest cover in black, and matrix habitat(agriculture/pasture and regenerating forest) in white. (B) Map showing our continuous forest study area, with black boxesindicating the position of 20- and 100-ha study sites in Tikal National Park. The central park road is also shown in black. Thesestudy sites were embedded within completely continuous forest cover.
April 2011 819MAMMAL VULNERABILITY TO FRAGMENTATION
published literature (Table 1). The procedure and
literature used to determine values for each trait
category are described in Appendix A. These traits were
chosen because they commonly are hypothesized to
influence vulnerability to fragmentation in mammals
based on empirical and theoretical evidence (Laurance
1991, Peres 2001, Henle et al. 2004, Ewers and Didham
2006). Ecological and life history variables used in our
study were correlated. Consequently, we performed a
principal-components analysis (PCA) using proc
FACTOR in SAS (SAS Institute 2008) to reduce the
number of variables and remove correlations. We log-
transformed body mass and home-range size prior to
input in the PCA analysis. Results from the PCA
indicate that 83% of the variation in the seven traits is
explained by just three axes. Based on factor loadings,
these three axes each represent a distinct aspect of
mammalian biology and ecology (Table 2). PCA axis 1
(reproduction/niche specialization axis) represents a
gradient from species with low reproductive rates and
specialized diets and habitats, to species with high
reproductive rates and generalized diets and habitats.
PCA axis 2 (body size/hunting vulnerability axis)
represents a gradient from species with small body size
and low vulnerability to hunting (i.e., are rarely or never
hunted) to species with large body size and high
vulnerability to hunting (i.e., heavily hunted/persecuted
� Key to trophic levels: 1, primarily browser/grazer or frugivore; 2, omnivore; 3, primarily carnivore/myrmecophage.� Values for dietary and habitat breadth based on number of food or habitat categories used. Higher values indicate more
generalized diets or habitats. See Appendix A for full description of trait categories.§ Key to hunting vulnerability: 1, rarely/never hunted or killed; 2, occasionally hunted; 3, often hunted (e.g., a preferred game
species).
DANIEL THORNTON ET AL.820 Ecological ApplicationsVol. 21, No. 3
species. Because absence of a species could be the result
of either true absence or failure to detect a species,
detectability must be included to avoid underestimating
occupancy (MacKenzie et al. 2006).
We placed camera traps in a variety of locations in
each study site to maximize the number of species
photographed. These locations included roads, small
and large game trails, water holes, den sites, and other
areas containing substantial signs of animal use such as
tracks, digging, or scraping. We placed camera traps at
least 10 m from the edge of patches, with the sensor
approximately 10–20 cm off the ground so that smaller
species could not avoid detection by walking under the
sensor. We used both passive (Leaf River model C-1BU;
Leaf River Outdoor Products, Taylorsville, Mississippi,
USA) and active (Trailmaster model 1500; Goodson
and Associates, Inc., Lenexa, Kansas, USA) infrared
camera traps in approximately equal proportions within
each site. We placed more cameras in larger sites (Table
3) and spaced them farther apart in order to cover a
larger area. We included patch size in assessments of
detectability to account for potential biases related to
unequal sampling per unit area in the patches
Camera-trapping was ineffective for sampling arbo-
real species, as well as two terrestrial species (white-
tailed deer [Odocoileus virginianus] and collared pecca-
ries [Pecari tajacu]). In order to document presence/
absence of these species, we performed visual censuses of
sites in the early morning (between sunrise and three
hours after sunrise). Surveys were repeated five times
within a two-week period for each site, resulting in a
series of detection/non-detection data for use in
modeling detection probabilities. In order to cover as
much of the site as possible and to increase our chance
of encountering species, we did not cut transects for
walking within each site. We surveyed sites by walking
along small roads, human foot paths, and game trails,
and by walking through sections without any obvious
trails. We walked approximately 1 km/h and recorded
direct observations of animals, vocalizations, and well-
defined tracks as indications of presence within the site.
For small sites (less than 10 ha), we were able to walk
through most or all of the site during each session. For
sites too large to survey completely in one session, we
divided the site into two to four sections and randomly
chose a section to walk each session. We repeated this
process until we had five surveys for the site.
For 17 forest patches and four continuous sites, we
also conducted visual censuses two hours prior to
sunrise to search for arboreal nocturnal mammals,
particularly kinkajous (Potos flavus). We cut meter-wide
transects within multiple sections of each site in order to
move through the fragments during the night. We
walked transects at a very slow pace (0.5 km/h) and used
flashlights to search for mammals in the trees. We
repeated nocturnal surveys five times, walking a
different transect each night. For both daytime and
nocturnal surveys, we walked greater distances in larger
patches, but did not walk the same distance per unit area
in small and large patches (Table 3). As with camera
TABLE 2. Factor loadings from principal-components analysis of ecological and life history traits.
Note: See Methods: Species ecological and life history traits for interpretation of axes.� Factor loadings indicate the correlation coefficients between the original variables and the
‘‘new’’ PCA variables.� Total variance explained by the three axes¼ 84%.
TABLE 3. Sampling effort employed for camera trapping and visual censusing of mammals inforest patches and continuous forest sites.
Number of Distance walked per session (km)�
Site size Patches surveyed Cameras placed in patch Daytime surveys Nighttime surveys
� Distances listed were walked five times in each fragment.
April 2011 821MAMMAL VULNERABILITY TO FRAGMENTATION
traps, we included patch size in assessments of detect-
ability to account for potential biases related to unequal
sampling per unit area in the patches.
Measuring vulnerability to fragmentation
We modeled patch occupancy and detection proba-
bilities for each species using logistic regression in
program PRESENCE (available online).2 Because many
species in our study were capable of moving in and out
of patches during sampling, the occupancy estimator is
best interpreted as ‘‘probability of use’’ of a patch, rather
than probability of occupancy. The detection parameter
is best interpreted as probability of being within the
patch and detected during sampling (MacKenzie et al.
2006). For ease of presentation, we will use traditional
occupancy terminology in this paper.
We used three measures of vulnerability: (1) overall
proportion of forest patches occupied by each species,
(2) difference between probability of occupancy in forest
patches and continuous forest sites of 20-ha size, and (3)
difference between probability of occupancy in forest
patches and continuous forest sites of 100 ha in size.
These two later measures account for passive sampling
effects in the analysis by comparing expected patterns of
occupancy in continuous forest sites with observed
patterns in forest fragments of a similar sampling size.
The two sizes (20 ha and 100 ha) were chosen to
represent the size range of most patches in our study
area (Table 3). Although the ideal way to account for
passive sampling effects is to have pre- and post-
fragmentation information on species distribution, such
information is rarely available and our comparative
approach is appropriate given similarities between study
sites in continuous forest and fragmented areas.
To determine measures of vulnerability, we modeled
occupancy and detection probabilities using detection/
non-detection data collected from all 50 forest patches
and 12 continuous forest sites for 24 species. For
kinkajous, modeling was limited to the 17 forest patches
and four continuous forest sites surveyed during pre-
dawn hours. In program PRESENCE, we first modeled
detection as a function of size of the site (i.e., patch size
or size of the site in continuous forest) and a categorical
variable representing fragmented vs. continuous sites,
keeping occupancy constant. We determined the best fit
detection model for each species using AICc (Burnham
and Anderson 2002). Species with less than seven total
detections in all sites combined were considered to have
constant detection probabilities. We then took the best
fit or constant detection model, and modeled probability
of occupancy using size of the site and fragmented vs.
continuous forest status. Based on this final model, we
calculated the overall proportion of patches occupied by
summing the individual occupancy estimates for each
patch (excluding occupancy estimates from continuous
sites) and dividing by the total number of patches. This
was our first measure of vulnerability, with higher
proportion of patches occupied indicating less vulnera-
ble species. For our second measure of vulnerability, we
used occupancy models for each species to estimate the
probability of occupancy in a 20-ha forest site and a 20-
ha patch and subtracted the two values. We repeated
this process for 100-ha sites, which was our third
measure of vulnerability. High positive values resulting
from these two analyses indicate species that had high
occupancy probabilities in continuous forest sites, but
low occupancy probabilities in forest patches of the
same size. These species are considered highly vulnerable
to habitat fragmentation. Conversely, high negative
values indicate species that benefit from habitat frag-
mentation, as they were more commonly encountered in
forest patches than in continuous forest sites of the same
size. For the analysis of vulnerability, we limited the
number of covariates used in modeling detection and
occupancy to two because of sparse data sets for several
species (e.g., jaguars, tapir, puma [Puma concolor]).
Influence of species traits on vulnerability
We evaluated the influence of ecological and life
history traits on vulnerability to fragmentation with
multiple regression and hierarchical partitioning. We
used two approaches to account for correlations
between the species traits: (1) we used the uncorrelated
PCA axes of species traits as predictor variables in a
multiple regression, and (2) we used hierarchical
partitioning analysis (Chevan and Sutherland 1991) to
tease apart the independent contribution of each
individual species trait. For the first approach, we ran
three separate regressions with proc REG in SAS (SAS
Institute 2008) using the three PCA axes as predictor
variables and our three measures of vulnerability as
dependent variables. Because the PCA axes are orthog-
onal, partial R2 values of each axis can be used to
evaluate the relative influence of each axis on the
response variable. For the second approach, we
employed hierarchical partitioning analysis with the
original seven species traits as predictor variables using
the ‘‘hierpart’’ macro in SAS (Murray and Conner
2009). Hierarchical partitioning analysis calculates the
increase in model fit associated with each predictor
variable by averaging the goodness of fit increase across
the hierarchy of models in which the variable appears
(see [Chevan and Sutherland 1991] for additional
explanation). This analysis estimates the independent
explanatory power of a variable (i.e., effect on a
response variable attributable solely to that particular
predictor) and joint explanatory power (i.e., effect on a
response variable attributable to joint action with other
predictors) of each predictor variable. The independent
explanatory power serves as the appropriate measure of
the influence of a predictor variable on a response
(Chevan and Sutherland 1991, Mac Nally 2000). The
key advantage of hierarchical partitioning analysis is2 hhttp://www.mbr-pwrc.usgs.gov/software/presence.htmli
DANIEL THORNTON ET AL.822 Ecological ApplicationsVol. 21, No. 3
that this method can provide an accurate assessment of
the independent effect of a predictor variable, even in
the presence of multicollinearity (Murray and Conner
2009; but see Smith et al. [2009] for a criticism of this
approach).
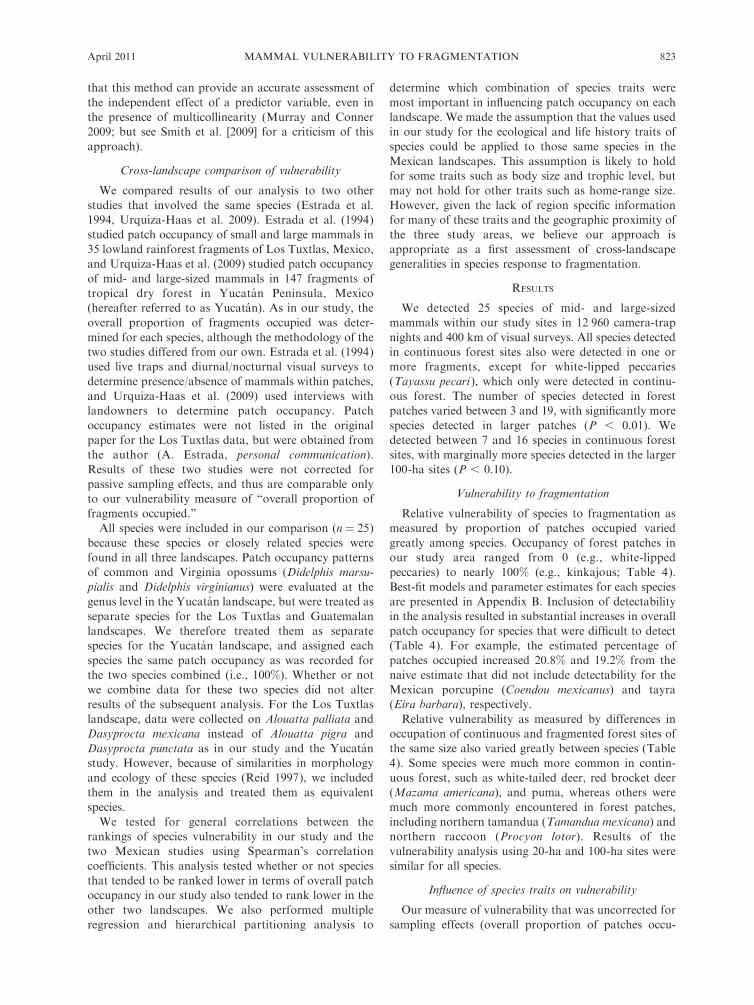
Cross-landscape comparison of vulnerability
We compared results of our analysis to two other
studies that involved the same species (Estrada et al.
1994, Urquiza-Haas et al. 2009). Estrada et al. (1994)
studied patch occupancy of small and large mammals in
35 lowland rainforest fragments of Los Tuxtlas, Mexico,
and Urquiza-Haas et al. (2009) studied patch occupancy
of mid- and large-sized mammals in 147 fragments of
tropical dry forest in Yucatan Peninsula, Mexico
(hereafter referred to as Yucatan). As in our study, the
overall proportion of fragments occupied was deter-
mined for each species, although the methodology of the
two studies differed from our own. Estrada et al. (1994)
used live traps and diurnal/nocturnal visual surveys to
determine presence/absence of mammals within patches,
and Urquiza-Haas et al. (2009) used interviews with
landowners to determine patch occupancy. Patch
occupancy estimates were not listed in the original
paper for the Los Tuxtlas data, but were obtained from
the author (A. Estrada, personal communication).
Results of these two studies were not corrected for
passive sampling effects, and thus are comparable only
to our vulnerability measure of ‘‘overall proportion of
fragments occupied.’’
All species were included in our comparison (n ¼ 25)
because these species or closely related species were
found in all three landscapes. Patch occupancy patterns
of common and Virginia opossums (Didelphis marsu-
pialis and Didelphis virginianus) were evaluated at the
genus level in the Yucatan landscape, but were treated as
separate species for the Los Tuxtlas and Guatemalan
landscapes. We therefore treated them as separate
species for the Yucatan landscape, and assigned each
species the same patch occupancy as was recorded for
the two species combined (i.e., 100%). Whether or not
we combine data for these two species did not alter
results of the subsequent analysis. For the Los Tuxtlas
landscape, data were collected on Alouatta palliata and
Dasyprocta mexicana instead of Alouatta pigra and
Dasyprocta punctata as in our study and the Yucatan
study. However, because of similarities in morphology
and ecology of these species (Reid 1997), we included
them in the analysis and treated them as equivalent
species.
We tested for general correlations between the
rankings of species vulnerability in our study and the
two Mexican studies using Spearman’s correlation
coefficients. This analysis tested whether or not species
that tended to be ranked lower in terms of overall patch
occupancy in our study also tended to rank lower in the
other two landscapes. We also performed multiple
regression and hierarchical partitioning analysis to
determine which combination of species traits were
most important in influencing patch occupancy on each
landscape. We made the assumption that the values used
in our study for the ecological and life history traits of
species could be applied to those same species in the
Mexican landscapes. This assumption is likely to hold
for some traits such as body size and trophic level, but
may not hold for other traits such as home-range size.
However, given the lack of region specific information
for many of these traits and the geographic proximity of
the three study areas, we believe our approach is
appropriate as a first assessment of cross-landscape
generalities in species response to fragmentation.
RESULTS
We detected 25 species of mid- and large-sized
mammals within our study sites in 12 960 camera-trap
nights and 400 km of visual surveys. All species detected
in continuous forest sites also were detected in one or
more fragments, except for white-lipped peccaries
(Tayassu pecari ), which only were detected in continu-
ous forest. The number of species detected in forest
patches varied between 3 and 19, with significantly more
species detected in larger patches (P , 0.01). We
detected between 7 and 16 species in continuous forest
sites, with marginally more species detected in the larger
100-ha sites (P , 0.10).
Vulnerability to fragmentation
Relative vulnerability of species to fragmentation as
measured by proportion of patches occupied varied
greatly among species. Occupancy of forest patches in
our study area ranged from 0 (e.g., white-lipped
peccaries) to nearly 100% (e.g., kinkajous; Table 4).
Best-fit models and parameter estimates for each species
are presented in Appendix B. Inclusion of detectability
in the analysis resulted in substantial increases in overall
patch occupancy for species that were difficult to detect
(Table 4). For example, the estimated percentage of
patches occupied increased 20.8% and 19.2% from the
naive estimate that did not include detectability for the
Mexican porcupine (Coendou mexicanus) and tayra
(Eira barbara), respectively.
Relative vulnerability as measured by differences in
occupation of continuous and fragmented forest sites of
the same size also varied greatly between species (Table
4). Some species were much more common in contin-
uous forest, such as white-tailed deer, red brocket deer
(Mazama americana), and puma, whereas others were
much more commonly encountered in forest patches,
including northern tamandua (Tamandua mexicana) and
northern raccoon (Procyon lotor). Results of the
vulnerability analysis using 20-ha and 100-ha sites were
similar for all species.
Influence of species traits on vulnerability
Our measure of vulnerability that was uncorrected for
sampling effects (overall proportion of patches occu-
April 2011 823MAMMAL VULNERABILITY TO FRAGMENTATION
pied) was influenced strongly by PCA axis 2 and 3
(Table 5). This indicates that species that are larger and
more heavily hunted, and species that have larger home
ranges and higher trophic levels, tended to occupy fewer
fragments than those species that did not have those
traits. Parameter estimates and partial R2 values indicate
that axis 2 (body size/hunting axis) was the most
important predictor. Overall, the model with all three
TABLE 5. Results from regression analysis using PCA axes as predictor variables and threemeasures of vulnerability to fragmentation as response variables.
Predictor variables Parameter estimate P Partial R2
TABLE 4. Three measures of vulnerability to habitat fragmentation for the Guatemalan study site, and patch occupancy estimatesfor Yucatan and Los Tuxtlas landscapes based on data in Estrada et al. (1994) and Urquiza-Haas et al. (2009).
� Percentage of fragments occupied (PFO): estimated percentage of patches occupied in Guatemala not corrected fordetectability ([number of fragments where species was detected at least once/total number of fragments] 3 100).
� Estimated percentage of patches occupied in Guatemala corrected for detectability ([sum of individual occupancy probabilitiesfrom each patch/total number of patches] 3 100).
§ Occupancy probability (expressed as percentage) of continuous forest sites minus occupancy probability in forest patch of samesize.
} Percentage of patches occupied in Yucatan based on interviews with landowners (Urquiza-Haas et al. 2009).# Percentage of patches occupied in Los Tuxtlas based on live trapping and visual censuses (Estrada et al. 1994).jj For Los Tuxtlas data set, data were collected on Alouatta palliata and Dasyprocta mexicana.
DANIEL THORNTON ET AL.824 Ecological ApplicationsVol. 21, No. 3
predictors explained a large amount of variation in
patch occupancy (R2 ¼ 0.58). Results from the
hierarchical partitioning analysis generally confirm the
results from the PCA regression analysis, but enabled us
to look at the importance of individual predictors in
more detail (Fig. 3A). The overall proportion of
fragments occupied was influenced most strongly by
body size, home range, and to a lesser extent by hunting
vulnerability.
Accounting for passive sampling effects altered the
relative influence of species traits on vulnerability to
fragmentation. Our measure of vulnerability corrected
for sampling effects (the difference in occupancy
between fragmented and continuous forest sites of
similar size) was influenced strongly only by axis 2
(Table 5). This result was similar for either 20-ha or 100-
ha sites. This indicates that species that are larger and
more heavily hunted tended to be much more likely to
occupy continuous forest sites than forest patches of the
same size. Overall fit of these models was slightly lower,
with only 41.3% and 49.2% of the variation explained by
the full models for 20-ha and 100-ha sites, respectively.
Hierarchical partitioning demonstrated that this mea-
sure of vulnerability was driven largely by differences in
hunting vulnerability, which accounted for almost half
of the explained variance in both cases (Fig. 4A and B).
Cross-landscape comparison
In general, species that had lower levels of patch
occupancy in our study also had lower levels of patch
occupancy in the Los Tuxtlas and Yucatan landscapes (r
¼ 0.66 and 0.52, respectively). This agreement between
studies only holds when comparing the rankings of
species in terms of their relative vulnerability; absolute
values of patch occupancy differed substantially between
the studies (Table 4). All three PCA axes had a
significant effect on vulnerability to fragmentation for
species in Los Tuxtlas (P ¼ 0.022, 0.026, and 0.002,
respectively), and these axes explained 54.2% of the
variation in the response. In Yucatan, the reproduction/
niche breadth and body size/hunting axes were related to
vulnerability (P¼ 0.015 and 0.011, respectively), and all
three axes explained 44.0% of the variation in propor-
tion of patches occupied. Hierarchical partitioning
generally agreed with the PCA analyses but with some
added detail on individual predictors. For the Los
FIG. 3. Results of hierarchical portioning analysis for (A)proportion of patches occupied in Guatemala, (B) proportionof patches occupied in Los Tuxtlas, Mexico, based on data inEstrada et al. (1994), (C) proportion of patches occupied inYucatan, Mexico, based on data in Urquiza-Haas et al. (2009).Key to abbreviations: BS, body size; HR, home range size; TL,tropic level; RR, reproductive rate; DB, dietary breadth; HB,habitat breadth; HV, hunting vulnerability.
FIG. 4. Results of hierarchical portioning analysis fordifference in occupancy of continuous sites and forest patchesof 20-ha and 100-ha size. Key to abbreviations: BS, body size;HR, home range size; TL, tropic level; RR, reproductive rate;DB, dietary breadth; HB, habitat breadth; HV, huntingvulnerability.
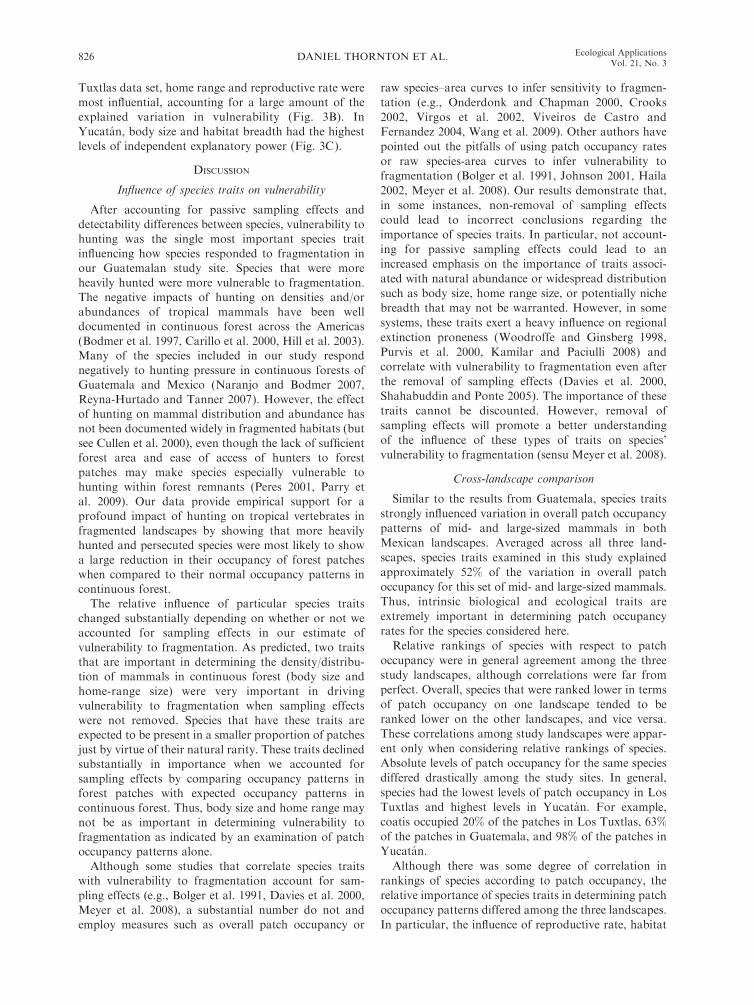
April 2011 825MAMMAL VULNERABILITY TO FRAGMENTATION
Tuxtlas data set, home range and reproductive rate were
most influential, accounting for a large amount of theexplained variation in vulnerability (Fig. 3B). In
Yucatan, body size and habitat breadth had the highestlevels of independent explanatory power (Fig. 3C).
DISCUSSION
Influence of species traits on vulnerability
After accounting for passive sampling effects and
detectability differences between species, vulnerability tohunting was the single most important species trait
influencing how species responded to fragmentation inour Guatemalan study site. Species that were more
heavily hunted were more vulnerable to fragmentation.The negative impacts of hunting on densities and/or
abundances of tropical mammals have been welldocumented in continuous forest across the Americas
(Bodmer et al. 1997, Carillo et al. 2000, Hill et al. 2003).Many of the species included in our study respondnegatively to hunting pressure in continuous forests of
Guatemala and Mexico (Naranjo and Bodmer 2007,Reyna-Hurtado and Tanner 2007). However, the effect
of hunting on mammal distribution and abundance hasnot been documented widely in fragmented habitats (but
see Cullen et al. 2000), even though the lack of sufficientforest area and ease of access of hunters to forest
patches may make species especially vulnerable tohunting within forest remnants (Peres 2001, Parry et
al. 2009). Our data provide empirical support for aprofound impact of hunting on tropical vertebrates in
fragmented landscapes by showing that more heavilyhunted and persecuted species were most likely to show
a large reduction in their occupancy of forest patcheswhen compared to their normal occupancy patterns in
continuous forest.The relative influence of particular species traits
changed substantially depending on whether or not weaccounted for sampling effects in our estimate of
vulnerability to fragmentation. As predicted, two traitsthat are important in determining the density/distribu-tion of mammals in continuous forest (body size and
home-range size) were very important in drivingvulnerability to fragmentation when sampling effects
were not removed. Species that have these traits areexpected to be present in a smaller proportion of patches
just by virtue of their natural rarity. These traits declinedsubstantially in importance when we accounted for
sampling effects by comparing occupancy patterns inforest patches with expected occupancy patterns in
continuous forest. Thus, body size and home range maynot be as important in determining vulnerability to
fragmentation as indicated by an examination of patchoccupancy patterns alone.
Although some studies that correlate species traitswith vulnerability to fragmentation account for sam-
pling effects (e.g., Bolger et al. 1991, Davies et al. 2000,Meyer et al. 2008), a substantial number do not and
employ measures such as overall patch occupancy or
raw species–area curves to infer sensitivity to fragmen-
tation (e.g., Onderdonk and Chapman 2000, Crooks
2002, Virgos et al. 2002, Viveiros de Castro and
Fernandez 2004, Wang et al. 2009). Other authors have
pointed out the pitfalls of using patch occupancy rates
or raw species-area curves to infer vulnerability to
fragmentation (Bolger et al. 1991, Johnson 2001, Haila
2002, Meyer et al. 2008). Our results demonstrate that,
in some instances, non-removal of sampling effects
could lead to incorrect conclusions regarding the
importance of species traits. In particular, not account-
ing for passive sampling effects could lead to an
increased emphasis on the importance of traits associ-
ated with natural abundance or widespread distribution
such as body size, home range size, or potentially niche
breadth that may not be warranted. However, in some
systems, these traits exert a heavy influence on regional
extinction proneness (Woodroffe and Ginsberg 1998,
Purvis et al. 2000, Kamilar and Paciulli 2008) and
correlate with vulnerability to fragmentation even after
the removal of sampling effects (Davies et al. 2000,
Shahabuddin and Ponte 2005). The importance of these
traits cannot be discounted. However, removal of
sampling effects will promote a better understanding
of the influence of these types of traits on species’
vulnerability to fragmentation (sensu Meyer et al. 2008).
Cross-landscape comparison
Similar to the results from Guatemala, species traits
strongly influenced variation in overall patch occupancy
patterns of mid- and large-sized mammals in both
Mexican landscapes. Averaged across all three land-
scapes, species traits examined in this study explained
approximately 52% of the variation in overall patch
occupancy for this set of mid- and large-sized mammals.
Thus, intrinsic biological and ecological traits are
extremely important in determining patch occupancy
rates for the species considered here.
Relative rankings of species with respect to patch
occupancy were in general agreement among the three
study landscapes, although correlations were far from
perfect. Overall, species that were ranked lower in terms
of patch occupancy on one landscape tended to be
ranked lower on the other landscapes, and vice versa.
These correlations among study landscapes were appar-
ent only when considering relative rankings of species.
Absolute levels of patch occupancy for the same species
differed drastically among the study sites. In general,
species had the lowest levels of patch occupancy in Los
Tuxtlas and highest levels in Yucatan. For example,
coatis occupied 20% of the patches in Los Tuxtlas, 63%of the patches in Guatemala, and 98% of the patches in
Yucatan.
Although there was some degree of correlation in
rankings of species according to patch occupancy, the
relative importance of species traits in determining patch
occupancy patterns differed among the three landscapes.
In particular, the influence of reproductive rate, habitat
DANIEL THORNTON ET AL.826 Ecological ApplicationsVol. 21, No. 3
breadth, and hunting vulnerability on patch occupancy
patterns changed substantially across landscapes. This
was true even though we limited our comparison to the
same set of species in each landscape. Because our cross-
landscape analysis used a measure of fragmentation
sensitivity that did not account for passive sampling
effects, our comparison is perhaps best viewed as an
analysis of how species traits influence patch occupancy,
rather than vulnerability to habitat fragmentation per se.
However, our general finding that different traits can
emerge as important on different landscapes for the
same set of species is applicable to studies of species’
vulnerability to habitat fragmentation.
Although difficult to assess based on only three study
sites, variation in the influence of species traits on patch
occupancy may be affected by context-specific differ-
ences between the landscapes. For example, the rela-
tively large influence of hunting vulnerability on patch
occupancy in our Guatemalan landscape compared to
the Mexican landscapes could be related to differences in
hunting pressure among the three areas. Patches in our
study area were heavily impacted by hunting pressure
whereas this was not the case in Los Tuxtlas at the time
of the study (A. Estrada, personal communication).
Subsistence and commercial hunting occurs in Yucatan
(T. Urquiza-Haas, personal communication), but hunting
pressure may be less intense than in northern Guatemala
where a rapidly increasing and extremely poor rural
population creates a large demand for wild game. Also,
different cultural hunting norms may have contributed
to the disparity among the three landscapes (between
Mexico and Guatemala) in the role of hunting
vulnerability in determining species response to frag-
mentation. However, many of the species denoted in this
study as highly preferred game species or highly
persecuted species are the same in Mexico (Escamilla
et al. 2000, Urquiza-Haas et al. 2009). The importance
of habitat breadth in the Yucatan compared to the other
landscapes may be related to differences in the type of
patches studied in each area. Patches in the Yucatan
were a mixture of primary, secondary, and disturbed
habitats, whereas patches in Guatemala and Los Tuxtlas
were largely undisturbed primary forest sites. Because
habitat breadth is important in determining use of
disturbed or secondary forest habitats, this trait could be
a more important influence on patch occupancy patterns
in Yucatan.
Similarly, context-specific differences in the physical
characteristics of patches (e.g., patch quality, distance of
patches from sources) could explain, in part, the large
descrepancies in absolute levels of patch occupancy seen
across the three landscapes. Other differences among the
three landscapes in climate, seasonality, and human
population densities also may be important.
Alternatively, the variation in absolute patch occupancy
rates could be explained by differences in methodology.
Interviews used in Yucatan may have resulted in higher
estimates of patch occupancy for species because they
measured both past and present use of patches by
mammals. Mammals were recorded as present if they
had been observed within the patch in the last five years
(Urquiza-Haas et al. 2009). The generally lower
estimates of patch occupancy in Los Tuxtlas may have
been influenced by the use of live traps instead of camera
traps or lower levels of trapping effort. Also, the Los
Tuxtlas study was done before techniques existed for
incorporation of detectability in patch occupancy
estimates. A failure to incorporate dectectability may
have biased estimates of occupancy lower for some
species.
Collectively, results from the cross-landscape com-
parison indicate both similarities and differences in how
the same species responded to habitat patchiness on
distinct landscapes. The strong influence of both body
size and home-range size in determining patch occupan-
cy on all three landscapes probably accounts for the
correlation between the studies in terms of the relative
rankings of species according to patch occupancy rates.
This suggests that it may be possible to predict with
some degree of accuracy relative patch occupancy
patterns of these species on novel landscapes, which is
one of the major goals of analyzing the relationship
between species traits and response to landscape change
(Mac Nally and Bennett 1997). However, the influence
of other variables, particularly reproductive rate, habitat
breadth, and hunting vulnerability on patch occupancy
patterns changed substantially across landscapes and
likely accounts for the less than perfect nature of the
correlations. The search for generalities in species
response to habitat patchiness, and potentially to
habitat fragmentation per se, based on shared ecological
and life history characteristics therefore will be made
more difficult because of variability in the importance of
traits among landscapes.
Conclusions
Our results indicate that vulnerability to hunting
drives many of the interspecies differences in sensitivity
to habitat fragmentation in northern Guatemala.
Because we were able to incorporate detectability in
our analysis, our findings do not reflect detection
differences between species but instead real patterns in
vulnerability. Hunting pressure on mid- and large-sized
mammals is common in many fragmented tropical
environment (Peres 2001). Reduction of hunting pres-
sure may have a marked positive effect on the ability of
species to use and persist within fragmented landscapes
of the tropics and thus should be a primary focus of
management efforts in human-dominated environments
with high levels of hunting. Our work also shows that
the way in which vulnerability to fragmentation is
measured, and in particular whether or not passive
sampling effects are accounted for in the analysis, can
alter conclusions regarding the relative influence of
species traits on sensitivity to fragmentation. Finally,
our cross-landscape comparison found correlations
April 2011 827MAMMAL VULNERABILITY TO FRAGMENTATION
among mammals on three distinct landscapes when
comparing the relative ranking of species in terms of
patch occupancy, which suggests some degree of
similarity in response that could be used to predict
how the same species will react on novel landscapes.
However, our comparison also demonstrates that the
relative influence of certain species traits on patch
occupancy patterns (and likely to some extent on
vulnerability to fragmentation) changes across land-
scapes, perhaps because of context-specific differences
between landscapes. Moreover, absolute values of patch
occupancy were markedly different on the three
landscapes. We found these results even though we were
considering almost the exact same set of species in all
three landscapes. These findings therefore suggest some
limitations in the use of species ecological and life
history traits to predict variation in patch occupancy
and/or sensitivity to fragmentation across diverse
landscapes, at least until we are able to better
incorporate extrinsic factors such as context-specific
differences among landscapes into the analysis.
ACKNOWLEDGMENTS
We thank the Wildlife Conservation Society–Guatemala, theConsejos Nacional Para Areas Protegidas, and the administra-tion of National Park Tikal for supporting this work. We thankA. Estrada and T. Urquiza-Haas for informal reviews of themanuscript and for access to their data and information abouttheir study sites. We thank Nery Jurado and Demetrio Cordovafor assistance with data collection in the field. At WCS-Guatemala, we thank Roan McNab, Rony Garcia Anleu, andJose Moreira for their advice and logistical help with the study.Funding for this work was provided by NSF-DDIG, WCS-Guatemala, the American Society of Mammalogists, UFIGERT Working Forest in the Tropics, and IDEA-Wild.
LITERATURE CITED
Bodmer, R. E., J. F. Eisenberg, and K. H. Redford. 1997.Hunting and the likelihood of extinction of Amazonianmammals. Conservation Biology 11:460–466.
Bolger, D. T., A. C. Alberts, and M. E. Soule. 1991. Occurrencepatterns of bird species in habitat fragments: sampling,extinction, and nested species subsets. American Naturalist137:155–166.
Burnham, K., and D. Anderson. 2002. Model selection andmultimodel inference. Springer-Verlag, New York, NewYork, USA.
Carillo, E., G. Wong, and A. D. Cuaron. 2000. Monitoringmammal populations in Costa Rican protected areas underdifferent hunting restrictions. Conservation Biology 14:1580–1591.
Ceballos, G. 2007. Conservation priorities for mammals inmegadiverse Mexico: the efficiency of reserve networks.Ecological Applications 17:569–578.
Chazdon, R. L., C. A. Harvey, O. Komar, D. M. Griffith, B. G.Ferguson, M. Martinez-Ramos, H. Morales, R. Nigh, L.Soto-Pinto, M. V. Breugel, and S. M. Philpott. 2009. Beyondreserves: a research agenda for conserving biodiversity inhuman-modified tropical landscapes. Biotropica 41:142–153.
Chevan, A., and M. Sutherland. 1991. Hierarchical partition-ing. American Statistician 45:90–96.
Crooks, K. R. 2002. Relative sensitivities of mammaliancarnivores to habitat fragmentation. Conservation Biology16:488–502.
Cullen, L., Jr., R. E. Bodmer, and C. V. Padua. 2000. Effects ofhunting in habitat fragments of the Atlantic forests, Brazil.Biological Conservation 95:49–56.
Daily, G. C., G. Ceballos, J. Pacheco, G. Suzan, and A.Sanchez-Azofeifa. 2003. Countryside biogeography of neo-tropical mammals: conservation opportunities in agriculturallandscapes of Costa Rica. Conservation Biology 17:1814–1826.
Davies, K. F., C. R. Margules, and J. F. Lawrence. 2000.Which traits of species predict population declines inexperimental forest fragments? Ecology 81:1450–1461.
deFries, R., A. Hansen, A. C. Newton, and M. C. Hansen.2005. Increasing isolation of protected areas in tropicalforests over the past twenty years. Ecological Applications15:19–26.
Escamilla, A., M. Sanvicente, M. Sosa, and C. Galindo-Leal.2000. Hunting mosaic, wildlife availability, and hunting intropical forest of Calakmul, Mexico. Conservation Biology14:1592–1601.
Estrada, A., R. Coates-Estrada, and D. J. Meritt. 1994. Nonflying mammals and landscape changes in the tropical rainforest region of Los Tuxtlas, Mexico. Ecography 17:229–241.
Ewers, R. M., and R. K. Didham. 2006. Confounding factors inthe detection of species responses to habitat fragmentation.Biological Reviews 81:117–142.
Fleishman, E., and R. Mac Nally. 2007. Measuring theresponse of animals to contemporary drivers of fragmenta-tion. Canadian Journal of Zoology 85:1080–1090.
Gascon, C., T. E. Lovejoy, R. O. Bierregaard, Jr., J. R.Malcolm, P. C. Stouffer, H. L. Vasconcelos, W. F. Laurance,B. Zimmerman, M. Tocher, and S. Borges. 1999. Matrixhabitat and species richness in tropical forest remnants.Biological Conservation 91:223–229.
Haila, Y. 2002. A conceptual genealogy of fragmentationresearch: from island biogeography to landscape ecology.Ecological Applications 12:321–334.
Harvey, C. A., A. Medina, D. M. Sanchez, S. Vilchez, B.Hernandez, J. C. Saenz, J. M. Maes, F. Casanoves, and F. L.Sinclair. 2006. Patterns of animal diversity in different formsof tree cover in agricultural landscapes. Ecological Applica-tions 16:1986–1999.
Henle, K., K. F. Davies, M. Kleyer, C. Margules, and J. Settele.2004. Predictors of species sensitivity to fragmentation.Biodiversity and Conservation 13:207–251.
Hill, K., G. McMillan, and R. Farina. 2003. Hunting-relatedchanges in game encounter rates from 1994 to 2001 in theMbaracayu Reserve, Paraguay. Conservation Biology17:1312–1323.
Jenkins, C. N., and C. Giri. 2007. Protection of mammaldiversity in Central America. Conservation Biology 22:1037–1044.
Johnson, D. H. 2001. Habitat fragmentation effects on birds ingrasslands and wetlands: a critique of our knowledge. GreatPlains Research 11:211–231.
Kamilar, J. M., and L. M. Paciulli. 2008. Examining theextinction risk of specialized folivores: a comparative studyof colobine monkeys. American Journal of Primatology70:816–827.
Laurance, W. F. 1991. Ecological correlates of extinctionproneness in Australian tropical rain forest mammals.Conservation Biology 5:79–89.
Laurance, W. F., and R. O. Bierregaard. 1997. Tropical forestremnants: ecology, management, and conservation of frag-mented communities. University of Chicago Press, Chicago,Illinois, USA.
Laurance, W. F., T. E. Lovejoy, H. L. Vasconcelos, E. M.Bruna, R. K. Didham, P. C. Stouffer, C. A. Gascon, R. O. J.Bierregaard, S. G. Laurance, and E. Sampaio. 2002.Ecosystem decay of Amazonian forest fragments: a 22-yearinvestigation. Conservation Biology 16:605–618.
DANIEL THORNTON ET AL.828 Ecological ApplicationsVol. 21, No. 3
MacKenzie, D. I., J. D. Nichols, G. B. Lachman, S. Droege,J. A. Royle, and C. A. Landtimm. 2002. Estimating siteoccupancy rates when detection probabilities are less thanone. Ecology 83:2248–2255.
MacKenzie, D. I., J. D. Nichols, A. J. Royle, K. H. Pollock,L. L. Bailey, and J. E. Hines. 2006. Occupancy estimationand modeling: inferring patterns and dynamics of speciesoccurrence. Elsevier, Boston, Massachusetts, USA.
Mac Nally, R. 2000. Regression and model-building inconservation biology, biogeography and ecology: the distinc-tion between—and reconciliation of—‘‘predictive’’ and ex-planatory models. Biodiversity and Conservation 9:655–671.
Mac Nally, R., and A. F. Bennett. 1997. Species-specificpredictions of the impact of habitat fragmentation: localextinction of birds in the box–ironbark forest of centralVictoria, Australia. Biological Conservation 82:147–155.
Meyer, C. F. J., J. Frund, W. P. Lizano, and E. K. V. Kalko.2008. Ecological correlates of vulnerability to fragmentationin Neotropical bats. Journal of Applied Ecology 45:381–391.
Murray, K., and M. M. Conner. 2009. Methods to quantifyvariable importance: implications for the analysis of noisyecological data. Ecology 90:348–355.
Myers, N. 2002. Biodiversity and biodepletion: the need for aparadigm shift. Pages 46–60 in T. O’Riordan and S. Stoll-Kleemann, editors. Biodiversity, sustainability, and humancommunities: protecting beyond the protected. CambridgeUniversity Press, Cambridge, Massachusetts, USA.
Naranjo, E. J., and R. E. Bodmer. 2007. Source–sink systemsand conservation of hunted ungulates in the LacandonForest, Mexico. Biological Conservation 138:412–420.
Onderdonk, D. A., and C. A. Chapman. 2000. Coping withforest fragmentation: the primates of Kibale National Park,Uganda. International Journal of Primatology 21:587–611.
Parry, L., J. Barlow, and C. A. Peres. 2009. Allocation ofhunting effort by Amazonian smallholders: implications forconserving wildlife in mixed-use landscapes. BiologicalConservation 142:1777–1786.
Peres, C. A. 2001. Synergistic effects of subsistence hunting andhabitat fragmentation on Amazonian forest vertebrates.Conservation Biology 15:1490–1505.
Purvis, A., J. L. Gittleman, G. Cowlishaw, and G. M. Mace.2000. Predicting extinction risk in declining species. Proceed-ings of the Royal Society B 267:1947–1952.
Reid, F. A. 1997. A field guide to the mammals of CentralAmerica and Southeast Mexico. Oxford University Press,New York, New York, USA.
Reyna-Hurtado, R., and G. W. Tanner. 2007. Ungulate relativeabundance in hunted and non-hunted sites in CalakmulForest (southern Mexico). Biodiversity and Conservation16:743–756.
Rodrigues, A. S. L., et al 2004. Effectiveness of the globalprotected area network in representing species diversity.Nature 428:640–643.
SAS Institute. 2008. SAS for Windows, version 9.2. SASInstitute, Cary, North Carolina, USA.
Shahabuddin, G., and C. A. Ponte. 2005. Frugivorous butterflyspecies in tropical forest fragments: correlates of vulnerabilityto extinction. Biodiversity and Conservation 14:1137–1152.
Smith, A. C., N. Koper, C. M. Francis, and L. Fahrig. 2009.Confronting collinearity: comparing methods for disentan-gling the effects of habitat loss and fragmentation. LandscapeEcology 24:1271–1285.
Turner, I. M., and R. T. Corlett. 1996. The conservation valueof small, isolated fragments of lowland tropical rain forest.Trends in Ecology and Evolution 11:330–333.
Urquiza-Haas, T., C. A. Peres, and P. M. Dolman. 2009.Regional scale effects of human density and forest distur-bance on large-bodied vertebrates throughout the YucatanPeninsula, Mexico. Biological Conservation 142:134–148.
Virgos, E., J. L. Telleria, and T. Santos. 2002. A comparison ofthe response to forest fragmentation by medium-sized Iberiancarnivores in central Spain. Biodiversity and Conservation11:1063–1079.
Viveiros de Castro, E. V. B., and F. A. S. Fernandez. 2004.Determinants of differential extinction vulnerabilities ofsmall mammals in Atlantic forest fragments in Brazil.Biological Conservation 119:73–80.
Wang, Y., J. Zhang, K. J. Feeley, P. Jiang, and P. Ding. 2009.Life-history traits associated with fragmentation vulnerabil-ity of lizards in the Thousand Island Lake, China. AnimalConservation 12:329–337.
Woodroffe, R., and J. R. Ginsberg. 1998. Edge effects and theextinction of populations inside protected areas. Science280:2126–2128.
APPENDIX A
Details of compilation of ecological and life history traits (Ecological Archives A021-040-A1).
APPENDIX B
Parameter estimates for best-fit occupancy models (Ecological Archives A021-040-A2).
April 2011 829MAMMAL VULNERABILITY TO FRAGMENTATION