47
ASEG Passive Seismic Workshop Adelaide, August 2016 Nigel Cantwell Passive seismic surveying over weathered geology with poor impedance contrast, and other complicating factors
ASEG Passive Seismic Workshop
Adelaide, August 2016
Nigel Cantwell
Passive seismic surveying over weathered geology with poor impedance contrast, and other complicating factors
H/V Survey Examples
1. Coppermine Creek, north of Cape Crawford in the NT Pacifico
2. Profiles over known base metal deposits at Tenant Creek in central NT Metals X
3. Millennium Zinc Prospect, Paterson Province, WA Encounter Resources
Passive Seismic Survey Aims and Methodology
• Generally, aim was to use the H/V method to estimate transported cover thickness. In these highly weathered terrains, can we also see the base of oxidation / top of fresh rock?
• Also, just trying out the Tromino gear new to ResPot, whilst travelling a long way for other work in the Gulf of Carpentaria.
• Used Tromino seismometers produced by Moho.
• NT surveys used a Tromino Zero – older model, no internal GPS, less sensitivity when low signal, early days in survey trials completed by Resource Potentials, trial surveys were completed mostly on my own time and for free.
• Paterson survey used the Tromino ENGY 3G.
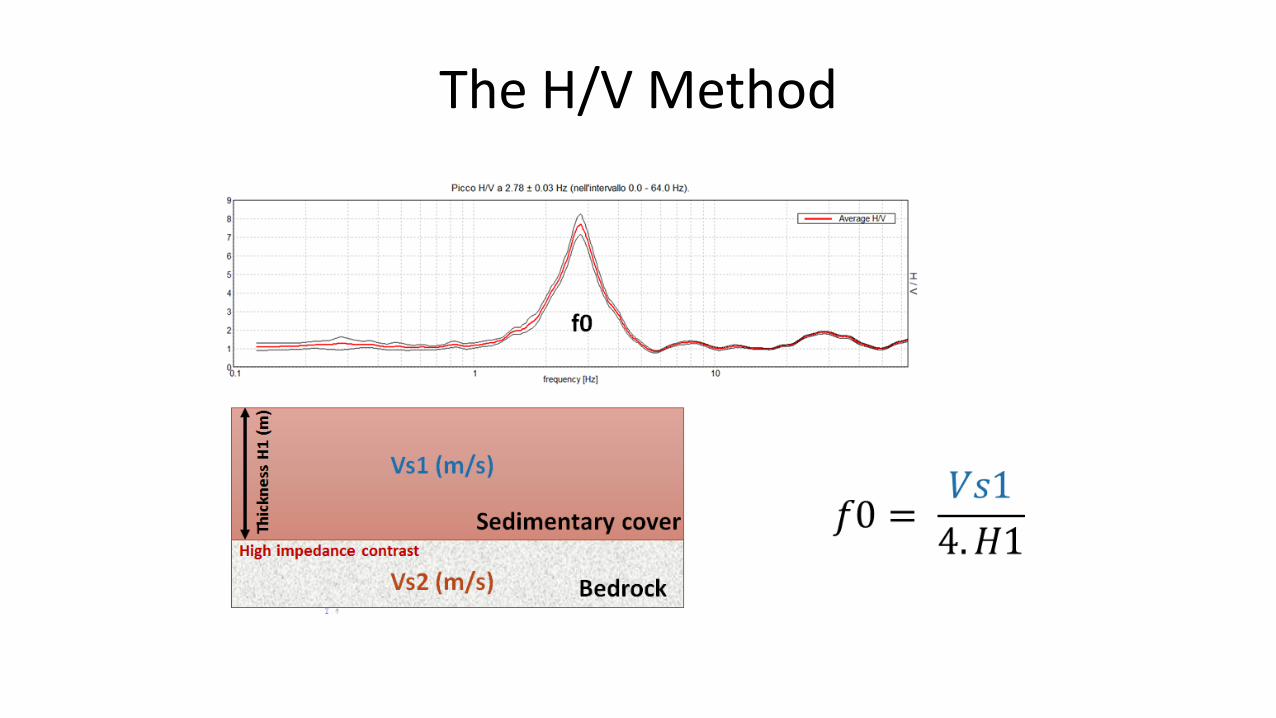
The H/V Method
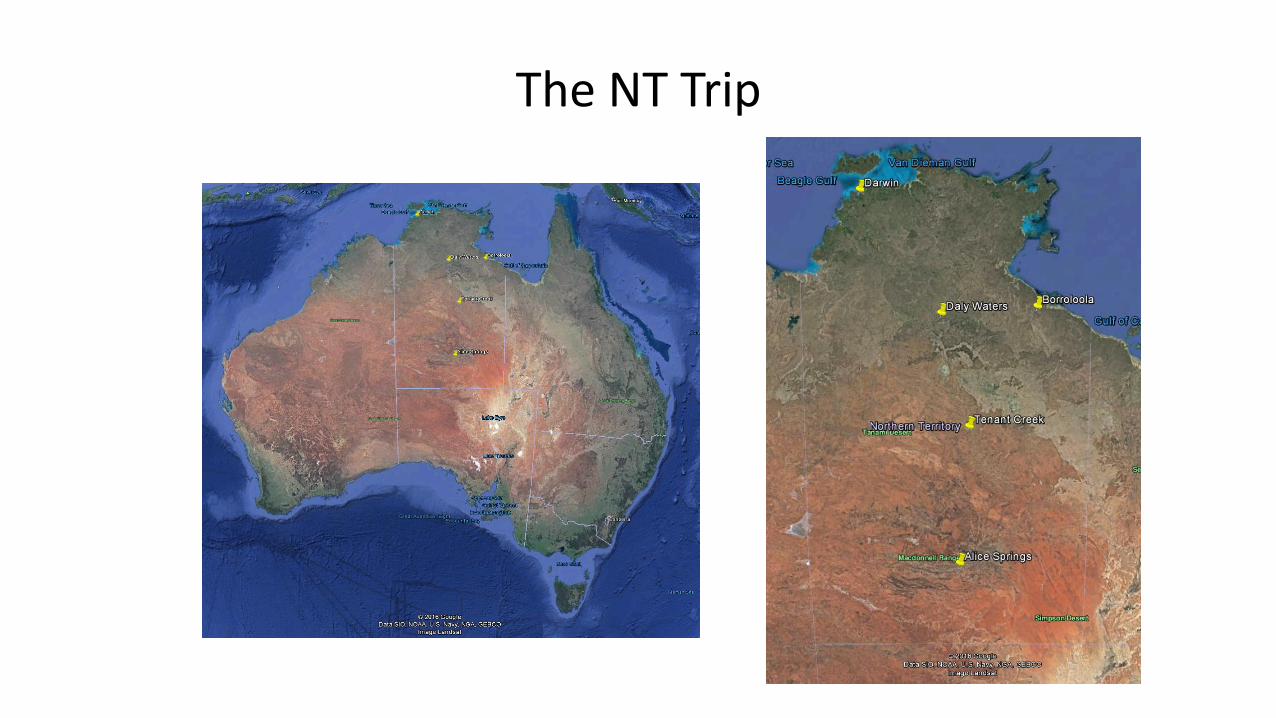
The NT Trip
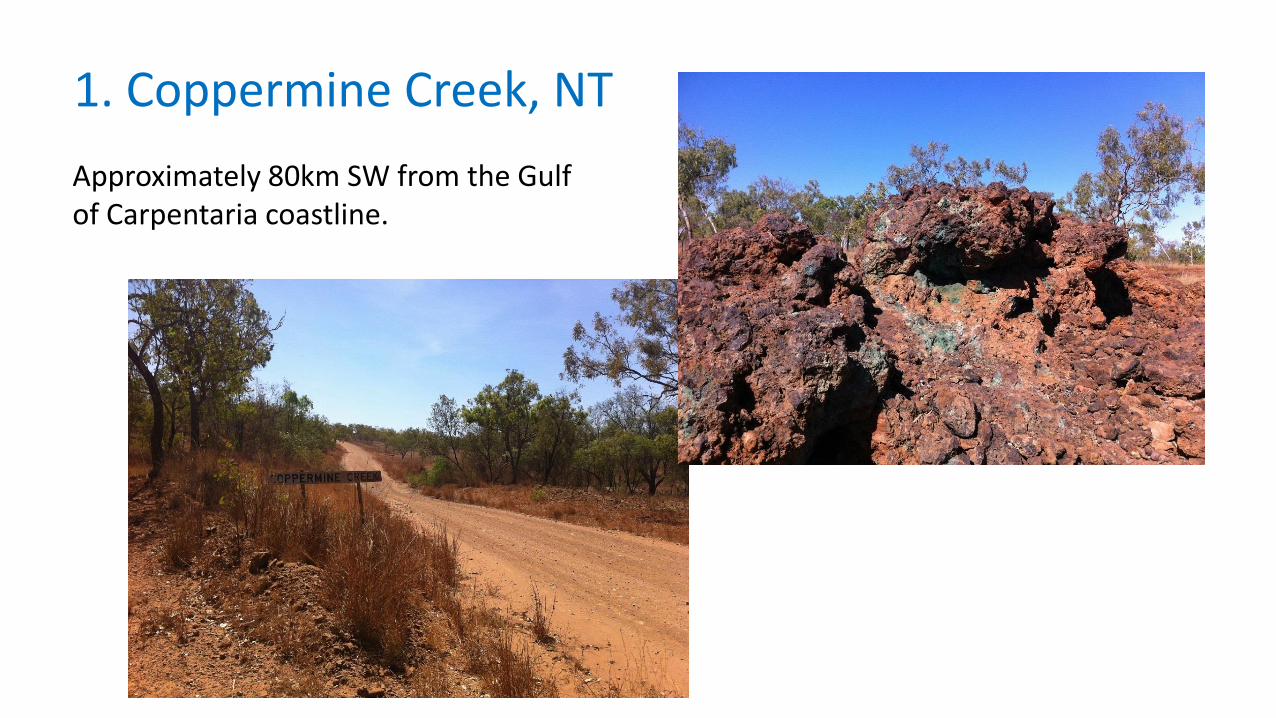
1. Coppermine Creek, NT
Approximately 80km SW from the Gulf of Carpentaria coastline.
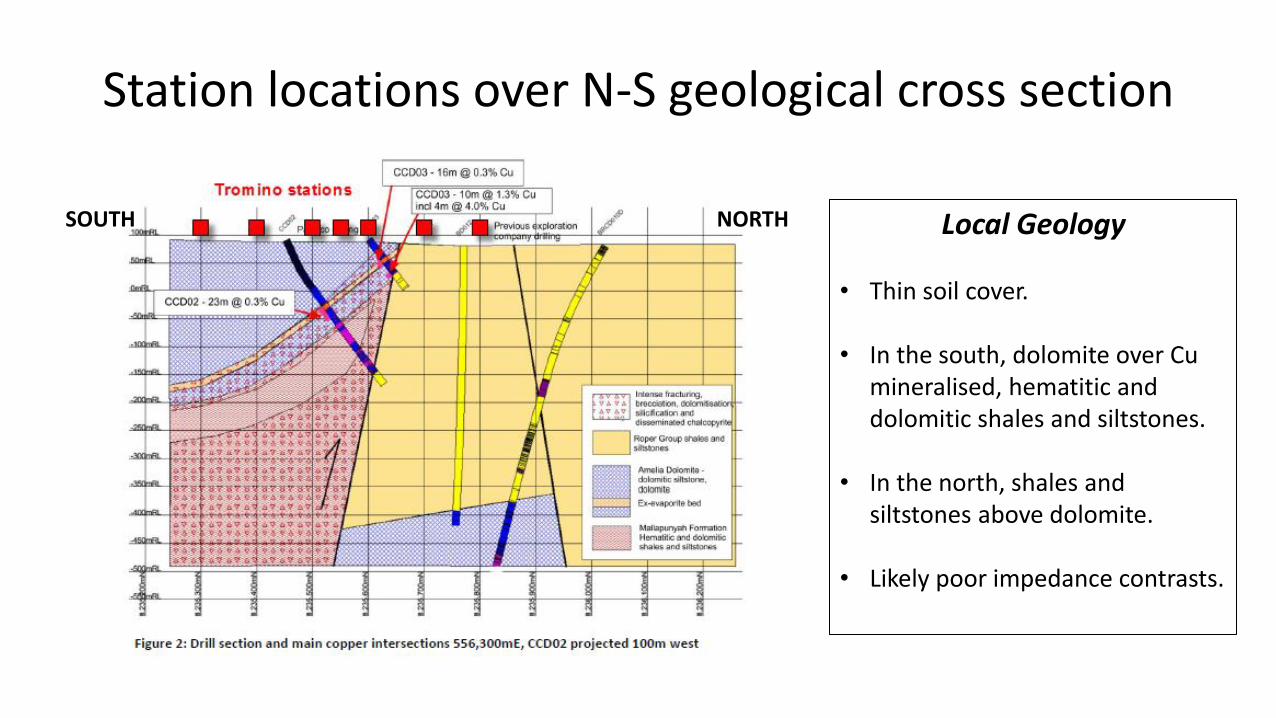
Station locations over N-S geological cross section
NORTH SOUTH Local Geology
• Thin soil cover.
• In the south, dolomite over Cu mineralised, hematitic and dolomitic shales and siltstones.
• In the north, shales and siltstones above dolomite.
• Likely poor impedance contrasts.
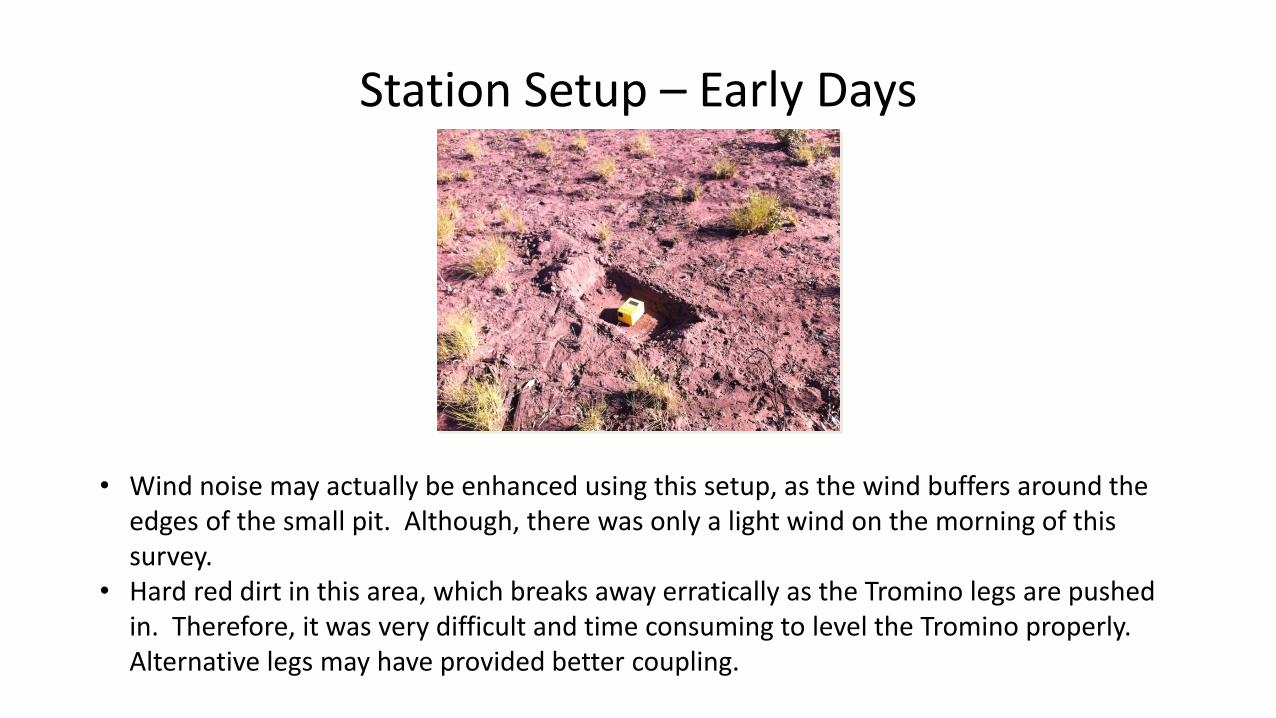
Station Setup – Early Days
• Wind noise may actually be enhanced using this setup, as the wind buffers around the edges of the small pit. Although, there was only a light wind on the morning of this survey.
• Hard red dirt in this area, which breaks away erratically as the Tromino legs are pushed in. Therefore, it was very difficult and time consuming to level the Tromino properly. Alternative legs may have provided better coupling.
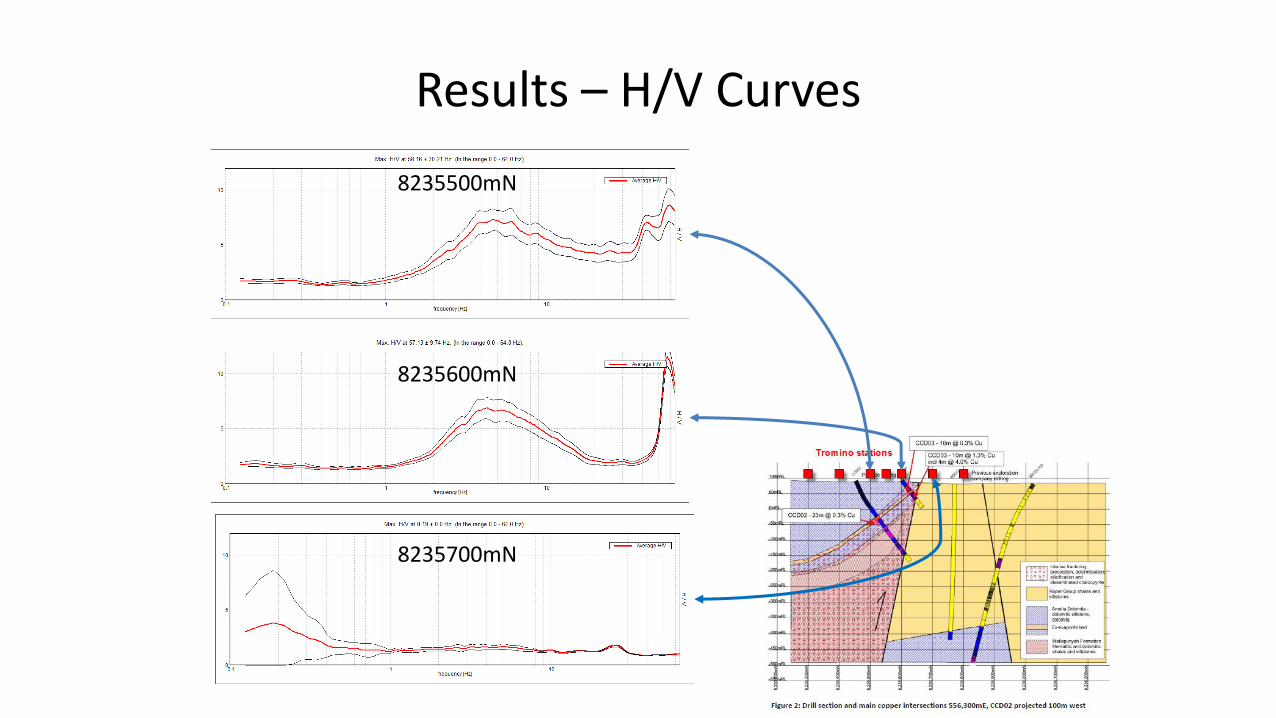
Results – H/V Curves
8235500mN
8235600mN
8235700mN
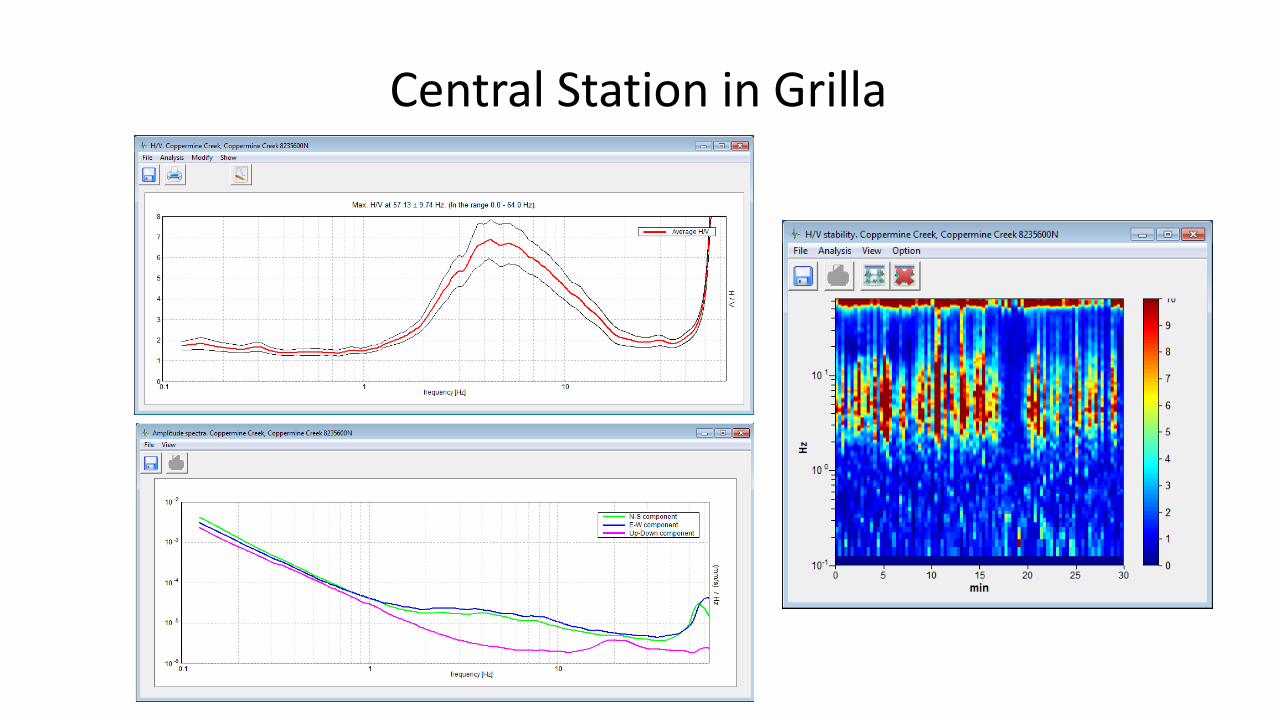
Central Station in Grilla
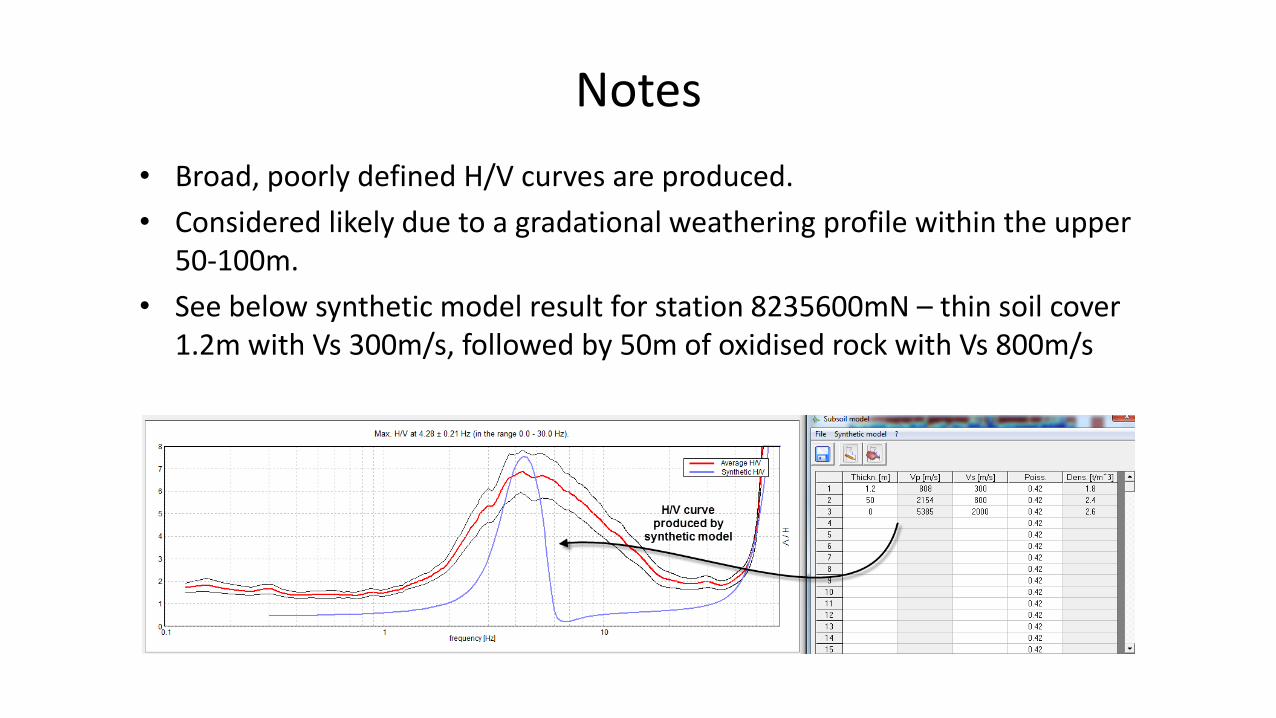
Notes
• Broad, poorly defined H/V curves are produced.
• Considered likely due to a gradational weathering profile within the upper 50-100m.
• See below synthetic model result for station 8235600mN – thin soil cover 1.2m with Vs 300m/s, followed by 50m of oxidised rock with Vs 800m/s
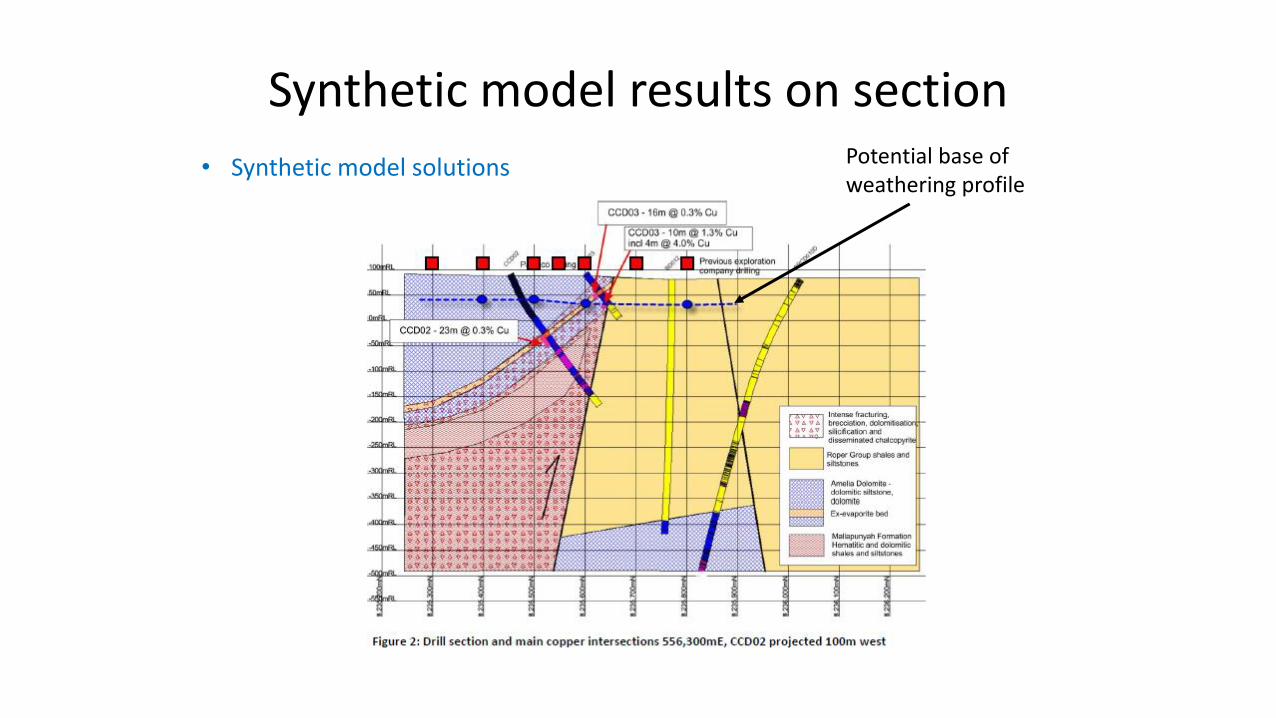
Synthetic model results on section
• Synthetic model solutions Potential base of weathering profile
Simple Estimation of Average Signal Levels
510
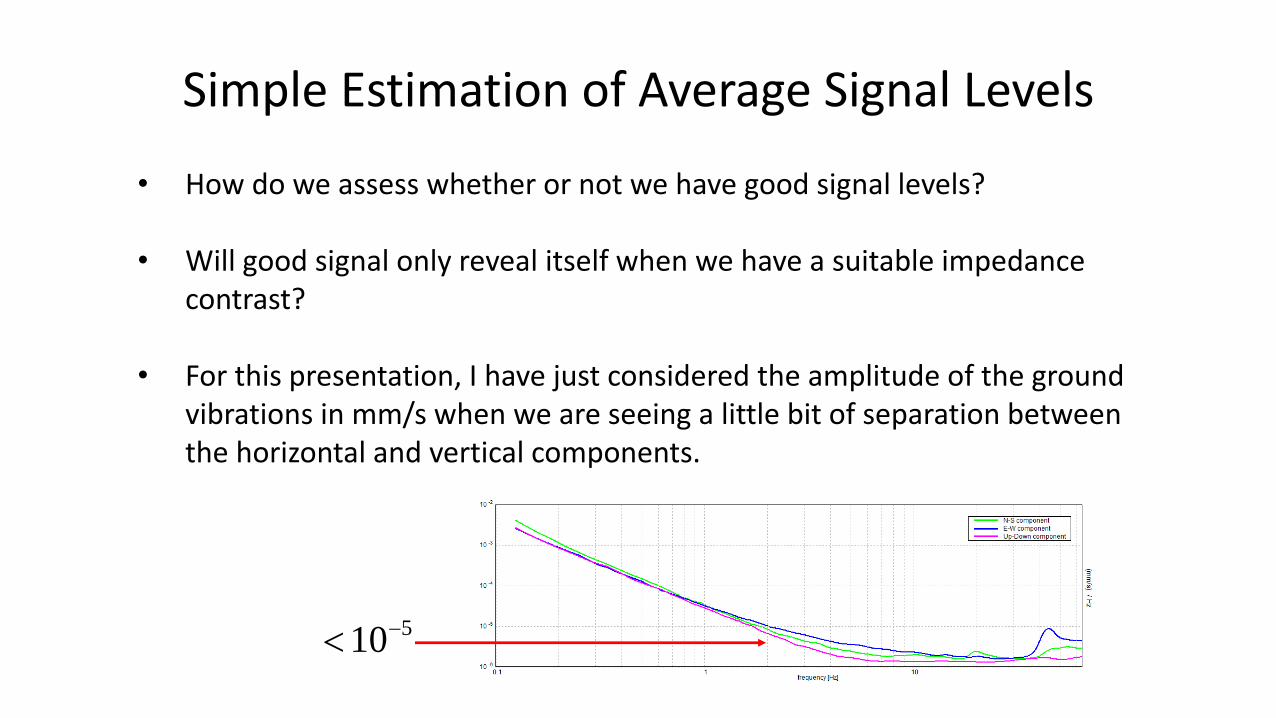
• How do we assess whether or not we have good signal levels?
• Will good signal only reveal itself when we have a suitable impedance contrast?
• For this presentation, I have just considered the amplitude of the ground vibrations in mm/s when we are seeing a little bit of separation between the horizontal and vertical components.
Coppermine Creek Summary
• Project geo’s confirm there is a reasonable correlation between the modelled Tromino data and the base of oxidation.
• South of the main fault, we never really stood a chance to see the bottom of the upper layer as this is dolomite, and it would not be expected to have a strong impedance contrast with the dolomitic shales and siltstones below.
• A trial survey was completed here just because it was ‘on the way’ to some other work in the Carpentaria Gulf.
2. Tenant Creek, NT
• Trial survey completed as ‘passing through’ on the way down to Alice Springs, after other work in the Carpentaria Gulf.
• Just one day to survey over two known base metal deposits – Explorer 108 and Explorer 142, which are located 150-200m below highly lithified cover sediments of the Wiso Basin.
• This is considered to be an area of reasonable micro-seismic activity, even though it’s located in central NT.
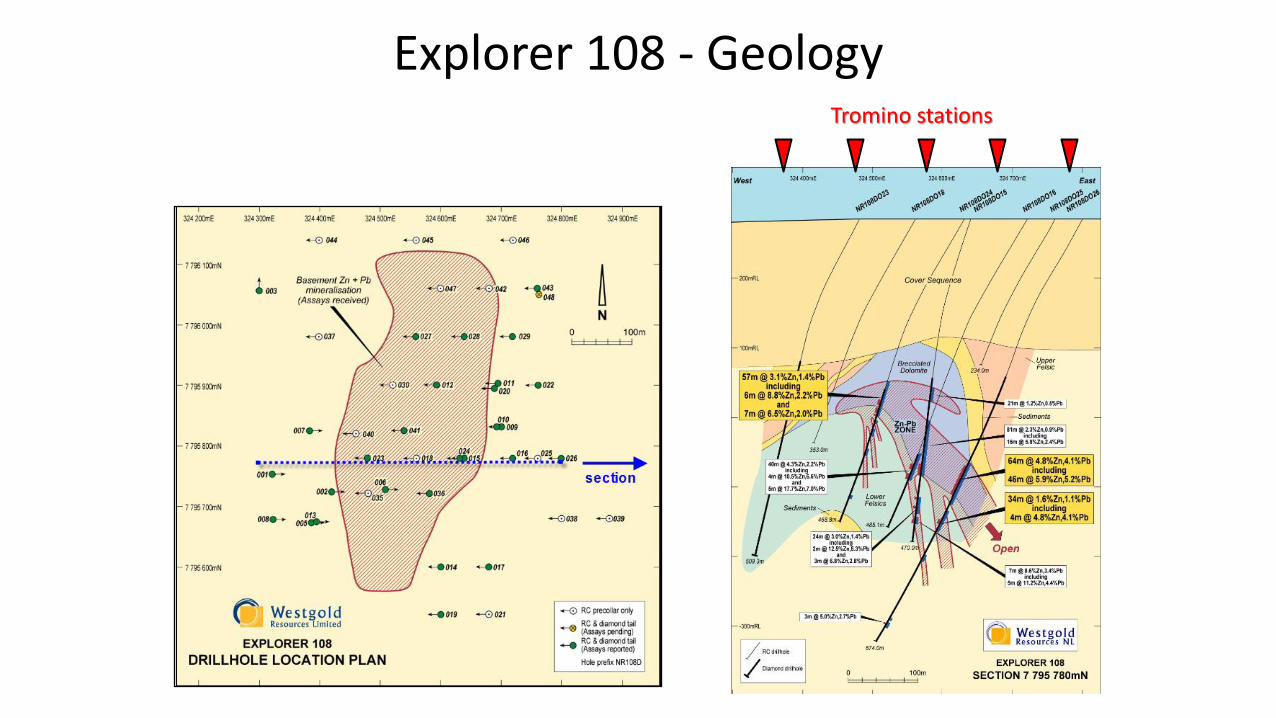
Explorer 108 - Geology Tromino stations
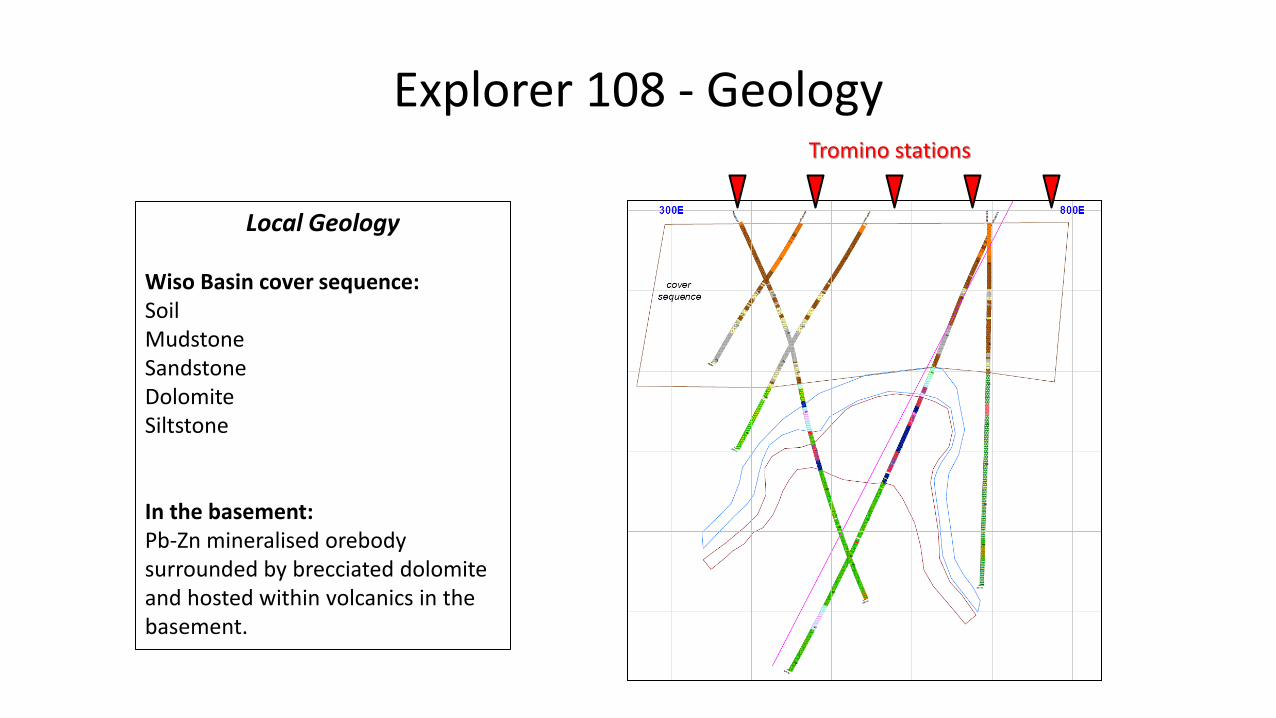
Explorer 108 - Geology
Local Geology Wiso Basin cover sequence: Soil Mudstone Sandstone Dolomite Siltstone In the basement: Pb-Zn mineralised orebody surrounded by brecciated dolomite and hosted within volcanics in the basement.
Tromino stations
Explorer 108 - Tromino measurements
• All readings were taken over a 20 minute period, except for the westernmost station (10 minutes) due to time constraints.
• A drill rig was operating during each of the readings at a distance of approximately 1km to the SSW of the centre station.
• The drill rig was drilling down at a depths of 450-500m below surface, which is well below the cover sequence, and would be expected to increase the seismic signal measured by the Tromino.
Explorer 108 – H/V Results WEST
EAST
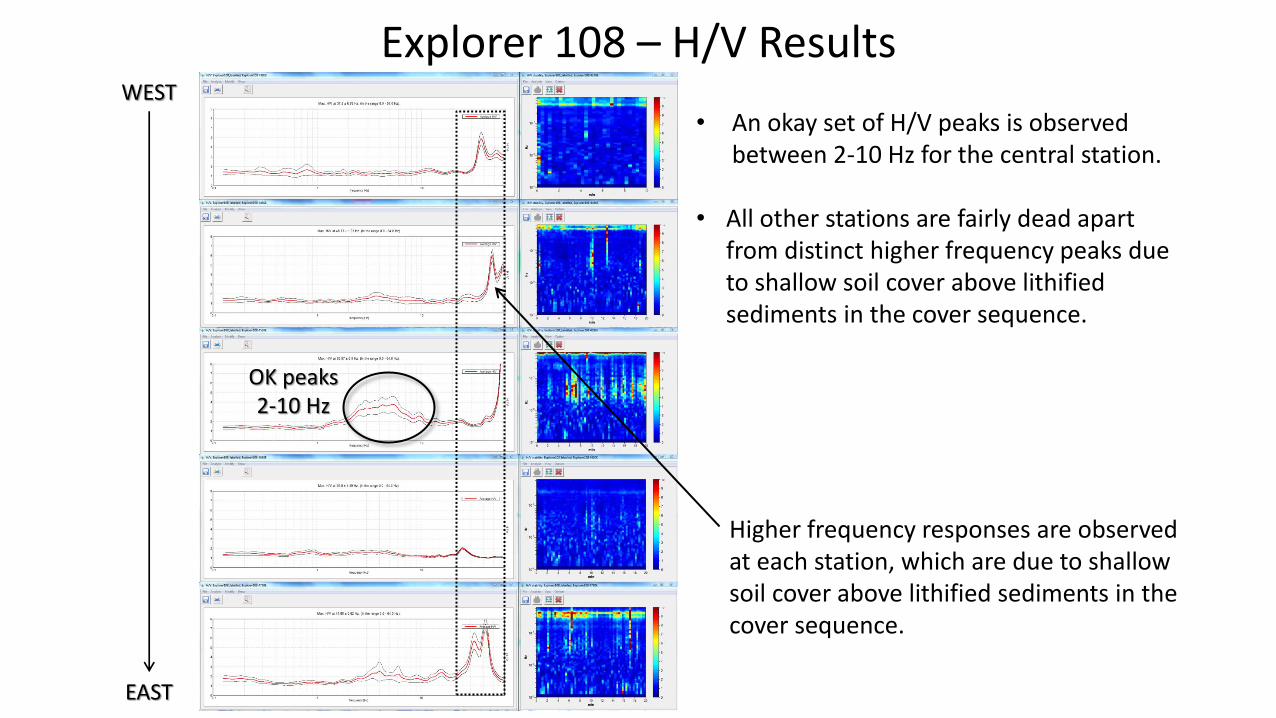
• An okay set of H/V peaks is observed between 2-10 Hz for the central station.
• All other stations are fairly dead apart
from distinct higher frequency peaks due to shallow soil cover above lithified sediments in the cover sequence.
OK peaks 2-10 Hz
Higher frequency responses are observed at each station, which are due to shallow soil cover above lithified sediments in the cover sequence.
• We don’t see any distinct lower frequency H/V peaks that could easily be attributed to the deep base of the cover sequence, apart from the central survey station.
• The lower frequency 2-10 Hz responses observed for the central station might be due to the base of cover sequence (considered unlikely), some sort of variation within the cover sequence (considered more likely), OR a response from the dense Pb-Zn mineralisation and alteration in the basement (?)
Explorer 108 – H/V Results
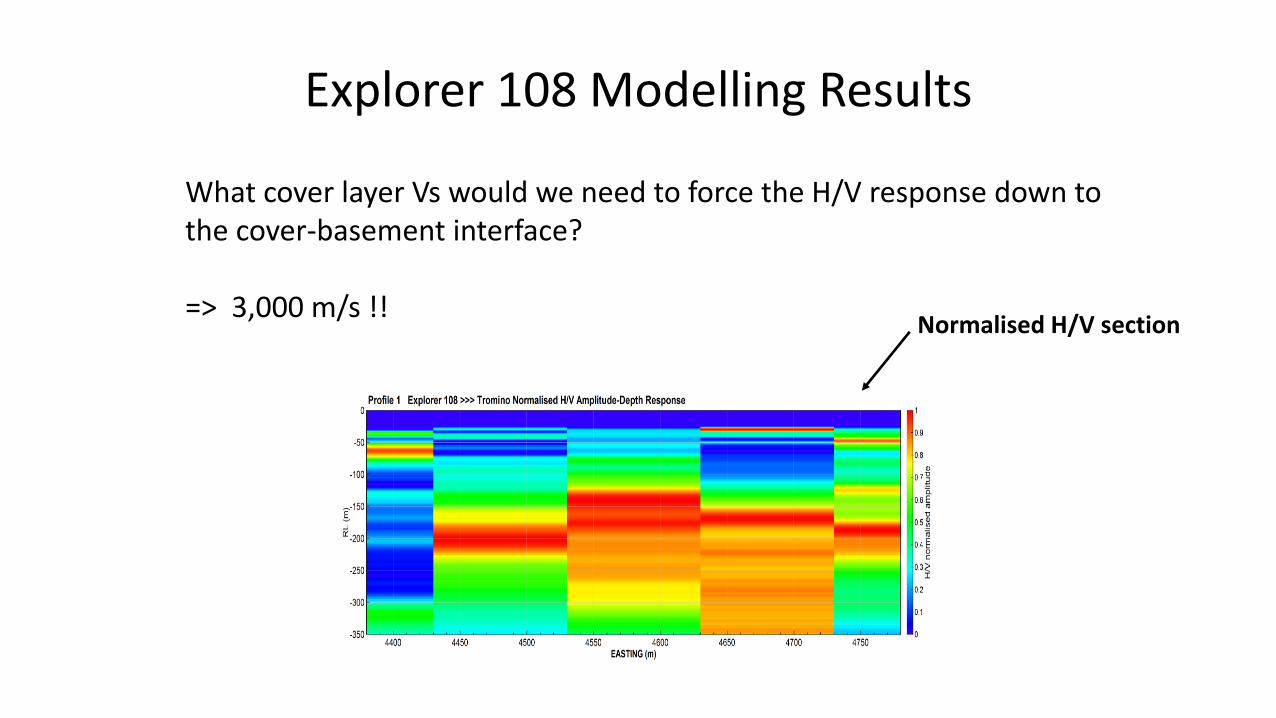
Explorer 108 Modelling Results
What cover layer Vs would we need to force the H/V response down to the cover-basement interface?
=> 3,000 m/s !!
Normalised H/V section
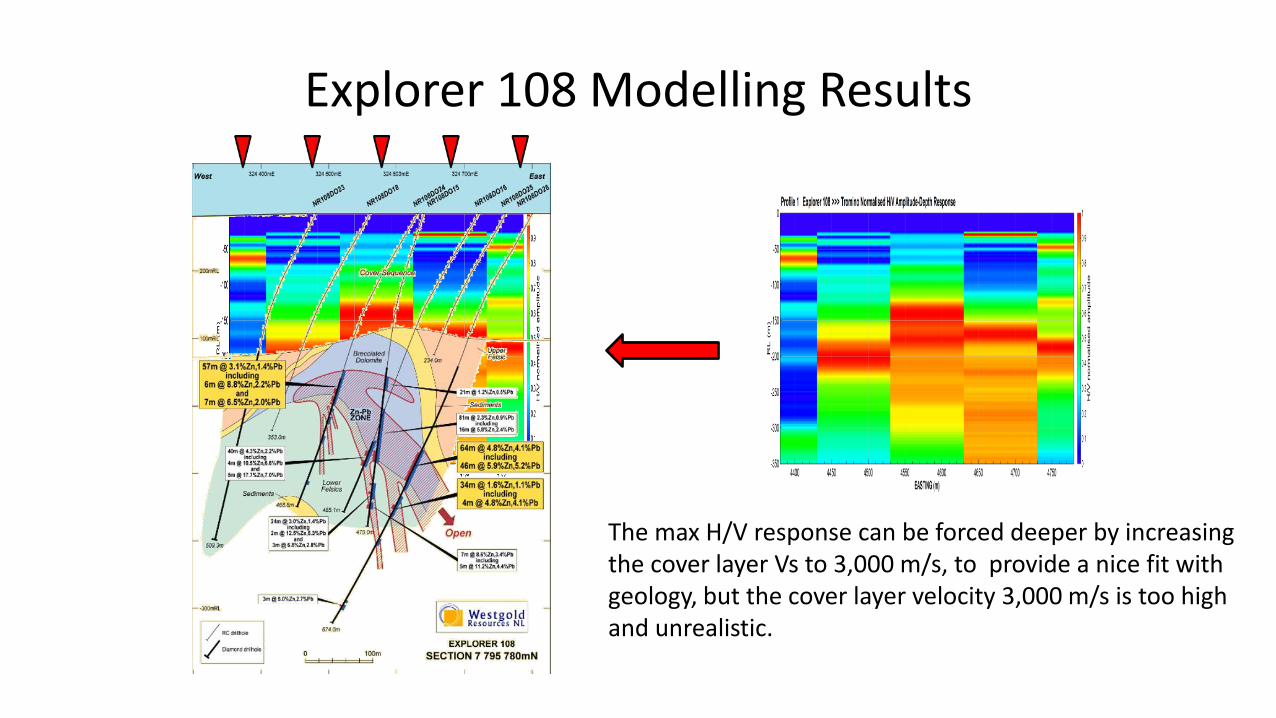
Explorer 108 Modelling Results
The max H/V response can be forced deeper by increasing the cover layer Vs to 3,000 m/s, to provide a nice fit with geology, but the cover layer velocity 3,000 m/s is too high and unrealistic.
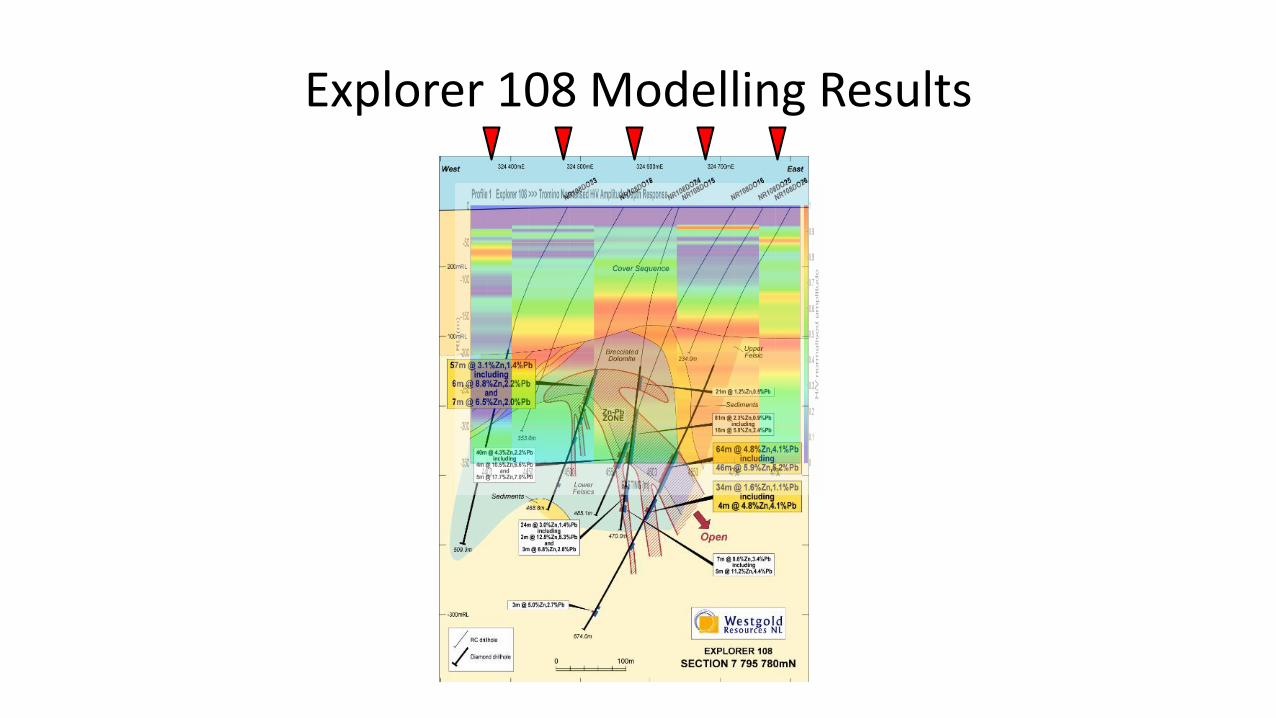
Explorer 108 Modelling Results
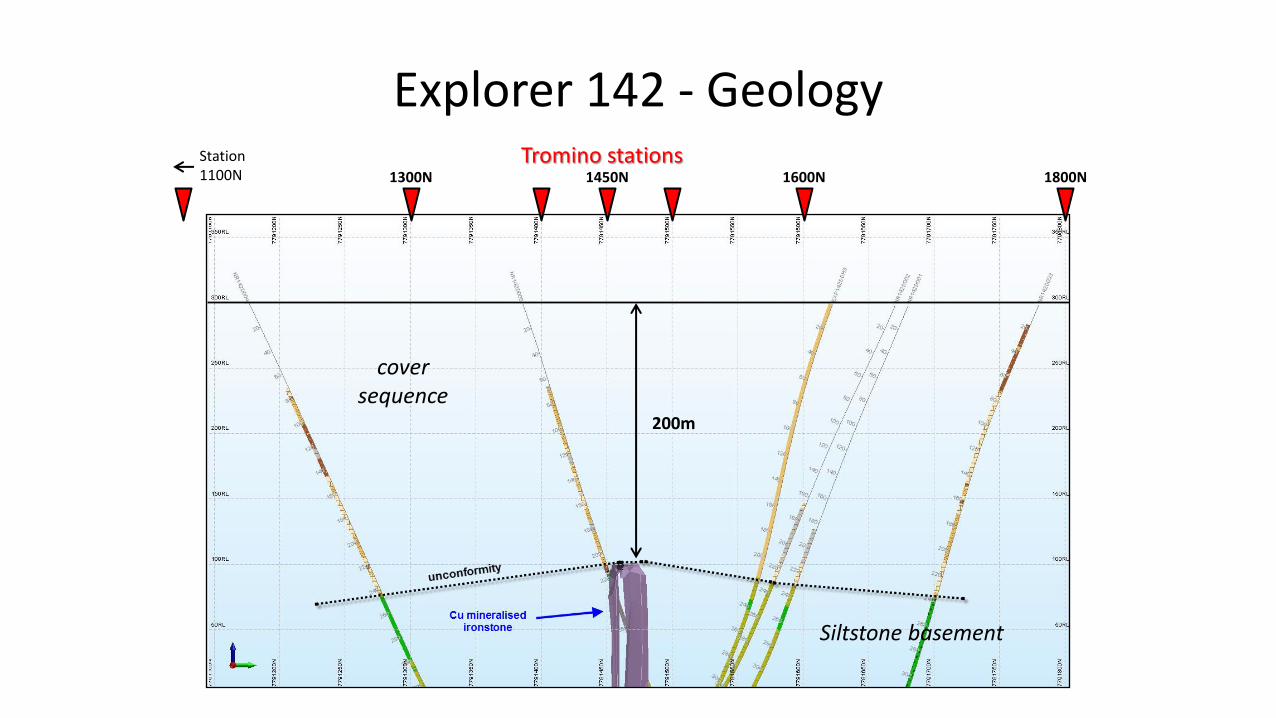
Explorer 142 - Geology Tromino stations
cover sequence
Station 1100N 1300N 1450N 1600N 1800N
200m
Siltstone basement
Explorer 142 - Tromino measurements
• All readings were taken over a 20 minute period.
• Some repeat tests were completed on the central survey station 1450N using a 10 minute recording period.
• Repeat tests on the central station included:
1) using a small generator located 50m to the southeast of the station, and
2) driving a ute around the eastern side of the station.
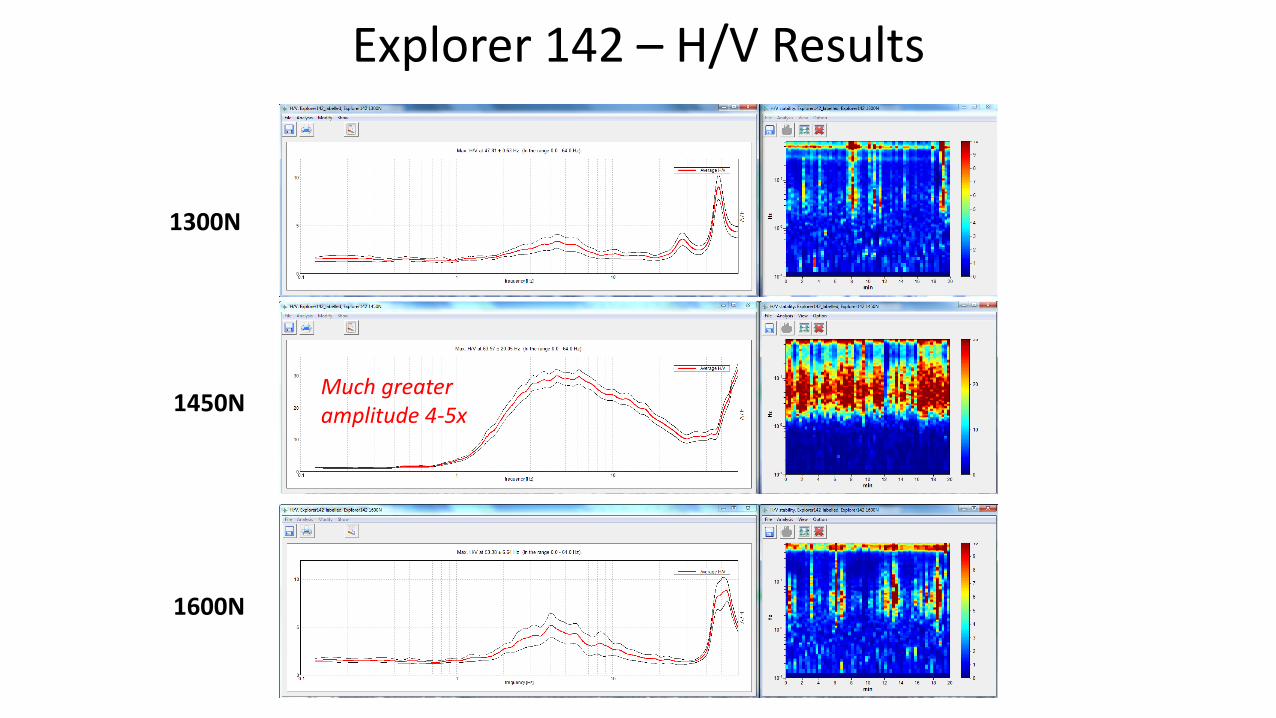
Explorer 142 – H/V Results
1450N
1300N
1600N
Much greater amplitude 4-5x
Explorer 142 – H/V Results
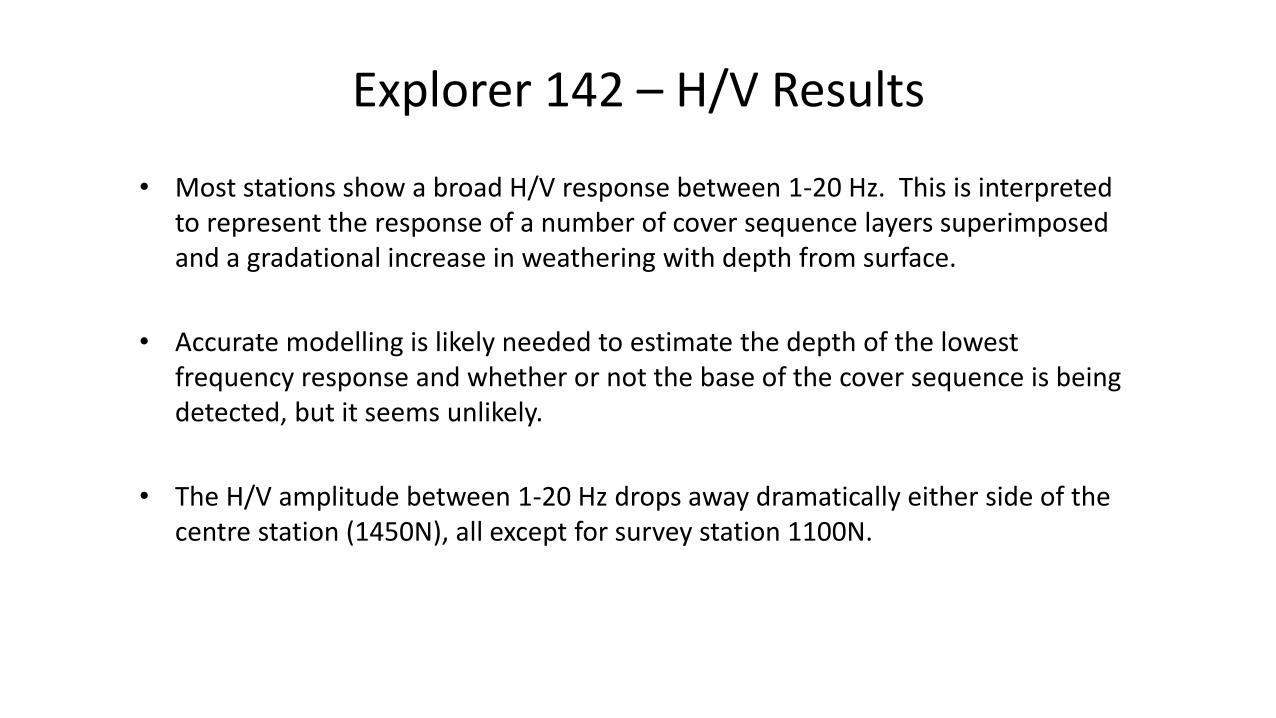
• Most stations show a broad H/V response between 1-20 Hz. This is interpreted to represent the response of a number of cover sequence layers superimposed and a gradational increase in weathering with depth from surface.
• Accurate modelling is likely needed to estimate the depth of the lowest frequency response and whether or not the base of the cover sequence is being detected, but it seems unlikely.
• The H/V amplitude between 1-20 Hz drops away dramatically either side of the centre station (1450N), all except for survey station 1100N.
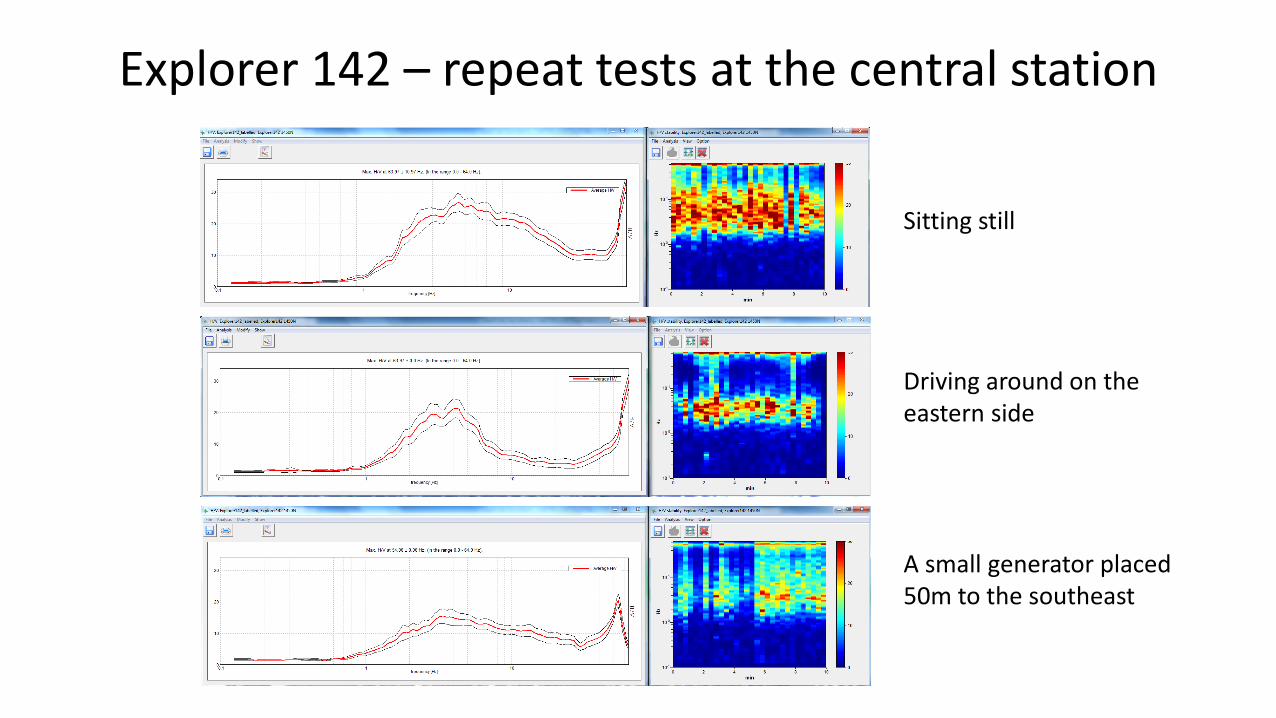
Explorer 142 – repeat tests at the central station
Sitting still
Driving around on the eastern side
A small generator placed 50m to the southeast
Explorer 142 – repeat tests at central station
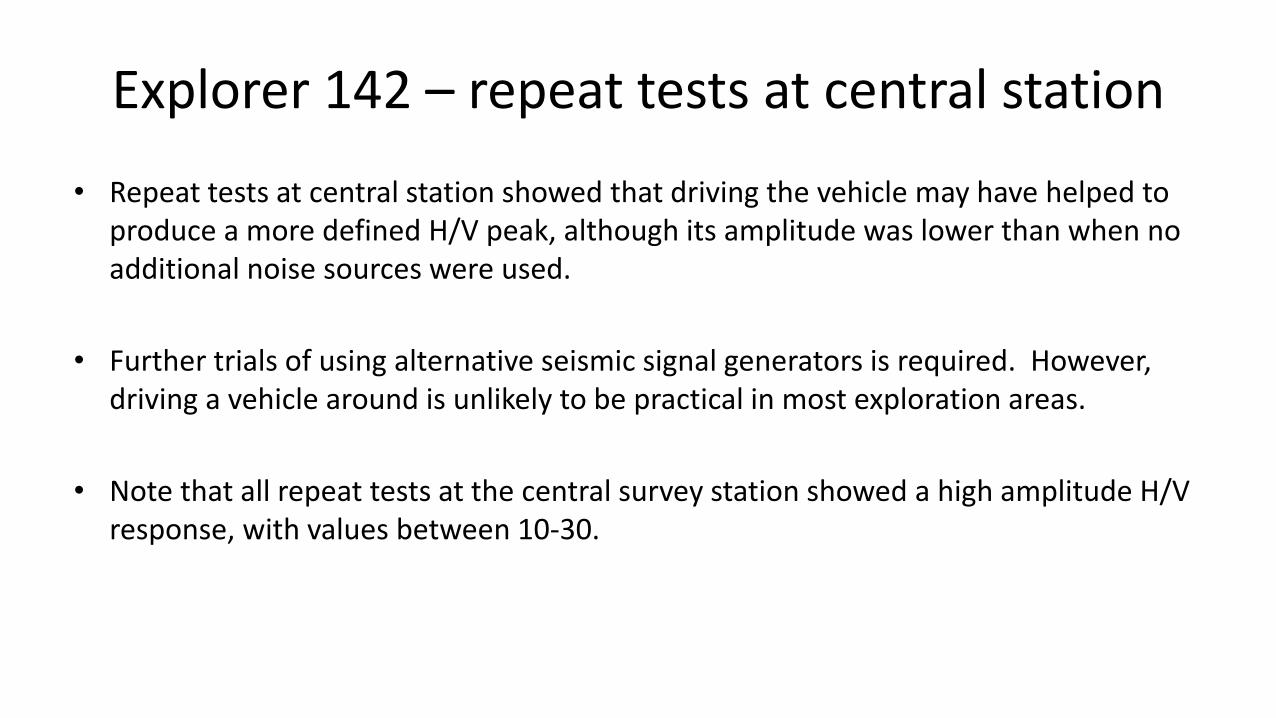
• Repeat tests at central station showed that driving the vehicle may have helped to produce a more defined H/V peak, although its amplitude was lower than when no additional noise sources were used.
• Further trials of using alternative seismic signal generators is required. However, driving a vehicle around is unlikely to be practical in most exploration areas.
• Note that all repeat tests at the central survey station showed a high amplitude H/V response, with values between 10-30.
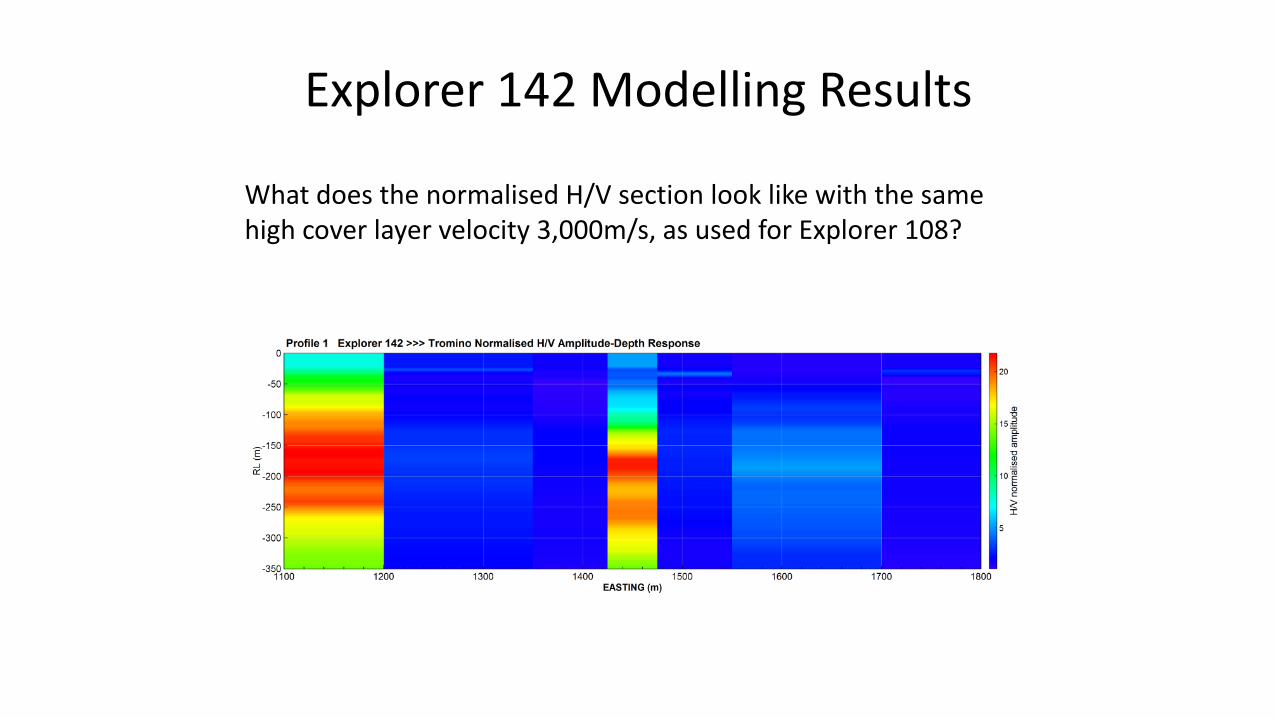
Explorer 142 Modelling Results
What does the normalised H/V section look like with the same high cover layer velocity 3,000m/s, as used for Explorer 108?
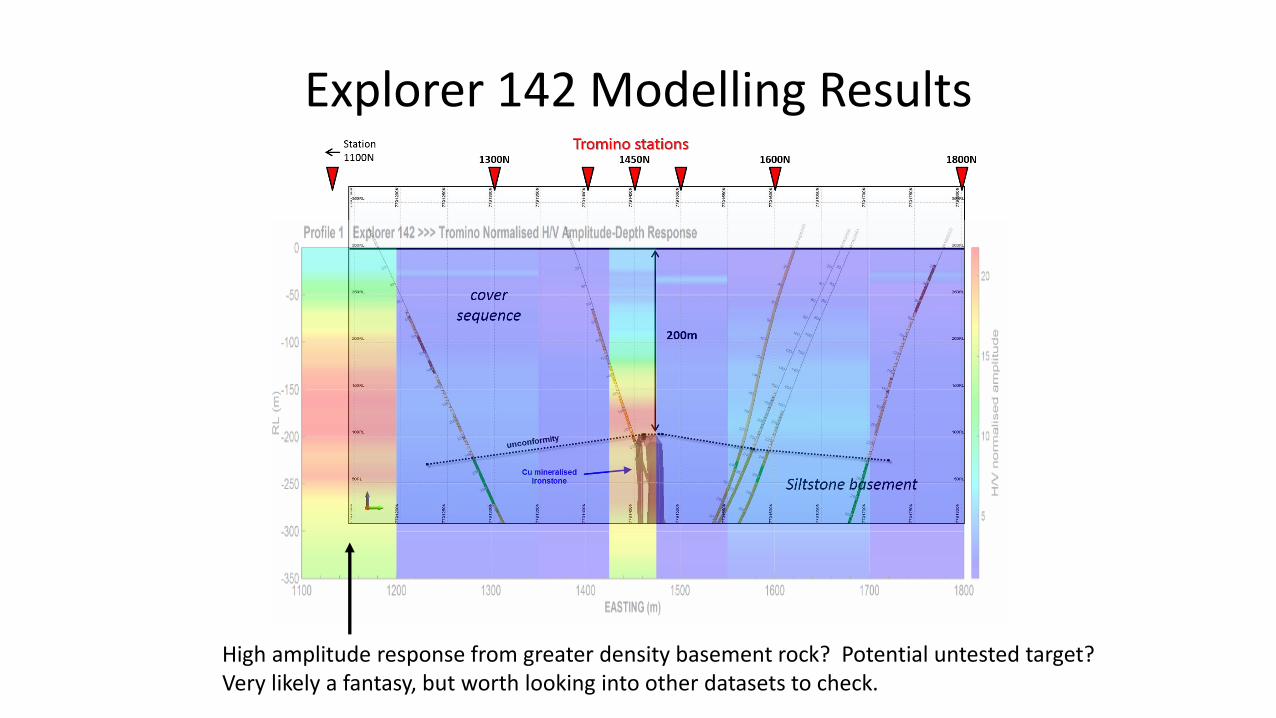
Explorer 142 Modelling Results
High amplitude response from greater density basement rock? Potential untested target? Very likely a fantasy, but worth looking into other datasets to check.
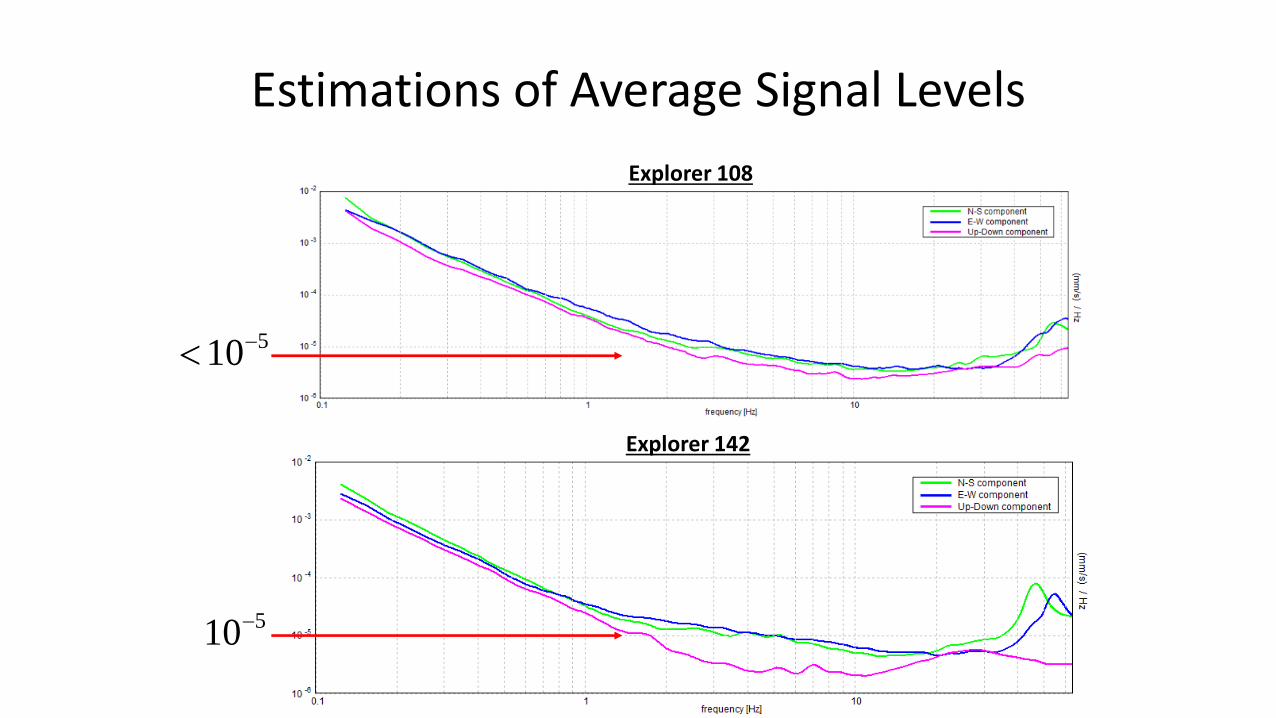
Estimations of Average Signal Levels
510
Explorer 142
Explorer 108
510
Tenant Creek Summary
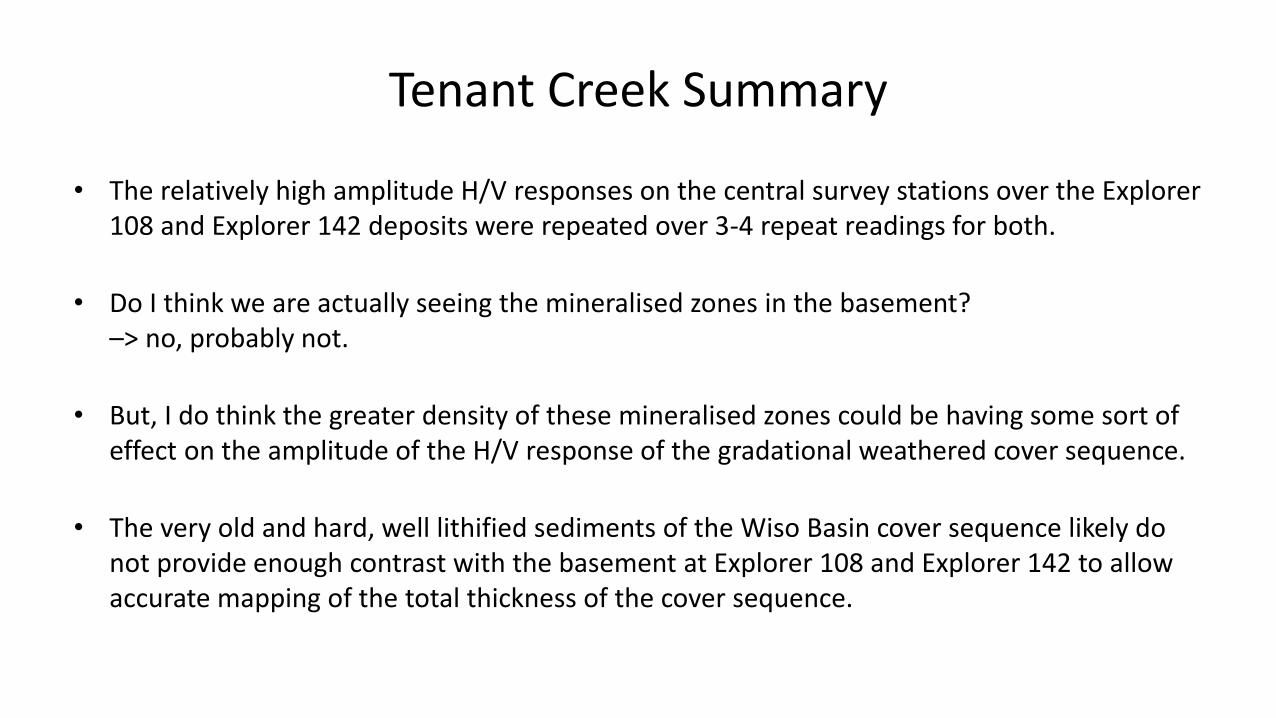
• The relatively high amplitude H/V responses on the central survey stations over the Explorer 108 and Explorer 142 deposits were repeated over 3-4 repeat readings for both.
• Do I think we are actually seeing the mineralised zones in the basement? –> no, probably not.
• But, I do think the greater density of these mineralised zones could be having some sort of effect on the amplitude of the H/V response of the gradational weathered cover sequence.
• The very old and hard, well lithified sediments of the Wiso Basin cover sequence likely do not provide enough contrast with the basement at Explorer 108 and Explorer 142 to allow accurate mapping of the total thickness of the cover sequence.
3. Millennium Zn Prospect, Paterson Province, WA
• H/V trial surveys were completed to inform regolith cover 3D surfaces, which have been used to forward model the gravity response of regolith cover, and then subtract this result from the original gravity grid data to produce a gravity image that is more representative of basement geology.
• The client has historically considered a simple view of the regolith cover in this area – that it is made up of thin transported cover, and then a thicker sequence of Paterson Formation - fairly flat cover sequences and there shouldn’t be too many surprises…
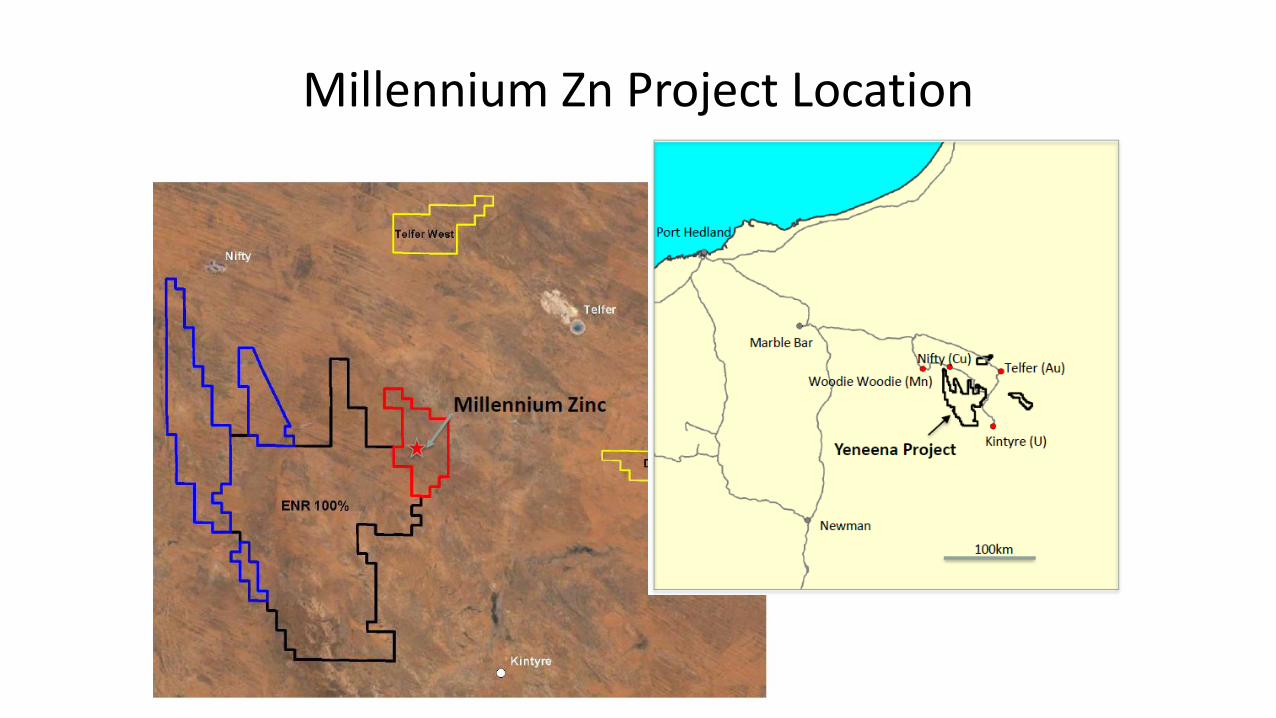
Millennium Zn Project Location
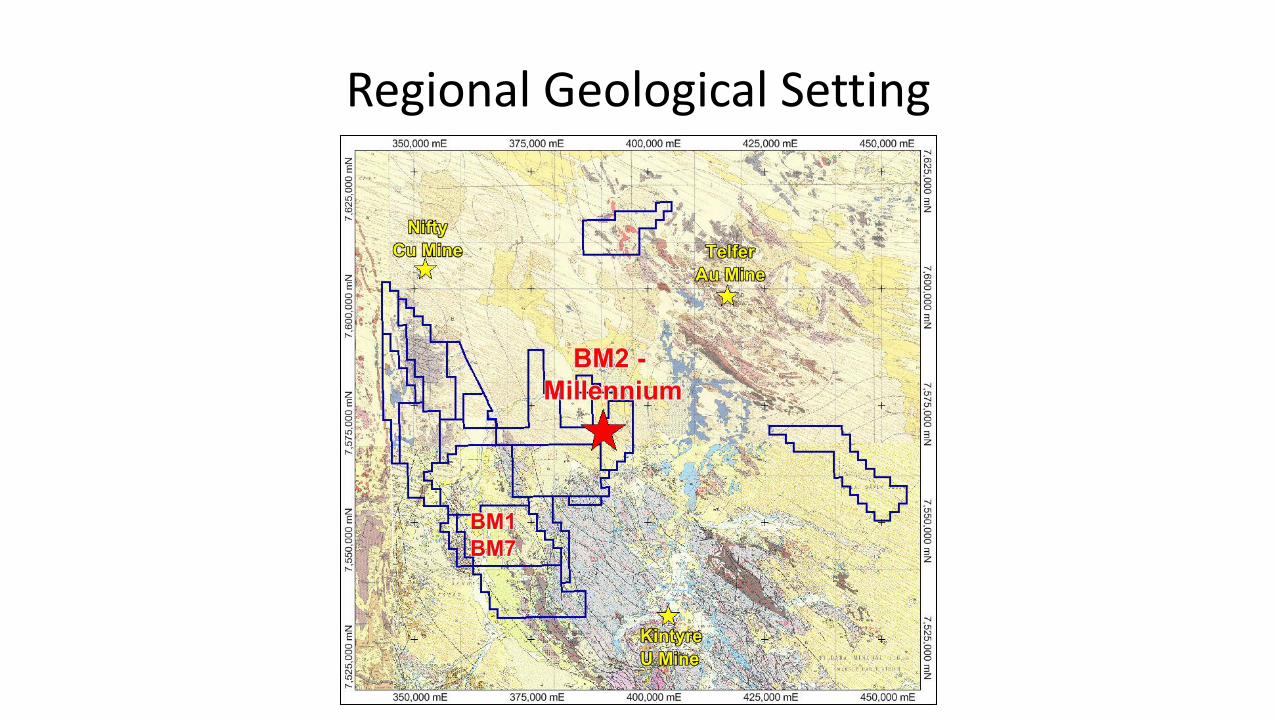
Regional Geological Setting
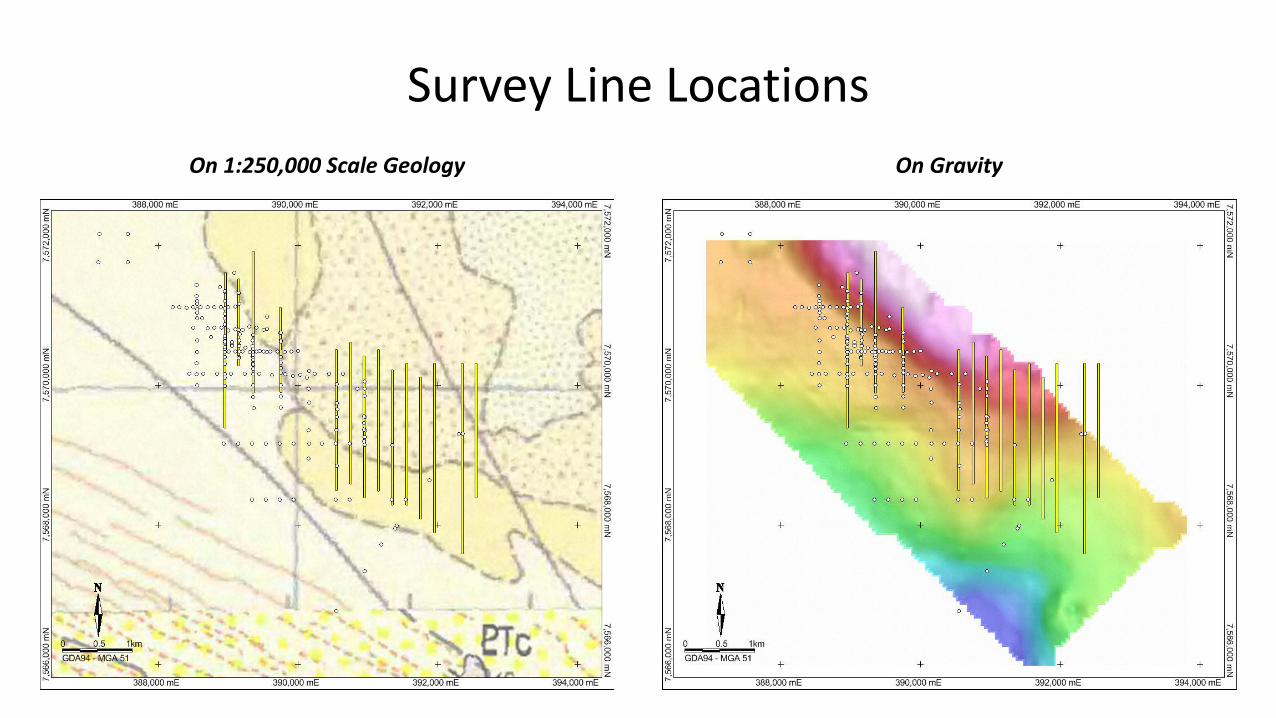
Survey Line Locations
On 1:250,000 Scale Geology On Gravity
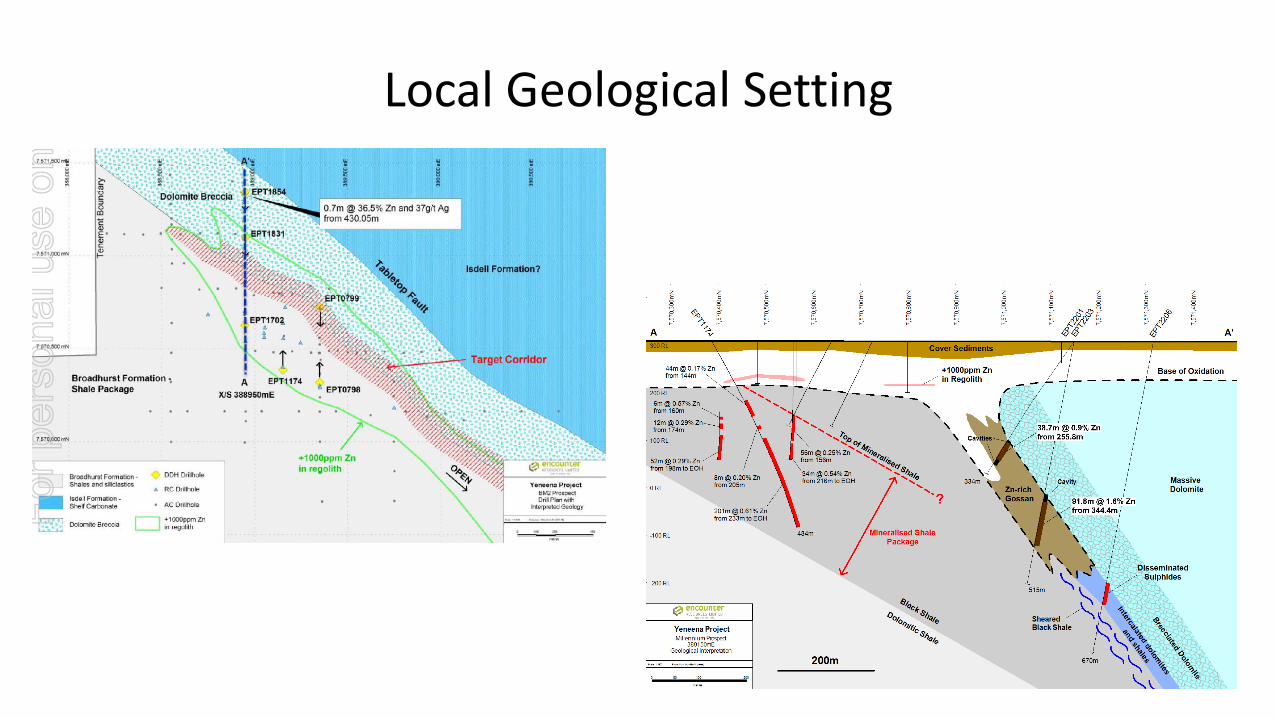
Local Geological Setting
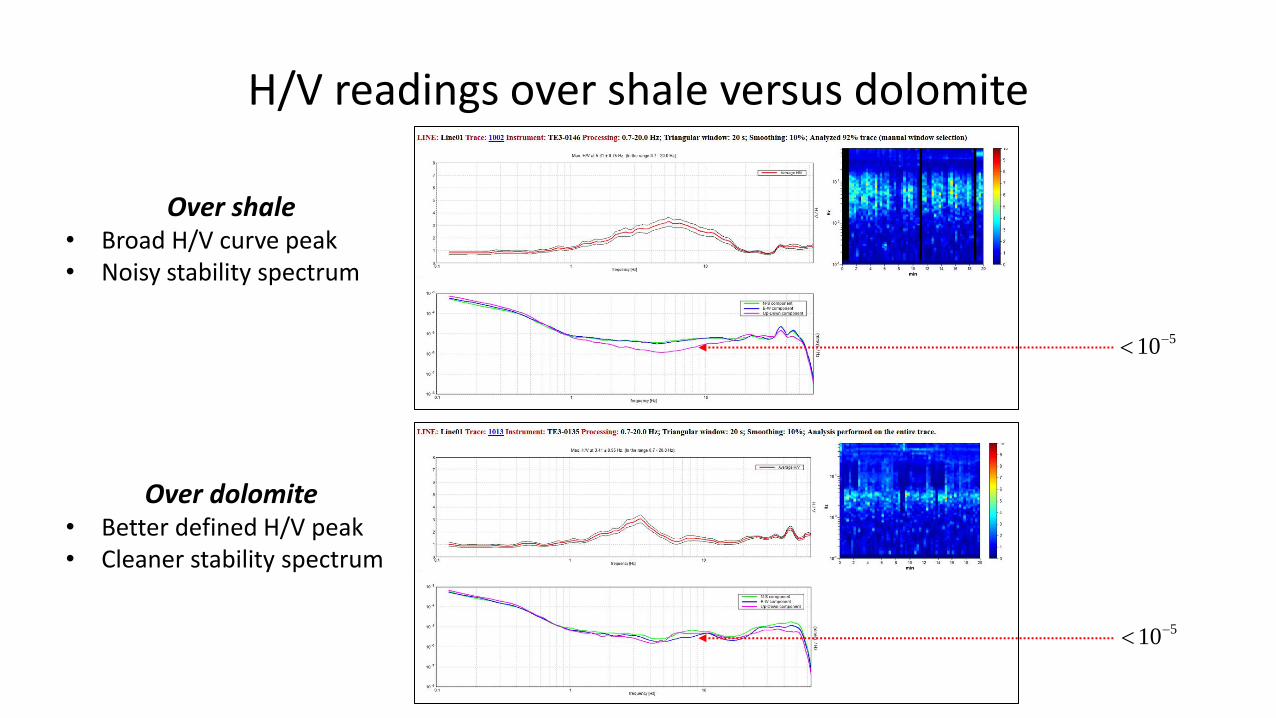
H/V readings over shale versus dolomite
Over shale • Broad H/V curve peak • Noisy stability spectrum
Over dolomite • Better defined H/V peak • Cleaner stability spectrum
510
510
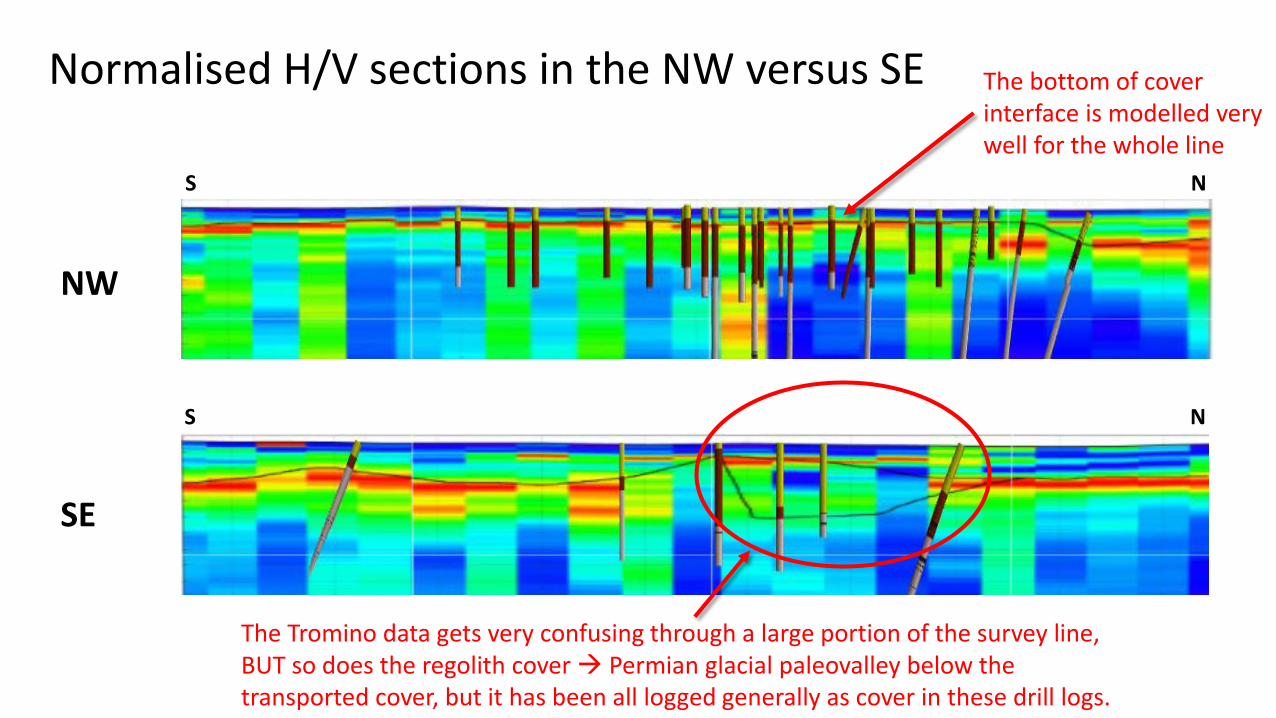
Normalised H/V sections in the NW versus SE
NW
SE
The bottom of cover interface is modelled very well for the whole line
The Tromino data gets very confusing through a large portion of the survey line, BUT so does the regolith cover Permian glacial paleovalley below the transported cover, but it has been all logged generally as cover in these drill logs.
S N
S N
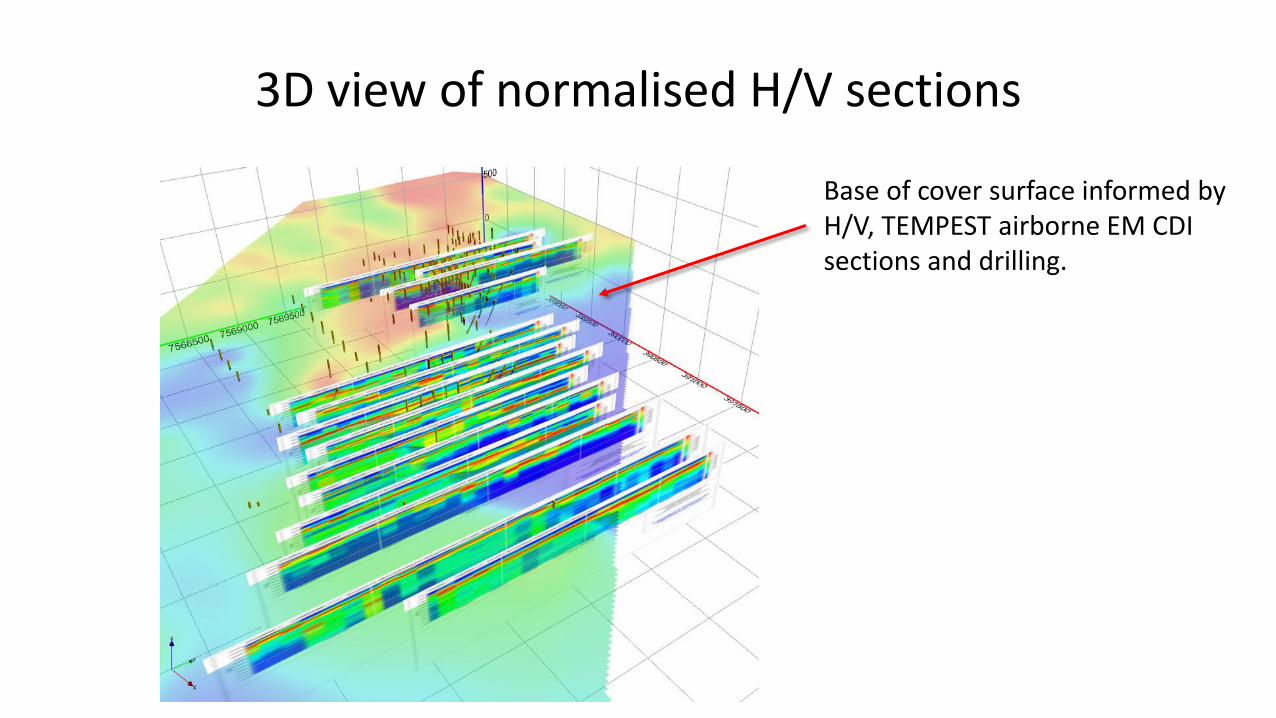
3D view of normalised H/V sections
Base of cover surface informed by H/V, TEMPEST airborne EM CDI sections and drilling.
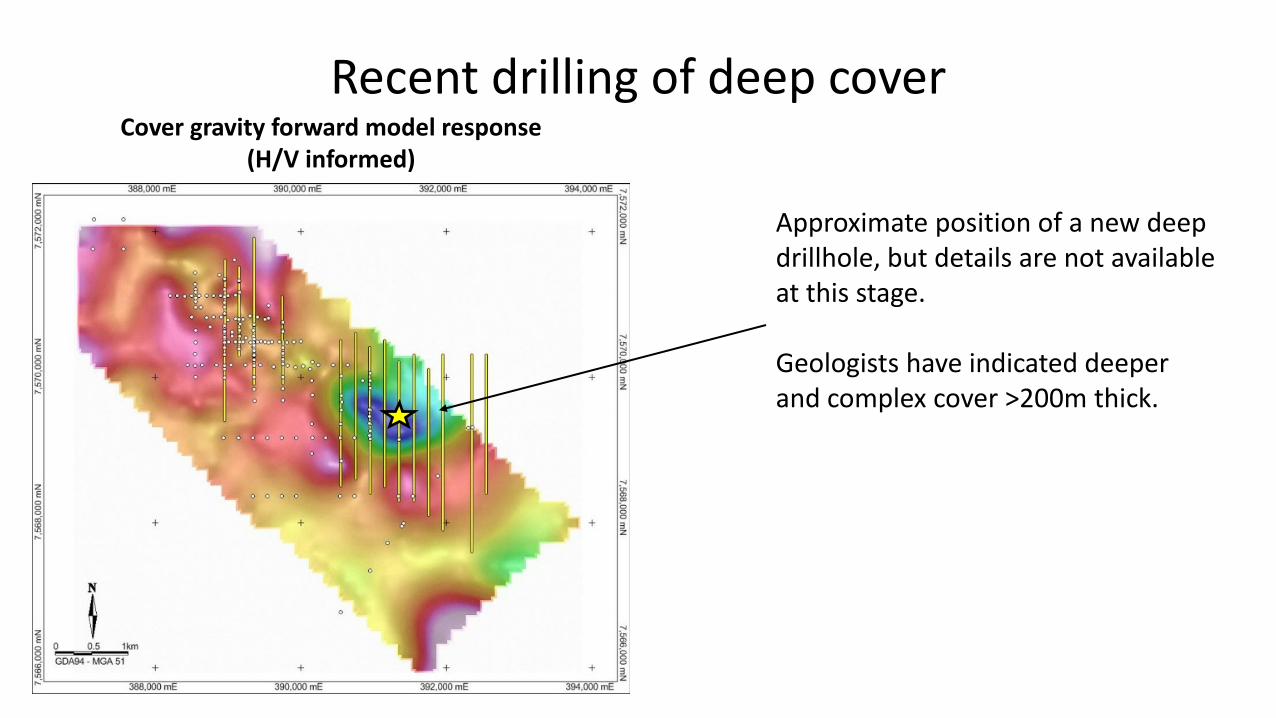
Recent drilling of deep cover
Approximate position of a new deep drillhole, but details are not available at this stage. Geologists have indicated deeper and complex cover >200m thick.
Cover gravity forward model response (H/V informed)
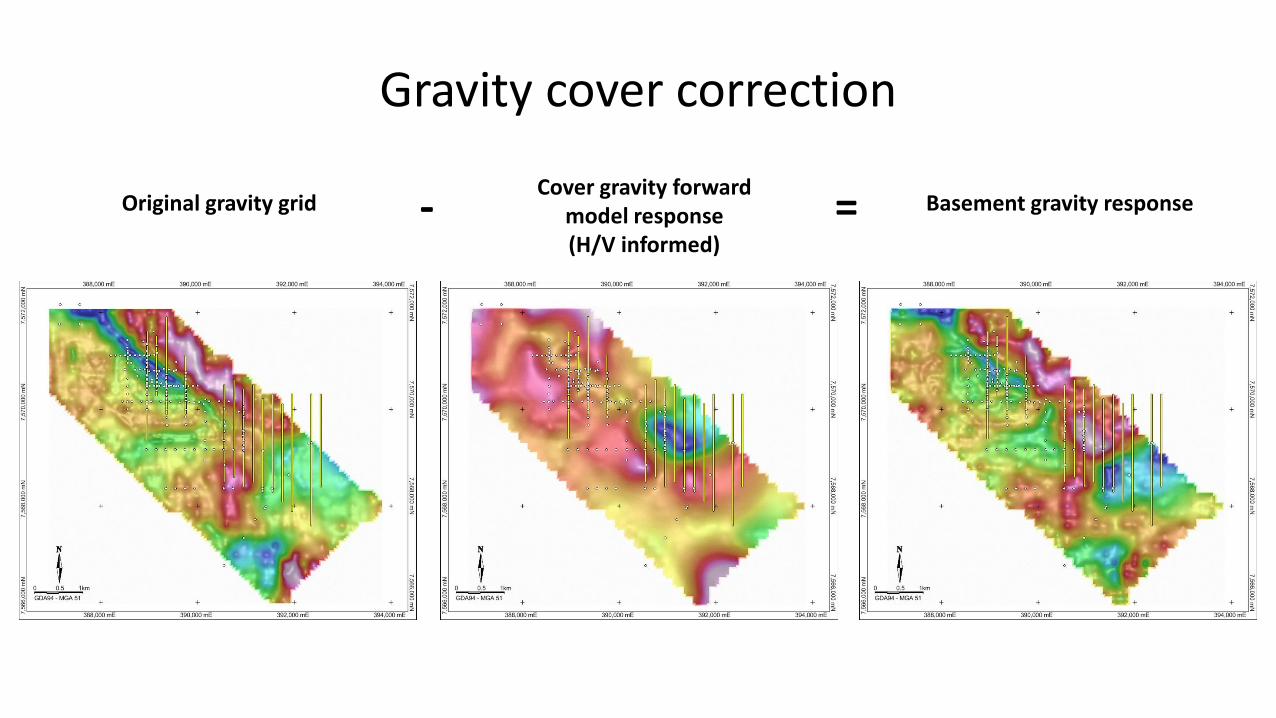
Gravity cover correction
Cover gravity forward model response (H/V informed)
Original gravity grid Basement gravity response - =
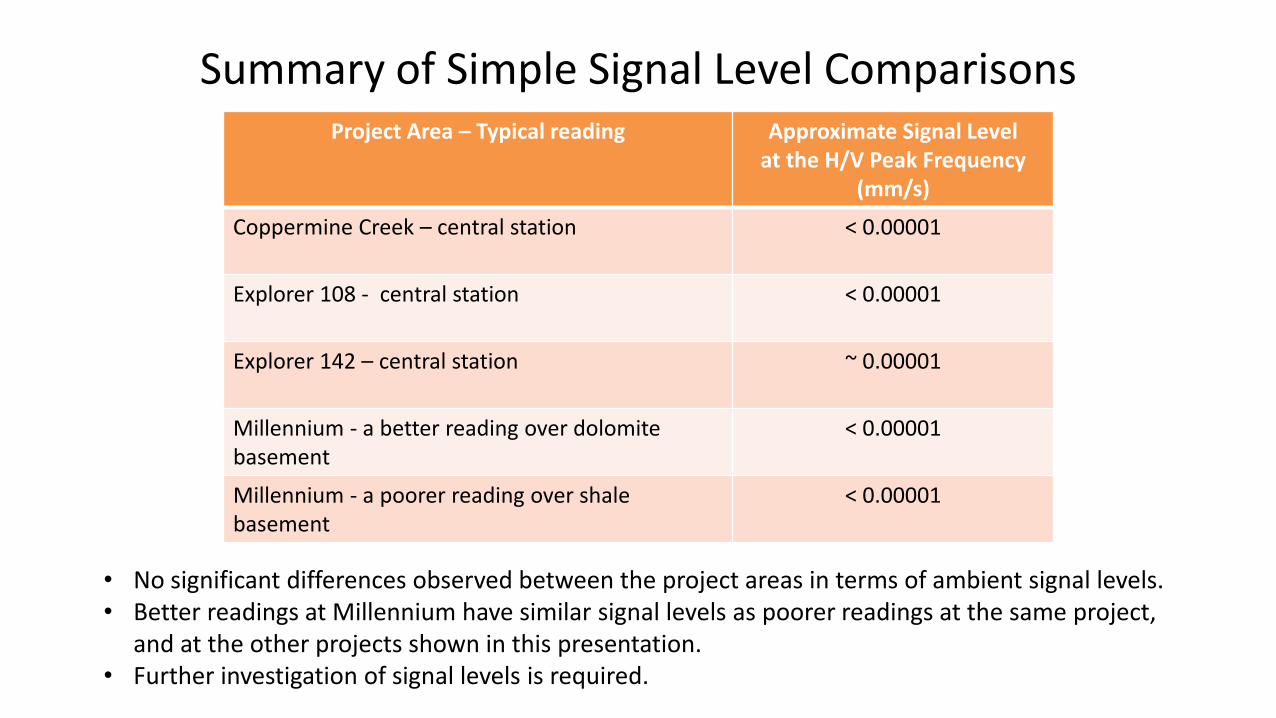
Summary of Simple Signal Level Comparisons Project Area – Typical reading Approximate Signal Level
at the H/V Peak Frequency (mm/s)
Coppermine Creek – central station < 0.00001
Explorer 108 - central station < 0.00001
Explorer 142 – central station ~ 0.00001
Millennium - a better reading over dolomite basement
< 0.00001
Millennium - a poorer reading over shale basement
< 0.00001
• No significant differences observed between the project areas in terms of ambient signal levels. • Better readings at Millennium have similar signal levels as poorer readings at the same project,
and at the other projects shown in this presentation. • Further investigation of signal levels is required.
Overall Summary
• The Tenant Creek datasets show broad H/V peaks, which are most likely related to a gradational weathering profile within the Wiso Basin cover sediments.
• At this stage, the elevated H/V responses in the centre of the two survey lines, over known base metal deposits, just represent an interesting quirk. But do the higher density base metal and alteration zones somehow affect the amplitude of the H/V response?
Overall Summary
• We can’t expect a good H/V response when there’s a poor impedance contrast between layers.
• We need to get a better understanding of ambient signals and what is a low signal level (mm/s), so we can better understand the cause of poor data – do I blame it on poor impedance contrast, weak ambient signal, poor ground coupling or instrument error….OR is it just due to a complex cover geology?
• Weathered geology / gradational interfaces create poorly defined H/V peaks, but these negative effects can be minimized by increasing survey coverage and station density, and integrating other available datasets, where possible.
The Final Slide
• Thanks!


