12
Passive Strategy Attribution Dax Johnson, CFA

Passive Strategy Attribution
Dax Johnson, CFA

Attribution Approaches
Active Management
Single-factor
Multi-factor
Arithmetic / Geometric
Top down
Bottom up
State Street Limited Access: ISA-0217

Single-Factor Equity Attribution
Excess Return Allocation
Selection
Interaction
Timing / Residual
Attributable
State Street Limited Access: ISA-0217

Single-Factor Equity Attribution
Excess Return
1.37% Allocation
117 bps
Selection
16 bps
Interaction
1 bp
Timing / Residual
3 bps
Attributable
134 bps
Excess Return
0.04% Allocation
0 bps
Selection
1 bps
Interaction
0 bps
Timing / Residual
3 bps
Attributable
1 bps
Active Strategy Example
Passive Strategy Example
State Street Limited Access: ISA-0217
State Street Limited Access: ISA-0217
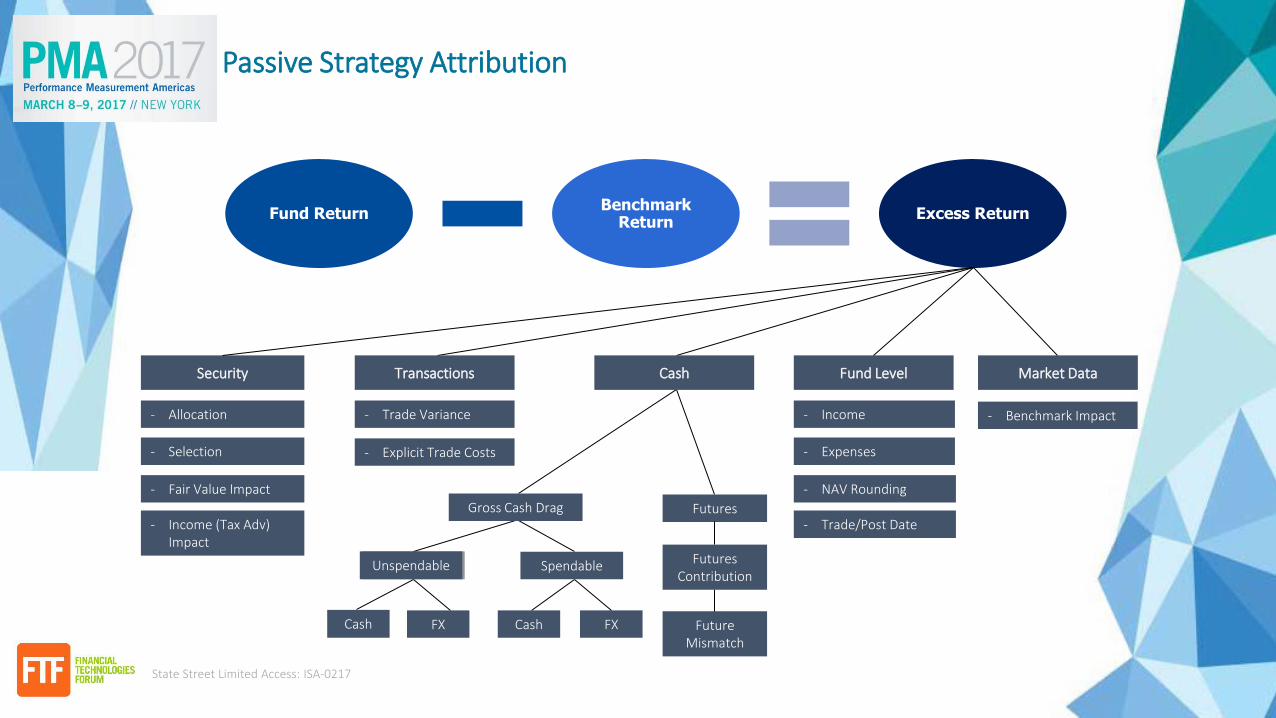
Passive Strategy Attribution
Fund Return Benchmark
Return Excess Return
Security Market Data Fund Level
- Allocation - Income
Unspendable
FX
- Benchmark Impact
- Selection - Expenses
- NAV Rounding
- Trade/Post Date
- Fair Value Impact
- Income (Tax Adv) Impact
Transactions Cash
- Trade Variance
Gross Cash Drag Futures
Unspendable Spendable Futures
Contribution
Future
Mismatch
Cash Cash FX
- Explicit Trade Costs

Attribution and the Investment Life Cycle
CONSTRUCT MEASURE
REPORT MANAGE
Performance
Measurement
and Attribution
State Street Limited Access: ISA-0217

State Street Limited Access: ISA-0217
Passive Strategy Attribution
Fund Return Benchmark
Return Excess Return
Security Market Data Fund Level
- Allocation - Income
Gross Cash Drag
Unspendable
FX
- Benchmark Impact
- Selection - Expenses
- NAV Rounding
- Trade/Post Date
- Fair Value Impact
- Income (Tax Adv) Impact
Transactions Cash
- Trade Variance
Gross Cash Drag Futures
Unspendable Spendable Futures
Contribution
Future
Mismatch
Cash Cash FX
- Explicit Trade Costs
Controllable Measures

Cash Drag
Calculate Implicit Cash
• Currency and Sweep Vehicle
• Pending Receivables
Measure Impact of Implicit Cash
• Compare return to benchmark
• 𝑤𝐶𝑃 × 𝑟𝐶
𝑃 − 𝑅𝐵
• Produces gross cash drag
Calculate Impact of Overlay
• Contribution of overlay based on futures mark-to-market or other instruments
Net Cash Drag
• The sum of gross drag and overlay contribution
Identify the amount of uninvested assets in the portfolio and measure the impact relative to benchmark, including the impact of an overlay program.
State Street Limited Access: ISA-0217

Trade-date vs. Post-date – an example
In this extreme example, the gain on a transaction mid-day captured on trade date versus T+1 is significant due to the changing denominator
Shares Pricing Market Values
Beginning Transaction
Prior Day
Close Execution
Market
Close Beginning Beg + Flow Ending
Transaction
P&L
Stock A 500 - 123.58 127.28 61,790 63,640 -
Stock B 2,000 1,000 71.38 70.00 74.03 142,760 222,090 4,030
Stock C 1,350 - 42.61 44.38 57,524 59,913 -
Total 262,074 332,074 345,643 4,030
Impact of Transaction 1.214% 1.166%
State Street Limited Access: ISA-0217

NAV Rounding – an example
In this extreme example, a fund’s return is nearly 8 basis points different when using an official 2-digit NAV when compared to an extended 6-digit NAV
Prior Day Ending NAV Current Day Ending NAV Current Day Return
Official NAV 12.270000 12.310000 0.326%
Extended NAV 12.265148 12.314581 0.403%
NAV Rounding -0.077%
State Street Limited Access: ISA-0217

Implementation Challenges
• Well known market indexes are often used to measure performance on passive funds
• Specialized products exist to address fair value, varying exchange rates, and pricing sources
Broad versus Specialized Indexes
• Licensing and distribution challenges
• Processing of constituent data and multiple versions of the same index
Market Data Needs
• Heavily depending on granular accounting information
• Focused on several ledger-based transactions
Accounting
State Street Limited Access: ISA-0217

12
Disclaimer
The material presented herein is for informational purposes only. The views expressed herein are subject to change based on market and other conditions and factors. The opinions expressed herein reflect general perspectives and information and are not tailored to specific requirements, circumstances and / or investment philosophies. The information presented herein does not take into account any particular investment objectives, strategies, tax status or investment horizon. It does not constitute investment research or investment, legal, or tax advice and it should not be relied on as such. It should not be considered an offer or solicitation to buy or sell any product, service, investment, security or financial instrument or to pursue any trading or investment strategy. It does not constitute any binding contractual arrangement or commitment of any kind. State Street is not, by virtue of providing the material presented herein or otherwise, undertaking to manage money or act as your fiduciary.
You acknowledge and agree that the material presented herein is not intended to and does not, and shall not, serve as the primary basis for any investment decisions. You should evaluate and assess this material independently in light of those circumstances. We encourage you to consult your tax or financial advisor.
All material, including information from or attributed to State Street, has been obtained from sources believed to be reliable, but its accuracy is not guaranteed and State Street does not assume any responsibility for its accuracy, efficacy or use. Any information provided herein and obtained by State Street from third parties has not been reviewed for accuracy. Any investment involves risk and past performance is not guarantee of future results. In addition, forecasts, projections, or other forward-looking statements or information, whether by State Street or third parties, are not guarantees of future results or future performance, are inherently uncertain, are based on assumptions that, at the time, are difficult to predict, and involve a number of risks and uncertainties. Actual outcomes and results may differ materially from what is expressed herein. The information presented herein may or may not produce results beneficial to you. State Street does not undertake and is under no obligation to update or keep current the information or opinions contained in this communication.
To the fullest extent permitted by law, this information is provided “as-is” at your sole risk and neither State Street nor any of its affiliates or third party providers makes any guarantee, representation, or warranty of any kind regarding such information, including, without limitation, any representation that any investment, security or other property is suitable for you or for others or that any materials presented herein will achieve the results intended. State Street and its affiliates and third party providers disclaim any warranty and all liability, whether arising in contract, tort or otherwise, for any losses, liabilities, damages, expenses or costs, either direct, indirect, consequential, special or punitive, arising from or in connection with your access to and / or use of the information herein. Neither State Street nor any of its affiliates or third party providers shall have any liability, monetary or otherwise, to you or any other person or entity in the event the information presented herein produces incorrect, invalid or detrimental results.
No permission is granted to reprint, sell, copy, distribute, or modify any material herein, in any form or by any means without the prior written consent of State Street.
© 2017 State Street Corporation. All rights reserved.
State Street Limited Access: ISA-0217


