Page 1
PatentCafe • 2890 Gateway Oaks Dr., Ste. 250, Sacramento, CA, 95833 • t: 916 239 2500 • © 2006-2008; Pat. Pend.
Patent Portfolio Quality Management
Practical Application of Statistical Patent Quality Analysis of Patent Portfolios for Decision Support in Intellectual Property Management.
Author: Andy Gibbs
Working Paper: JAN 2008
Updated: JUL 2008
Page 2
Statistical Portfolio Quality Analysis using Portfolio-Xpert™
PatentCafe • 2890 Gateway Oaks Dr., Ste. 250, Sacramento, CA, 95833 • t: 916 239 2500 • © 2006-2008; Pat. Pend.
Page 2.
TABLE OF CONTENTS
QUALITATIVE PATENT PORTFOLIO MANAGEMENT
ABSTRACT.............................................................................................................................................3
SUMMARY ............................................................................................................................................4
EVALUATING A PATENT PORTFOLIO ...................................................................................................5
TRANSPARENCY OF PROCESS; RELIABILITY OF RATINGS SCORES..................................................10
Revenue: Potential for revenue generation ............................................................................................12
Cost Reduction: Portfolio triage and pruning of poor patents .................................................................12
Competition: Competitive Patent Position...............................................................................................12
Market Protection: Identifying infringed patents, assessing litigation risks.............................................12
R&D and Patent Strategy: Current patent and market density ...............................................................13
SOX Reporting: Correlating portfolio quality with market capitalization .................................................13
PORTFOLIO-XPERT™ EVALUATION MODULE....................................................................................14
Scenario 1: IP Objective - efficiently deepen portfolio quality through patent acquisition ......................15
Scenario 2: IP Objective - Use Patent Quality Indicators to Organize Large Portfolios .........................21
Scenario 3: IP Objective – Increase licensing revenue with high potential patents ...............................23
Scenario 4: IP Objective – Reduce costs by pruning low quality patents from a large portfolio.............24
Scenario 5: IP Objective – Comparing Portfolio Quality and Market Capitalization ...............................25
CONCLUSION ....................................................................................................................................27
Related white papers: .............................................................................................................................27
DATA AND SOFTWARE TOOLS REFERENCES .....................................................................................27
ENTERPRISE SOLUTIONS TRAINING....................................................................................................27
ABOUT PATENTCAFE .........................................................................................................................28
Page 3
Statistical Portfolio Quality Analysis using Portfolio-Xpert™
PatentCafe • 2890 Gateway Oaks Dr., Ste. 250, Sacramento, CA, 95833 • t: 916 239 2500 • © 2006-2008; Pat. Pend.
Page 3.
Author: Andy Gibbs is the Chairman and CEO of PatentCafe (www.patentcafe.com), a worldwide provider of intellectual
asset & portfolio management software, advanced linguistics patent search technology, Mr. Gibbs was appointed by the
United States Secretary of Commerce to two terms on the USPTO Public Patent Advisory Committee (PPAC). The 9-
member PPAC advises the Patent Office on various budget, legislative and operations matters, and reports annually to the
President and the Judiciary Committees. He is an immediate past member of the Board of Directors, Intellectual Property
Owners Association (www.ipo.org), and is a member of the Licensing Executives Society (www.lesi.org). Mr. Gibbs is a
coauthor of the corporate patent strategy book Essentials of Patents (Wiley & Sons), PatentWriter (Square One Publishing),
and authored more than 100 articles and papers related to IP development, strategy, licensing and management.
Considered one of the premier IP Thought Leaders, he was a member of the esteemed panel of participants in Building a
New IP Marketplace – the IBM / NY Law School WIKI project that discussed policy and process for improving patent
quality, transparency, fair valuation, flexibility and global consistency. He speaks on IP strategy and patent quality
topics at US and international conferences sponsored by organizations including the USPTO, Korean Patent
Office, EPO, Singapore patent office, Thomson Derwent, WIPO, Licensing Executives Society, Patent
Information Users Group, and the National Association of Patent Practitioners.
Abstract With nearly 85% of the market capitalization of the S&P 500 companies being attributable to intellectual property, it goes
without saying that effective management of patent portfolios is now a mission-critical responsibility of senior management.
Not only does effective portfolio management help CEOs and CFOs meet Sarbanes Oxley reporting requirements,
knowledge management of portfolio assets helps executives identify patents that can contribute to bottom line revenue via
licensing, cut costs by pruning poor quality patents, develop effective R&D strategies for future products and technologies,
support competitive patent strategies, and support M&A decisions.
While the importance of portfolio analysis and management have gone largely unchallenged, the methods of evaluation
patent assets has been debated heavily.
By applying a “patent roll-up” approach to statistical evaluation of the qualitative attributes of each patent in a portfolio, this
paper explores the application of Portfolio-Xpert™, a Latent Semantic Analysis based statistical evaluation and indices
scoring system, as one avenue to objective portfolio evaluation.
Page 4
Statistical Portfolio Quality Analysis using Portfolio-Xpert™
PatentCafe • 2890 Gateway Oaks Dr., Ste. 250, Sacramento, CA, 95833 • t: 916 239 2500 • © 2006-2008; Pat. Pend.
Page 4.
Summary
Economists, IP practitioners and business managers have long pursued methods of establishing the value of a patent, and
more broadly, a portfolio of patents. The reasons are many, and include damages calculations during litigation, acquisition
value, technology due diligence, balance sheet recording and reporting of patent assets, government tracking of the
economic impact of research grants, and assessing liquidity of patent asset-backed financing mechanisms, to name a few.
The debate on whether to use Black Shoals, Monte Carlo, or other discounted cash flow methods to compute patent value
will continue.
However, rapidly changing market dynamics, increasing global competition in high growth technology sectors, longer patent
prosecution, and high impact case law are pressuring patent owners to take a more pro-active approach to effective
management of their assets. This creates an immediate need for the deployment of an objective, transparent and highly
granular method of evaluating patents and portfolios to support the IP manager’s day-to-day decisions.
At any given time, IP managers may need decision support information related to R&D budget planning, litigation response
strategy, competitive technology analysis, acquisition analysis, portfolio maintenance cost management, or licensing
revenue evaluation. These are questions that simply cannot be answered using a single-value financial model. Rather, an
easy to understand, multi-dimensional view of the many qualitative features of a patents contained within a portfolio provide
decision-makers with the flexibility of analyzing large portfolios to identify patents that support the present question.
For instance, a patent portfolio will typically contain a large number of patents of nominal quality, and on one end, a smaller
number of exceedingly high quality patents, and on the other end, a smaller number of exceedingly low quality patents
(standard deviation / Bell Curve). In any given infringement litigation or licensing proceeding, the patent of interest will be
either “low” quality, “medium”, or nominal quality, or high quality.
In the above instances, management or court decisions can, and often do, correlate directly to financial gains or losses.
Understanding the business, technology or legal quality of a patent prior to the decision to involve a particular patent in a
proceeding or business process can profoundly affect the outcome, and its financial impacts.
Since the objective of qualitative patent analysis is to provide transparency of key factors that contribute to value, rather
than to predict a static economic value, statistical quality information can be leveraged in licensing or other discussions of
economic valuation based on the immediate opportunity, creating the most realistic business environment.
By using PatentCafe’s Portfolio-Xpert patent analysis software tools as the basis for this paper, we will evaluate individual
patents, as well as a collection of patents comprising entire patent portfolios by applying the qualitative analysis of twenty
statistically computed indicators contributing to patent value.
The veracity of the statistical process used to compute Patent Factor Index scores, as well as the effective application of
patent quality indicators to support the various corporate management objectives will be reviewed in practical scenarios
that reflect traditional, day to day analyses encountered by corporate managers responsible for portfolio management.
Page 5
Statistical Portfolio Quality Analysis using Portfolio-Xpert™
PatentCafe • 2890 Gateway Oaks Dr., Ste. 250, Sacramento, CA, 95833 • t: 916 239 2500 • © 2006-2008; Pat. Pend.
Page 5.
Evaluating A Patent Portfolio
Portfolio evaluation supports operational decision-making. Without a core understanding of the strengths, weaknesses,
opportunities and threats related to the managed patent assets, management is helpless in formulating effective business
or legal strategies.
As Garcia1 suggested, key benefits patent portfolio management include:
• Understand the current patent position of the company in the market
• Perform technological competitor monitoring and technological forecasting
• Leverage the company’s decision-making process: where/when to invest
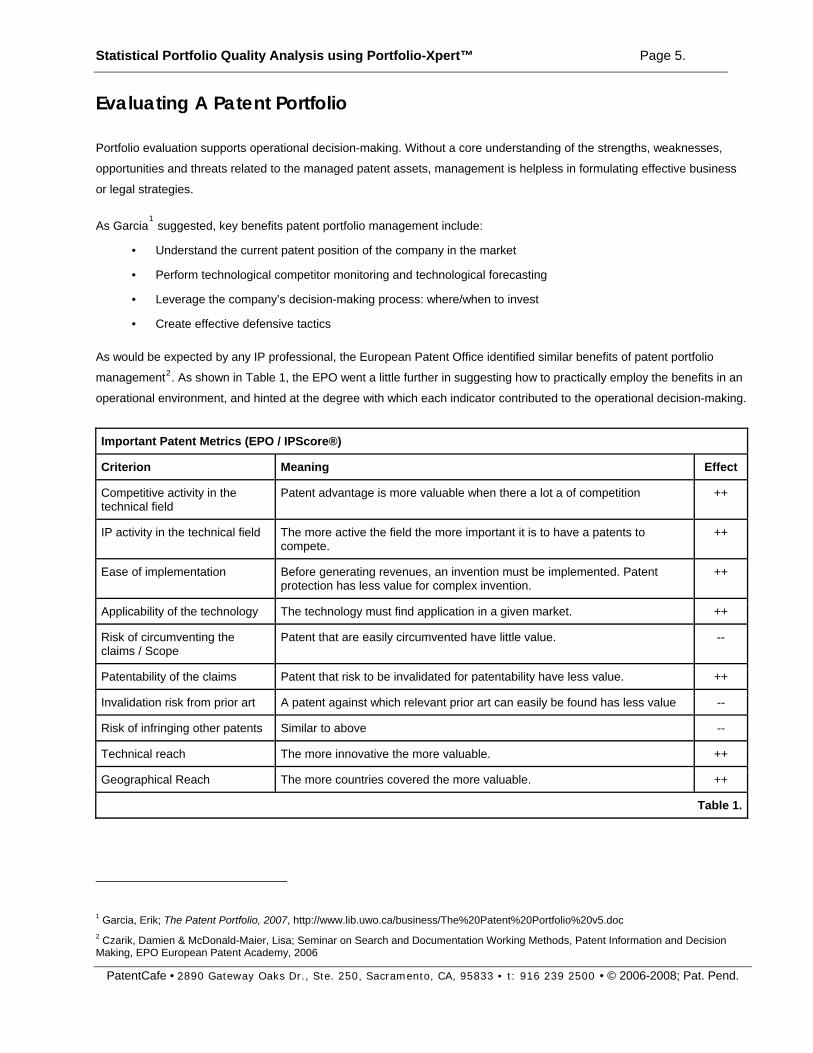
• Create effective defensive tactics As would be expected by any IP professional, the European Patent Office identified similar benefits of patent portfolio
management2. As shown in Table 1, the EPO went a little further in suggesting how to practically employ the benefits in an
operational environment, and hinted at the degree with which each indicator contributed to the operational decision-making.
Important Patent Metrics (EPO / IPScore®)
Criterion Meaning Effect
Competitive activity in the technical field
Patent advantage is more valuable when there a lot a of competition ++
IP activity in the technical field The more active the field the more important it is to have a patents to compete.
++
Ease of implementation Before generating revenues, an invention must be implemented. Patent protection has less value for complex invention.
++
Applicability of the technology The technology must find application in a given market. ++
Risk of circumventing the claims / Scope
Patent that are easily circumvented have little value. --
Patentability of the claims Patent that risk to be invalidated for patentability have less value. ++
Invalidation risk from prior art A patent against which relevant prior art can easily be found has less value --
Risk of infringing other patents Similar to above --
Technical reach The more innovative the more valuable. ++
Geographical Reach The more countries covered the more valuable. ++
Table 1.
1 Garcia, Erik; The Patent Portfolio, 2007, http://www.lib.uwo.ca/business/The%20Patent%20Portfolio%20v5.doc 2 Czarik, Damien & McDonald-Maier, Lisa; Seminar on Search and Documentation Working Methods, Patent Information and Decision Making, EPO European Patent Academy, 2006
Page 6
Statistical Portfolio Quality Analysis using Portfolio-Xpert™
PatentCafe • 2890 Gateway Oaks Dr., Ste. 250, Sacramento, CA, 95833 • t: 916 239 2500 • © 2006-2008; Pat. Pend.
Page 6.
The EPO’s model, which incorporates IPScore®3, a patent and trademark portfolio evaluation software tool developed by
the Danish Patent Office, begins to highlight the importance of multi-dimensional analysis of IP quality. However, the
solution (a) does not address the key quality indicators deeply enough to support complex decisions by the IP department,
(b) allows the user to establish certain economic parameters, introducing an unacceptable level of subjectivity to enter an
objective evaluation model, and (c) broadly supports the valuation of patents or trademarks. Both forms of IP rely on
important metrics exclusive the either patents or trademarks, and such a broad evaluation model may not fully develop the
IP value in either case.
To fully evaluate the quality of a patent, it must be assessed within its own technology domain, and under real world
conditions created by competitive activity, density of patents attempting to control a technology domain, impacts of the
latest case law on enforceability of patents, and in cases where patent owners maintain a dominant position within a market
space, the compounding effect on the value of each patent within a group of patents under common ownership.
A completely non-human assessment of patent quality, and the contribution of the quality level to patent value, ensures
consistency, repeatability and objectivity of patent evaluation. Rolling up the evaluation scores of many patents into a large
portfolio preserves the granularity needed for deep analytics that support management decisions.
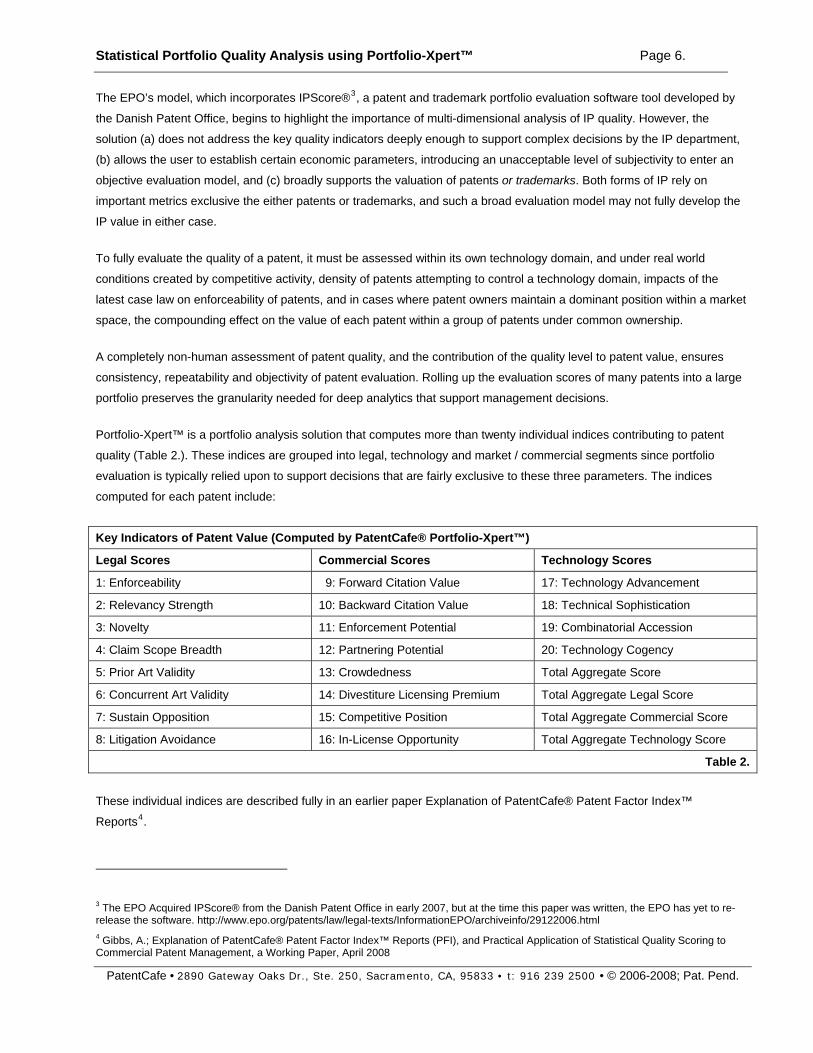
Portfolio-Xpert™ is a portfolio analysis solution that computes more than twenty individual indices contributing to patent
quality (Table 2.). These indices are grouped into legal, technology and market / commercial segments since portfolio
evaluation is typically relied upon to support decisions that are fairly exclusive to these three parameters. The indices
computed for each patent include:
Key Indicators of Patent Value (Computed by PatentCafe® Portfolio-Xpert™)
Legal Scores Commercial Scores Technology Scores
1: Enforceability 9: Forward Citation Value 17: Technology Advancement
2: Relevancy Strength 10: Backward Citation Value 18: Technical Sophistication
3: Novelty 11: Enforcement Potential 19: Combinatorial Accession
4: Claim Scope Breadth 12: Partnering Potential 20: Technology Cogency
5: Prior Art Validity 13: Crowdedness Total Aggregate Score
6: Concurrent Art Validity 14: Divestiture Licensing Premium Total Aggregate Legal Score
7: Sustain Opposition 15: Competitive Position Total Aggregate Commercial Score
8: Litigation Avoidance 16: In-License Opportunity Total Aggregate Technology Score
Table 2.
These individual indices are described fully in an earlier paper Explanation of PatentCafe® Patent Factor Index™
Reports4.
3 The EPO Acquired IPScore® from the Danish Patent Office in early 2007, but at the time this paper was written, the EPO has yet to re-release the software. http://www.epo.org/patents/law/legal-texts/InformationEPO/archiveinfo/29122006.html 4 Gibbs, A.; Explanation of PatentCafe® Patent Factor Index™ Reports (PFI), and Practical Application of Statistical Quality Scoring to Commercial Patent Management, a Working Paper, April 2008
Page 7
Statistical Portfolio Quality Analysis using Portfolio-Xpert™
PatentCafe • 2890 Gateway Oaks Dr., Ste. 250, Sacramento, CA, 95833 • t: 916 239 2500 • © 2006-2008; Pat. Pend.
Page 7.
Individually, or in various combinations, these indices provide different looks at a portfolio, on demand, in support of
myriad questions that managers typically bounce against their patent assets.
Page 8
Statistical Portfolio Quality Analysis using Portfolio-Xpert™
PatentCafe • 2890 Gateway Oaks Dr., Ste. 250, Sacramento, CA, 95833 • t: 916 239 2500 • © 2006-2008; Pat. Pend.
Page 8.
Sox Compliance: Portfolio Value Changes In Light Of KSR
Sections 302 and 409 of Sarbanes Oxley (SOX) require, in that public companies report any material decline in value. A
loss of intangible asset value, specifically patent value, certainly falls under the purview of SOX.
Sec. 302, Corporate Responsibility for Financial Reports requires the CEO or CFO to report negative material changes in
corporate value.
Sec. 409, Real Time Issuer Disclosures requires public companies to rapidly report material changes to corporate value.
In deciding KSR, the Supreme Court changed the long-standing definition of obviousness. The decision has shaken the
presumption of validity of granted patents that a company maintains in its portfolio, and correspondingly, the presumed
value of corporate patent portfolios.
Following the Supreme Court decision in KSR v. Teleflex (KSR)5, industry watchers began highlighting the impact KSR
would have on patent portfolios owned by technology centric companies. But taken a step further, they raised the issue of
CEOs and CFOs to accurately report adverse material changes in patent asset value.
• Rulings Weaken Patents' Power6
• Patent Holders' Grip Weakens, High Court Curtails Power Amid Innovation Debate; More Disputes May Arise7
• High Court Puts Limits on Patents8
• How Will Sarbanes-Oxley Reporting Be Affected by KSR?9
Before KSR, a survey10 concluded: “ … 86.4 percent of respondents had no idea how their companies value IP, and 41
percent weren’t sure if the appraised value of IP was accounted for in the company’s balance sheet”.
Now, following KSR in more recent reviews, CEOs and CFOs are considerably challenged to argue ignorance of the impact
on patent value caused by KSR. The Advocate’s Edge noted “Because [KSR] has implications for compliance with the
Sarbanes-Oxley Act (SOX) and certain accounting standards, some companies may require new patent valuations.”11
Previously, I presented a study of the quantitative change in the correlation between statistical indicators of patent quality in
CAFC decisions before and after KSR12; the differences are stark, and illustrate that a qualitative measurement of patent
5 KSR International Co. v. Teleflex, Inc.; http:// www.supremecourtus.gov/opinions/06pdf/04-1350.pdf 6 Barnes & Sipress, Washington Post, May 1, 2007; Page D01 7 Bravin, Wall Street Journal, May 1, 2007 8 Greenhouse, New York Times, May 1, 2007 9 Peter Zura’s 271 Patent Blog, May 1, 2007 10 Patents: What Are They Worth? Sarbanes-Oxley Changes The Way Companies Value IP, Corporate Legal Times, May 2005, Vol. 15, No 162. 11 Supreme Court decision could require fresh patent valuations, Advocate’s Edge, March/April 2008 12 Gibbs. A., Comparison of Statistical Quality Indicators of Patents in CAFC Decisions Before and After KSR V. Teleflex, a working
Page 9
Statistical Portfolio Quality Analysis using Portfolio-Xpert™
PatentCafe • 2890 Gateway Oaks Dr., Ste. 250, Sacramento, CA, 95833 • t: 916 239 2500 • © 2006-2008; Pat. Pend.
Page 9.
value is indeed possible.
The issue does not seem to question corporate reporting responsibilities under KSR, nor the negative impact on patent
values caused by the KSR decision. Rather, the issue raises the question as to how patent portfolios are valued, and how
to determine material changes in that value resulting from the Supreme Court decision.
Sarbanes Oxley Compliance Journal13 suggests that companies first complete an inventory, and then, “Determine the
Value of Each IP Asset” by performing an evaluation “to make a judgment as to the economic result (i) if the company were
unable to use the asset in its business, (ii) if use of the asset were restricted or (iii) if others could use the asset without
restriction.” Reference to “unable to use the asset” with respect to patents corresponds to a “freedom to operate”, and “use
of the asset were restricted” implies the inability to enforce the patent should infringement occur. These two criteria are
examples of qualitative measurement of patent value.
This paper will explore in more detail how corporations can objectively assess patent quality of very large portfolios. How
the results of portfolio evaluation may be reported out to a company’s stakeholders will be a matter of accounting and
corporate communications policies better left to the individual companies.
paper, May 2008.
13 Intellectual Property and Sarbanes-Oxley: Steps for Implementing IP Best Practices, Sarbanes Oxley Compliance Journal, Dec. 23,
2005
Page 10
Statistical Portfolio Quality Analysis using Portfolio-Xpert™
PatentCafe • 2890 Gateway Oaks Dr., Ste. 250, Sacramento, CA, 95833 • t: 916 239 2500 • © 2006-2008; Pat. Pend.
Page 10.
Transparency of Process; Reliability of Ratings Scores
A reliable, statistical patent evaluation process must incorporate the key elements of transparency, repeatability, and
objectivity.
The analytical process used for this study was required to:
- Rely entirely on machine processes (no human input of formula variables), and
- Deliver a results set containing multiple data points for each patent, and for the portfolio of patents. Single score
rating systems lacked the resolution needed to adequately assess qualitative patent value that would support the
diverse IP and business missions encountered in typical corporate operations.
Variable formula based patent scoring systems, such as the previously discussed IPScore®, rely in part on human input of
certain financial assumptions, market data, or other variables as a required component to the formula for computing patent
value. Whether determining economic or qualitative value, scoring systems that require manual input (a) are not suited to
scaling for large portfolio collections, and (b) lack the objectivity to ensure repeatability by a different person (who happens
to input different variables. Human input requirements disqualified scoring systems that required manual substitutions of
formula variables.
A number of commercial patent evaluation systems are available that correlate the qualitative value of a patent to a single
score (e.g.: 95% quality, “A” grade, or “poor / good / better / best”). However, single-score patent rating systems often do
not provide the information granularity needed to support the myriad decisions that are made regarding acquisition,
divestiture, enforcement, or abandonment of a patent, or a portfolio of patents. Performing each of these functions requires
the IP manager or legal professional to look at patent quality from different, sometimes opposing perspectives. Scoring
systems that provided no or limited score granularity were disqualified for use in this study.
PatentCafe Patent Factor Index “PFI™” Reports compute 20 key patent quality indicators that have been shown to
consistently correlate to patent value. Individually, or in combination with other of the 20 indices, the PFI scores have allow
attorneys and IP managers to visualize patent quality in support of their disparate patent asset management objectives.
The PFI Reports rely entirely on machine calculations to compute the statistical scores, and further, provides meaningful
and actionable explanation of each index score as it pertains to the patent management decision process within an
organization.
In an ongoing effort to improve the transparency and reliability of PFI Reports, continued analysis by third party commercial
organizations, financial and academic institutions is underway. Once completed, the results of any ongoing analysis of the
veracity of the PFI Reports and processes will be published in the appropriate peer-reviewed journals and articles.14
14 “Gibbs, Andy; “KSR defines new baseline for statistical patent quality”; IAM Magazine, Issue #29, March/April 2008.
Page 11
Statistical Portfolio Quality Analysis using Portfolio-Xpert™ Page 11.
Application Of PFI Scores To Portfolio Management
Once Patent Factor Index (PFI) scores are computed for each of the indices outlined in Table 2., we are able to begin
visualizing large portfolio collections with the resolution necessary to answer various questions that allow for effective
IP management.
The axiom “if you can’t measure it, you can’t manage it” is seldom the guiding principle for portfolio management,
primarily because few scoring systems have allowed for high-resolution measurement of patent quality in the first
place. By computing scores for a large number of interrelated indices for each patent in a portfolio, it becomes possible
to sort a large portfolio based on one or more indices of interest, and identify key patents in support of any given
management objective.
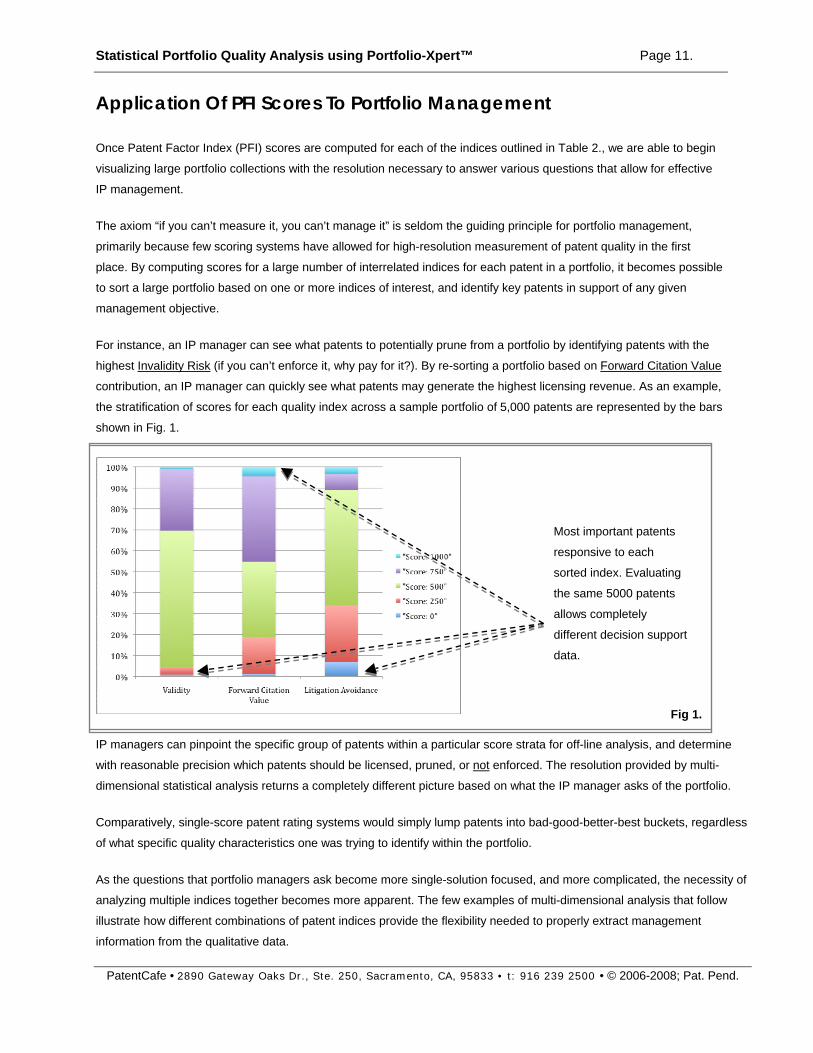
For instance, an IP manager can see what patents to potentially prune from a portfolio by identifying patents with the
highest Invalidity Risk (if you can’t enforce it, why pay for it?). By re-sorting a portfolio based on Forward Citation Value
contribution, an IP manager can quickly see what patents may generate the highest licensing revenue. As an example,
the stratification of scores for each quality index across a sample portfolio of 5,000 patents are represented by the bars
shown in Fig. 1.
PatentCafe • 2890 Gateway Oaks Dr., Ste. 250, Sacramento, CA, 95833 • t: 916 239 2500 • © 2006-2008; Pat. Pend.
Fig 1.
Most important patents
responsive to each
sorted index. Evaluating
the same 5000 patents
allows completely
different decision support
data.
IP managers can pinpoint the specific group of patents within a particular score strata for off-line analysis, and determine
with reasonable precision which patents should be licensed, pruned, or not enforced. The resolution provided by multi-
dimensional statistical analysis returns a completely different picture based on what the IP manager asks of the portfolio.
Comparatively, single-score patent rating systems would simply lump patents into bad-good-better-best buckets, regardless
of what specific quality characteristics one was trying to identify within the portfolio.
As the questions that portfolio managers ask become more single-solution focused, and more complicated, the necessity of
analyzing multiple indices together becomes more apparent. The few examples of multi-dimensional analysis that follow
illustrate how different combinations of patent indices provide the flexibility needed to properly extract management
information from the qualitative data.
Page 12
Statistical Portfolio Quality Analysis using Portfolio-Xpert™
PatentCafe • 2890 Gateway Oaks Dr., Ste. 250, Sacramento, CA, 95833 • t: 916 239 2500 • © 2006-2008; Pat. Pend.
Page 12.
Revenue: Potential for revenue generation
Owners of large portfolios generate revenue from patent licensing. The methodology of applying a multiple index
scoring system to a portfolio can help IP managers identify other high value patents for licensing.
• Start the licensing analysis by identifying all patents currently earning the highest licensing revenue. With this
collection gathered, the IP manager can review all twenty indices to identify consistently occurring high or low
scoring indices common to the majority of patents in this collection. Those indices can thereafter serve as a
data mining model used to identify other patents that share similar characteristics.
• Develop a multiple index model based on technical subject matter expertise and knowledge of market,
competitors, and business strategy, i.e.: Prior Art Validity, Concurrent Art Validity, Sustainability in Opposition,
Litigation Avoidance, Forward Citation Value, Enforcement Potential, and Competitive Position
Cost Reduction: Portfolio triage and pruning of poor patents
A portfolio manager tasked with identifying low quality patents, for which continued payment of maintenance fees
would be a waste of company resources, can select certain indices that correlate to “poor quality” patents not worthy of
continued financial investment. These indices might reasonably include:
• Validity Confidence: if the manager has no confidence in the validity of the patents, they will likely never be
asserted against an alleged infringer. Therefore, by sorting the entire portfolio in ascending order for indices 5
and 6 (Validity Confidence), the manager can instantly identify the patents with the poorest validity scores,
strip them off for independent assessment, and ultimately dispose of them by sale or abandonment.
• Patent Group Competitive Position: if the company has a number of “orphan” patents which do not collectively
correspond to the company’s core business, it can quickly identify those patents by sorting the portfolio based
on ascending order for index 17 (Patent Group Competitive Position).
• Combination Sort: by sorting first on Validity Confidence, then immediately resorting the patents with the
lowest validity confidence by ascending Patent Group Competitive Position, the IP manager can now quickly
identify the most likely 10, 50 or 100 patents out of a portfolio of 10,000 or more, and take affirmative action
on divesting or abandoning patents to cut recurring patent legal costs.
Competition: Competitive Patent Position
• Analyze In-License Opportunity scores to identify patents around which closely related, unassigned patents
can be more efficiently acquired.
• Sort based on Relevancy Strength, Partnering Potential, Divestiture Licensing Premium, and Crowdedness to
find patents that hold a more competitive position in the industry.
Market Protection: Identifying infringed patents, assessing litigation risks
• Pioneer patents are those filed early in the emergence of new technologies or markets. Sort patents based on
descending evaluation scores Relevancy Strength, Prior Art Validity, Concurrent Art Validity, Divestiture
Page 13
Statistical Portfolio Quality Analysis using Portfolio-Xpert™
PatentCafe • 2890 Gateway Oaks Dr., Ste. 250, Sacramento, CA, 95833 • t: 916 239 2500 • © 2006-2008; Pat. Pend.
Page 13.
Licensing Premium, and Technology Advancement.
R&D and Patent Strategy: Current patent and market density
• To increase focus on protecting the technology in which a company already has a competitive advantage, and
where the company may elect to expand R&D investment in new technology areas, sort patents to find those
scoring highest in Technology Advancement, Technical Sophistication, Combinatorial Accession, Technology
Cogency, Divestiture Licensing Premium and Competitive Position.
SOX Reporting: Correlating portfolio quality with market capitalization
• Analyze averages of all patent indices across the entire portfolio. Create a competitor’s portfolio, and score all
patent indices. Compare key strengths and weaknesses of both portfolios, and identify any correlations
between market cap and the most frequently occurring quality scores.
As these scenarios show, effective information mining of large portfolios is easily accomplished after multiple data points
are computed for each patent. The number and types of analysis scenarios are limited only by the type of decision-support
information the IP manager seeks.
Analysis of PFI Report scores is accomplished within Portfolio-Xpert™, accessible via standard web browser.
In addition to the twenty PFI report indices outlines in Table 2, Portfolio-Xpert includes additional computed data fields not
available in traditional patent bibliographic data.15
Following are test cases on portfolios of publicly held US corporations. They illustrate the practical application of PFI Scores
to the overall management of large patent portfolios. The screen shots will show the standard user interface, typical search
process, analysis, and CSV (Microsoft Excel®) data export.
15 Portfolio-Xpert™ Web-based Enterprise Portfolio Management Solution: http://www.patentcafe.com/products/patent_portfolio.asp
Page 14
Statistical Portfolio Quality Analysis using Portfolio-Xpert™ Page 14.
Portfolio-Xpert™ Evaluation Module
First, the PFI Scores were computed by PatentCafe for each patent that was included in the sample portfolio. As I
described in the Patent Factor Indices white paper, the 20 indices for each of the 100 patents within its own technology
sphere are computed and compared against the 20 indices the portfolio patent.
Because more than 2,000 data points are computed for each portfolio patent, initial setup for a 5,000 patent portfolio may
consume 4 days of 24X7 processing. Thereafter, the development of the evaluation scenarios that follow begins by ticking
the check boxes for each of the Patent Factor Indices desired (Fig. 2.).
Fig. 2.
PatentCafe • 2890 Gateway Oaks Dr., Ste. 250, Sacramento, CA, 95833 • t: 916 239 2500 • © 2006-2008; Pat. Pend.
Page 15
Statistical Portfolio Quality Analysis using Portfolio-Xpert™ Page 15.
Scenario 1: IP Objective - efficiently deepen portfolio quality through patent
acquisition
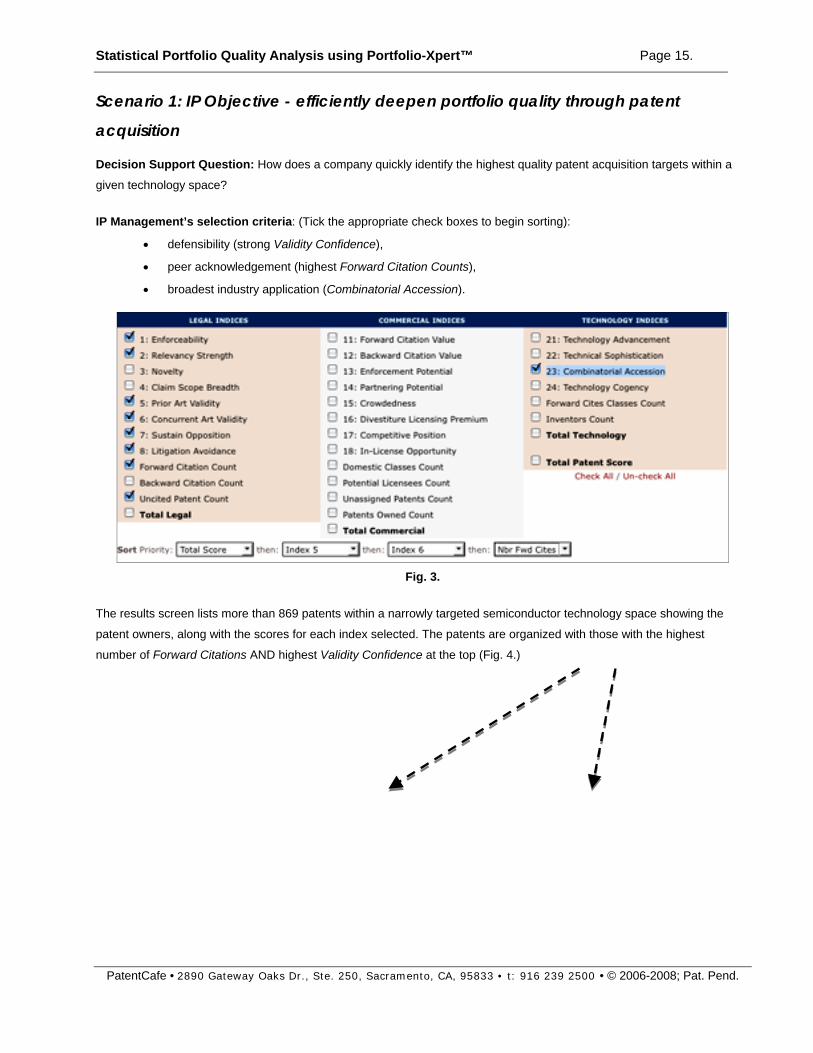
Decision Support Question: How does a company quickly identify the highest quality patent acquisition targets within a
given technology space?
IP Management’s selection criteria: (Tick the appropriate check boxes to begin sorting):
• defensibility (strong Validity Confidence),
• peer acknowledgement (highest Forward Citation Counts),
• broadest industry application (Combinatorial Accession).
Fig. 3.
The results screen lists more than 869 patents within a narrowly targeted semiconductor technology space showing the
patent owners, along with the scores for each index selected. The patents are organized with those with the highest
number of Forward Citations AND highest Validity Confidence at the top (Fig. 4.)
PatentCafe • 2890 Gateway Oaks Dr., Ste. 250, Sacramento, CA, 95833 • t: 916 239 2500 • © 2006-2008; Pat. Pend.
Page 16
Statistical Portfolio Quality Analysis using Portfolio-Xpert™ Page 16.
Fig. 4.
All of the checked scores for each of 869 portfolio patents are then quickly exported as a CSV file, and opened in Excel® to
complete a deeper multi-column sort analysis (Table 4.).
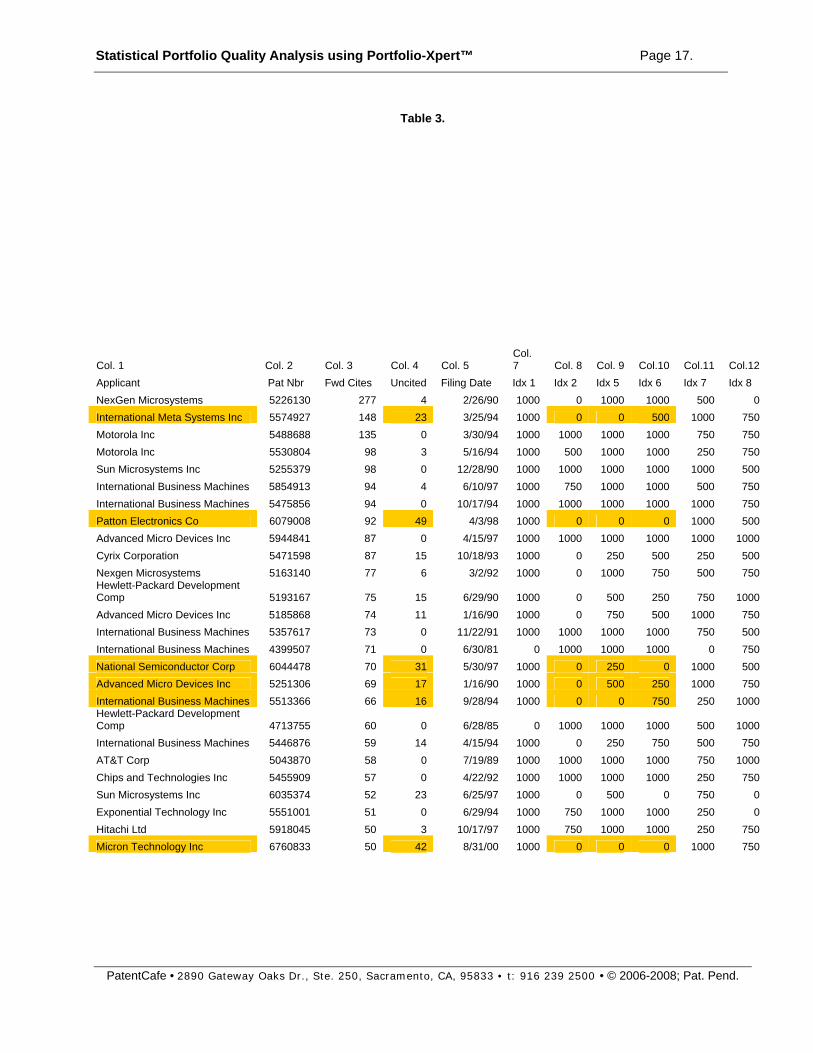
Once exported, we sorted the spreadsheet to bring patents with the highest Forward Citation (Col. 3) count to the top. This
would normally be a reliable barometer showing the highest “value” patents, as shown in Table 3. However, by evaluating
multiple indices at once, we see the highly cited patents that also have a high number of uncited prior art patents (Col. 4)
and poor Validity Confidence (Col. 9 and Col 10.) The cells highlighted in yellow show patents that have a high statistical
probability of not withstanding a validity challenge, in part because of the high number of earlier filed, semantically relevant
patents found.
Therefore, the highlighted patents, when correlated with additional qualitative data points, appear as POOR acquisition
candidates, regardless of the implicit value suggested by the high number of Forward Citations alone.
PatentCafe • 2890 Gateway Oaks Dr., Ste. 250, Sacramento, CA, 95833 • t: 916 239 2500 • © 2006-2008; Pat. Pend.
Page 17
Statistical Portfolio Quality Analysis using Portfolio-Xpert™ Page 17.
Table 3.
Col. 1 Col. 2 Col. 3 Col. 4 Col. 5 Col. 7 Col. 8 Col. 9 Col.10 Col.11 Col.12
Applicant Pat Nbr Fwd Cites Uncited Filing Date Idx 1 Idx 2 Idx 5 Idx 6 Idx 7 Idx 8 NexGen Microsystems 5226130 277 4 2/26/90 1000 0 1000 1000 500 0 International Meta Systems Inc 5574927 148 23 3/25/94 1000 0 0 500 1000 750 Motorola Inc 5488688 135 0 3/30/94 1000 1000 1000 1000 750 750 Motorola Inc 5530804 98 3 5/16/94 1000 500 1000 1000 250 750 Sun Microsystems Inc 5255379 98 0 12/28/90 1000 1000 1000 1000 1000 500 International Business Machines 5854913 94 4 6/10/97 1000 750 1000 1000 500 750 International Business Machines 5475856 94 0 10/17/94 1000 1000 1000 1000 1000 750 Patton Electronics Co 6079008 92 49 4/3/98 1000 0 0 0 1000 500 Advanced Micro Devices Inc 5944841 87 0 4/15/97 1000 1000 1000 1000 1000 1000 Cyrix Corporation 5471598 87 15 10/18/93 1000 0 250 500 250 500 Nexgen Microsystems 5163140 77 6 3/2/92 1000 0 1000 750 500 750 Hewlett-Packard Development Comp 5193167 75 15 6/29/90 1000 0 500 250 750 1000 Advanced Micro Devices Inc 5185868 74 11 1/16/90 1000 0 750 500 1000 750 International Business Machines 5357617 73 0 11/22/91 1000 1000 1000 1000 750 500 International Business Machines 4399507 71 0 6/30/81 0 1000 1000 1000 0 750 National Semiconductor Corp 6044478 70 31 5/30/97 1000 0 250 0 1000 500 Advanced Micro Devices Inc 5251306 69 17 1/16/90 1000 0 500 250 1000 750 International Business Machines 5513366 66 16 9/28/94 1000 0 0 750 250 1000 Hewlett-Packard Development Comp 4713755 60 0 6/28/85 0 1000 1000 1000 500 1000 International Business Machines 5446876 59 14 4/15/94 1000 0 250 750 500 750 AT&T Corp 5043870 58 0 7/19/89 1000 1000 1000 1000 750 1000 Chips and Technologies Inc 5455909 57 0 4/22/92 1000 1000 1000 1000 250 750 Sun Microsystems Inc 6035374 52 23 6/25/97 1000 0 500 0 750 0 Exponential Technology Inc 5551001 51 0 6/29/94 1000 750 1000 1000 250 0 Hitachi Ltd 5918045 50 3 10/17/97 1000 750 1000 1000 250 750 Micron Technology Inc 6760833 50 42 8/31/00 1000 0 0 0 1000 750
PatentCafe • 2890 Gateway Oaks Dr., Ste. 250, Sacramento, CA, 95833 • t: 916 239 2500 • © 2006-2008; Pat. Pend.
Page 18
Statistical Portfolio Quality Analysis using Portfolio-Xpert™ Page 18.
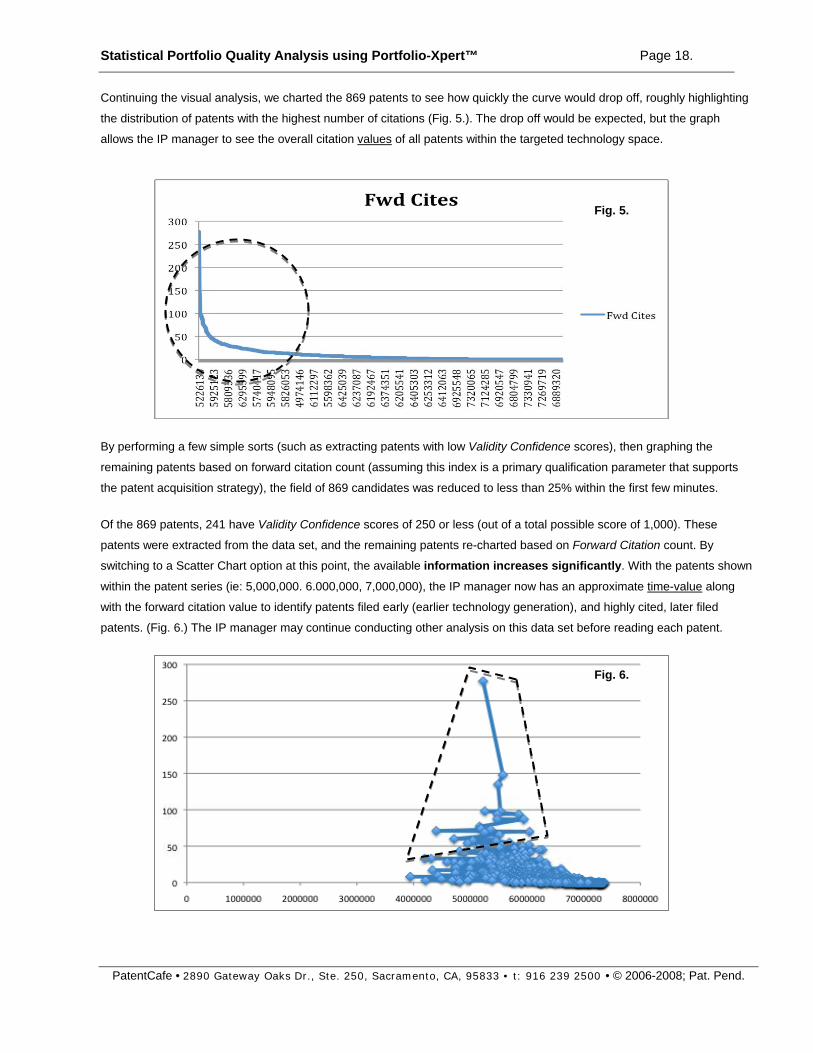
Continuing the visual analysis, we charted the 869 patents to see how quickly the curve would drop off, roughly highlighting
the distribution of patents with the highest number of citations (Fig. 5.). The drop off would be expected, but the graph
allows the IP manager to see the overall citation values of all patents within the targeted technology space.
Fig. 5.
By performing a few simple sorts (such as extracting patents with low Validity Confidence scores), then graphing the
remaining patents based on forward citation count (assuming this index is a primary qualification parameter that supports
the patent acquisition strategy), the field of 869 candidates was reduced to less than 25% within the first few minutes.
Of the 869 patents, 241 have Validity Confidence scores of 250 or less (out of a total possible score of 1,000). These
patents were extracted from the data set, and the remaining patents re-charted based on Forward Citation count. By
switching to a Scatter Chart option at this point, the available information increases significantly. With the patents shown
within the patent series (ie: 5,000,000. 6.000,000, 7,000,000), the IP manager now has an approximate time-value along
with the forward citation value to identify patents filed early (earlier technology generation), and highly cited, later filed
patents. (Fig. 6.) The IP manager may continue conducting other analysis on this data set before reading each patent.
Fig. 6.
PatentCafe • 2890 Gateway Oaks Dr., Ste. 250, Sacramento, CA, 95833 • t: 916 239 2500 • © 2006-2008; Pat. Pend.
Page 19
Statistical Portfolio Quality Analysis using Portfolio-Xpert™
PatentCafe • 2890 Gateway Oaks Dr., Ste. 250, Sacramento, CA, 95833 • t: 916 239 2500 • © 2006-2008; Pat. Pend.
Page 19.
As a final process in this acquisition analysis, the remaining patents were sorted one last time showing (a) oldest filing date,
and (b) highest validity confidence. With this information, the IP manager can elect to look at patents only 15 years old or
less, and develop the short list of acquisition candidates. (Table 4.)
Patent Nbr Fwd Cites Uncited Filing Date Idx 5 Idx 6 3940744 8 0 12/17/73 1000 1000 4212058 3 0 9/20/77 1000 1000 4197579 33 0 6/6/78 1000 1000 4307445 33 1 11/17/78 1000 1000 4332008 17 1 11/9/79 1000 1000 4430708 10 1 5/22/81 1000 1000 4399507 71 0 6/30/81 1000 1000 4491911 5 0 2/24/82 1000 1000 4750110 20 0 4/18/83 1000 1000 4589065 28 1 6/30/83 1000 1000 4679194 3 0 10/4/84 1000 1000 4713755 60 0 6/28/85 1000 1000 4953073 54 1 2/6/86 1000 1000 4736290 13 0 6/13/86 1000 1000 4715013 28 5 7/25/86 1000 750 4731736 21 6 9/18/86 1000 750 4758978 5 4 9/18/86 1000 750 4791559 4 0 11/10/86 1000 1000 4891753 41 0 11/26/86 1000 1000 4811215 43 4 12/12/86 1000 750 4853849 27 14 12/17/86 0 1000 4729094 29 3 3/24/87 1000 750 4758950 14 2 4/13/87 1000 1000 4811274 1 2 9/14/87 1000 1000 4745574 5 1 9/17/87 1000 1000 4744049 4 6 9/17/87 1000 750 4994961 6 11 9/18/87 500 750 4956805 3 0 9/22/87 1000 1000 5274829 6 0 10/28/87 1000 1000 4823260 26 0 11/12/87 1000 1000 4821231 4 5 12/21/87 750 1000 4974146 11 0 5/6/88 1000 1000 5018061 28 0 6/27/88 1000 1000 5031096 10 4 6/30/88 1000 1000 5051885 28 0 10/8/88 1000 1000 5406644 20 0 11/23/88 1000 1000 4991088 19 0 11/30/88 1000 1000 5148533 48 0 1/5/89 1000 1000
Table 4.
* The list in Table 5. was truncated in order to show the top results on this page.
Page 20
Statistical Portfolio Quality Analysis using Portfolio-Xpert™ Page 20.
Other online analysis allows quick visualization of who owns these patents,
Fig. 7.
how these patents group according to the core technology claimed,
Fig. 8.
and what the filing trend has been for this technology segment.
Fig. 9.
The total time to data mine and analyze 869 patents for Scenario 1: about 30 minutes.
PatentCafe • 2890 Gateway Oaks Dr., Ste. 250, Sacramento, CA, 95833 • t: 916 239 2500 • © 2006-2008; Pat. Pend.
Page 21
Statistical Portfolio Quality Analysis using Portfolio-Xpert™ Page 21.
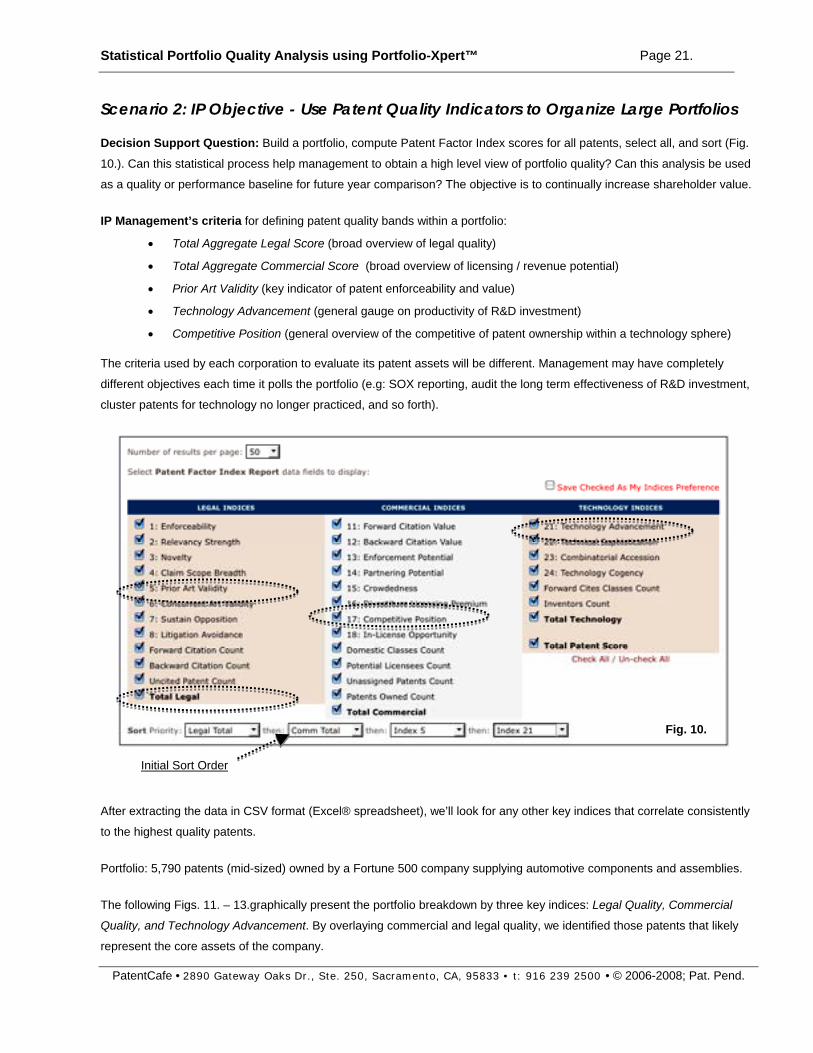
cluster patents for technology no longer practiced, and so forth).
After extracting the data in CSV format (Excel® spreadsheet), we’ll look for any other key indices that correlate consistently
the highest quality patents.
zed) owned by a Fortune 500 company supplying automotive components and assemblies.
Quality, and Technology Advancement. By overlaying commercial and legal quality, we identified those patents that likely
Scenario 2: IP Objective - Use Patent Quality Indicators to Organize Large Portfolios
Decision Support Question: Build a portfolio, compute Patent Factor Index scores for all patents, select all, and sort (Fig.
10.). Can this statistical process help management to obtain a high level view of portfolio quality? Can this analysis be used
as a quality or performance baseline for future year comparison? The objective is to continually increase shareholder value.
IP Management’s criteria for defining patent quality bands within a portfolio:
• Total Aggregate Legal Score (broad overview of legal quality)
• Total Aggregate Commercial Score (broad overview of licensing / revenue potential)
• Prior Art Validity (key indicator of patent enforceability and value)
• Technology Advancement (general gauge on productivity of R&D investment)
• Competitive Position (general overview of the competitive of patent ownership within a technology sphere)
The criteria used by each corporation to evaluate its patent assets will be different. Management may have completely
different objectives each time it polls the portfolio (e.g: SOX reporting, audit the long term effectiveness of R&D investment,
Fig. 10.
Initial Sort Order
to
Portfolio: 5,790 patents (mid-si
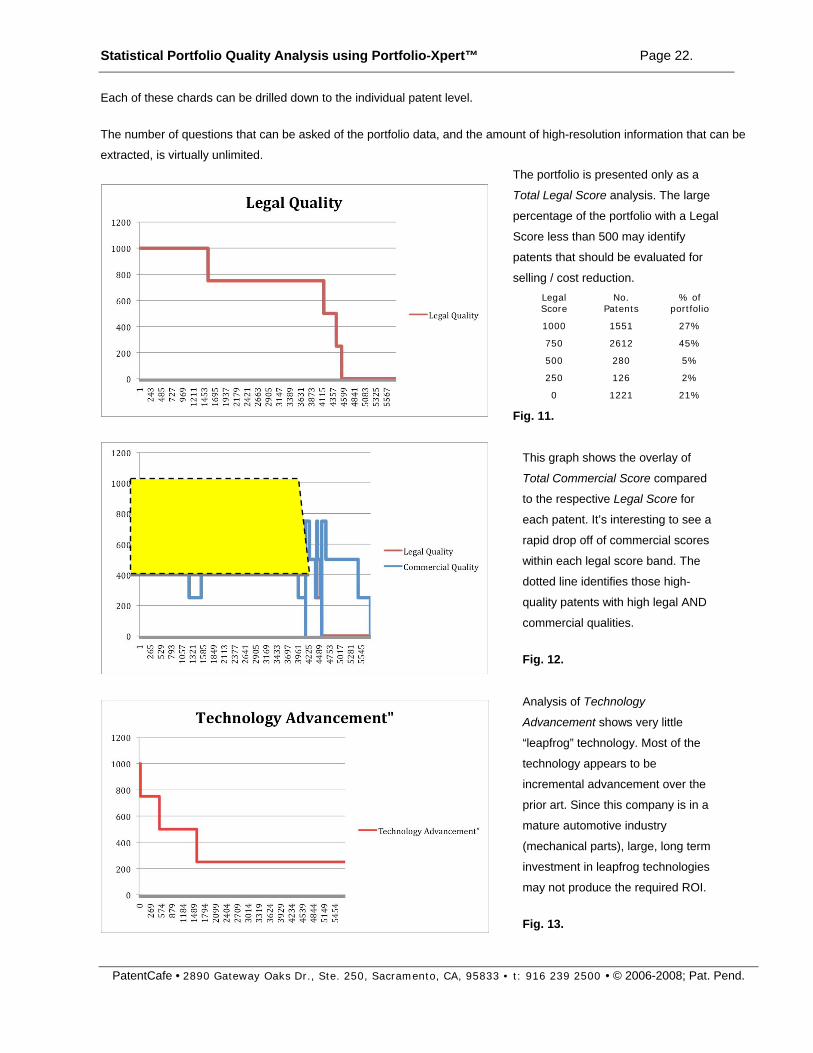
The following Figs. 11. – 13.graphically present the portfolio breakdown by three key indices: Legal Quality, Commercial
represent the core assets of the company.
PatentCafe • 2890 Gateway Oaks Dr : 916 239 2500 • © 2006-2008; Pat. Pend. ., Ste. 250, Sacramento, CA, 95833 • t
Page 22
Statistical Portfolio Quality Analysis using Portfolio-Xpert™ Page 22.
The number of questions that can be asked of the portfolio data, and the amount of high-resolution information that can be
Each of these chards can be drilled down to the individual patent level.
extracted, is virtually unlimited.
PatentCafe • 2890 Gateway Oaks Dr., Ste. 250, Sacramento, CA, 95833 • t: 916 239 2500 • © 2006-2008; Pat. Pend.
This graph show overlay
ommercial Score compared
to the respective Legal Score for
a
s the of
Total C
each patent. It’s interesting to see
rapid drop off of commercial scores
within each legal score band. The
dotted line identifies those high-
quality patents with high legal AND
commercial qualities.
Fig. 12.
Analysis of Technology
Advancement shows very little
“leapfrog” technology. Most of the
the
d ROI.
The portfolio is presented only as a
percentage of the portfolio with a Legal
of
27%
45%
Fig. 1
Total Legal Score analysis. The large
Score less than 500 may identify
patents that should be evaluated for
selling / cost reduction. Legal Score
No. Patents
% portfolio
1000 1551
750 2612
500 280 5%
250 126 2%
0 1221 21%
1.
technology appears to be
incremental advancement over
prior art. Since this company is in a
mature automotive industry
(mechanical parts), large, long term
investment in leapfrog technologies
may not produce the require
Fig. 13.
Page 23
Statistical Portfolio Quality Analysis using Portfolio-Xpert™ Page 23.
Scenario 3: IP Objective – Increase licensing revenue with high potential patents
Decision Support Question: The company wants to increase licensing revenue from its portfolio. “Hand methods” of
sorting through 5,000 patents have been expensive, time consuming, and largely ineffective in rapidly identifying high
opportunity patents. Can a statistical process be applied to the initial analysis, performing the “heavy lifting” of total portfolio
review, setting the stage for the later hand-work of matching patents with licensee prospects?
IP Management’s criteria for defining what s/he believes will identify the highest revenue licensing opportunities: :
• Enforceability Idx-1 (if it can’t be enforced, it can’t be licensed)
• Validity Confidence Idx-5 (statistically score probability of un-cited prior art)
• Validity Confidence Idx-6 (statistically score probability of un-cited concurrent art)
• Sustainability in Opposition Idx-7 (additional score of the legal strength prior to enforcement / assertion)
Although the patent numbers on this actual analysis are intentionally obscured, it’s easy to quickly identify the patents with a
statistical likelihood of producing the highest licensing revenue, based on the criteria analyzed. It’s interesting to note that
the patents span a very broad range of US and International Patent Classifications. A subsequent sort on classifications
would allow the licensor to approach the licensees with groups of related patents, increasing the potential value of each
opportunity.
• Partnering Licensing Potential Idx-14 (score patent for non-obvious carrot-licensing opportunities)
The extracted results are shown and shaded yellow in the sorted Excel sheet (Fig. 14.). Column T, X, Y and AA and AE
show the PFI Scores sorted in the order listed above.
Fig. 14.
PatentCafe • 2890 Gateway Oaks Dr., Ste. 250, Sacramento, CA, 95833 • t: 916 239 2500 • © 2006-2008; Pat. Pend.
Page 24
Statistical Portfolio Quality Analysis using Portfolio-Xpert™ Page 24.
Decision Support Question: Management wants to reduce patent maintenance costs by culling unwanted patents from a
portfolio. Combined, the 7.5 and 11.5 year US patent maintenance fees are $6,000 / patent. Pruning 500 patents from a
large portfolio would save for $3,000,000 that can be re-purposed. Can a pruning process be quickly conducted – and
repeated annually on patents coming up for a periodic fee payment without unreasonable outside consulting costs?
IP Management’s criteria for identifying lowest quality / lowest potential value patents to prune from the portfolio:
• Validity Confidence Idx-5 (statistically score probability of un-cited prior art)
• Validity Confidence Idx-6 (statistically score probability of un-cited concurrent art)
• Litigation Avoidance Idx-8 (identify patents most likely to be contested)
• Forward Citation Value Contribution Idx-11 (ascending, find patents that have not earned forward citations)
• Patent Group Competitive Position Idx-17 (sort ascending to identify “orphan” patents)
Using Portfolio-Xpert’s Patent Factor Index scoring system to compute large portfolio data sets, we quickly identified those
patents that contain no forward citations
(Col. AB), as well as those scoring ZERO in
Validity Confidence (Col. X).
Additional indices were also reviewed in this
analysis to investigate whether additional
correlations exist between the intended and
patents with the lowest qualitative scores are
instantly sorted to the top of the list of almost
experts are now required to evaluate these
patents on an individual basis.
or
f effort.
By applying a computer analysis of
ager
would typically use in deciding what patent
r abandon, a multi-month patent
ess can be reduced to
Scenario 4: IP Objective – Reduce costs by pruning low quality patents from a large
portfolio
PatentCafe • 2890 Gateway Oaks Dr., Ste. 250, Sacramento, CA, 95833 • t: 916 239 2500 • © 2006-2008; Pat. Pend.
the non-obvious indices, identifying any
additional value indicators (Fig. 15.).
Together with sorting on other indices, the
6,000 patents. Legal or subject matter
The typical process of pruning undesirable
patents from a portfolio of 5,000, 10,000
more patents can consume months o
parameters similar to what an IP man
to divest o
identification proc
Fig. 15.
Page 25
Statistical Portfolio Quality Analysis using Portfolio-Xpert™ Page 25.
Scenario 5: IP Objective – Comparing Portfolio Quality and Market Capitalization
analysis of multiple portfolios of companies serving the same markets with the
interesting information. Will the analysis of the “best / worst technology perform
estate quality model?
IP Management’s criteria: Objectively evaluate the overall quality of the comp
competitor.
• Average Total Patent Score
• Average Total Legal Score
• Average Total Commercial Score
• Average Total Technology Score
To develop the scores for 20 quality indices for the nearly 6,000 patents in each portfolio,
were computed (22 million data points total for 2 portfolios). Computing the portfolio scores for
150 hours for each portfolio. The quantity of data is significant, and as can be seen from the sma ig.
16, provides unlimited analyses on any one or more indices as management el
roportionately higher number of patents in the 600 and 700 quality bands. Company “B” with the
lower market cap shows more than 50% of its patents as very low quality
hours or days.
Decision Support Question: Whether for competitive intelligence or to support a SOX report on a patent estate, qualitative
same technology and products will provide
ers” in a given market shape the patent
any’s patent portfolio, and that of its key
more than 11,500,000 data points
these large estates required
ll spreadsheet clip in F
ects.
Fig. 16.
By taking the total scores averages, and breaking them into 100 point quality bands, the number of patents that each
company owns within each band were determined. The bar chart (Fig. 17), shows how the nearly 6,000 patents of both
companies differ.
Although the data is high level, it does clearly illustrate that the company with a market cap nearly three times the
competitor’s has a disp
.
will not show whether the significant difference in market caps are the cause, or effect of the differences in
portfolio quality, causality was not within the scope of this analysis. However, this approach to competitive portfolio
s has been consistent in showing a positive correlation between higher quality
of companies in many industry segments that compete in a similar market space.
This analysis
comparison and market cap reference
portfolios, and the higher market cap
PatentCafe • 2890 Gateway Oaks Dr., Ste. 250, Sacramento, CA, 95833 • t: 916 239 2500 • © 2006-2008; Pat. Pend.
Page 26
Statistical Portfolio Quality Analysis using Portfolio-Xpert™ Page 26.
y can immediately develop strategic plans to cull poor quality patents, and begin
ortfolio value through acquisition – and in the longer term, through strategic asset
drill back into the individual
Upon identifying clearly differentiating scores on any of
the indices, the IP manager can implement a portfolio
management process to improve quality, increase
revenue, cut costs, and increase its competitive
position.
The first 4 scenarios in this section are not unlike some
cess.
ortfolio management may begin to play into the overall mission, such as the initiation of a aggressive
licensing campaign (if one does no already exist), or the immediate pruning of poor quality patents (to generate revenue
ed data points for each patent
At this point, management of either compan
a portfolio-building campaign to increase p
development.
From this high level, the flexibility of patent portfolio
management via qualitative patent scores will allow the
IP managers to quickly
patent scores.
Fig. 16.
of the objectives-driven portfolio management initiatives that could emerge out of the higher level portfolio analysis pro
Other elements of p
from the sale of patents, save money, and raise total portfolio quality average).
Because this bird’s-eye view of the portfolio is built using bottom-up comput , drilling back
down into the patents on which action should be taken is highly efficient, and precise. The bottom-up analysis allows IP
managers to manage-by-the-numbers.
PatentCafe • 2890 Gateway Oaks Dr., Ste. 250, Sacramento, CA, 95833 • t: 916 239 2500 • © 2006-2008; Pat. Pend.
Page 27
Statistical Portfolio Quality Analysis using Portfolio-Xpert™
PatentCafe • 2890 Gateway Oaks Dr., Ste. 250, Sacramento, CA, 95833 • t: 916 239 2500 • © 2006-2008; Pat. Pend.
Page 27.
usion
Intangible assets comprise more than 85% of the gly important to
high technology organizations that re ovation superiority to capture and maintain market share.
e
he very least, grossly inefficient.
sets, and using objective data, can begin to apply traditional “manage-by-the-
numbers” techniques to the intellectual property management process.
Related white papers:
Gibbs, A; Explanation of PatentCafe® Patent Factor Index™ Reports (PFI); The Practical Application of Statistical
Quality Scoring to Effective Patent Management, 2008
Gibbs, A; Comparison of Statistical Quality Indicators of Patents in CAFC Decisions Before and After KSR V.
Teleflex, 2008
Data and Software Tools References
Software: PatentCafe® Portfolio-Xpert™ portfolio analysis solution
Data and Information Source: PatentCafe® international patent data collections, other references as cited.
Latent Semantic Analysis Patent Search
http://www.patentcafe.com/products/patent_search.asp
Concl
market cap of the S&P 500 companies, and are exceedin
ly on inn
Patents, a core component of these intangible assets, must be managed just as diligently as tangible assets. Without som
tangible information however, effective management is nearly impossible, or at t
Patent Factor Index Reports provide IP managers with a highly reliable set of data points by which to assess key quality
indicators for every patent, Within the framework of the Portfolio-Xpert IP management software, IP managers can now
effectively identify high and low quality as
Patent Factor Index Report:
http://www.patentcafe.com/products/patent_analysis.asp
Portfolio-Xpert™ Web-based Enterprise Portfolio Management Solution:
http://www.patentcafe.com/products/patent_portfolio.asp
Enterprise Solutions Training
PatentCafe offers 2-day Portfolio-Xpert™ professional development and certification training at its International
Intellectual Property Solutions Training Institute in Sacramento, CA.
Page 28
Statistical Portfolio Quality Analysis using Portfolio-Xpert™
PatentCafe • 2890 Gateway Oaks Dr., Ste. 250, Sacramento, CA, 95833 • t: 916 239 2500 • © 2006-2008; Pat. Pend.
Page 28.
tCafe:�www.patentcafe.comAbout Paten
atent analytics.
of com/buy/contact.asp
PatentCafe is a global provider of advanced intellectual property software, offering a comprehensive suite of intellectual property solutions for international patent data search, strategic portfolio management, and qualitative p
The company’s enterprise-level solutions incorporate the intellectual property industry’s most advanced linguistics search technology that helps customers realize improved patent quality, superior patent-based business intelligence, licensing revenue optimization, and corporate governance compliance.
PatentCafe’s customers include Fortune 100 companies, government research labs, leading patent law firms, and intellectual property consultancies,
For more information on PatentCafe’s patent research and portfolio management solutions, or to request a presentationits enterprise solutions, contact the company at http://www.patentcafe. or call +1 916 239 2500