Page 1
1
Patent Litigation As a Leading Market Indicator
Victor Tang
CIPD MIT Sloan School of Management
30 Memorial Drive E60-236
Cambridge, Massachusetts 02139
USA
E-mail: [email protected]
Biao Huang
CIPD MIT School of Engineering
30 Memorial Drive E60-236
Cambridge, Massachusetts 02139
USA
E-mail: [email protected]
This research was funded by the Center for Innovation in Product Development (CIPD) at the Massachusetts Institute of Technology. Abstract
The purpose of this paper is to introduce patent litigation as a leading indicator of market
growth. We model the intensity of patent litigation and the market growth for the
personal computer and cellular phone market in the US. By means of these analytic
models, we show that patent litigation is a leading indicator to market growth. We are
also able to very precisely delineate discrete stages of the product’s market life cycle and
demarcate the time when life-cycle transitions are about to take place. We close this
paper with a discussion on new lines of patent research that are potentially useful for
managerial practice and for investment decisions.
Page 2
2
Keywords: patents, patent citations, patent litigation, patent infringement, technology
diffusion, innovation, market growth, market forecasting, leading indicators, knowledge
spillover, early adopters
Biographical Notes
Victor Tang is at the Center for Innovation for Product Development at MIT in the Sloan
School of Management. He is concentrating on product development methodologies and
pricing strategies for technology intensive services. Prior to MIT, Victor held various
executive positions in IBM in product, systems and services development, corporate
strategy, and business development. He has consulted for the United Nations and foreign
governments in Europe, Latin America and the Far East. He has advanced degrees in
mathematical physics and business policy from Purdue University and Columbia
University Business School, respectively. Victor is coauthor of three books in technology
management.
Biao Huang is a graduate student in the Technology Management Program at MIT. His
main interests are in technology management, knowledge management and diffusion of
high technology into industry and the marketplace.
Page 3
3
Introduction
Patents have been used to analyze the diffusion of knowledge as a productive asset that
creates economic growth [1-5]. Patent renewal information has been a line of research to
determine its relationship to economic growth [6-9]. However, the visibility is thin
regarding the nature of the mechanisms of knowledge flow. To address this void, a major
line of research has been to investigate patent citations as a mechanism of knowledge
spillover [10,11]. The literature demonstrates that there are linkages between patent
activity and macroeconomic growth through citations across institutional and geographic
boundaries [12-14].
The objective of this paper is to address such a direct link and discuss potential
new research directions. We show that the intensity of patent litigation is an indicator to
determine the timing and rate of market growth. Although patent litigation has a line of
investigation [15,16], we are not aware of analysis that uses patent litigation as leading
indicator to market growth. We use the personal computer (PC) and the cellular phone
markets to test our hypothesis. Using measures of patent litigation intensity (PLI) and
market growth, we are able to express their relationship in mathematical form and thus
establish the linkage between patent litigation intensity and market growth. We will
discuss the limitations of our analysis, as well as, new potential research to develop a
unifying framework to connect patent activities to market growth. We close this paper
with a discussion of the implications to managerial practice and to financial investments
in new and emerging high technology markets.
The fundamental research challenge has been to identify parametric variables that
link patent activity to market growth. Although research shows that patent citations is a
Page 4
4
useful proxy to indicate that knowledge is being diffused, we seek a more direct indicator
to link a specific class of patent activities to economic growth. In addition, patents are not
always renewed [6-9]. Our line of thinking is motivated by our experience in high
technology industry which tells us that patent citations are activities largely related to
research and development, analysis of competitor capabilities, and acquisition of
competitive knowledge. As such, they are more indicative of future expectations of
growth, rather than of conviction that growth is imminent, present, or in active progress.
Furthermore, citation research is grounded on the presumption that once knowledge is
acquired, spillover has begun, and therefore market growth will follow. Recent research
shows that citation data is not always accurate [17]. Jaffe, et al., 2000, cite:
“There is however a large amount of noise in citations data; it appears
that something like one half of all citations do not correspond to any
perceived communication, or even necessarily to a perceptible
technological relationship between the inventions.”
Our hypothesis is that the intensity of patent litigation is a promising indicator of market
growth. We believe that patent litigation engages the attention and commitment of the
firm precisely because its economic interests are at stake and because litigation is costly.
The average cost for each patent lawsuit is more than $1 million [18]. As such, unlike
other patent activity, patent litigation is no longer merely planning, research, or analysis.
It is a shot across the bow to warn an adversary. It is a strong signal that the firm’s
significant economic interests are at stake and that the firm is committed to spend
management time and litigation expenses to defend its markets. Patent litigation engages
the attention of senior executives of the firm because they have judged that market
Page 5
5
growth is emerging, imminent, or visible to the firm. Consider other sides of the litigation
issue. Intentional patent infringement clearly indicates that the infringing firm has a
strong belief that there is a nontrivial market share it wants to capture, albeit by illicit
means. On the other hand, innocent infringement of existing patents can be interpreted as
technology reaching a level of maturity. Ideas are now more common and widely
diffused because market growth is either imminent or in progress.
PLI and Market Data for the PC Market
Using public data about the PC industry, we collected information of the market size in
the US, measured in $, from 1970 to the present, 2000. Table 1 shows these data. Next,
we collected patent litigation activity of key PC firms from for the same time interval
[19]. We examined the patent litigation activities from these key firms in the PC industry
and discarded those we considered not germane to our analysis. Our analysis included
firms like Intel, AMD, Texas Instruments, Cypress Semiconductor, Tandy, Cyrix, and
NEC. We found a total of 46 relevant suits covering the period under consideration. This
is shown in Table 2.
PLI and PC Industry Models
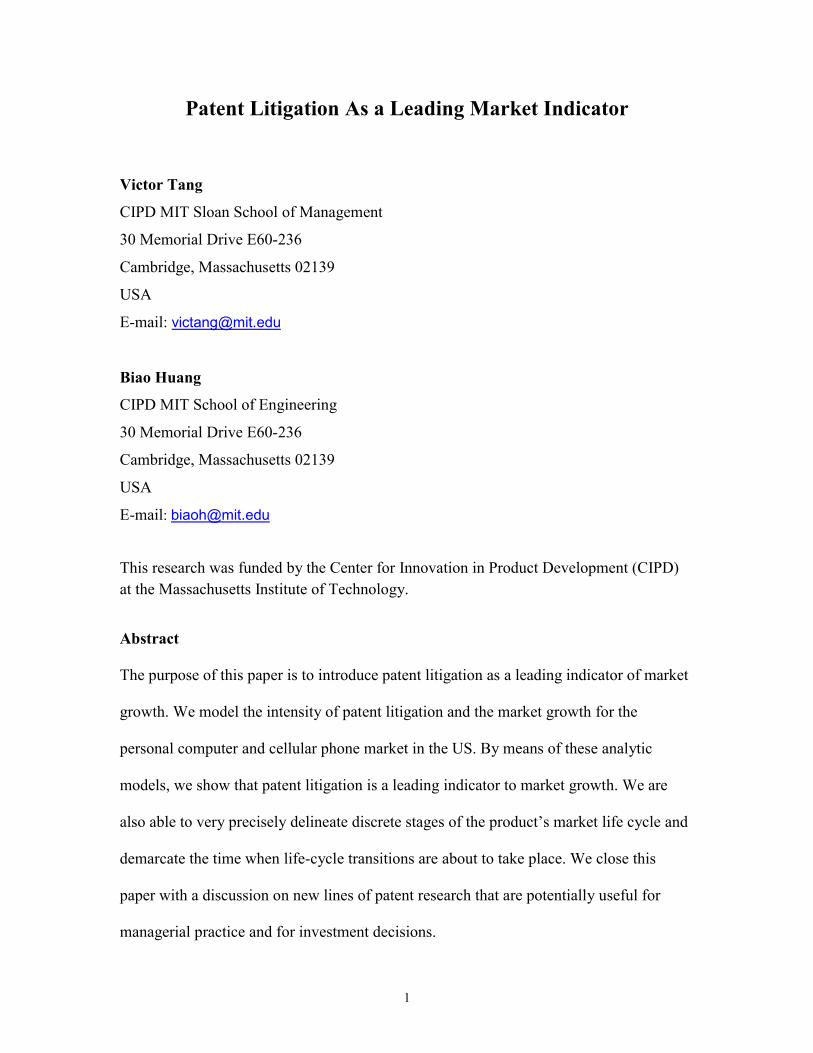
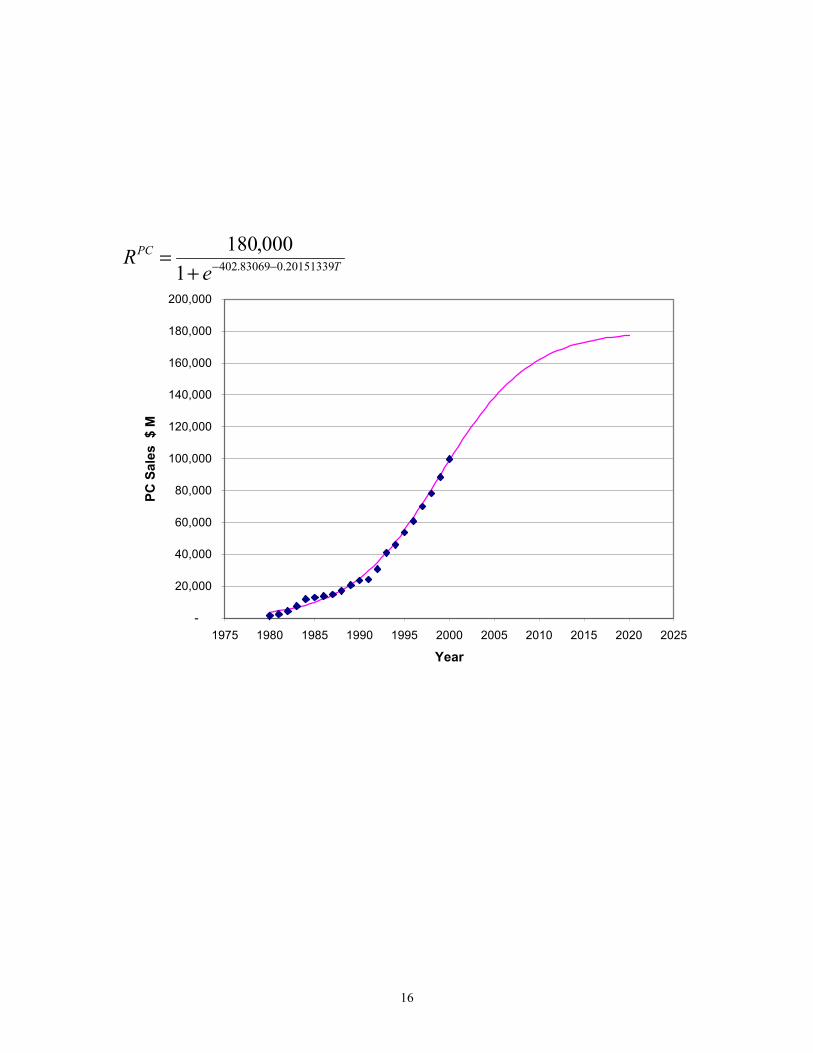
Using the data from Table 1 and by means of regression analysis, the market growth of
the PC industry measured in sales $, is expressed by:
bTamPC
eRR −−+
=1
(1)
RPC is the PC industry revenue curve in monetary units plotted against time as the
independent variable. Rm is the ultimate industry revenue when we expect the market to
be saturated. The coefficients, a and b, are obtained from the regression. The variable T
is time, which is measured in years. Note that equation (1) takes the form of the logistics
Page 6
6
curve. In equation (1), we have: Rm=$180,000 million, a = 402.83069, b = 0.20151339
and R2 = 0.986. This is illustrated below in Figure 1.
Page 7
7
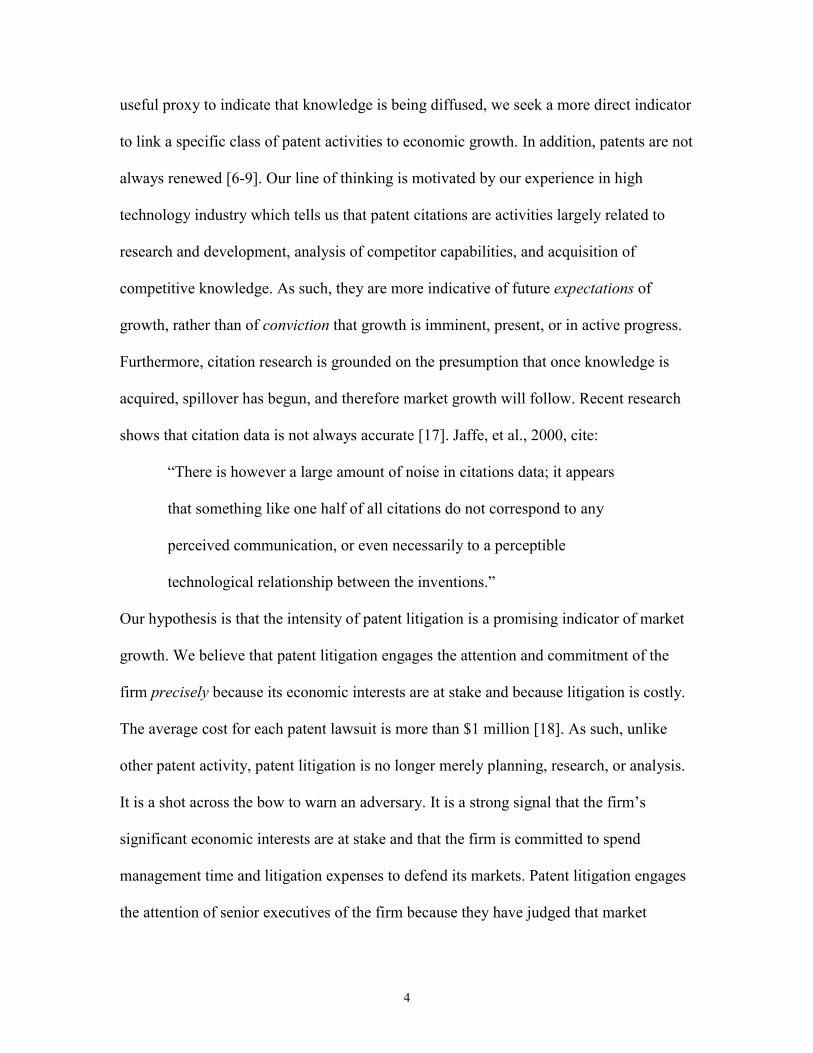
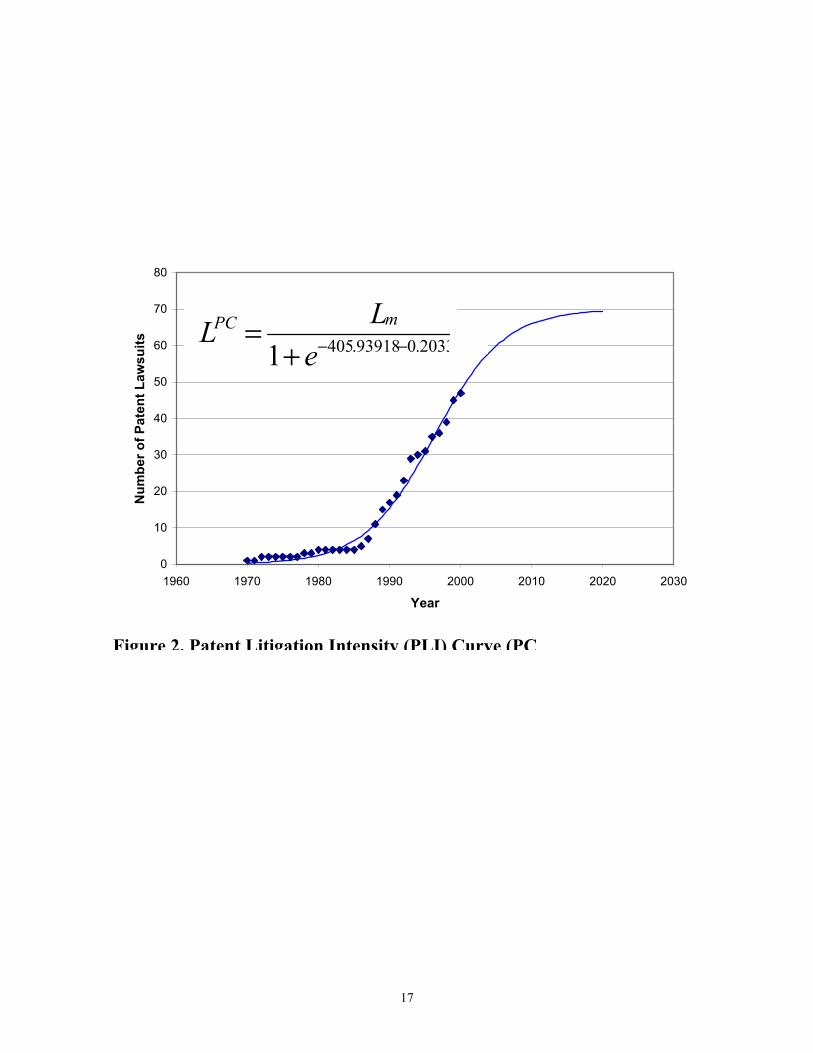
Intuitively, the rate of the rise of the PLI curve is indicative of the increasing intensity of
the patent litigation. Using the same regression approach, we can express the PLI curve in
the following form:
dTcmPC
eLL −−+
=1
(2)
LPC is the litigation intensity function for the PC market. Lm is the maximum level
of litigation intensity. We obtain the coefficients c and d from a regression analysis. The
independent variable T is time, which we measure in years. In equation (2), we have
Lm=70, and obtained c = 405.93918, d = 0.20335124, with R2 = 0.961.
We plot the functions d2RPC/dt2 and d2LPC/dt2 as shown in Figure 3. There are
three points of specific interest in our analysis:
T1 where d2LPC/dt2= maximum at year 1989.8,
T2 where d2RPC/dt2= maximum at year 1992.5, and
T3 where d2RPC/dt2= 0 at year 1999.0.
We can now segment, with some precision, the PC market life cycle into 4 distinct
segments: T ≤ T1, T1 < T<T2, T2<T<T3 and T ≥ T3 as shown in Figure 3. We show the PLI
and the market growth function in Figure 4 with the life-cycle segments delineated by the
time periods in discussion where T1=1989.8, T2=1992.5 and T3=1999.0
We call the time period T ≤ T1, the period of “market establishment.” This is the
time when the first movers try to establish their position in the market. In order to protect
their investments that helped create this market, firms defend their exclusive rights to
innovation by litigation where they are convinced their business interests are being
violated. At this time litigation is intense and accelerating driven by their belief that the
Page 8
8
market is about to take off. Evidence of market growth helps to strengthen that
conviction. In addition, firms use patents as weapons to defend their markets or as
instruments to “hem in” in markets led by others [20, 21]. This is a particularly common
business practice before the take off stage of new markets. However, eventually litigation
intensity slows down to the point where its acceleration reaches a maximum at time T1.
The time between T1 and T2 is when litigation is decelerating, but when market
revenue are continuously growing and accelerating until it reaches at point T2, indicating
that the risks are now lower than before. Therefore, we call this time the “window of
opportunity”. We interpret this period as the time when business executives have
Page 9
9
determined that knowledge spillover has already taken place and that it is no longer
productive to engage in costly patent litigation. The “window of opportunity” is the
optimum time for fast-followers to enter the market because the market is growing most
rapidly. This is also the time for conservative and risk-averse investors to commit funds
in new ventures. However, they should be prepared to face increasingly intensive
competition.
The time T, T2<T<T3, we call the “market maturation” period. This is the time
when there is steady market growth, albeit, at a decelerating pace until the acceleration of
Page 10
10
market revenue reaches zero at time T3, i.e., where d2RPC/dt2= 0. Typically late
followers enter the market at this time, when the risk is lowest and when the acceleration
has already peaked. No acceleration means that the growth is beginning to decline. This
is an indicator of market maturation. Consequently the time T≧T3 we call the period of
“market saturation.”
According to our analysis, we note that the “window of opportunity” for the PC
market is between 1989.8 and 1992.5, a time interval of 2.7 years. The “market
maturation” period is between 1992.5 and 1999.0, a time interval of 6.5 years. These time
intervals are consistent with our intuition and historical development. According to IDG,
the US PC market will reach saturation in 2001. The PC established itself in the market
rapidly and created for itself a long lasting market period to the point where it is now
widely adopted in virtually every walk of life. (Note that is important to carry out the
years to one decimal place. In a fast moving business like high technology months can
mean the difference between a profitable or a non-profitable quarter.)
Data and Model for the Cellular Phone Industry
In the US, Motorola has been the key creator, innovator and driver of the cellular phone
market. Relative to the PC market, the cellular phone business is younger, which is the
reason why we collected Motorola’s patent litigation activity from 1975 up to the present,
2000. Consequently, whereas in the case of the PC we had 30 years of data, for the cellular
phone market we have only have a track of 25 years. Table 4 shows details of the litigation
intensity for the cellular phone market. Next we collected information of the US market
size, measured in terms of total subscribers, for the same period of time, illustrated in Table
3.
Page 11
11
We plot the data from Table 3 and a regression, the market growth of cellular
phone is expressed by:
kThmCP
eSS −−+
=1
(5)
where Sm=170 million, h=817.69779, k=0.40901375, and R2=0.99. The interpretation of
this equation is analogous to (1). And as in the previous example of the PC market, we
plot the data from Table 4 as a function of time. This is the PLI curve for the cellular
phone market. The mathematical expression of that is:
gTfmCP
eLL −−+
=1
(6)
where Lm=70, f=333.11908, g=1.66852027, with R2=0.94. We combine the PLI curve
and the market growth curve of the cellular phone market in Figure 5.
As in the PC market, we now segment the cellular phone market life-cycle into 4
distinct segments: T≦T1, T1<T<T2, T2<T<T3 and T≧T3 as shown in Figure 5. We show
the PLI and the market growth function in Figure 5 with the life-cycle segments
delineated by the time periods in discussion where T1=1988.6, T2=1996.5 and T3=1999.2.
Note that in this case the “window of opportunity” is 7.9 years. Recall that this is longer
than PC market. We interpret this to mean that the patent litigation activity started earlier
in the market life cycle because firms recognized the promise of the cellular phone
market. Note that its maturation period is much shorter. Once people started to become
comfortable communicating with cellular phones, it became widely accepted very
quickly. The interpretation and discussion of the business implications follow similar
lines, which have already been discussed in the section for the PC market.
Page 13
13
Discussion
In this paper we have presented analysis for two markets to show that patent litigation
intensity (PLI) is a useful indicator of market growth. Patent citation analysis has been a
fruitful arena of research using a specific patent activity to demonstrate that knowledge
diffuses into the economy to subsequently create economic growth. We have shown the
existence of another specific patent activity, patent litigation, as a more direct indicator of
market growth.
We have argued that patent citations are indicative of research, learning and
expectations of market growth. In contrast, patent litigation is more akin to a declaration
of war motivated by unambiguous commitment and a clear conviction that the firm’s
economic interests are being violated. As such PLI is a more direct indicator of market
growth than other patent activities. We believe that this kind of patent analysis offers new
avenues of research. For example, we are analyzing software copyright violations to
determine its effectiveness as an indicator of market growth. Theoretical economic
research suggests that this may be case [22].
Pursuing this line of thinking further, we propose that patent activity analysis be
partitioned into three classes of activities, 1) completely legal activities such as patent
citations and licensing, 2) disputed activities such as patent infringements, patent
litigation and reverse engineering, and 3) illegal patent activities, such as theft of patent
embodiments. This suggests that it would be useful to develop an integrated framework
that combines a closed of patent activities L={li, i=1,…,n, n>0}, D={dj, j=1,…,m, m>0},
P={k, k=1,…,r, r>0}, such that 1) L Υ D Υ P={patent activities}z, where z ≤ n+m+r,
L Ι D=∅, L Ι P=∅, D Ι P=∅, and 2) the elements spanning each set are orthogonal and
Page 14
14
complete. We claim that, at least, L admits l1=patent citations and D admits d1=patent
litigation, and set P admits p1=piracy.
We are currently engaged in efforts to combine patent citations and patent
litigation as first step to determine whether we can find an equation for market growth of
the form ψ=ψ(L,D,P,T) where T is time.
It is appropriate to point out some limitations of our model. We have applied our
patent litigation analysis to new markets prior to its take-off stage in only two markets in
the US. Extending this analysis to other technology intensive markets in, such as
bioengineering, and pharmaceuticals, will shed more light on the timing of market take-
off. Research shows that technology moves in waves, i.e., new S-curves ride on top of
maturing S-curves [23, 24]. It is reasonable to expect that market growth when
approaching its asymptote, will move additively on a new S-curve spurred by new
technology. We also did not consider the resolution of litigation. The number of suits
does not reach an asymptotic level and remain at that level. At some point while the PLI
approaches its asymptote, PLI should begin to attenuate rapidly as dominant technologies
assert themselves in the market. The point at which this occurs relative to the market
growth curve is another area that merits further investigation.
In spite of its embryonic form, we believe that PLI is a potentially useful indicator
to investors in new technology-intensive markets and industries. For venture capitalists,
angels, or other investors, PLI can serve as additional confirmation to other indicators
they may use. For example, a financial investment firm seeking to commit funds to a new
business venture may want to adopt PLI as an indicator in its risk analysis.
Page 15
15
Acknowledgements
The authors gratefully acknowledge the useful and insightful discussions with attorneys
Ling-Fong Chung and Micheline Tang about the issues and observations in this paper.
However, we are responsible for any errors and other shortcomings.
Page 16
16
TPC
eR 20151339.083069.4021
000,180−−+
=
-
20,000
40,000
60,000
80,000
100,000
120,000
140,000
160,000
180,000
200,000
1975 1980 1985 1990 1995 2000 2005 2010 2015 2020 2025
Year
PC S
ales
$ M
Page 17
17
0
10
20
30
40
50
60
70
80
1960 1970 1980 1990 2000 2010 2020 2030
Year
Num
ber o
f Pat
ent L
awsu
its
mPC
eLL 2033.093918.4051 −−+
=
Figure 2. Patent Litigation Intensity (PLI) Curve (PC
Page 18
18
0
20 ,00 0
40 ,00 0
60 ,00 0
80 ,00 0
1 00 ,00 0
1 20 ,00 0
1 40 ,00 0
1 60 ,00 0
1 80 ,00 0
2 00 ,00 0
19 70 19 75 19 80 1 98 5 19 90 19 95 2 00 0 2 005 20 10 20 15 2 02 0
Y ear
PC C
umul
ativ
e Sa
les
$M
0
10
20
30
40
50
60
70
80
PC P
LI
PC PLI
Opportunity Window 2.7 years
PC Cumulative Sales
Figure 3. US PC PLI and PC Cumulative Sales
1989.8 1992.5 1999.0
T1 T2 T3
Page 19
19
-0.4
-0.3
-0.2
-0.1
0.0
0.1
0.2
0.3
0.4
1970 1980 1990 2000 2010 2020
Year
dL2/
d2t
-800
-600
-400
-200
0
200
400
600
800
dR2/
d2t
Figure 4. Second Derivative PC PLI and PC Market Growth Model
1989.8
1999.01992.5d2L/dt2 d2S/dt2
T1 T2 T3
Page 20
20
-
20
40
60
80
100
120
140
160
180
1975 1980 1985 1990 1995 2000 2005 2010 2015 2020Year
Subc
riber
Num
ber
0
10
20
30
40
50
60
70
80
Pate
nt L
awsu
its C
umul
ativ
e N
umbe
r
Page 22
22
-0.25
-0.20
-0.15
-0.10
-0.05
0.00
0.05
0.10
0.15
0.20
0.25
1975 1985 1995 2005 2015
Year
dL2/
d2t
-3
-2
-1
0
1
2
3
4
dS2/
d2t
d2S/dt2
Figure 6. Second Derivative of US PLI and Market Growth Model for Cellular Phones
1988.6d2L/dt2
T1 T2 T3
1996.5
1999.2
Page 23
23
Table 1. PC Market Revenues 1980-2000
Year Annual Sale $m 1980 1,550 1981 2,550 1982 4,390 1983 7,470 1984 11,940 1985 13,040 1986 13,940 1987 14,881 1988 17,147 1989 20,707 1990 23,584 1991 24,269 1992 30,833 1993 40,985 1994 46,052 1995 53,706 1996 61,008 1997 70,090 1998 78,240 1999 88,440 2000 99,700
(Source: Information Technology Industry Data Book)
Table 2. PC Industry Patent Litigation Intensity (PLI)
Year Patent
Litigation 1970 0 1971 0 1972 1 1973 0 1974 0 1975 0 1976 0 1977 0 1978 1 1979 0 1980 1 1981 0 1982 0 1983 0 1984 0 1985 0 1986 1 1987 2 1988 4 1989 4 1990 2 1991 2 1992 4 1993 6 1994 1 1995 1 1996 4 1997 1 1998 3 1999 6 2000 2
(Source: http://web.lexis-nexis.com/)
Page 24
24
Table 3. US Cellular Phone Subscribers 1985-2000
Year Subscribers 1985 203,600 1986 500,000 1987 883,778 1988 1,608,697 1989 2,691,793 1990 4,368,686 1991 6,380,053 1992 8,892,535 1993 13,067,318 1994 19,283,306 1995 28,154,446 1996 38,411,446 1997 49,680,446 1998 63,577,446 1999 80,000,000
(Source: Strategy Research Division)
Table 4. Patent Litigation Intensity (PLI) of US Cellular
Phone Market 1985-2000
Year Patent
Lawsuits1975 1 1976 1 1977 0 1978 0 1979 0 1980 4 1981 1 1982 0 1983 0 1984 4 1985 2 1986 1 1987 2 1988 1 1989 1 1990 3 1991 2 1992 0 1993 0 1994 2 1995 1 1996 2 1997 7 1998 2 1999 2 2000 3
(Source: http://web.lexis-nexis.com/)
Page 25
25
References:
[1] Sanders, B., Rossman, J., and Harris, L.J., 1958, “The economic impact of patents”,
Patent, Trademark and Copyright Journal, Vol. 2, pp. 340-363.
[2] Griliches, Z., 1981, “Market value, R&D and patents”, Economic Letters. Vol. 7, pp.
183-187.
[3] Griliches, Z., 1990, “Patent Statistics as Economic Indicators”, Journal of Economic
Literature, Dec. 1990, 18(4), pp. 1661-1707.
[4] Kortum, Samuel, and Josh Lerner, 1997, “Stronger Protection or Technological
Revolution: What is Behind the Recent Surge in Patenting?”, Working Paper W6204,
National Bureau of Economic Research, 1050 Massachusetts Avenue, Cambridge, MA.
02138.
[5] Levin, R.C., A.K. Klevorick, R.R. Nelson, and S.G. Winter, 1987, “Appropriating the
Returns from Industrial Research and Development,” Brookings Paper on Economic
Activity (3): 783-820.
[6] Pakes, A. and Schankerman M. 1984, “The rate of Obsolescence of patents, research
gestation and lags, and the private rate of return to research resources”, in X. Griliches
(ed), R&D, Patents and Productivity, NBCR Conference Series, Chicago, Chicago UP.
[7] Bosworth, D. and Jobome, G. 1997, “Competition and Spillovers: evidence of the
creative-destruction of intellectual property using patent renewals”, AEA Conference on
the Econometrics of Innovation (Patents), Luxembourg, and the New Advances in
Itellectual Property: Law and Economics. St. Peter’s College, Oxford. -
Page 26
26
[8] Bosworth, D. and Jobome, G. 1999, “The measurement and management of risk in
R&D innovation”, International Journal Technology Management, Vol 18, Nos. 5/6/7/8,
pp. 476-499.
[9] Lanjouw, Jean O., and Ariel Pakes, 1996, “How to Count Patents and Value
Intellectual Property: Uses of Patent Renewal and Application Data”, Working Paper
W5741, National Bureau of Economic Research, 1050 Massachusetts Avenue,
Cambridge, MA. 02138.
[10] Jaffe, A.B. and Trajtenberg, M. 1998, “International Knowledge Flows: Evidence
from Patent Citations”, Working Paper W6507, National Bureau of Economic Research,
1050 Massachusetts Avenue, Cambridge, MA. 02138.
[11] Jaffe, A.B. and Michael S. Fogarty, 1997, “Evidence from Patents and Patent
Citations on the Impact of NASA and Other Federal Labs on Commercial Innovation”,
Working Paper W6044, National Bureau of Economic Research, 1050 Massachusetts
Avenue, Cambridge, MA. 02138.
[12] Jaffe, A.B. and Trajtenberg, M. 1996, “Flows of Knowledge from Universities and
Federal Labs: Modeling the Flow of Patent Citations over Time and Across Institutional
and Geographic Boundaries”, Working Paper 5712, National Bureau of Economic
Research, 1050 Massachusetts Avenue, Cambridge, MA. 02138.
[13] Jaffe, A.B., Trajtenberg, M., and Henderson R. 1992, “Geographic Localization of
Knowledge Spillovers as Evidenced by Patent Citations”, Working Paper 3993, National
Bureau of Economic Research, 1050 Massachusetts Avenue, Cambridge, MA. 02138. [ ]
Page 27
27
[14] Adams, J.D., 2000, “Endogenous R&D Spillovers and Industrial Research
Productivity”, Working Paper W7484, National Bureau of Economic Research, 1050
Massachusetts Avenue, Cambridge, MA. 02138.
[15] Lanjouw, Jean O., and Josh Lerner, 1996, “Preliminary Injunctive Relief: Theory
and Evidence from Patent Litigation”, Working Paper W5689, National Bureau of
Economic Research, 1050 Massachusetts Avenue, Cambridge, MA. 02138.
[16] Lanjouw, Jean O., and Josh Lerner, 1997, “The Enforcement of Intellectual Property
Rights: A Survey of the Empirical Literature”, Working Paper W6296, National Bureau
of Economic Research, 1050 Massachusetts Avenue, Cambridge, MA. 02138.
[17] Jaffe, A.B., Trajtenberg, M. and Fogarty, M.S. 2000, “The Meaning of Patent
Citations: Report on the NBER/Case-Western Reserve Surveys of Patentees”, Working
Paper 7631, National Bureau of Economic Research, 1050 Massachusetts Avenue,
Cambridge, MA. 02138.
[18] Warshofsky, Fred, 1994, The Patent War, John Wiley & Sons, Inc.
[19] http://web.lexis-nexis.com/universe
[20] Rivette, G. Kevin, and Kline, David, 2000, Rembrandts in the Attic: Unlocking the
Hidden Value of Patents, Harvard Business School Press.
[21] Glazier, Stephen, 2000, Patent Strategies for Business, LBI Institute, Third Edition.
[22] Shy, O. and Thisse, J., 1999, “A Strategic Approach to Software Protection”, Journal
of Economics and Management Strategy, Vol. 8, No. 2, pp. 163-190.
[23] Cox, W., 1967, “Product Life Cycles as Market Models,” Journal of Business, Vol
40, October, pp. 382.
Page 28
28
[24] Foster, R.N., Innovation : The Attacker's Advantage, 1986, New York : Summit
Books.