20
Pathways to LDC Graduation The Case of Nepal SWARNIM WAGLÉ NATIONAL PLANNING COMMISSION
Pathways to LDC Graduation The Case of Nepal
SWARNIM WAGLÉ N A T I O N A L P L A N N I N G C O M M I S S I O N
Outline
1. LDCs: A Glimpse
2. Graduation and IPoA
3. Where Does Nepal Stand?
4. The Path Ahead
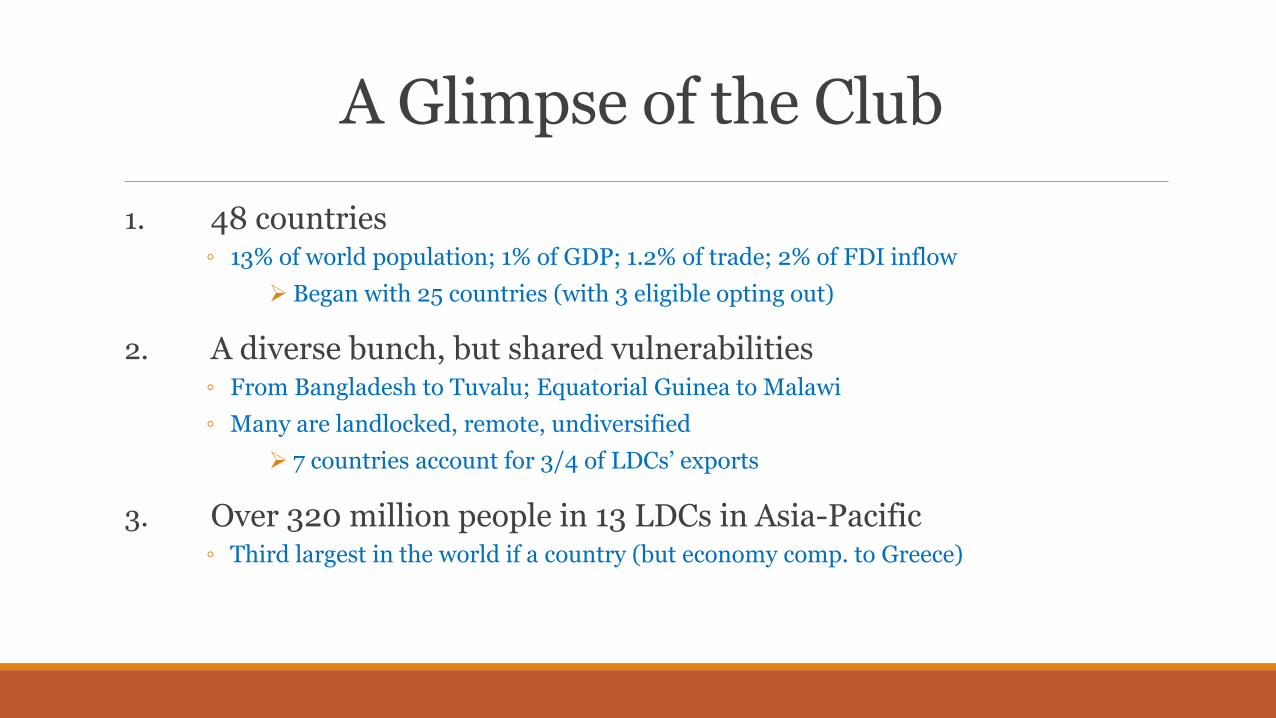
A Glimpse of the Club
1. 48 countries ◦ 13% of world population; 1% of GDP; 1.2% of trade; 2% of FDI inflow
Began with 25 countries (with 3 eligible opting out)
2. A diverse bunch, but shared vulnerabilities ◦ From Bangladesh to Tuvalu; Equatorial Guinea to Malawi
◦ Many are landlocked, remote, undiversified
7 countries account for 3/4 of LDCs’ exports
3. Over 320 million people in 13 LDCs in Asia-Pacific ◦ Third largest in the world if a country (but economy comp. to Greece)
BGD
KHM
LAO
NPL
SLB
TMP
YEM
0
.05
.1
.15
.2
.25
Ch
an
ge
in n
on
-in
com
e H
DI
20
00
-20
13
-.5 0 .5 1 1.5
Log change in real GDP, 2000-2013
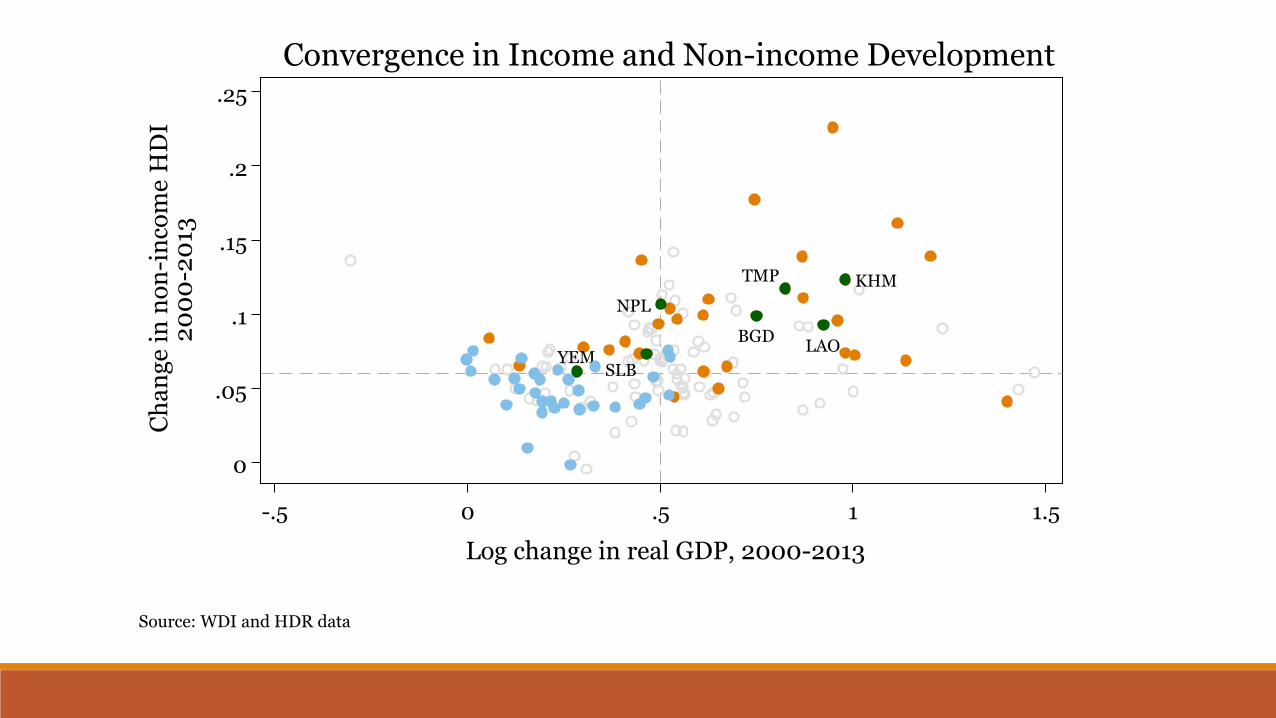
Source: WDI and HDR data
Convergence in Income and Non-income Development
BGD
BTN
KIR NPL
VUT BGD
BTN
KIR NPL
VUT BGD
BTN
KIR NPL
VUT BGD
BTN
KIR NPL
VUT BGD
BTN
KIR NPL
VUT BGD
BTN
KIR NPL
VUT BGD
BTN
KIR NPL
VUT BGD
BTN
KIR NPL
VUT BGD
BTN
KIR NPL
VUT BGD
BTN
KIR NPL
VUT BGD
BTN
KIR NPL
VUT BGD
BTN
KIR NPL
VUT BGD
BTN
KIR NPL
VUT BGD
BTN
KIR NPL
VUT BGD
BTN
KIR NPL
VUT BGD
BTN
KIR NPL
VUT BGD
BTN
KIR NPL
VUT BGD
BTN
KIR NPL
VUT BGD
BTN
KIR NPL
VUT BGD
BTN
KIR NPL
VUT BGD
BTN
KIR NPL
VUT BGD
BTN
KIR NPL
VUT BGD
BTN
KIR NPL
VUT BGD
BTN
KIR NPL
VUT BGD
BTN
KIR NPL
VUT BGD
BTN
KIR NPL
VUT BGD
BTN
KIR NPL
VUT BGD
BTN
KIR NPL
VUT BGD
BTN
KIR NPL
VUT BGD
BTN
KIR NPL
VUT BGD
BTN
KIR NPL
VUT BGD
BTN
KIR NPL
VUT BGD
BTN
KIR NPL
VUT BGD
BTN
KIR NPL
VUT BGD
BTN
KIR NPL
VUT BGD
BTN
KIR NPL
VUT BGD
BTN
KIR NPL
VUT BGD
BTN
KIR NPL
VUT BGD
BTN
KIR NPL
VUT BGD
BTN
KIR NPL
VUT BGD
BTN
KIR NPL
VUT BGD
BTN
KIR NPL
VUT BGD
BTN
KIR NPL
VUT BGD
BTN
KIR NPL
VUT BGD
BTN
KIR NPL
VUT BGD
BTN
KIR NPL
VUT BGD
BTN
KIR NPL
VUT BGD
BTN
KIR NPL
VUT
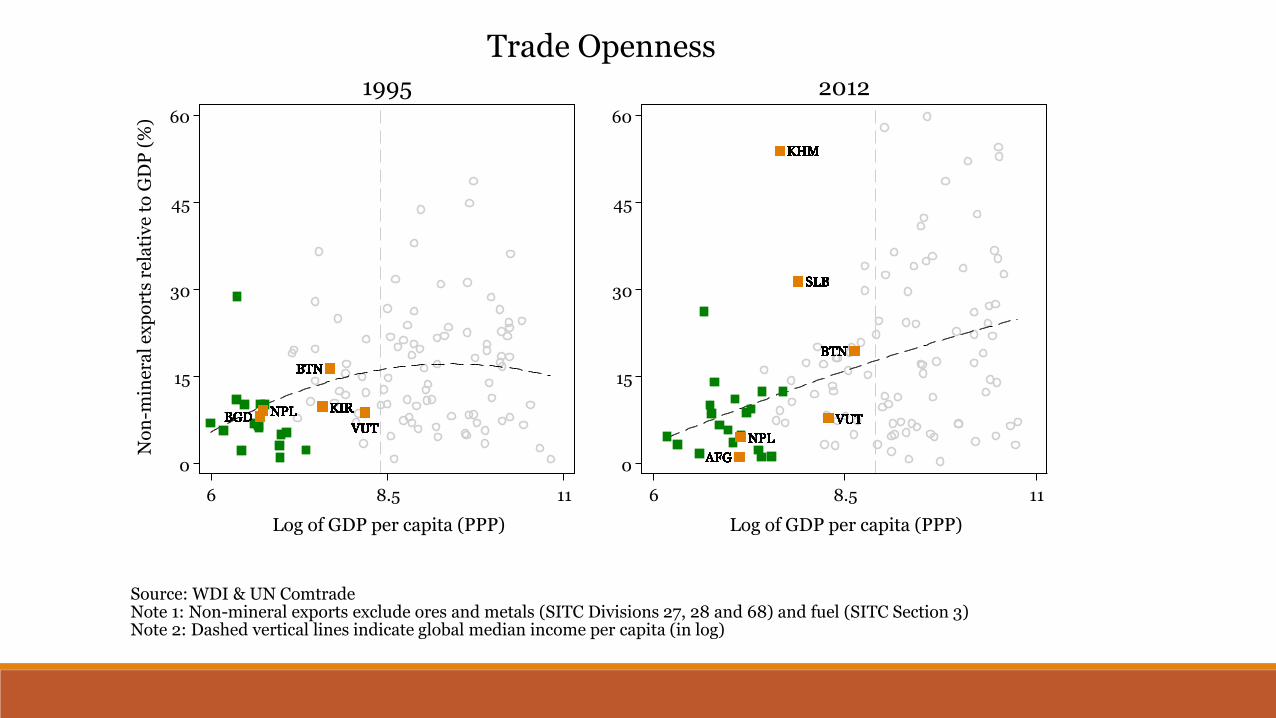
0
15
30
45
60
No
n-m
iner
al
exp
ort
s re
lati
ve
to G
DP
(%
)
6 8.5 11
Log of GDP per capita (PPP)
1995
AFG
BTN
KHM
NPL
SLB
VUT
AFG
BTN
KHM
NPL
SLB
VUT
AFG
BTN
KHM
NPL
SLB
VUT
AFG
BTN
KHM
NPL
SLB
VUT
AFG
BTN
KHM
NPL
SLB
VUT
AFG
BTN
KHM
NPL
SLB
VUT
AFG
BTN
KHM
NPL
SLB
VUT
AFG
BTN
KHM
NPL
SLB
VUT
AFG
BTN
KHM
NPL
SLB
VUT
AFG
BTN
KHM
NPL
SLB
VUT
AFG
BTN
KHM
NPL
SLB
VUT
AFG
BTN
KHM
NPL
SLB
VUT
AFG
BTN
KHM
NPL
SLB
VUT
AFG
BTN
KHM
NPL
SLB
VUT
AFG
BTN
KHM
NPL
SLB
VUT
AFG
BTN
KHM
NPL
SLB
VUT
AFG
BTN
KHM
NPL
SLB
VUT
AFG
BTN
KHM
NPL
SLB
VUT
AFG
BTN
KHM
NPL
SLB
VUT
AFG
BTN
KHM
NPL
SLB
VUT
AFG
BTN
KHM
NPL
SLB
VUT
AFG
BTN
KHM
NPL
SLB
VUT
AFG
BTN
KHM
NPL
SLB
VUT
AFG
BTN
KHM
NPL
SLB
VUT
AFG
BTN
KHM
NPL
SLB
VUT
AFG
BTN
KHM
NPL
SLB
VUT
AFG
BTN
KHM
NPL
SLB
VUT
AFG
BTN
KHM
NPL
SLB
VUT
AFG
BTN
KHM
NPL
SLB
VUT
AFG
BTN
KHM
NPL
SLB
VUT
AFG
BTN
KHM
NPL
SLB
VUT
AFG
BTN
KHM
NPL
SLB
VUT
AFG
BTN
KHM
NPL
SLB
VUT
AFG
BTN
KHM
NPL
SLB
VUT
AFG
BTN
KHM
NPL
SLB
VUT
AFG
BTN
KHM
NPL
SLB
VUT
AFG
BTN
KHM
NPL
SLB
VUT
AFG
BTN
KHM
NPL
SLB
VUT
AFG
BTN
KHM
NPL
SLB
VUT
AFG
BTN
KHM
NPL
SLB
VUT
AFG
BTN
KHM
NPL
SLB
VUT
AFG
BTN
KHM
NPL
SLB
VUT
AFG
BTN
KHM
NPL
SLB
VUT
AFG
BTN
KHM
NPL
SLB
VUT
AFG
BTN
KHM
NPL
SLB
VUT
AFG
BTN
KHM
NPL
SLB
VUT
AFG
BTN
KHM
NPL
SLB
VUT
AFG
BTN
KHM
NPL
SLB
VUT
0
15
30
45
60
6 8.5 11
Log of GDP per capita (PPP)
2012
Source: WDI & UN Comtrade Note 1: Non-mineral exports exclude ores and metals (SITC Divisions 27, 28 and 68) and fuel (SITC Section 3) Note 2: Dashed vertical lines indicate global median income per capita (in log)
Trade Openness
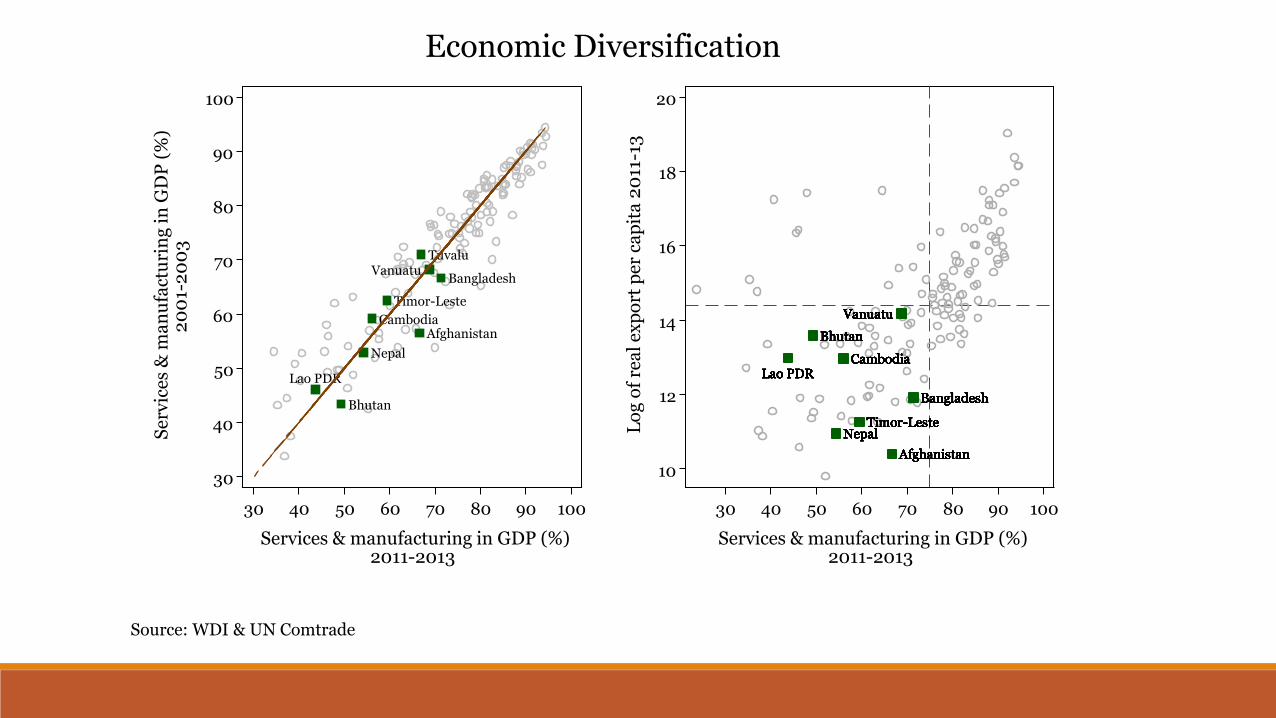
Afghanistan
Bangladesh
Bhutan
Cambodia
Lao PDR
Nepal
Timor-Leste
Tuvalu Vanuatu
30
40
50
60
70
80
90
100
Ser
vic
es &
ma
nu
fact
uri
ng
in
GD
P (
%)
20
01-
20
03
30 40 50 60 70 80 90 100
Services & manufacturing in GDP (%) 2011-2013
Afghanistan
Bangladesh
Bhutan
Cambodia Lao PDR
Nepal Timor-Leste
Vanuatu
Afghanistan
Bangladesh
Bhutan
Cambodia Lao PDR
Nepal Timor-Leste
Vanuatu
Afghanistan
Bangladesh
Bhutan
Cambodia Lao PDR
Nepal Timor-Leste
Vanuatu
Afghanistan
Bangladesh
Bhutan
Cambodia Lao PDR
Nepal Timor-Leste
Vanuatu
Afghanistan
Bangladesh
Bhutan
Cambodia Lao PDR
Nepal Timor-Leste
Vanuatu
Afghanistan
Bangladesh
Bhutan
Cambodia Lao PDR
Nepal Timor-Leste
Vanuatu
Afghanistan
Bangladesh
Bhutan
Cambodia Lao PDR
Nepal Timor-Leste
Vanuatu
Afghanistan
Bangladesh
Bhutan
Cambodia Lao PDR
Nepal Timor-Leste
Vanuatu
Afghanistan
Bangladesh
Bhutan
Cambodia Lao PDR
Nepal Timor-Leste
Vanuatu
Afghanistan
Bangladesh
Bhutan
Cambodia Lao PDR
Nepal Timor-Leste
Vanuatu
Afghanistan
Bangladesh
Bhutan
Cambodia Lao PDR
Nepal Timor-Leste
Vanuatu
Afghanistan
Bangladesh
Bhutan
Cambodia Lao PDR
Nepal Timor-Leste
Vanuatu
Afghanistan
Bangladesh
Bhutan
Cambodia Lao PDR
Nepal Timor-Leste
Vanuatu
10
12
14
16
18
20
Lo
g o
f re
al
exp
ort
pe
r ca
pit
a 2
011
-13
30 40 50 60 70 80 90 100
Services & manufacturing in GDP (%) 2011-2013
Source: WDI & UN Comtrade
Economic Diversification
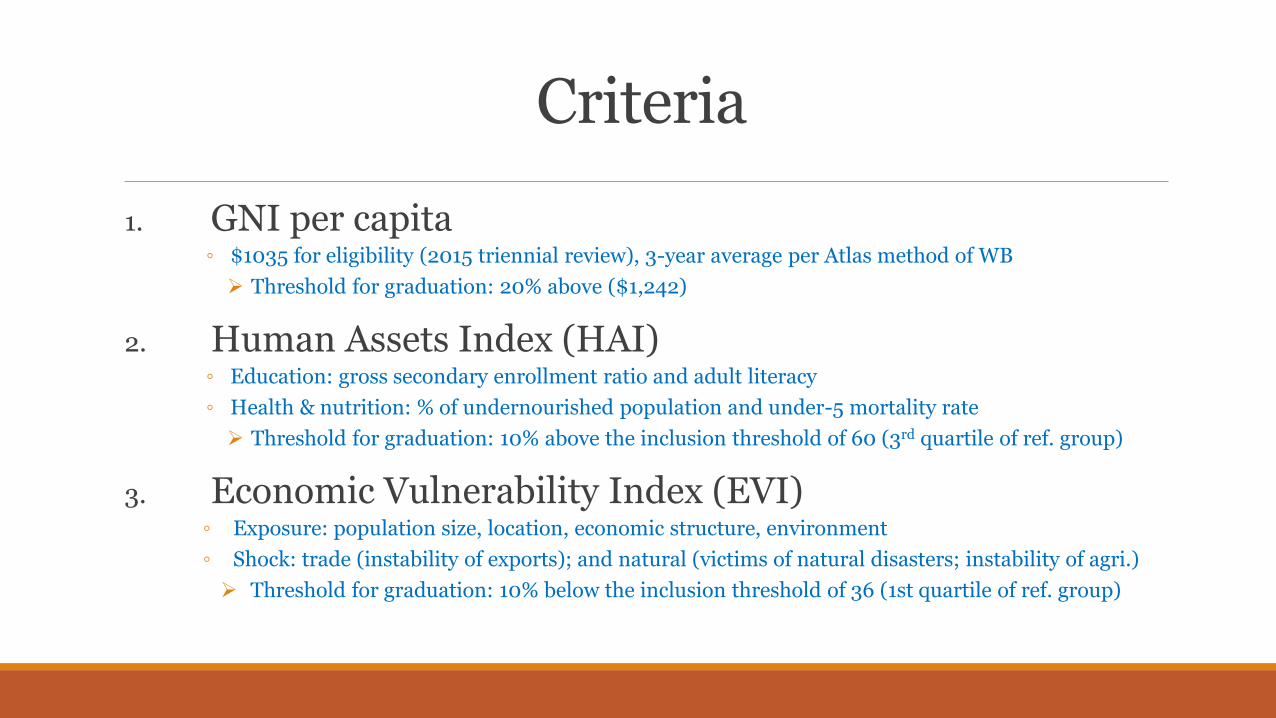
Criteria
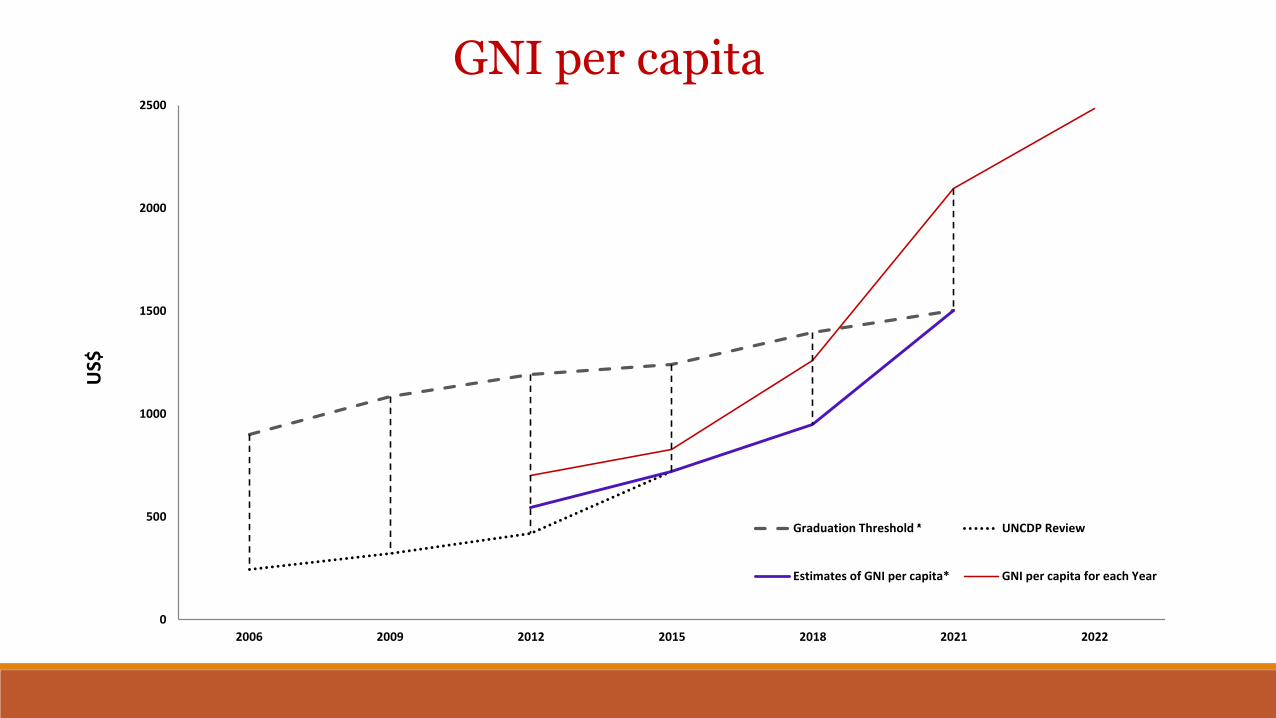
1. GNI per capita ◦ $1035 for eligibility (2015 triennial review), 3-year average per Atlas method of WB
Threshold for graduation: 20% above ($1,242)
2. Human Assets Index (HAI) ◦ Education: gross secondary enrollment ratio and adult literacy
◦ Health & nutrition: % of undernourished population and under-5 mortality rate
Threshold for graduation: 10% above the inclusion threshold of 60 (3rd quartile of ref. group)
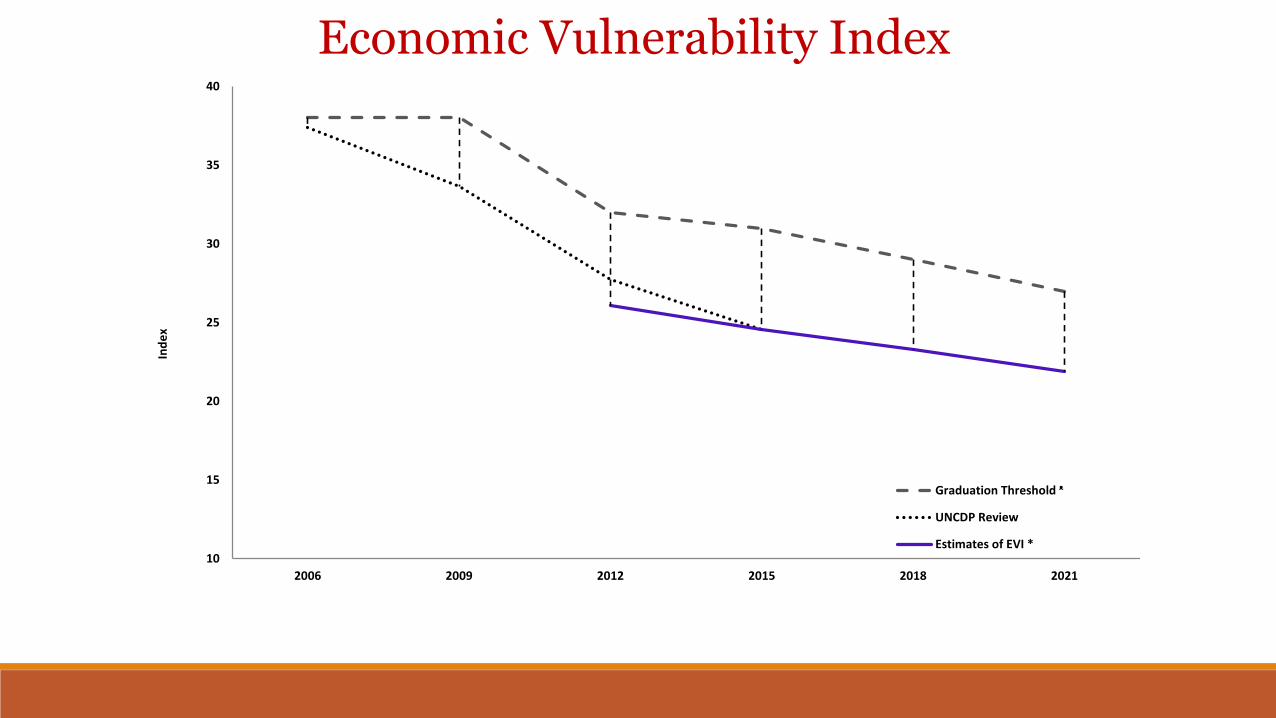
3. Economic Vulnerability Index (EVI) ◦ Exposure: population size, location, economic structure, environment
◦ Shock: trade (instability of exports); and natural (victims of natural disasters; instability of agri.)
Threshold for graduation: 10% below the inclusion threshold of 36 (1st quartile of ref. group)
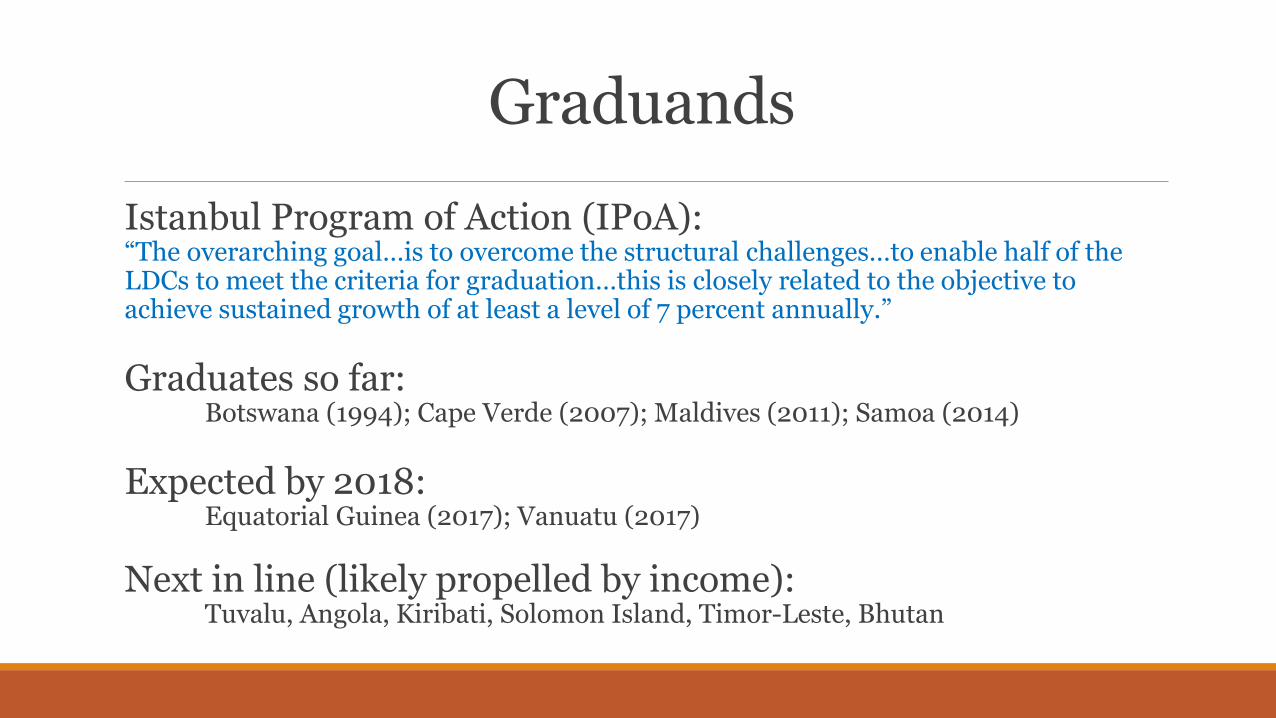
Graduands
Istanbul Program of Action (IPoA): “The overarching goal…is to overcome the structural challenges…to enable half of the LDCs to meet the criteria for graduation…this is closely related to the objective to achieve sustained growth of at least a level of 7 percent annually.”
Graduates so far: Botswana (1994); Cape Verde (2007); Maldives (2011); Samoa (2014)
Expected by 2018: Equatorial Guinea (2017); Vanuatu (2017)
Next in line (likely propelled by income): Tuvalu, Angola, Kiribati, Solomon Island, Timor-Leste, Bhutan
Where does Nepal stand?
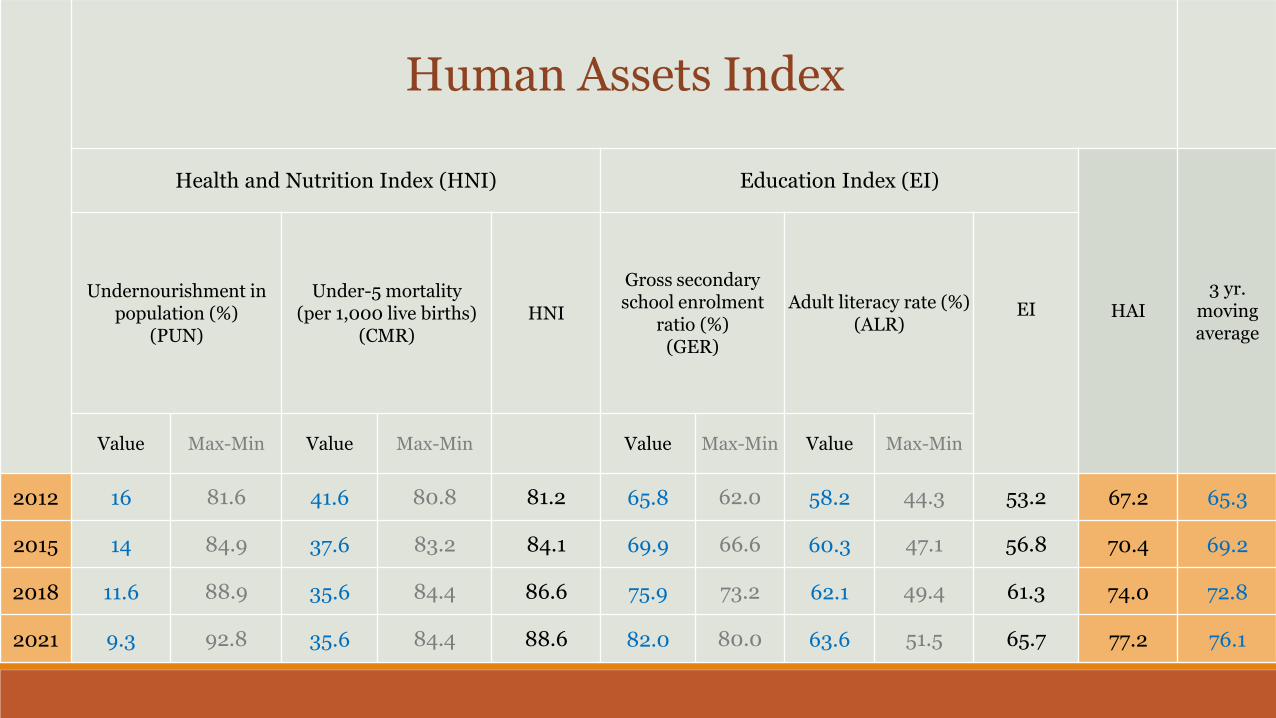
Human Assets Index
Health and Nutrition Index (HNI) Education Index (EI)
HAI 3 yr.
moving average
Undernourishment in population (%)
(PUN)
Under-5 mortality (per 1,000 live births)
(CMR) HNI
Gross secondary school enrolment
ratio (%) (GER)
Adult literacy rate (%) (ALR)
EI
Value Max-Min Value Max-Min Value Max-Min Value Max-Min
2012 16 81.6 41.6 80.8 81.2 65.8 62.0 58.2 44.3 53.2 67.2 65.3
2015 14 84.9 37.6 83.2 84.1 69.9 66.6 60.3 47.1 56.8 70.4 69.2
2018 11.6 88.9 35.6 84.4 86.6 75.9 73.2 62.1 49.4 61.3 74.0 72.8
2021 9.3 92.8 35.6 84.4 88.6 82.0 80.0 63.6 51.5 65.7 77.2 76.1
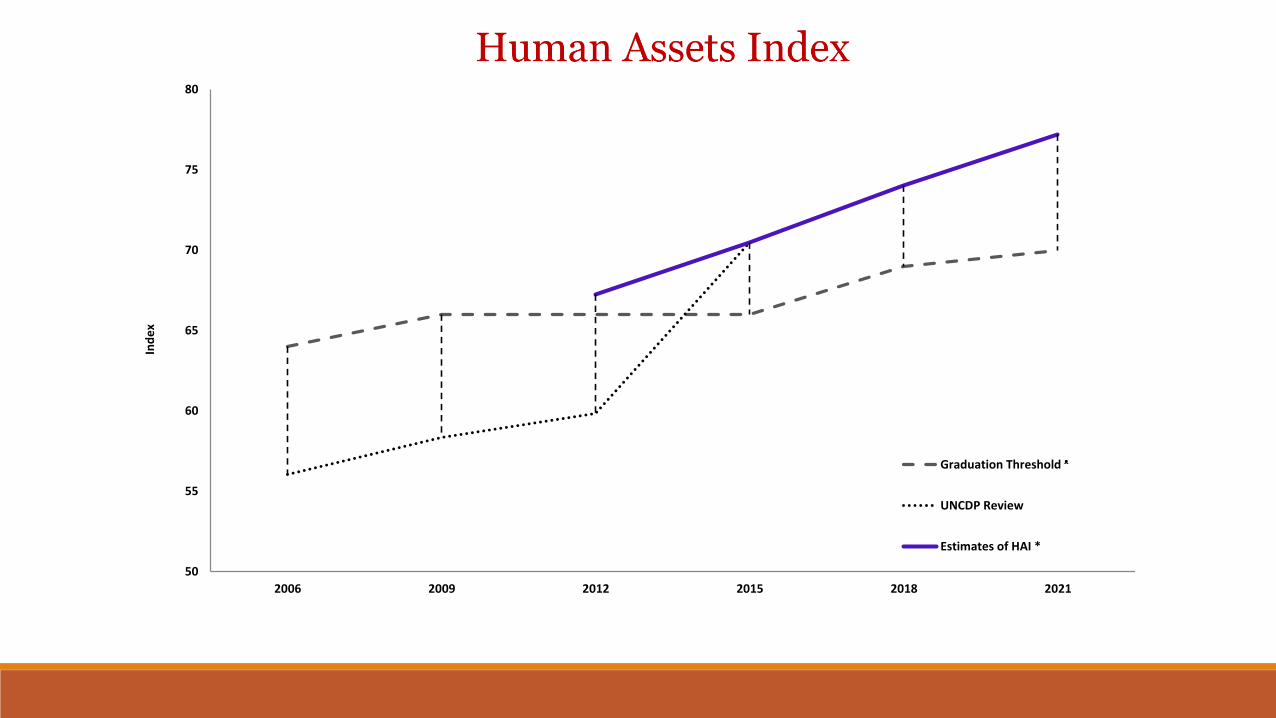
50
55
60
65
70
75
80
2006 2009 2012 2015 2018 2021
Ind
ex
Graduation Threshold ᵜ
UNCDP Review
Estimates of HAI *
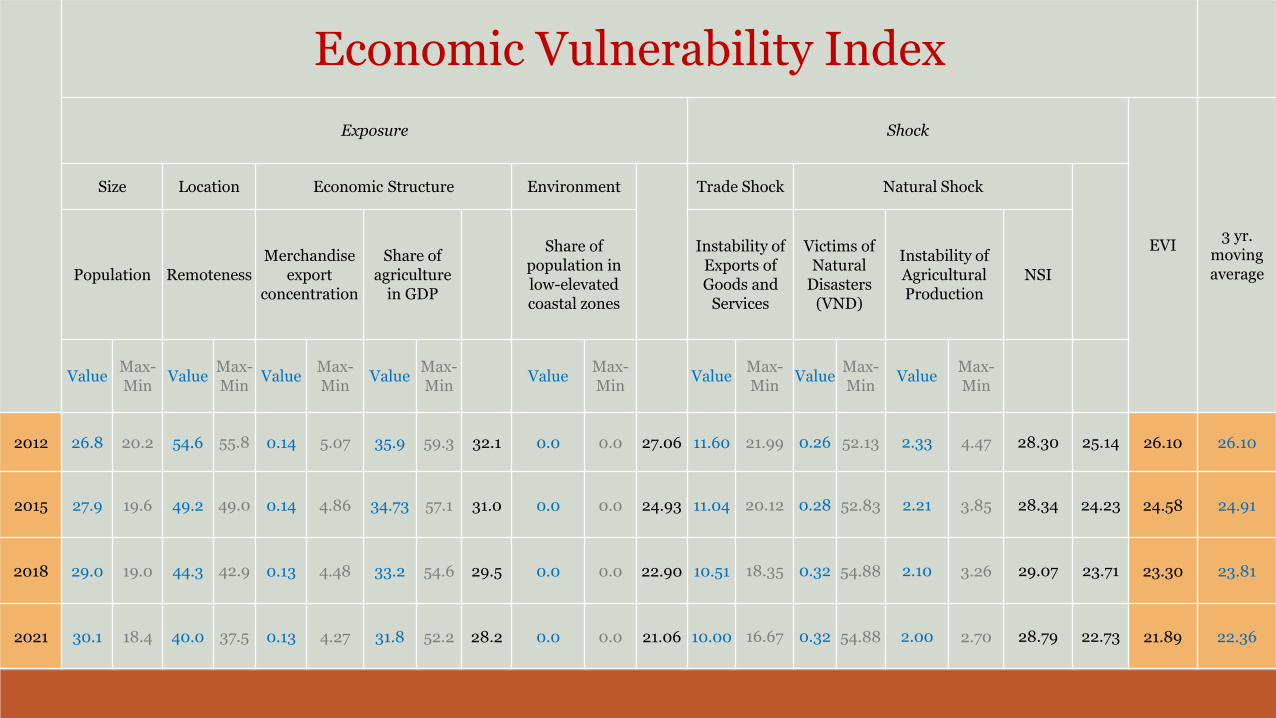
Economic Vulnerability Index
Exposure Shock
EVI
3 yr. moving average
Size Location Economic Structure Environment Trade Shock Natural Shock
Population Remoteness Merchandise
export concentration
Share of agriculture
in GDP
Share of population in low-elevated coastal zones
Instability of Exports of Goods and
Services
Victims of Natural
Disasters (VND)
Instability of Agricultural Production
NSI
Value Max-Min
Value Max-Min
Value Max-Min
Value Max-Min
Value Max-Min
Value Max-Min
Value Max-Min
Value Max-Min
2012 26.8 20.2 54.6 55.8 0.14 5.07 35.9 59.3 32.1 0.0 0.0 27.06 11.60 21.99 0.26 52.13 2.33 4.47 28.30 25.14 26.10 26.10
2015 27.9 19.6 49.2 49.0 0.14 4.86 34.73 57.1 31.0 0.0 0.0 24.93 11.04 20.12 0.28 52.83 2.21 3.85 28.34 24.23 24.58 24.91
2018 29.0 19.0 44.3 42.9 0.13 4.48 33.2 54.6 29.5 0.0 0.0 22.90 10.51 18.35 0.32 54.88 2.10 3.26 29.07 23.71 23.30 23.81
2021 30.1 18.4 40.0 37.5 0.13 4.27 31.8 52.2 28.2 0.0 0.0 21.06 10.00 16.67 0.32 54.88 2.00 2.70 28.79 22.73 21.89 22.36
10
15
20
25
30
35
40
2006 2009 2012 2015 2018 2021
Ind
ex
Economic Vulnerability Index
Graduation Threshold ᵜ
UNCDP Review
Estimates of EVI *
0
500
1000
1500
2000
2500
2006 2009 2012 2015 2018 2021 2022
US$
GNI per capita
Graduation Threshold ᵜ UNCDP Review
Estimates of GNI per capita* GNI per capita for each Year
0
5000
10000
15000
20000
25000
30000
177
5
178
5
179
5
180
5
1815
182
5
183
5
184
5
185
5
186
5
187
5
188
5
189
5
190
5
1915
192
5
193
5
194
5
195
5
196
5
197
5
198
5
199
5
20
05
20
15
Nepal USA South Korea Malaysia
India China Japan Argentina
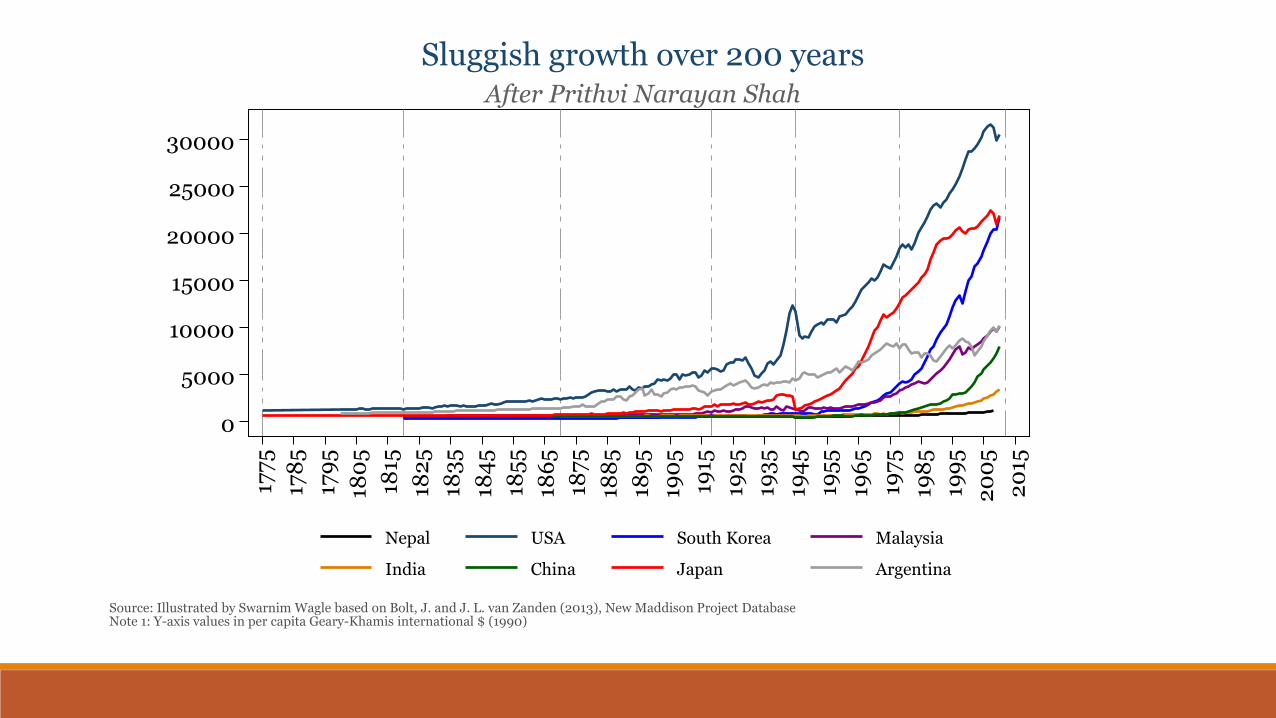
Source: Illustrated by Swarnim Wagle based on Bolt, J. and J. L. van Zanden (2013), New Maddison Project Database Note 1: Y-axis values in per capita Geary-Khamis international $ (1990)
After Prithvi Narayan Shah
Sluggish growth over 200 years
The Path Ahead
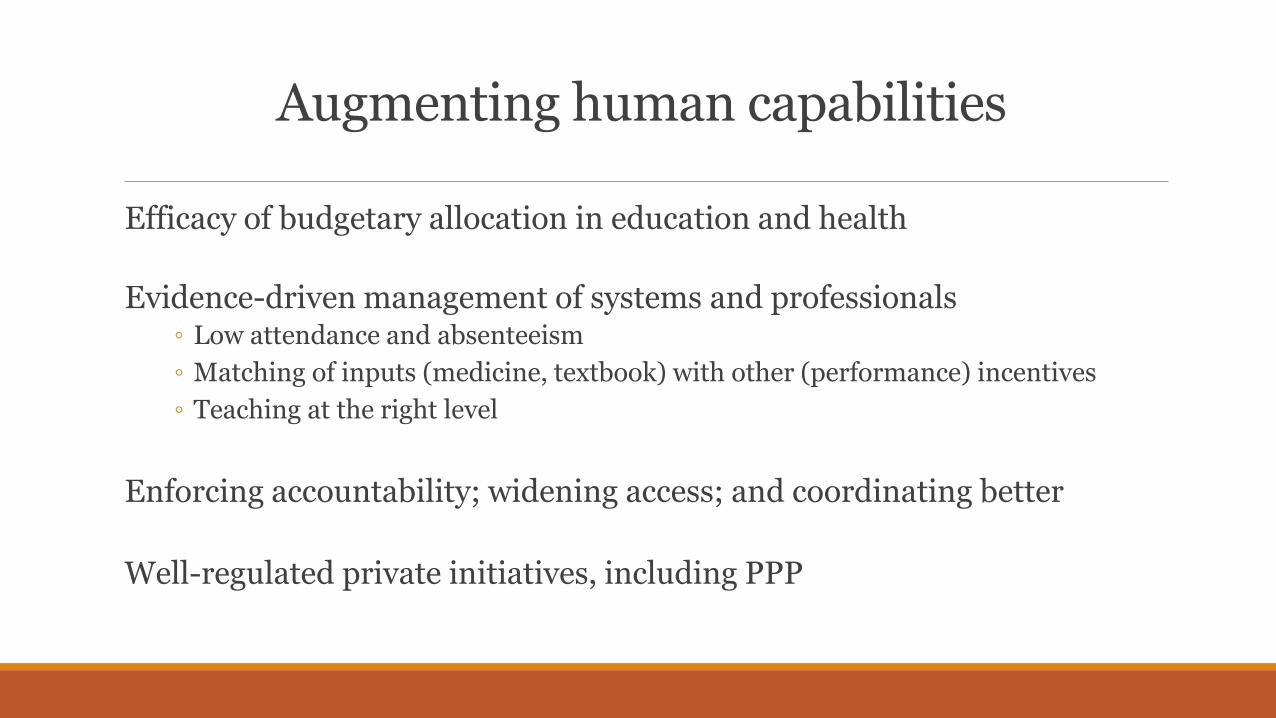
Augmenting human capabilities
Efficacy of budgetary allocation in education and health
Evidence-driven management of systems and professionals ◦ Low attendance and absenteeism
◦ Matching of inputs (medicine, textbook) with other (performance) incentives
◦ Teaching at the right level
Enforcing accountability; widening access; and coordinating better
Well-regulated private initiatives, including PPP
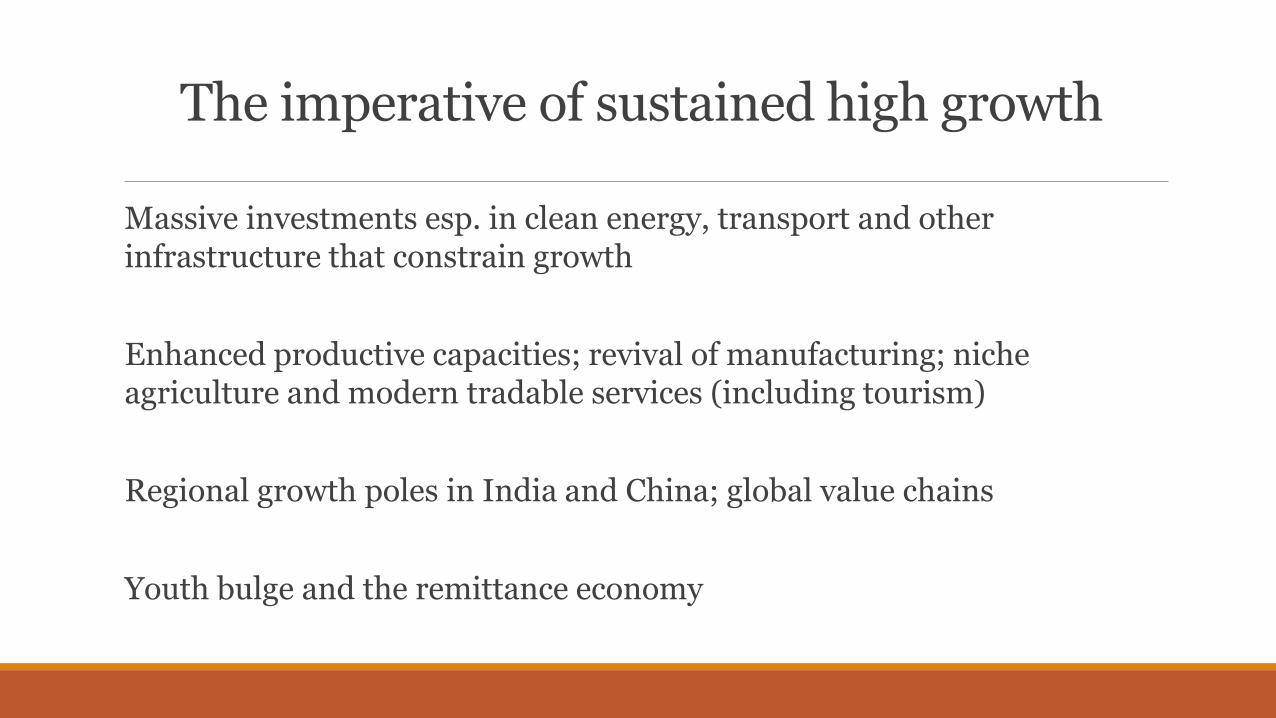
The imperative of sustained high growth
Massive investments esp. in clean energy, transport and other infrastructure that constrain growth
Enhanced productive capacities; revival of manufacturing; niche agriculture and modern tradable services (including tourism)
Regional growth poles in India and China; global value chains
Youth bulge and the remittance economy
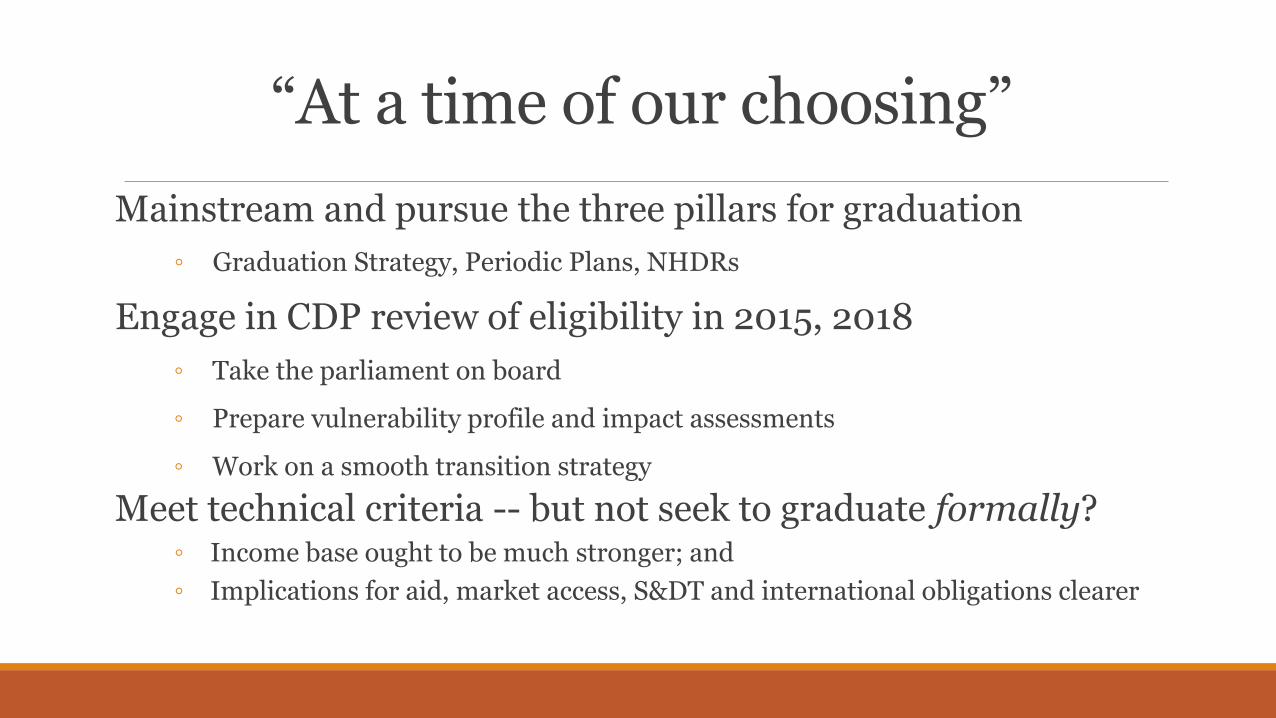
“At a time of our choosing”
Mainstream and pursue the three pillars for graduation
◦ Graduation Strategy, Periodic Plans, NHDRs
Engage in CDP review of eligibility in 2015, 2018
◦ Take the parliament on board
◦ Prepare vulnerability profile and impact assessments
◦ Work on a smooth transition strategy
Meet technical criteria -- but not seek to graduate formally? ◦ Income base ought to be much stronger; and
◦ Implications for aid, market access, S&DT and international obligations clearer
The End


