TABLE OF CONTENTS INTRODUCTION ..................................................................................................................................................... 4
BACKGROUND ............................................................................................................................................................... 4 CHART: DISTRIBUTION OF OWNERSHIP TYPE IN NY: 2003 – 2017 ......................................................................................... 4 PURPOSE OF REPORT ...................................................................................................................................................... 6 NOTES ON THE DATA ...................................................................................................................................................... 6
THE NURSING HOME INDUSTRY IN NEW YORK ...................................................................................................... 6
OBSERVATIONS .............................................................................................................................................................. 7 TABLE: DETAILED OWNERSHIP TYPES ................................................................................................................................. 7 CHART: OWNERSHIP TYPE & HEALTH INSPECTION RATINGS.................................................................................................... 8
AVERAGE TOTAL STAFFING HOURS PER RESIDENT PER DAY .................................................................................. 9
BACKGROUND ............................................................................................................................................................... 9 OBSERVATIONS ............................................................................................................................................................ 10 IMPLICATIONS .............................................................................................................................................................. 10 CHART: OWNERSHIP TYPE VS. TOTAL CARE STAFFING HOURS PER RESIDENT PER DAY ............................................................... 10
AVERAGE RN HOURS PER RESIDENT PER DAY ...................................................................................................... 11
BACKGROUND ............................................................................................................................................................. 11 OBSERVATIONS ............................................................................................................................................................ 11 IMPLICATIONS .............................................................................................................................................................. 11 CHART: OWNERSHIP TYPE VS. RN CARE STAFFING HOURS PER RESIDENT PER DAY ................................................................... 12
BACKGROUND ............................................................................................................................................................. 14 OBSERVATIONS ............................................................................................................................................................ 14 IMPLICATIONS .............................................................................................................................................................. 14 CHART: OWNERSHIP TYPE VS. RESIDENTS’ PRESSURE ULCER RATES ....................................................................................... 15
HEALTH INSPECTION RATING ............................................................................................................................... 15
BACKGROUND ............................................................................................................................................................. 15 OBSERVATIONS ............................................................................................................................................................ 16 IMPLICATIONS .............................................................................................................................................................. 16 CHART: OWNERSHIP TYPE VS. HEALTH INSPECTION RATINGS ................................................................................................ 16
NUMBER OF SUBSTANTIATED COMPLAINTS ........................................................................................................ 17
BACKGROUND ............................................................................................................................................................. 17 OBSERVATIONS ............................................................................................................................................................ 18 IMPLICATIONS .............................................................................................................................................................. 18 CHART: OWNERSHIP TYPE VS. NUMBER OF SUBSTANTIATED COMPLAINTS .............................................................................. 18
P a g e | 3
AVERAGE NUMBER OF FINES AND AVERAGE DOLLAR AMOUNT .......................................................................... 19
BACKGROUND ............................................................................................................................................................. 19 OBSERVATIONS ............................................................................................................................................................ 19 IMPLICATIONS .............................................................................................................................................................. 19 CHART: OWNERSHIP TYPE VS. NUMBER OF FINES ............................................................................................................... 20 CHART: OWNERSHIP TYPE VS. TOTAL AMOUNT OF FINES N DOLLARS ..................................................................................... 21
CONCLUSIONS AND RECOMMENDATIONS ........................................................................................................... 22
APPENDIX I: RESOURCES FOR MORE INFORMATION ........................................................................................... 23
APPENDIX II: ADDITIONAL NOTES ON DATA USED ............................................................................................... 23
Note: This report is a compliment to another report entitled An Assessment of the Impact of Low Staffing Levels on Quality of Nursing Home Care in New York.
Visit our homepage, www.nursinghome411.org, for quarterly staffing data for all U.S. nursing homes, other facility and state-level data on quality and oversight, and free resources on residents’ rights and quality standards.
INTRODUCTION BACKGROUND Approximately half of older adults will need nursing home care at some point. Thus, the quality and safety of nursing homes is a matter of significant concern to virtually every family in New York and nationwide. With many billions of taxpayer dollars paid to nursing homes every year, in New York alone, the efficient and appropriate use of these funds is also a matter of great public interest. Nevertheless, the persistence of abuse, neglect, and substandard care is a longstanding problem in every area of the state.
Numerous studies over the years have sought to address the differences in quality and staffing between non-profit nursing homes and those run for-profit. While there are “good” and “bad” facilities across ownership types, overall, non-profit nursing homes, including those that are government owned, tend to have higher staffing levels and put more resources into resident care.1
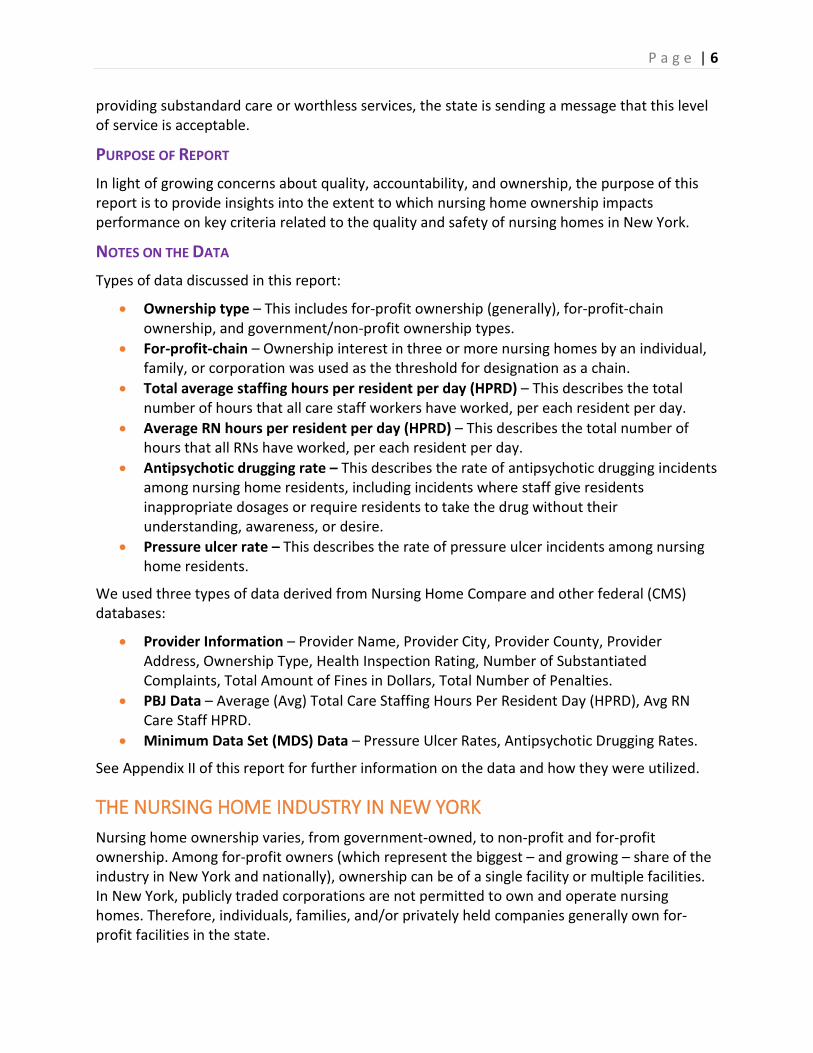
Despite persistent complaints by nursing home industry lobbyists that nursing homes lose money or operate on “razor thin” margins, the for-profit sector of the industry has steadily grown over time, with non-profit organizations and municipalities selling out to private, for-profit firms across New York and the rest of the country. As the following chart indicates, over the last 15 years, for-profit nursing home ownership in New York has grown from under a 50% share of the market to over 60%.
CHART: DISTRIBUTION OF OWNERSHIP TYPE IN NY: 2003 – 2017
1 See Appendix I for selected articles on nursing home ownership.
P a g e | 5
The growth of for-profit nursing homes, as well as the persistence of serious problems within the industry, has raised concerns about how these nursing homes are operating. Most notably, whether for-profit nursing homes are providing sufficient staffing and other resources necessary to ensure that residents receive the quality of care and quality of life services to which they are entitled under federal and state law.
Sadly, numerous reports have found that nursing homes too often fail in their duty to provide appropriate care, including ensuring that residents are free from abuse and neglect. These reports include:
1. The New York Times, “At Many Homes, More Profit and Less Nursing;” 2
2. The Buffalo News, “After nursing home stay, bedsores lead to man's agonizing death;”3 3. Kaiser Health News, “Care Suffers As More Nursing Homes Feed Money Into Corporate
Webs;”4 4. The Rochester Democrat & Chronicle, “At some nursing homes, deficiencies repeat over
and over;”5 5. Syracuse.com, “Feds fine Oswego nursing home $21K, threaten to block new
admissions;”6 and 6. Times Herald-Record, “Goshen nursing home unsafe, lawsuit says.”7
While the nursing home standards are strong, in the absence of vigorous enforcement by federal and state agencies, decent resident care may ultimately depend on the goodwill of individual providers. In other words, when nursing homes do not face a financial penalty for
2 Duhigg, C, “At Many Homes, More Profit and Less Nursing,” The New York Times (September 23, 2007). Available at https://www.nytimes.com/2007/09/23/business/23nursing.html. 3 Michel, L, “After nursing home stay, bedsores lead to man's agonizing death,” The Buffalo News (January 13, 2019). Available at https://buffalonews.com/2019/01/13/frank-williams-safire-rehabilitation-tonawanda-nursing-home/. Note: This is one in a series of articles on nursing home care in Western New York, several of which highlight the concerns raised by for-profit chains purchasing nursing homes in the area and making operational changes that adversely affect resident safety and dignity. 4 Rau, J, “Care Suffers As More Nursing Homes Feed Money Into Corporate Webs,” Kaiser Health News (December 31, 2017). Available at https://khn.org/news/care-suffers-as-more-nursing-homes-feed-money-into-corporate-webs/. 5 Singer, P and Lahman, S, “At some nursing homes, deficiencies repeat over and over,” The Democrat and Chronicle (March 31, 2016). Available at https://www.democratandchronicle.com/story/news/2016/03/31/monroe-county-nursing-home-repeat-deficiencies-investigation/82116406/. 6 Mulder, J, “Feds fine Oswego nursing home $21K, threaten to block new admissions,” Syracuse.com (June 19, 2019). Available at https://www.syracuse.com/health/2019/06/feds-fine-oswego-nursing-home-21k-threaten-to-block-new-admissions.html. 7 Axelrod, D, “Goshen nursing home unsafe, lawsuit says,” Times Herald-Record (August 1, 2018). Available at https://www.recordonline.com/news/20180801/goshen-nursing-home-unsafe-lawsuit-says.
When nursing homes do not face a financial penalty for providing substandard care or worthless services, the state is sending a message that this level of service is acceptable.
providing substandard care or worthless services, the state is sending a message that this level of service is acceptable.
PURPOSE OF REPORT In light of growing concerns about quality, accountability, and ownership, the purpose of this report is to provide insights into the extent to which nursing home ownership impacts performance on key criteria related to the quality and safety of nursing homes in New York.
NOTES ON THE DATA Types of data discussed in this report:
• Ownership type – This includes for-profit ownership (generally), for-profit-chain ownership, and government/non-profit ownership types.
• For-profit-chain – Ownership interest in three or more nursing homes by an individual, family, or corporation was used as the threshold for designation as a chain.
• Total average staffing hours per resident per day (HPRD) – This describes the total number of hours that all care staff workers have worked, per each resident per day.
• Average RN hours per resident per day (HPRD) – This describes the total number of hours that all RNs have worked, per each resident per day.
• Antipsychotic drugging rate – This describes the rate of antipsychotic drugging incidents among nursing home residents, including incidents where staff give residents inappropriate dosages or require residents to take the drug without their understanding, awareness, or desire.
• Pressure ulcer rate – This describes the rate of pressure ulcer incidents among nursing home residents.
We used three types of data derived from Nursing Home Compare and other federal (CMS) databases:
• Provider Information – Provider Name, Provider City, Provider County, Provider Address, Ownership Type, Health Inspection Rating, Number of Substantiated Complaints, Total Amount of Fines in Dollars, Total Number of Penalties.
• PBJ Data – Average (Avg) Total Care Staffing Hours Per Resident Day (HPRD), Avg RN Care Staff HPRD.
• Minimum Data Set (MDS) Data – Pressure Ulcer Rates, Antipsychotic Drugging Rates.
See Appendix II of this report for further information on the data and how they were utilized.
THE NURSING HOME INDUSTRY IN NEW YORK Nursing home ownership varies, from government-owned, to non-profit and for-profit ownership. Among for-profit owners (which represent the biggest – and growing – share of the industry in New York and nationally), ownership can be of a single facility or multiple facilities. In New York, publicly traded corporations are not permitted to own and operate nursing homes. Therefore, individuals, families, and/or privately held companies generally own for-profit facilities in the state.
P a g e | 7
Note: In this section we provide information on and discuss facilities based on detailed ownership type as identified on Nursing Home Compare. However, in the rest of the report, we consolidate ownership types into three categories: for-profit chain, for-profit (all), and non-profit/government-owned. The purpose of this consolidation is to focus on the issues about which we are concerned: the extent to which (if any) for-profit ownership in general, and chain ownership in particular, impacts quality and safety for nursing home residents in New York.
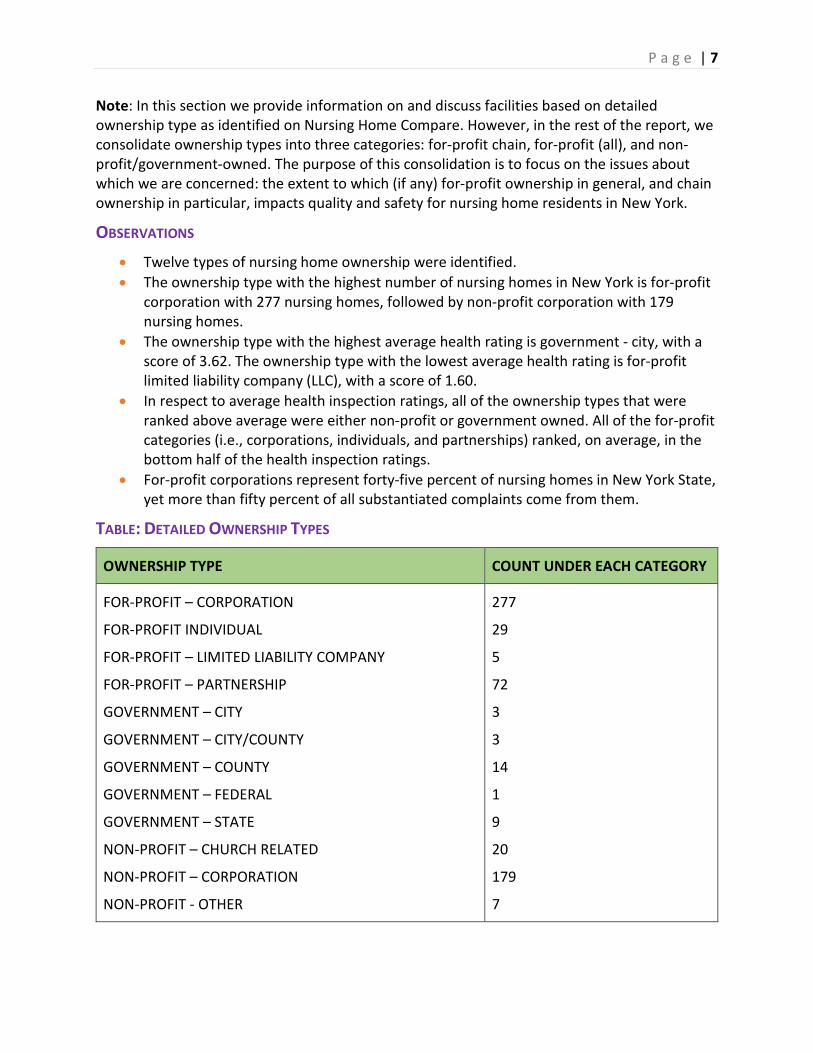
OBSERVATIONS • Twelve types of nursing home ownership were identified. • The ownership type with the highest number of nursing homes in New York is for-profit
corporation with 277 nursing homes, followed by non-profit corporation with 179 nursing homes.
• The ownership type with the highest average health rating is government - city, with a score of 3.62. The ownership type with the lowest average health rating is for-profit limited liability company (LLC), with a score of 1.60.
• In respect to average health inspection ratings, all of the ownership types that were ranked above average were either non-profit or government owned. All of the for-profit categories (i.e., corporations, individuals, and partnerships) ranked, on average, in the bottom half of the health inspection ratings.
• For-profit corporations represent forty-five percent of nursing homes in New York State, yet more than fifty percent of all substantiated complaints come from them.
TABLE: DETAILED OWNERSHIP TYPES
OWNERSHIP TYPE COUNT UNDER EACH CATEGORY
FOR-PROFIT – CORPORATION
FOR-PROFIT INDIVIDUAL
FOR-PROFIT – LIMITED LIABILITY COMPANY
FOR-PROFIT – PARTNERSHIP
GOVERNMENT – CITY
GOVERNMENT – CITY/COUNTY
GOVERNMENT – COUNTY
GOVERNMENT – FEDERAL
GOVERNMENT – STATE
NON-PROFIT – CHURCH RELATED
NON-PROFIT – CORPORATION
NON-PROFIT - OTHER
277
29
5
72
3
3
14
1
9
20
179
7
P a g e | 8
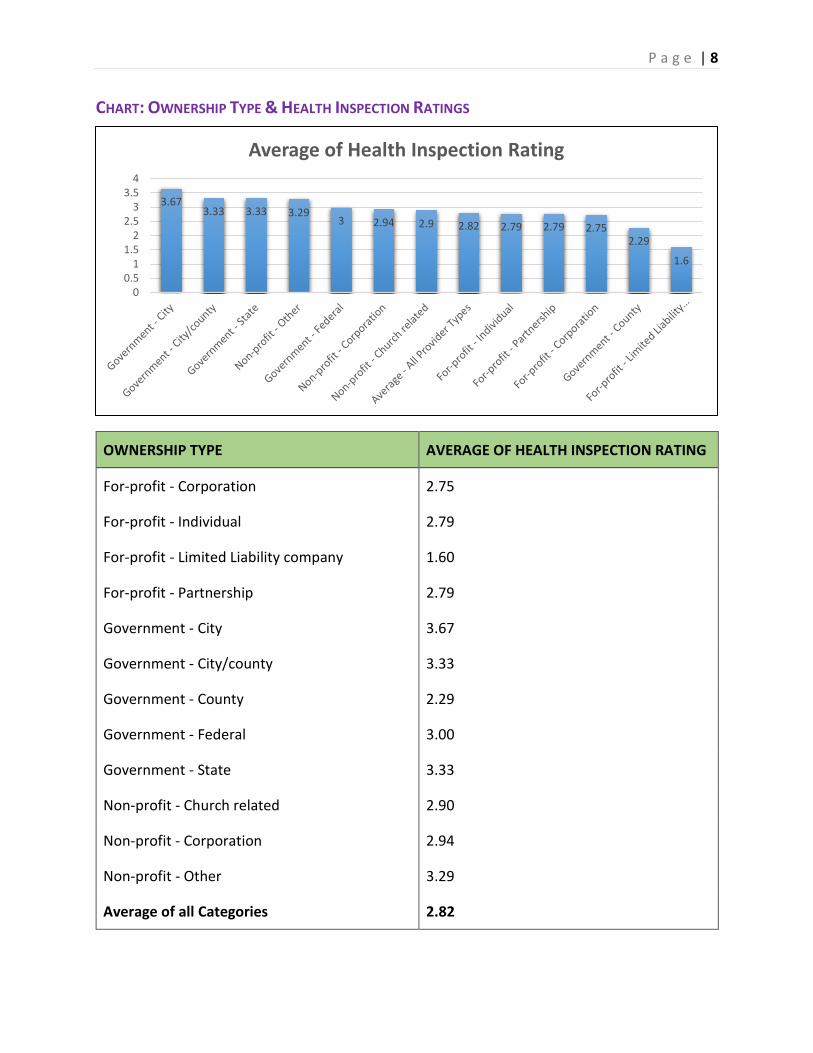
CHART: OWNERSHIP TYPE & HEALTH INSPECTION RATINGS
OWNERSHIP TYPE AVERAGE OF HEALTH INSPECTION RATING
For-profit - Corporation 2.75
For-profit - Individual 2.79
For-profit - Limited Liability company 1.60
For-profit - Partnership 2.79
Government - City 3.67
Government - City/county 3.33
Government - County 2.29
Government - Federal 3.00
Government - State 3.33
Non-profit - Church related 2.90
Non-profit - Corporation 2.94
Non-profit - Other 3.29
Average of all Categories 2.82
3.673.33 3.33 3.29
3 2.94 2.9 2.82 2.79 2.79 2.752.29
1.6
00.5
11.5
22.5
33.5
4
Average of Health Inspection Rating
P a g e | 9
AVERAGE TOTAL STAFFING HOURS PER RESIDENT PER DAY BACKGROUND Staffing is key to a nursing home’s quality and safety. Better staffing, in respect to both quantity and quality, has been shown to lead to higher quality of care for nursing home residents. Nursing homes with lower staffing, in particular registered nurses (RNs), tend to exhibit lower quality of nursing care.8
Because staffing is so important, robust staffing level data are needed in order to gain useful insights into the quality of a nursing home’s performance. Historically, information on staffing was collected only once a year from nursing homes, for the two-week period prior to their annual survey. Unfortunately, the veracity of these data were not verified by either state agencies or the federal agency, the Centers for Medicare & Medicaid Services (CMS).
In response to concerns about facilities inflating their reported staffing levels, the 2010 Affordable Care Act (ACA) required that nursing homes electronically report auditable, payroll-based journal (PBJ) data on staffing to CMS.9 These PBJ data include hours per resident per day (HPRD) for licensed and unlicensed care staff, numerous categories of non-direct care staff (such as administrators, medical directors, and activity staff), and MDS census information.10
Though the ACA became law in 2010, CMS did not take steps to implement the requirements for several years. CMS only began publicly reporting the facility-level data for direct care staff in 2017 and, in 2018, the agency added public reporting of non-care staff and contract staff (i.e., personnel who are not directly employed by the facility). According to CMS, “data collected electronically through the Payroll-Based Journal (PBJ) system . . . provides an unprecedented insight into the staffing of nursing homes.”11
For this analysis, average total care staffing hours per resident day (HPRD) were calculated for each nursing home by totaling the average RNs, LPNs, and CNAs that facilities reported were assigned to non-administrative tasks and dividing it by the average MDS census for the nursing home.
8 See our companion report to this brief, An Assessment of the Impact of Low Staffing Levels on Quality of Nursing Home Care in New York, for further details and a list of studies on staffing and the relationship between staffing and quality. Available at https://nursinghome411.org/nys-nursing-homes-2019/. 9 Staffing Data Submission PBJ, Centers for Medicare & Medicaid Services (CMS), December 7, 2018. Available at https://www.cms.gov/Medicare/Quality-Initiatives-Patient-Assessment-Instruments/NursingHomeQualityInits/Staffing-Data-Submission-PBJ.html. 10 See data file at https://nursinghome411.org/nys-nursing-homes-2019/. 11 CMS Improving Nursing Home Compare in April, CMS, March 5, 2019. Available at https://www.cms.gov/newsroom/press-releases/cms-improving-nursing-home-compare-april-2019.
Overall, for-profit nursing homes had the lowest average rate compared to the other ownership types.
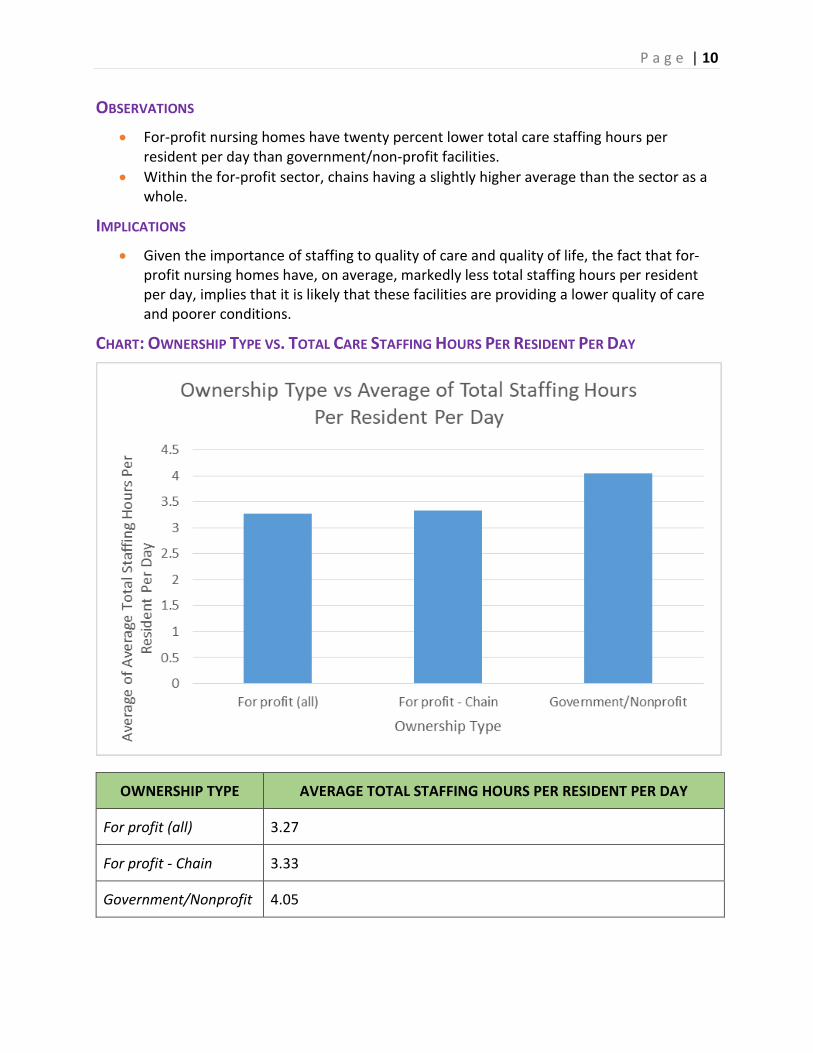
OBSERVATIONS • For-profit nursing homes have twenty percent lower total care staffing hours per
resident per day than government/non-profit facilities. • Within the for-profit sector, chains having a slightly higher average than the sector as a
whole.
IMPLICATIONS • Given the importance of staffing to quality of care and quality of life, the fact that for-
profit nursing homes have, on average, markedly less total staffing hours per resident per day, implies that it is likely that these facilities are providing a lower quality of care and poorer conditions.
CHART: OWNERSHIP TYPE VS. TOTAL CARE STAFFING HOURS PER RESIDENT PER DAY
OWNERSHIP TYPE AVERAGE TOTAL STAFFING HOURS PER RESIDENT PER DAY
For profit (all) 3.27
For profit - Chain 3.33
Government/Nonprofit 4.05
P a g e | 11
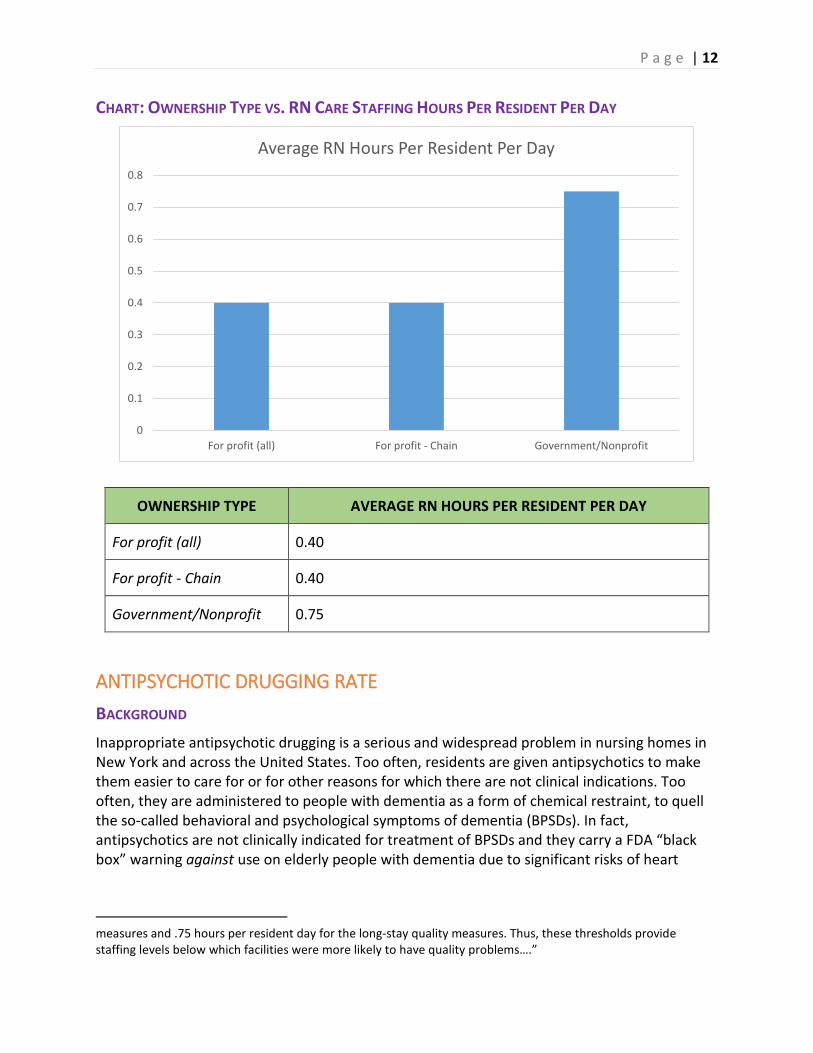
AVERAGE RN HOURS PER RESIDENT PER DAY BACKGROUND Registered nurses (RNs) play a critical role in the quality and safety of a nursing home. While nursing homes are required to have “sufficient” care staff 24-hours a day, every day of the year, to ensure that residents receive care to meet their clinical and psycho-social needs, RNs are the only category of care staff for which there is a set minimum numerical number: facilities must have at least one RN working a full-time shift every day (including weekends and holidays). Furthermore, though New York is now one of the minority of states not to have passed a safe staffing law, it does require that facilities have a licensed nurse (RN or LPN) 24/7.
The federal Payroll-Based Journal (PBJ) staff reporting system requires that nursing homes “report hours paid for services performed onsite for the residents of the facility.”12 In this system, nursing homes must separately report RNs that are assigned to administrative tasks and those involved in resident care. This distinction is crucial since, from a consumer perspective, it is the care and monitoring provided by an RN that matters, not whether or not a facility employs an RN in (for example) back office operations.
Average RN hours per resident day (HPRD) were calculated by dividing the total average RN care staff hours of a nursing home by its average MDS census.
OBSERVATIONS • Government/non-profit nursing homes provide, on average, close to twice as much RN
care staffing as for-profit facilities.
• For-profit-chain nursing homes have the same average as all for-profit facilities.
IMPLICATIONS • Given the critical role that RNs play in resident care and safety, the significantly lower
RN staffing levels (on average) in for-profit facilities implies that safety and care are likely to be lower in those facilities as well.
• While New York’s nursing homes, as a whole, tend to be among the lowest in the nation (bottom quintile) in terms of staffing, these data indicate that the staffing for for-profit facilities in particular is significantly below that which federal studies have identified as necessary to meet just the basic clinical needs of residents.13
12 Electronic Staffing Data Submission Payroll-Based Journal (PBJ) Frequently Asked Questions, https://www.cms.gov/Medicare/Quality-Initiatives-Patient-Assessment-Instruments/NursingHomeQualityInits/Downloads/PBJ-Policy-Manual-FAQ-09-26-17.pdf. 13 See, for example, Appropriateness of Minimum Nurse Staffing Ratios in Nursing Homes, Report To Congress: Phase II Final, December 2001. The report notes that “…RN thresholds were at .55 for the short-stay quality
Government/non-profit nursing homes provide, on average, close to twice as much RN care staffing as for-profit facilities.
CHART: OWNERSHIP TYPE VS. RN CARE STAFFING HOURS PER RESIDENT PER DAY
ANTIPSYCHOTIC DRUGGING RATE BACKGROUND Inappropriate antipsychotic drugging is a serious and widespread problem in nursing homes in New York and across the United States. Too often, residents are given antipsychotics to make them easier to care for or for other reasons for which there are not clinical indications. Too often, they are administered to people with dementia as a form of chemical restraint, to quell the so-called behavioral and psychological symptoms of dementia (BPSDs). In fact, antipsychotics are not clinically indicated for treatment of BPSDs and they carry a FDA “black box” warning against use on elderly people with dementia due to significant risks of heart
measures and .75 hours per resident day for the long-stay quality measures. Thus, these thresholds provide staffing levels below which facilities were more likely to have quality problems….”
0
0.1
0.2
0.3
0.4
0.5
0.6
0.7
0.8
For profit (all) For profit - Chain Government/Nonprofit
Average RN Hours Per Resident Per Day
OWNERSHIP TYPE AVERAGE RN HOURS PER RESIDENT PER DAY
For profit (all) 0.40
For profit - Chain 0.40
Government/Nonprofit 0.75
P a g e | 13
attack, stroke, Parkinsonism, and other negative outcomes. The extent to which antipsychotic drugs are used is, thus, an important indicator of the quality of care in a nursing home.
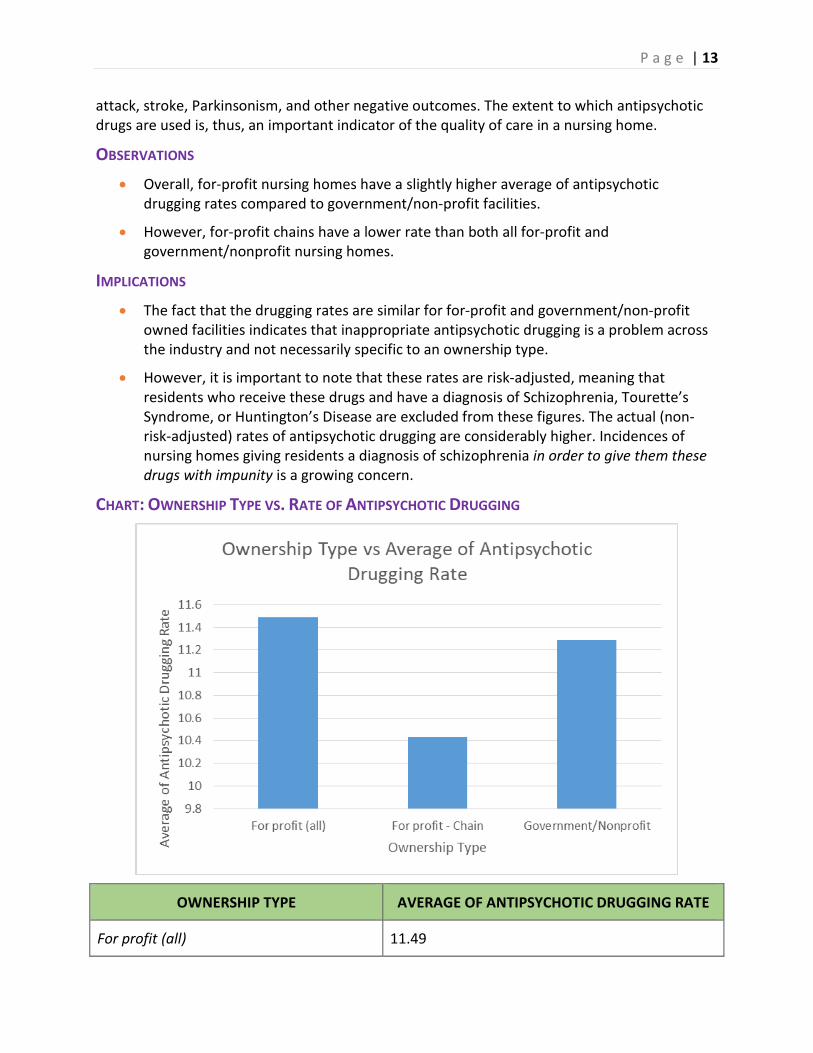
OBSERVATIONS • Overall, for-profit nursing homes have a slightly higher average of antipsychotic
drugging rates compared to government/non-profit facilities.
• However, for-profit chains have a lower rate than both all for-profit and government/nonprofit nursing homes.
IMPLICATIONS • The fact that the drugging rates are similar for for-profit and government/non-profit
owned facilities indicates that inappropriate antipsychotic drugging is a problem across the industry and not necessarily specific to an ownership type.
• However, it is important to note that these rates are risk-adjusted, meaning that residents who receive these drugs and have a diagnosis of Schizophrenia, Tourette’s Syndrome, or Huntington’s Disease are excluded from these figures. The actual (non-risk-adjusted) rates of antipsychotic drugging are considerably higher. Incidences of nursing homes giving residents a diagnosis of schizophrenia in order to give them these drugs with impunity is a growing concern.
CHART: OWNERSHIP TYPE VS. RATE OF ANTIPSYCHOTIC DRUGGING
OWNERSHIP TYPE AVERAGE OF ANTIPSYCHOTIC DRUGGING RATE
For profit (all) 11.49
P a g e | 14
For profit - Chain 10.43
Government/Nonprofit 11.29
PRESSURE ULCER RATE BACKGROUND According to the Centers for Disease Control and Prevention,
Pressure ulcers, also known as bed sores, pressure sores, or decubitus ulcers, are wounds caused by unrelieved pressure on the skin. They usually develop over bony prominences, such as the elbow, heel, hip, shoulder, back, and back of the head. Pressure ulcers are serious medical conditions and one of the important measures of the quality of clinical care in nursing homes.14
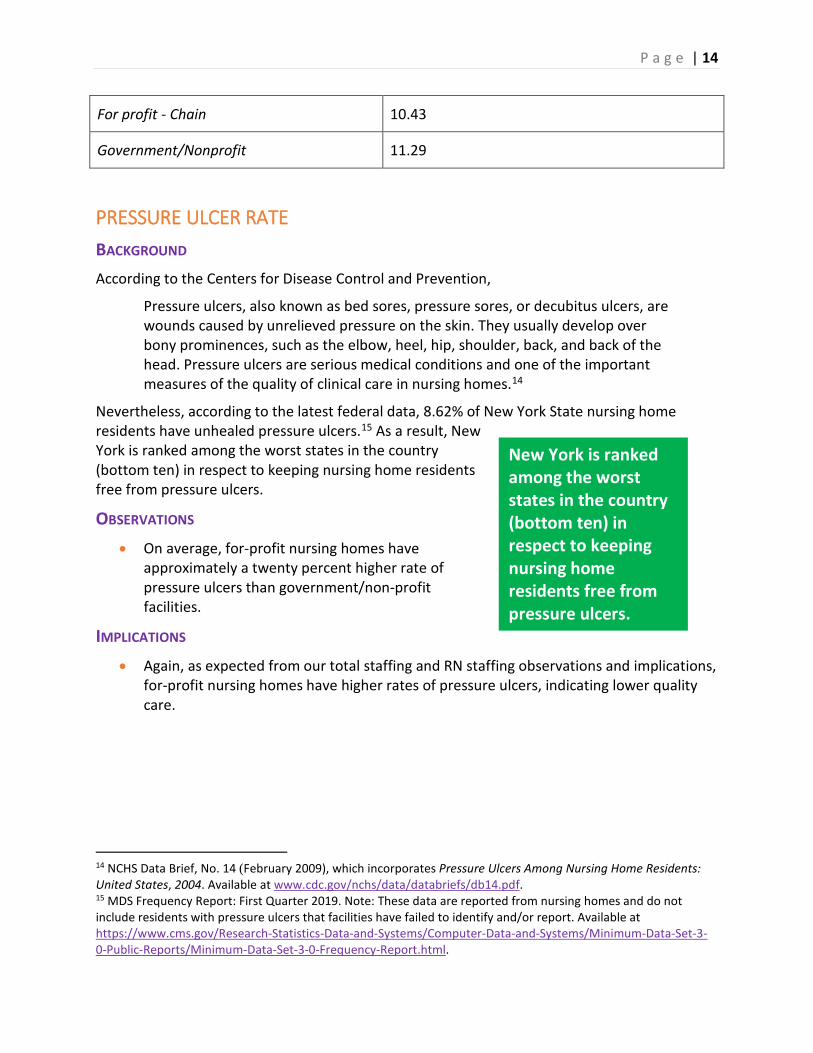
Nevertheless, according to the latest federal data, 8.62% of New York State nursing home residents have unhealed pressure ulcers.15 As a result, New York is ranked among the worst states in the country (bottom ten) in respect to keeping nursing home residents free from pressure ulcers.
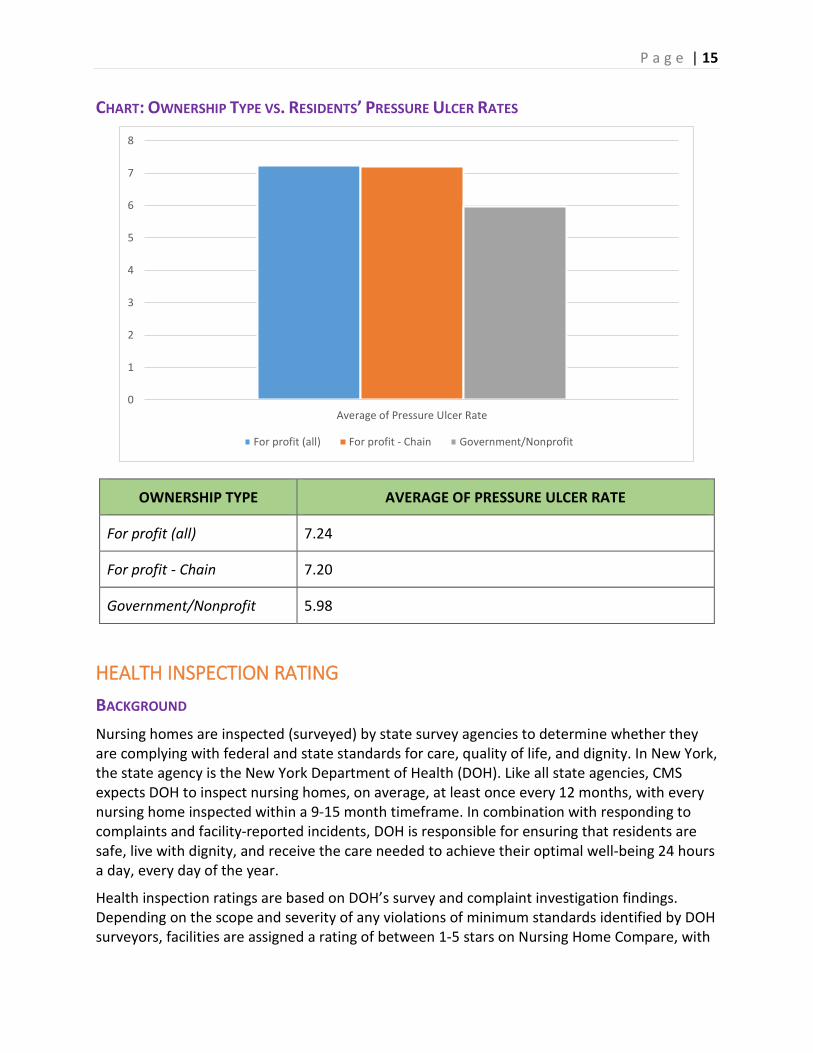
OBSERVATIONS • On average, for-profit nursing homes have
approximately a twenty percent higher rate of pressure ulcers than government/non-profit facilities.
IMPLICATIONS • Again, as expected from our total staffing and RN staffing observations and implications,
for-profit nursing homes have higher rates of pressure ulcers, indicating lower quality care.
14 NCHS Data Brief, No. 14 (February 2009), which incorporates Pressure Ulcers Among Nursing Home Residents: United States, 2004. Available at www.cdc.gov/nchs/data/databriefs/db14.pdf. 15 MDS Frequency Report: First Quarter 2019. Note: These data are reported from nursing homes and do not include residents with pressure ulcers that facilities have failed to identify and/or report. Available at https://www.cms.gov/Research-Statistics-Data-and-Systems/Computer-Data-and-Systems/Minimum-Data-Set-3-0-Public-Reports/Minimum-Data-Set-3-0-Frequency-Report.html.
New York is ranked among the worst states in the country (bottom ten) in respect to keeping nursing home residents free from pressure ulcers.
CHART: OWNERSHIP TYPE VS. RESIDENTS’ PRESSURE ULCER RATES
OWNERSHIP TYPE AVERAGE OF PRESSURE ULCER RATE
For profit (all) 7.24
For profit - Chain 7.20
Government/Nonprofit 5.98
HEALTH INSPECTION RATING BACKGROUND Nursing homes are inspected (surveyed) by state survey agencies to determine whether they are complying with federal and state standards for care, quality of life, and dignity. In New York, the state agency is the New York Department of Health (DOH). Like all state agencies, CMS expects DOH to inspect nursing homes, on average, at least once every 12 months, with every nursing home inspected within a 9-15 month timeframe. In combination with responding to complaints and facility-reported incidents, DOH is responsible for ensuring that residents are safe, live with dignity, and receive the care needed to achieve their optimal well-being 24 hours a day, every day of the year.
Health inspection ratings are based on DOH’s survey and complaint investigation findings. Depending on the scope and severity of any violations of minimum standards identified by DOH surveyors, facilities are assigned a rating of between 1-5 stars on Nursing Home Compare, with
0
1
2
3
4
5
6
7
8
Average of Pressure Ulcer Rate
For profit (all) For profit - Chain Government/Nonprofit
P a g e | 16
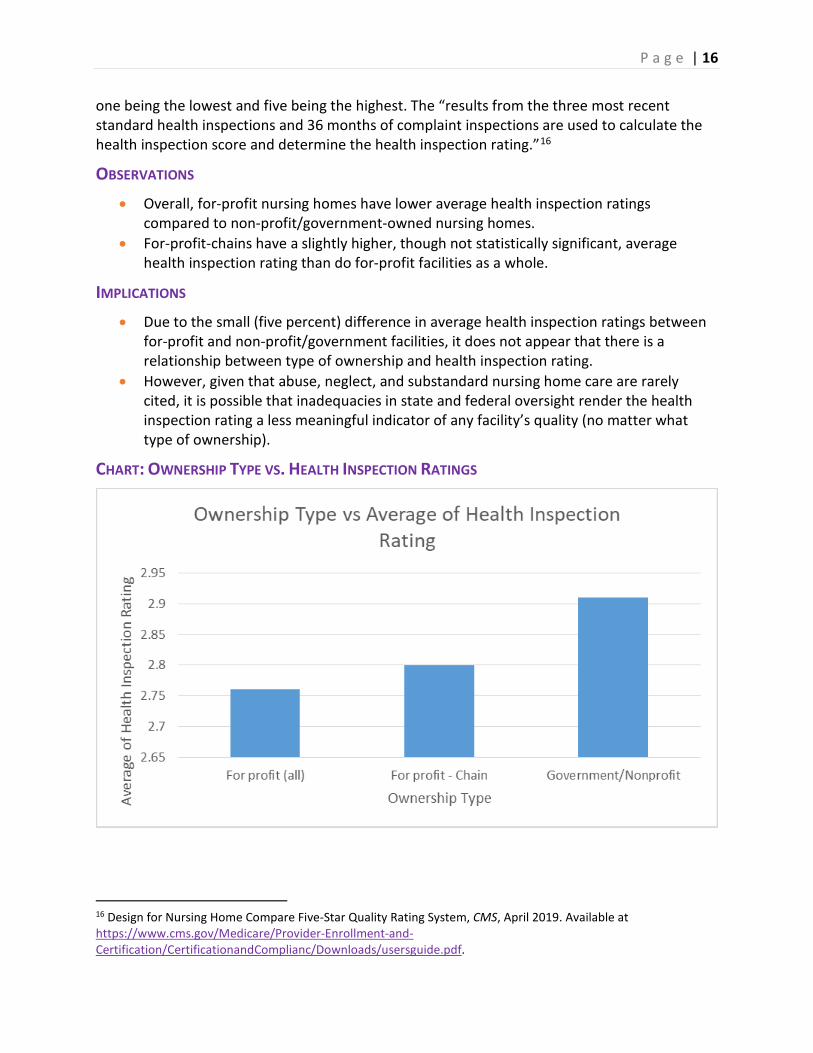
one being the lowest and five being the highest. The “results from the three most recent standard health inspections and 36 months of complaint inspections are used to calculate the health inspection score and determine the health inspection rating.”16
OBSERVATIONS • Overall, for-profit nursing homes have lower average health inspection ratings
compared to non-profit/government-owned nursing homes. • For-profit-chains have a slightly higher, though not statistically significant, average
health inspection rating than do for-profit facilities as a whole.
IMPLICATIONS • Due to the small (five percent) difference in average health inspection ratings between
for-profit and non-profit/government facilities, it does not appear that there is a relationship between type of ownership and health inspection rating.
• However, given that abuse, neglect, and substandard nursing home care are rarely cited, it is possible that inadequacies in state and federal oversight render the health inspection rating a less meaningful indicator of any facility’s quality (no matter what type of ownership).
CHART: OWNERSHIP TYPE VS. HEALTH INSPECTION RATINGS
16 Design for Nursing Home Compare Five-Star Quality Rating System, CMS, April 2019. Available at https://www.cms.gov/Medicare/Provider-Enrollment-and-Certification/CertificationandComplianc/Downloads/usersguide.pdf.
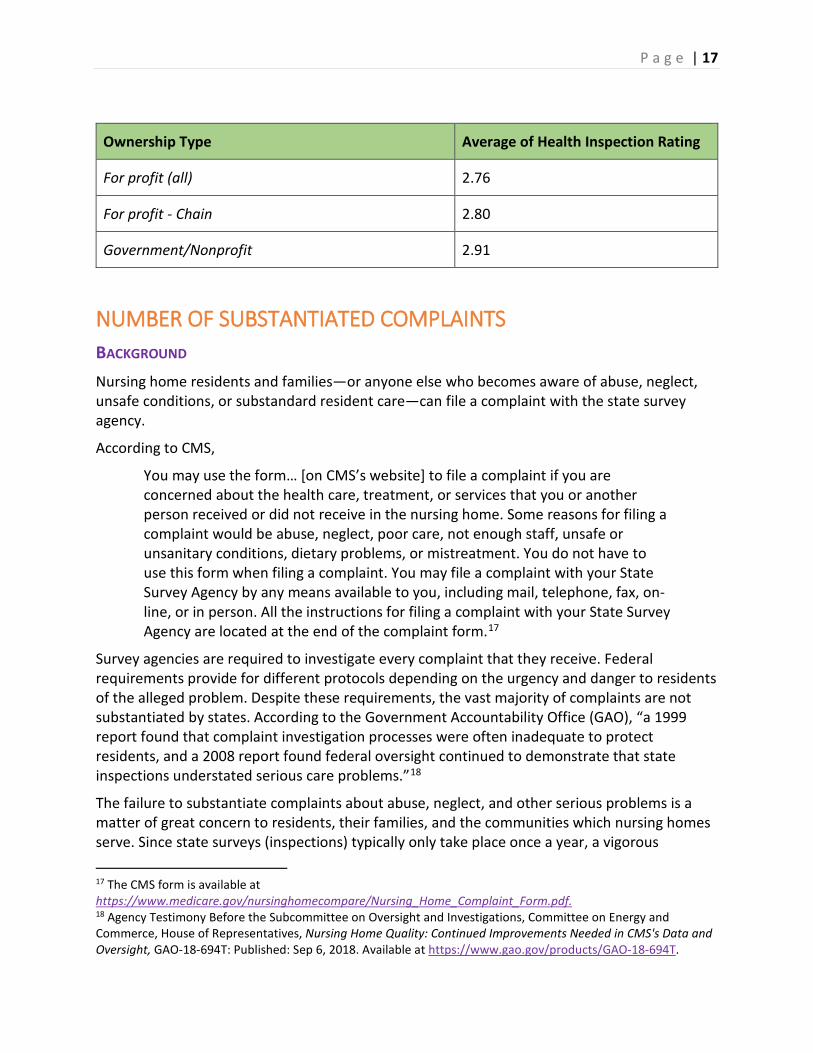
Ownership Type Average of Health Inspection Rating
For profit (all) 2.76
For profit - Chain 2.80
Government/Nonprofit 2.91
NUMBER OF SUBSTANTIATED COMPLAINTS BACKGROUND Nursing home residents and families—or anyone else who becomes aware of abuse, neglect, unsafe conditions, or substandard resident care—can file a complaint with the state survey agency.
According to CMS,
You may use the form… [on CMS’s website] to file a complaint if you are concerned about the health care, treatment, or services that you or another person received or did not receive in the nursing home. Some reasons for filing a complaint would be abuse, neglect, poor care, not enough staff, unsafe or unsanitary conditions, dietary problems, or mistreatment. You do not have to use this form when filing a complaint. You may file a complaint with your State Survey Agency by any means available to you, including mail, telephone, fax, on-line, or in person. All the instructions for filing a complaint with your State Survey Agency are located at the end of the complaint form.17
Survey agencies are required to investigate every complaint that they receive. Federal requirements provide for different protocols depending on the urgency and danger to residents of the alleged problem. Despite these requirements, the vast majority of complaints are not substantiated by states. According to the Government Accountability Office (GAO), “a 1999 report found that complaint investigation processes were often inadequate to protect residents, and a 2008 report found federal oversight continued to demonstrate that state inspections understated serious care problems.”18
The failure to substantiate complaints about abuse, neglect, and other serious problems is a matter of great concern to residents, their families, and the communities which nursing homes serve. Since state surveys (inspections) typically only take place once a year, a vigorous 17 The CMS form is available at https://www.medicare.gov/nursinghomecompare/Nursing_Home_Complaint_Form.pdf. 18 Agency Testimony Before the Subcommittee on Oversight and Investigations, Committee on Energy and Commerce, House of Representatives, Nursing Home Quality: Continued Improvements Needed in CMS's Data and Oversight, GAO-18-694T: Published: Sep 6, 2018. Available at https://www.gao.gov/products/GAO-18-694T.
response to complaints is necessary to ensure that residents are safe—and public funds are used appropriately—the other 51 weeks of the year.
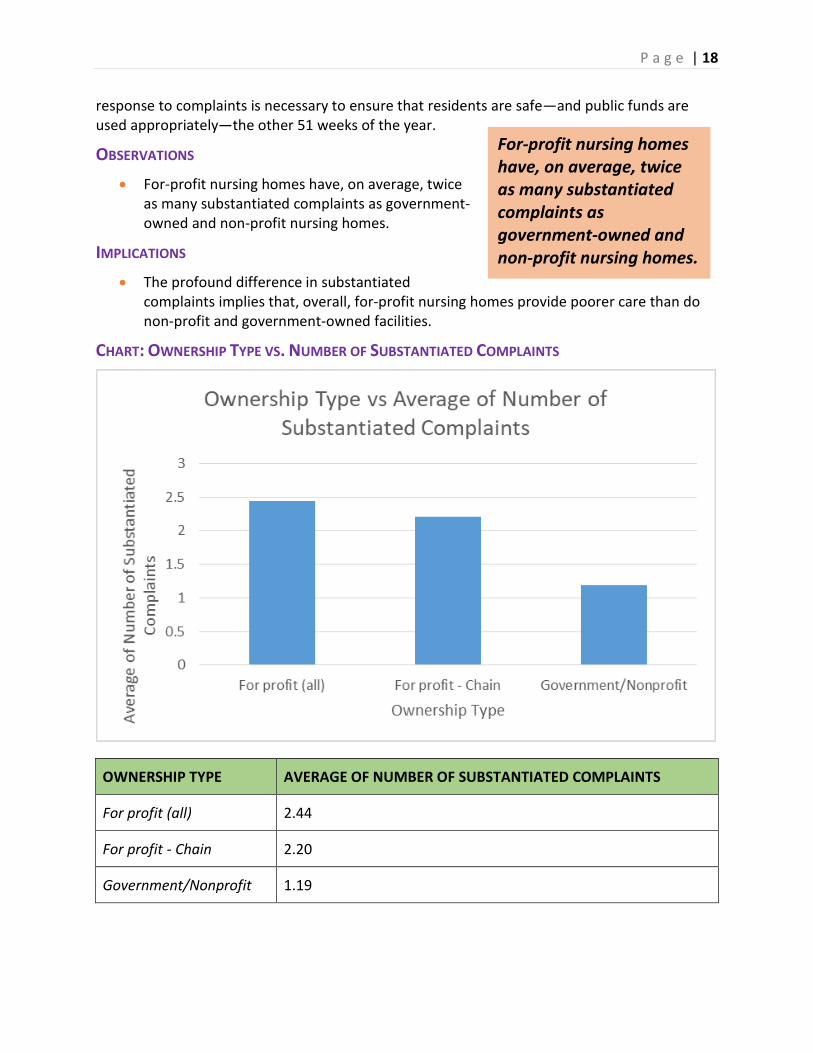
OBSERVATIONS • For-profit nursing homes have, on average, twice
as many substantiated complaints as government-owned and non-profit nursing homes.
IMPLICATIONS • The profound difference in substantiated
complaints implies that, overall, for-profit nursing homes provide poorer care than do non-profit and government-owned facilities.
CHART: OWNERSHIP TYPE VS. NUMBER OF SUBSTANTIATED COMPLAINTS
OWNERSHIP TYPE AVERAGE OF NUMBER OF SUBSTANTIATED COMPLAINTS
For profit (all) 2.44
For profit - Chain 2.20
Government/Nonprofit 1.19
For-profit nursing homes have, on average, twice as many substantiated complaints as government-owned and non-profit nursing homes.
P a g e | 19
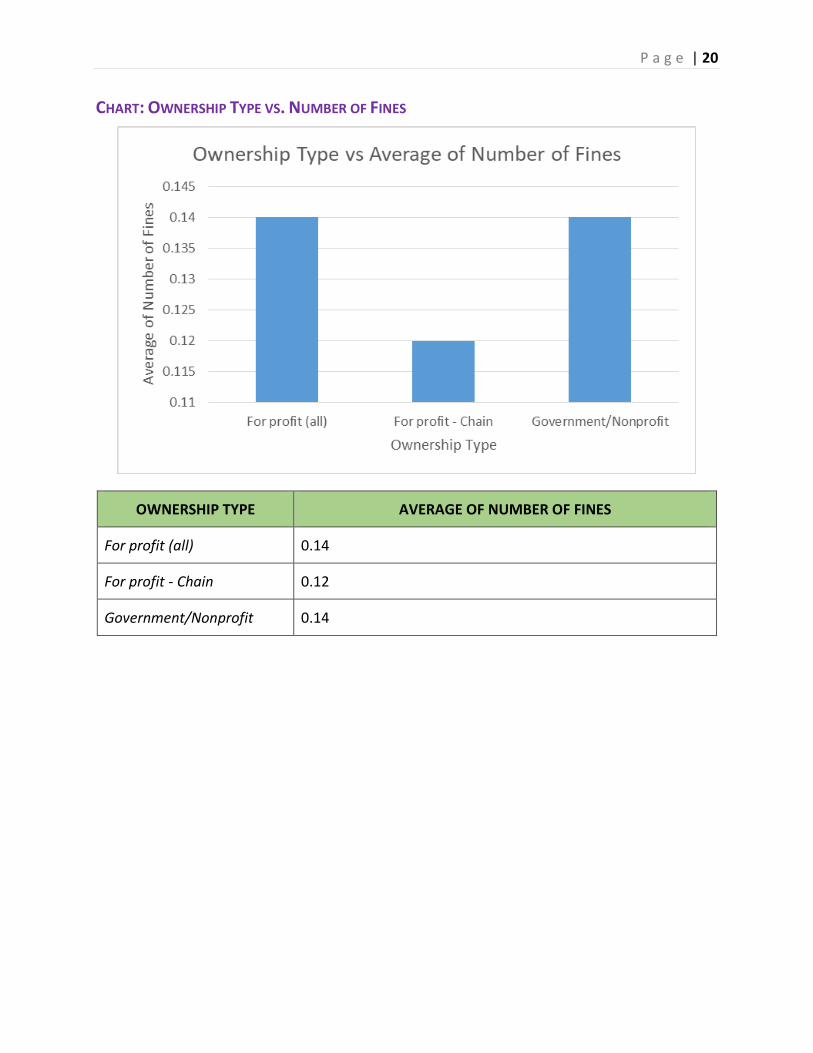
AVERAGE NUMBER OF FINES AND AVERAGE DOLLAR AMOUNT BACKGROUND There are numerous ways in which a nursing home can be penalized when abuse, neglect, or other violations of minimum care standards are identified and substantiated by CMS and/or the Department of Health. From a consumer perspective, the imposition of fines (known as Civil Money Penalties (CMPs)), is perhaps the most important type of penalty because, when used effectively, fines send a message to the nursing home (and others in the industry) that there is a cost to harming residents or failing to provide care that meets minimum standards. Conversely, when fines are not imposed for abuse, neglect, or failures of care, it sends a message to nursing homes that these problems are “okay.”
Though CMS recognizes the importance of fines to ensuring quality care and safety (for example, fines are one of the two penalties that CMS publicly reports on its website19), fines are infrequently imposed against nursing homes in our country. In New York, the imposition of fines when a facility violates minimum standards is particularly low.20 In addition, fines are getting lower because of changes implemented by CMS after the nursing home industry lobbied for lower fines and standards.21
OBSERVATIONS • Number of fines. Overall, for-profit and
government/non-profit nursing homes have the same average number of fines.
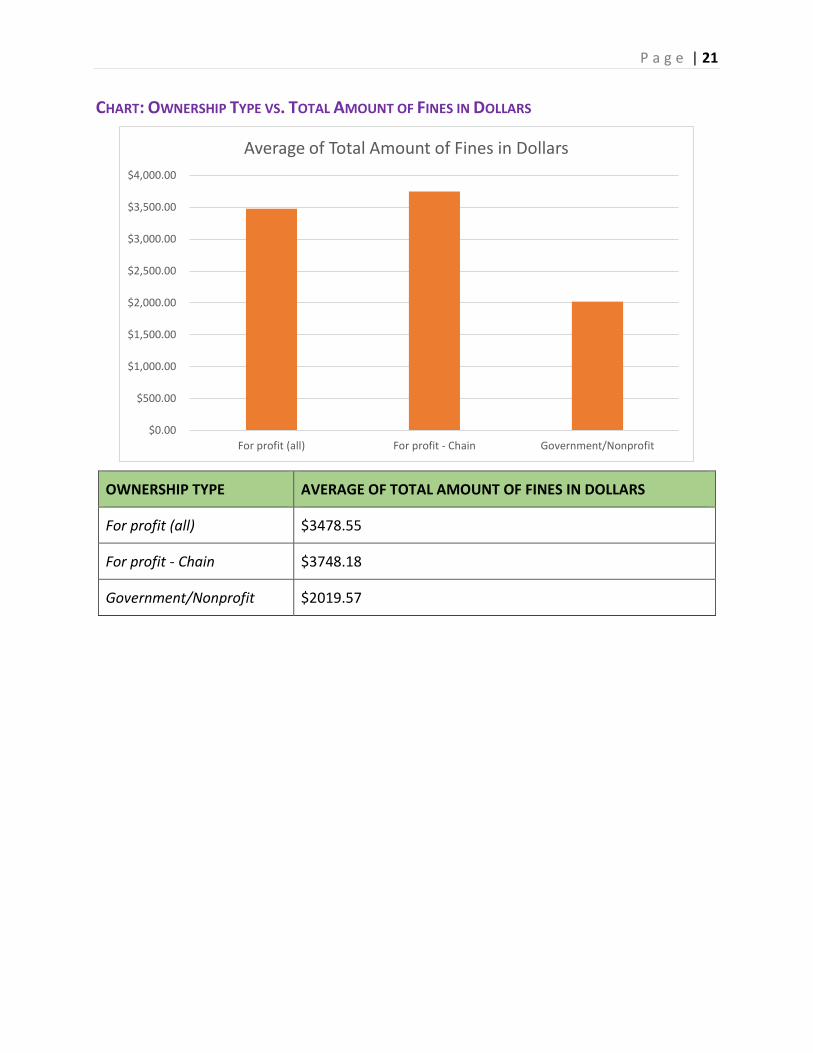
• Dollar amount of fines. For-profit nursing homes have close to a sixty percent higher average total dollar amount in fines, with for-profit chains having the highest fines compared to all for-profit and government/non-profit facilities.
IMPLICATIONS • For both for-profit and government/non-profit nursing homes, fines are underutilized
when deficient resident care is identified. • The higher average dollar amount for fines among for-profit nursing homes suggest that
these nursing homes have more serious violations, on average than do government-owned and non-profit facilities.
19 The other type of penalty publicly reported by CMS is denial of payment. 20 According to federal data for 2018, though New York has the highest nursing home population of any state in the country, it ranked 27th lowest in the dollar amount of fines. 21 For a discussion on developments in fines for substandard care, see “Nursing Home Fines Drop as Trump Administration Heeds Industry Complaints,” Kaiser Health News, March 2019. Available at https://khn.org/news/nursing-home-fines-drop-as-trump-administration-heeds-industry-complaints/.
For-profit nursing homes have close to a sixty percent higher average total dollar amount in fines.
CHART: OWNERSHIP TYPE VS. TOTAL AMOUNT OF FINES IN DOLLARS
OWNERSHIP TYPE AVERAGE OF TOTAL AMOUNT OF FINES IN DOLLARS
For profit (all) $3478.55
For profit - Chain $3748.18
Government/Nonprofit $2019.57
$0.00
$500.00
$1,000.00
$1,500.00
$2,000.00
$2,500.00
$3,000.00
$3,500.00
$4,000.00
For profit (all) For profit - Chain Government/Nonprofit
Average of Total Amount of Fines in Dollars
P a g e | 22
CONCLUSIONS AND RECOMMENDATIONS • Nursing home ownership matters. For the majority of criteria included in this
assessment, non-profit/government-owned providers performed better, as a whole, than did for-profit providers. We encourage local and state policy-makers in New York, as well as mission-driven providers, to consider the value of the services that nursing homes offer to the communities in which they are situated and the important role that government-owned and mission-driven provides have played – and should continue to play – in our state.
• Chain ownership itself does not appear to be as relevant as is the for-profit vs non-profit divide. While, as noted above, our findings indicate that there are some significant differences between for-profits and non-profit/government-owned nursing homes, we did not find many meaningful differences between for-profit chains and for-profits as a whole. Thus, in respect to longstanding and growing concerns about for-profit chains buying up government-owned and non-profit nursing homes, the issue may be more about the conversion to a for-profit operation than the fact that the for-profit is part of a chain.
• We strongly recommend further study on this issue, since the industry is undergoing significant change (for instance, with the implementation of the patient driven payment model of nursing home reimbursement in October 2019) and the fact that there were limitations to the scope of our study (for example, because PBJ staffing information has only been published since 2017, it was not yet possible to conduct a longitudinal assessment of changes in staffing in the years leading up to and following purchase of a nursing home by a for-profit or for-profit chain).
P a g e | 23
APPENDIX I: RESOURCES FOR MORE INFORMATION 1. LTCCC’s website, www.nursinghome411.org, provides data on staffing and other
indicators for all U.S. nursing homes. These data are frequently updated. The website also has a range of fact sheets, handouts, forms, and other resources.
2. The federal Nursing Home Compare website, www.medicare.gov, provides PBJ data sets for public use. New data sets are available each quarter, according to the CMS’ quarterly schedule.
3. The Center for Elder Law & Justice, www.elderjusticeny.org, provides numerous resources for consumers and has begun publishing Nursing Home Profile Reports for nursing homes in western New York State.
4. Kaffenberger R, “Nursing home ownership: an historical analysis,” J Aging Soc Policy (2000). Available at https://www.ncbi.nlm.nih.gov/pubmed/11284194.
5. Harrington C, Jacobsen F, Panos J, Pollock A, Sutaria S, Szebehely M, “Marketization in Long-Term Care: A Cross-Country Comparison of Large For-Profit Nursing Home Chains,” Health Serv Insights (2017). Available at https://www.ncbi.nlm.nih.gov/pubmed/28634428.
6. Comondore VR, Devereaux PJ, Zhou Q, Stone SB, Busse JW, Ravindran NC, Burns KE, Haines T, Stringer B, Cook DJ, Walter SD, Sullivan T, Berwanger O, Bhandari M, Banglawala S, Lavis JN, Petrisor B, Schünemann H, Walsh K, Bhatnagar N, Guyatt GH, “Quality of care in for-profit and not-for-profit nursing homes: systematic review and meta-analysis,” BMJ (2009). Available at https://www.ncbi.nlm.nih.gov/pubmed/19654184.
APPENDIX II: ADDITIONAL NOTES ON DATA USED Selection Methodology:
Following are the criteria used in determining which nursing homes were considered a part of a chain and which owners could be considered family ownership. More information can be found in the “Notes” section in the corresponding data file.
• Nursing homes that had two or more owners with the same last name were labeled as having a family ownership. If there were three or more nursing homes that were owned by the same family, the family owner was given a number indicating that it was considered a family chain. The 11 family chains were labeled from 1-11 in alphabetical order in the data file.
• Nursing homes that were listed as a nursing facility within a larger healthcare network/private nursing chain, found through an online search, was considered part of that network’s chain. Exceptions are noted for certain facilities that have transferred ownership of facilities to other chains, such as ELANT having transferred four nursing homes over to SAPPHIRE Nursing.
• Nursing homes that were part of a family chain were marked as “Y” under “Nursing Home is Part of a Chain” in the excel data sheet, as well as those that were under a private nursing chain.
The data file that compliments this report can be found here: https://nursinghome411.org/nys-nursing-homes-2019/.
We continually publish (on a quarterly basis) the latest staffing, quality and enforcement data for nursing homes in New York and other states. These data sets can be found and downloaded from our website at www.nursinghome411.org.
Additional notes on the data presented and discussed in this report:
1. All data were derived from the federal databases (www.data.medicare.gov, www.data.cms.gov) in the first three months of 2019. Due to some differences in the way different data on nursing homes are collected and published by the Center for Medicare and Medicaid Services, there may be some missing information. For example, a nursing home may have had a new owner that was not included in the ownership data file we downloaded, who may have influenced the staffing levels for that particular quarter. We have used the most up to date files available at the time of creating the final data sheet.
2. Nursing homes that did not have information available (e.g., under “Average total daily staffing hours per resident per day”) were considered non-compliant. These facilities did not submit staffing data to CMS in accordance with federal requirements. .
3. We combined all data sets into one Excel file by using the provider number and provider name as a way to ensure that the data matched the correct nursing home. A few facilities had missing information, however, so some values are missing for these homes.
4. Only owners with three or more facilities were labeled in the data sheet as being part of a chain.
5. Nursing home chain owners are either families or private healthcare groups. 6. One nursing home is found to be non-compliant in providing PBJ data: Delhi
Rehabilitation and Nursing Center. This nursing home does not have information available except provider name, city, county, state, and ownership type.
7. To simplify and clarify the information, the category of data originally titled “MDS census” was renamed in our data file as “average number of residents per day.”