M. Weiner, MD; R. Feiwell, MD; J.H. Kramer, PsyD; and B.L. Miller, MD
Abstract—Objective: To identify and compare the patterns of cerebral atrophy associated with two clinical variants offrontotemporal lobar degeneration (FTLD): frontotemporal dementia (FTD) and semantic dementia (SemD). Methods:Twenty patients with FTLD were classified as having FTD (N � 8) or SemD (N � 12) based on current clinical criteria.Both groups showed a similar spectrum of behavioral abnormalities, as indicated by the neuropsychiatric inventory.T1-weighted MRI was obtained for each patient and 20 control subjects. The regions of focal gray matter tissue lossassociated with both FTD and SemD, as well as those differing between the two groups were examined using voxel-basedmorphometry. Results: Regions of significant atrophy seen in both groups were located in the ventromedial frontal cortex,the posterior orbital frontal regions bilaterally, the insula bilaterally, and the left anterior cingulate cortex. The FTD, butnot the SemD, group showed atrophy in the right dorsolateral frontal cortex and the left premotor cortex. The SemD, butnot the FTD, group showed tissue loss in the anterior temporal cortex and the amygdala/anterior hippocampal regionbilaterally. Conclusions: Although FTD and SemD are associated with different overall patterns of brain atrophy, regionsof gray matter tissue loss in the orbital frontal, insular, and anterior cingulate regions are present in both groups. Theauthors suggest that pathology in the areas of atrophy associated with both FTD and SemD may underlie some thebehavioral symptoms seen in the two disorders.
NEUROLOGY 2002;58:198–208
Frontotemporal lobar degeneration (FTLD) is a neu-rodegenerative disease characterized by the progres-sive loss of cerebral tissue in the frontal and anteriortemporal lobes. Although neuropathological findingshave defined FTLD as a single entity,1,2 both theclinical manifestations and the patterns of anatomicinvolvement in the disease are heterogeneous.
The most recent diagnostic criteria for FTLD de-lineated three different clinical syndromes,2: 1) fron-totemporal dementia (FTD), which is characterizedby the progressive development of behavioral prob-lems, including changes in personal and social con-duct, emotional blunting, and loss of insight; 2)semantic dementia (SemD), characterized by anomiaand progressive loss of knowledge about words andobjects; and 3) progressive nonfluent aphasia (PA),characterized by hesitant, nonfluent speech. Al-though each of these entities presents with uniqueclinical features in the early stages, all are associ-ated with the eventual development of the behav-ioral symptoms characteristic of FTD.
Although damage in the frontal and anterior tem-poral lobes characterizes FTLD in general, the rela-tive involvement of these structures varies across
patients. Some individuals have predominantly fron-tal injury, whereas others have more severe involve-ment of the temporal lobes.3,4 Furthermore, injury tothese structures can be asymmetric.4,5 The anatomicand clinical variability in FTLD provides an opportu-nity to correlate the specific cognitive and behavioraldeficits seen in neurodegenerative disease with theirassociated anatomic abnormalities.
Converging evidence from neuropathologic, neuro-radiologic, and neuropsychological studies has indi-cated that SemD is associated with atrophy in theanterior temporal lobes.3,4,6,7 Recently, an automatedanalysis of atrophy in patients with SemD confirmedthe pattern of anterior temporal atrophy,8 and a sub-sequent structural image analysis focused on thetemporal lobe has indicated that atrophy in SemDincludes the temporal pole, parahippocampal gyrus,anterior fusiform gyrus, and the inferior and middletemporal gyri.9 Furthermore, loss of tissue in theamygdala, insula, ventromedial frontal cortex, ento-rhinal cortex, and hippocampus has also been dem-onstrated in SemD.8-10 The close association of SemDwith temporal atrophy has led to its alternative de-scription as the ‘temporal lobe variant’ of FTLD.4,11,12
From the University of California at San Francisco Department of Neurology (Drs. Rosen, Gorno–Tempini, Goldman, Perry, Weiner, Kramer, and Miller),UCSF Memory and Aging Center (Drs. Rosen, Gorno–Tempini, Goldman, Perry, Kramer, and Miller), San Francisco Veterans Affairs Hospital MagneticResonance Spectroscopy Unit (Drs. Schuff and Weiner), University of California at San Francisco Department of Radiology (Drs. Schuff, Weiner, andFeiwell), CA.Supported by the John Douglas French Foundation for Alzheimer’s research, the McBean Foundation, and the Sandler Foundation.Received May 4, 2001. Accepted in final form September 27, 2001.Address correspondence and reprint requests to Dr. Howard Rosen, UCSF Department of Neurology, Memory and Aging Center, 350 Parnassus Ave., Suite800, Box 1207, San Francisco, CA 94143-1207; e-mail: [email protected]
These studies, along with functional neuroimaging andlesion studies, have indicated a crucial role for anteriortemporal structures in semantic processing.7,8,9,13,14
In contrast to SemD, the patterns of atrophy asso-ciated with the clinical syndromes of FTD and PAare less clearly established. The most recent clinicalcriteria state that FTD is associated with ‘frontaland/or temporal’ degeneration, and PA with abnor-malities in the dominant cerebral hemisphere.2 How-ever, recent studies suggest that the frontal lobes arethe main locus of damage in FTD. The term ‘frontallobe variant of FTLD’ has been used to describe pa-tients who have behavioral abnormalities character-istic of FTD, a ‘dysexecutive’ syndrome, and no lossof semantic knowledge.11,12 These patients show fron-tal atrophy on MRI or frontal hypometabolism onSPECT. Furthermore, a recent study demonstratedright frontal lobe volume reduction in FTD comparedwith AD and PA.15
We examined the patterns of regional gray mattertissue loss in FTD and SemD, with the specific aimof identifying the areas of atrophy that are commonto both groups, as well as those unique to each clini-cal syndrome. We used voxel-based morphometry(VBM), which allows automated measurement ofbrain atrophy without the need to specify a prioriregions of interest.16 Because FTD and SemD areboth associated with similar behavioral abnormali-ties,12 we hypothesized that a set of areas could beidentified that would show tissue loss in both groups.Because lesions in the ventral frontal cortex havebeen associated with profound disturbances in socialbehavior,17 we predicted that orbital frontal atrophywould be found in both FTD and SemD. Based onprevious data, we also expected that SemD would beassociated with anterior temporal tissue loss, andFTD would be associated with predominantly frontalatrophy.
Methods. Subjects. Brain imaging and clinical datawere analyzed in twenty patients who were diagnosed atthe University of California, San Francisco (UCSF) Mem-ory and Aging Center (MAC) with FTLD, using the mostrecently published criteria.2 Cases of PA were excludedfrom this analysis, because the syndrome is clinically andpathologically heterogeneous with some cases demonstrat-ing AD pathology.18 All patients were initially evaluated bya neurologist (B.L.M.), a nurse, and a neuropsychologist toestablish the pattern of cognitive and behavioral deficits.5
Although previous reports have demonstrated that somecases of AD with relatively focal pathology can presentwith clinical features suggestive of FTLD,18 the experiencefrom this group suggests that the accuracy of a clinicaldiagnosis of FTLD is high. In a previous study of patholog-ically confirmed cases of dementia, 88% of those cases clin-ically diagnosed with FTLD showed FTLD at autopsy;none had AD pathology.19 Two of the patients included inthis analysis have died, and both had FTLD pathology,with no evidence of AD.
Brain images from 20 control subjects, matched in ageand sex to the patient group, were chosen from among agroup of subjects enrolled in ongoing neuroimaging re-
search in the San Francisco Veterans Administration Hos-pital Magnetic Resonance Spectroscopy laboratory. Allcontrol subjects had no history of neurologic or psychiatricdisorders, and had no evidence of focal disease on MRI.The mean age in the neuroimaging control group was 65.4(range: 38 to 82 years; 16 men, 4 women).
The study was approved by the UCSF committee onhuman research. All subjects provided informed consentbefore participating.
Clinical classification. Two raters, a neurologist and aneuropsychologist, who were blinded to all imaging find-ings, independently reviewed the clinical case reports forthe group of patients. These raters had access to the clini-cal history and the results of the initial neuropsychologicalevaluation. This evaluation consists of tests designed toassess general intellectual function (Mini-Mental State Ex-amination [MMSE]20); working memory (digit span back-wards); verbal episodic memory (California VerbalLearning Test [CVLT]21); visual episodic memory (memoryfor details of a modified Rey–Osterrieth figure with a totalof 17 items, allowing a score of 0 to 17); visual-spatialfunction (copy of a modified Rey–Osterrieth figure, score of0 to 16); confrontational naming (15 items from the BostonNaming Test [BNT]22); sentence comprehension and repeti-tion; phonemic (words beginning with the letter ‘D’); se-mantic (animals) and nonverbal fluency (novel designs21);and visual-motor sequencing (a modified version of the‘Trails B’ test23). The comprehension tasks were a combina-tion of finger-pointing tasks (four commands) and yes/noquestions (three questions), with a perfect score being 7correct responses. Neuropsychological data were com-pletely unavailable for 2 patients with SemD and partiallyunavailable for 4 patients (1 FTD, 3 SemD) because of poorcooperation with the testing procedures.
Neuropsychological data for the patient groups werecompared with data from a group of cognitively normalindividuals enrolled in studies of normal aging at theUCSF MAC. Group differences were investigated usingone-way analysis of variance (ANOVA), and post-hoc com-parisons across groups were accomplished using Student’st-tests.
Using the clinical history and the available neuropsy-chological data, the raters were asked to make a diagnosisof FTD or SemD based on the most recent diagnostic crite-ria.2 These criteria are organized into core and supportivediagnostic features, all of which were considered in theclinical evaluation. For the purposes of brevity, only thecore criteria will be listed here. For both groups, insidiousonset and gradual progression were required. In addition,patients with FTD were required to show 1) early declinein social interpersonal conduct; 2) early impairment in reg-ulation of personal conduct; 3) early emotional blunting;and 4) early loss of insight. Patients with SemD were re-quired to show a language impairment characterized by 1)progressive fluent, empty spontaneous speech; 2) loss ofword meaning manifest by impaired naming and wordcomprehension; 3) semantic paraphasias and/or 4) a per-ceptual disorder characterized by prosopagnosia and/or as-sociative agnosia; 5) preserved perceptual matching anddrawing reproduction; 6) preserved single word repetition;and 7) preserved ability to read aloud and write to dicta-tion orthographically regular words. Of the neuropsycho-logical tests described above, patients with FTD were
January (2 of 2) 2002 NEUROLOGY 58 199
expected to show impairment on tests tapping frontal lobefunctions (Trails B, design fluency, backwards digit span),whereas patients with SemD were expected to show im-pairment in naming and preserved figure copying. Patientswere entered into the VBM analysis as FTD or SemDbased on this classification.
Identification of behavioral abnormalities. FTD is de-fined by its behavioral manifestations. However, SemD canalso be associated with similar behavioral abnormalities.Two approaches were taken to assess the degree of behav-ioral overlap between our FTD and SemD groups. First,the clinical raters were asked to indicate whether eachpatient displayed any behavioral abnormalities based onthe clinical history, and to list the specific problems ob-served in each patient. In addition, data from the neuro-psychiatric inventory (NPI) were analyzed.24 Thisvalidated behavioral rating system, developed for the as-sessment of dementia, is administered as part of the initialpatient interview at the MAC. The NPI evaluates the pres-ence or absence of twelve major behavioral disorders andhas previously demonstrated differences in the patterns ofbehavioral abnormalities between FTLD and AD.25 In thecurrent analysis, the proportion of patients in the FTD andSemD groups showing each of the behavioral problems onthe NPI was assessed, and compared across groups usingthe �2 test.
Statistical analyses on behavioral and demographicdata were carried out using the SPSS software package(version 10.0.5 for Windows, SPSS Inc., Chicago, IL).
MRI scanning. MRI scans were obtained on a 1.5-TMagnetom VISION system (Siemens Inc., Iselin, NJ)equipped with a standard quadrature head coil. StructuralMRI sequences included: 1) two-dimensional, fast low-angle shot (FLASH) MRI along three orthogonal direc-tions, 3 mm thick slices, about 15 slices in each direction toobtain scout views of the brain for positioning MRI slices;2) a double spin echo sequence (repetition time [TR]/echotime [TE]1/TE2 � 5,000/20/80 milliseconds) to obtain pro-ton density and T2-weighted MRI, 51 contiguous axialslices (3 mm) covering the entire brain and angulated �10degrees from the anterior commissure (AC)-posterior com-missure (PC) line; 1.0 � 1.25 mm2 in-plane resolution; 3)volumetric magnetization-prepared rapid gradient echo(MP-RAGE) MRI (TR/TE/inversion time [TI] � 10/4/300msec) to obtain T1-weighted images of entire brain, 15° flipangle, coronal orientation perpendicular to the double spinecho sequence, 1.0 � 1.0 mm2 in-plane resolution and 1.5mm slab thickness.
Voxel-based morphometry. VBM is a new technique fordetection of brain atrophy that permits the comparison oflocal gray-matter concentration at every voxel (volume ele-ment) in an image between two groups of subjects. For thisVBM analysis, images were pre-processed and statisticallyanalyzed using the SPM99 software package (http://www.fil.ion.ucl.ac.uk/spm), using standard procedures.16
In order to optimize the spatial transformation of thesubjects’ images, we created an ad-hoc template image. Forthis purpose, the MP-RAGE images from 15 normal sub-jects, matched in age to the patient and control groups(mean age 65.8, range: 56 to 80 years; 9 men, 6 women)and scanned using the same equipment and parameters,were obtained. Each image was then spatially normalizedto the Montreal Neurologic Institute (MNI) standard
brain.26 A single mean of these images was created andsmoothed with a 6 mm full width at half maximum(FWHM) isotropic Gaussian kernel. This image was usedas a template for the subsequent normalization of the pa-tient and control images. Assuming that large-scalechanges in brain size and shape in the patient group werelinear, only a 12-parameter affine transformation algo-rithm was used to normalize the images that were thenentered into the VBM analysis.16,27
Each normalized image was segmented into gray,white, and CSF compartments.27 Although white mattersignal hyperintensity would be classified as gray matter bythe segmentation algorithm, the degree of white mattersignal hyperintensity in the images included in this analy-sis was insignificant. Gray matter images were then spa-tially smoothed with a 12 mm FWHM isotropic Gaussiankernel. In addition to permitting application of the randomfield theory for corrected statistical inference,28 thissmoothing step allows each voxel to become a ‘region-of-interest’ representing the average concentration of graymatter around it, thus providing the basis for VBM.16 The12 mm Gaussian kernel has been used for previous VBManalyses and was chosen to minimize the interindividualvariability in sulcal anatomy, while preserving the abilityto delineate regional differences in tissue content.8,16 Thesmoothed gray matter images were normalized to a globalmean pixel-value of 50 and entered into a design matrixfor statistical analysis using the general linear model, al-lowing each patient to be an independent variable in themodel. Age for each subject, controls and patients, wasentered into the design matrix as a nuisance variable.
To identify the regions of atrophy associated with bothFTD and SemD, a contrast of all FTLD patients vs controlswas performed. This contrast represented the comparisonof the whole patient group with the control group, includ-ing both the FTD and SemD patients. To ensure that allreported regions were atrophied in both FTD and SemD,rather than only in one of the groups, this contrast wasinclusively masked such that only those voxels with signif-icant gray matter tissue loss in the FTD vs controls andSemD vs controls contrasts were included. To examine thepatterns of atrophy specific to each patient group, the fol-lowing contrasts were performed: 1) FTD vs controls—toensure that all regions were atrophied relative to SemD aswell as controls, this contrast was inclusively masked bythe FTD-vs-SemD contrast (FTD � SemD); 2) SemD vscontrols—to ensure that all regions were atrophied relativeto FTD as well as controls, this contrast was inclusivelymasked by the SemD vs FTD contrast (SemD � FTD). Weaccepted a statistical threshold of p � 0.05, corrected formultiple comparisons, for the main contrast and p � 0.001,uncorrected, for the inclusive masking procedure. Localiza-tion of areas of significant tissue loss was accomplished bysuperimposing the regions of significant atrophy on theaveraged T1-weighted image used to create the templatefor spatial normalization and visual comparison with thecerebral atlases of Duvornoy and Talairach andTournoux.29,30
Previous studies have documented correlations betweenneuropsychological variables and regional gray matterdensity8 or regional volume in patients with SemD.9 Weinvestigated the relationship between relative gray matterdensity and the performance on specific neuropsychological
200 NEUROLOGY 58 January (2 of 2) 2002
variables using correlation analysis. The neuropsychologi-cal tests that specifically characterized the SemD or FTDgroups, when compared to controls, were correlated withgray matter density values extracted from the peak voxelof each significant cluster that was identified in the groupanalysis for either SemD or FTD. This analysis was per-formed in order to characterize which of the areas of atro-phy found to be typical for each group of patients wouldcorrelate with the most relevant neuropsychological mea-sure for that group. This approach is similar to that usedby Mummery et al.8 in a group of patients with SemD.MMSE score was used as a covariate of no interest in orderto control for variance attributable to global cognitive de-
cline. Given that correlations were only expected in onedirection for each variable (greater tissue content associ-ated with better performance), a one-tailed level of signifi-cance (p � 0.05) was accepted.
Results. Patient classification. Using the Neary crite-ria as a guide,2 eight of the 20 patients with FTLD wereclassified as having FTD, and the other 12 as havingSemD. The agreement between the two rating clinicianswas 100%.
Demographic and neuropsychological characteristicswere compared across the two patient groups and a groupof age-matched control subjects. One-way ANOVA detected
Table 1 Demographic and neuropsychological profile* in FTD and SemD compared with controls
* See Methods for description of tests.† Not the same group as controls used for neuroimaging (see Methods). Control group is as indicated for all variables except CVLT, for
which more behavioral control data are available. For CVLT, behavioral controls are a separate group of 35 subjects (18 men, 17women, mean age 66.4, range 56–74).
‡ p � 0.05, vs controls.§ p � 0.05 for ANOVA across groups.� p � 0.05, vs FTD.
significant group effects for several variables, which wereinvestigated further with post-hoc testing (table 1). Therewas no significant difference in age between groups. Whencompared with a control group, both patient groupsshowed significantly lower MMSE scores and were signifi-cantly impaired in nonverbal memory and semantic, pho-nemic, and design fluency. There was no difference inMMSE score between the two groups of patients. Bothgroups were slower than controls on the modified Trailstest, but the FTD group was significantly slower than theSemD group, and only the FTD group made significantlymore errors and fewer correct responses than controls.Only the FTD group had a significantly reduced back-wards digit span compared with control subjects. In con-trast, only the SemD group was significantly impaired inpicture naming compared with controls and with FTD.Both patient groups were unimpaired on figure copyingand sentence comprehension, and reductions in verbalmemory seen in both groups were not significant.
Behavioral analysis. By definition, all eight of the pa-tients with FTD were characterized as having behavioraldisorders. Moreover, the clinical raters identified behav-ioral abnormalities all of the 12 patients with SemD. Be-havioral problems noted in both groups included obsessiveor compulsive behavior, dietary changes, disinhibition, de-cline in personal hygiene, mental rigidity, and irritabilityor agitation.
NPI data were available in the eight patients with FTDand 10 of the 12 patients with SemD (table 2). Seventeenof these patients showed at least three of the behavioralabnormalities assessed by the NPI (one patient with SemDshowed only aberrant motor behavior). There were no signif-icant differences between the FTD and SemD groups in theproportion of patients showing any of these behavioral abnor-
malities. Disinhibition and apathy were the most commonabnormalities in both groups, along with anxiety in FTD.
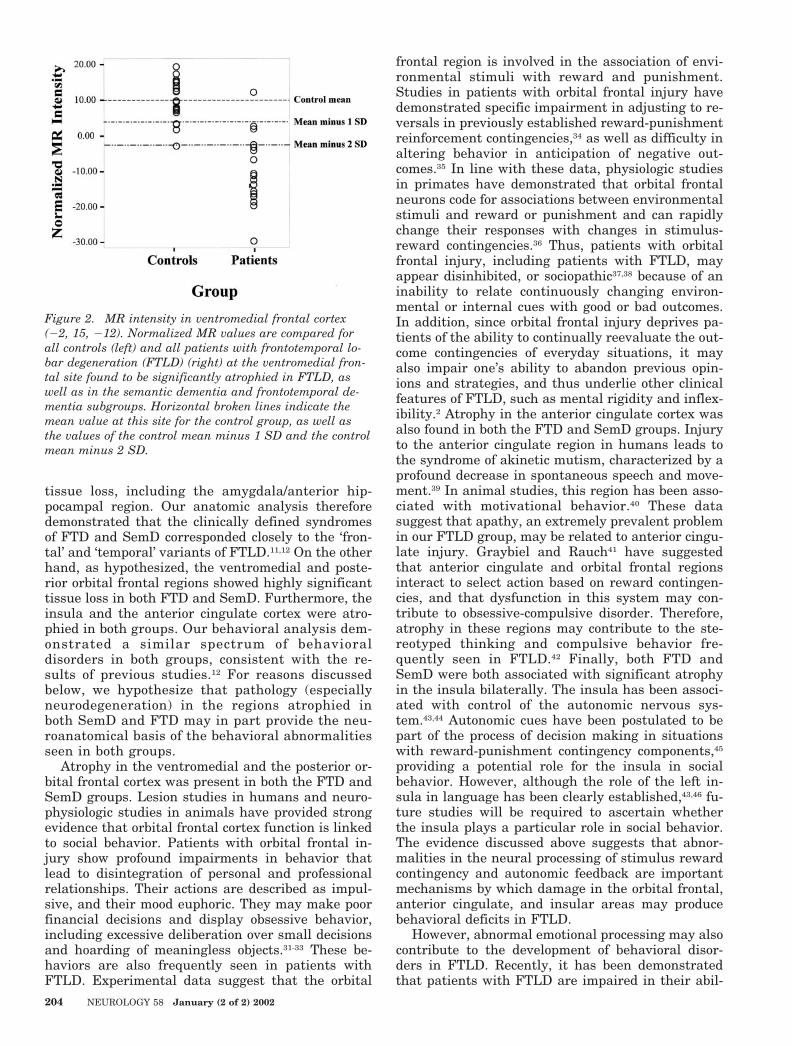
Neuroimaging analysis. FTLD vs controls. This con-trast identified regions where significant atrophy waspresent in both FTD and SemD relative to controls. Theseareas included the ventromedial frontal cortex, the posteri-or/medial orbital gyrus region bilaterally, the left posteriorinsula, the anterior insula bilaterally, and the left anteriorcingulate gyrus (figure 1, table 3). The ventromedial fron-tal cortex showed the most significant atrophy. Tissue con-tent in this region was substantially below the mean in thecontrols (�1 SD) in 19 of 20 patients (figure 2). In thisregion, as well as the right anterior insular region, atrophywas significant after multiple comparisons correction inboth the FTD and SemD groups (see table 3).
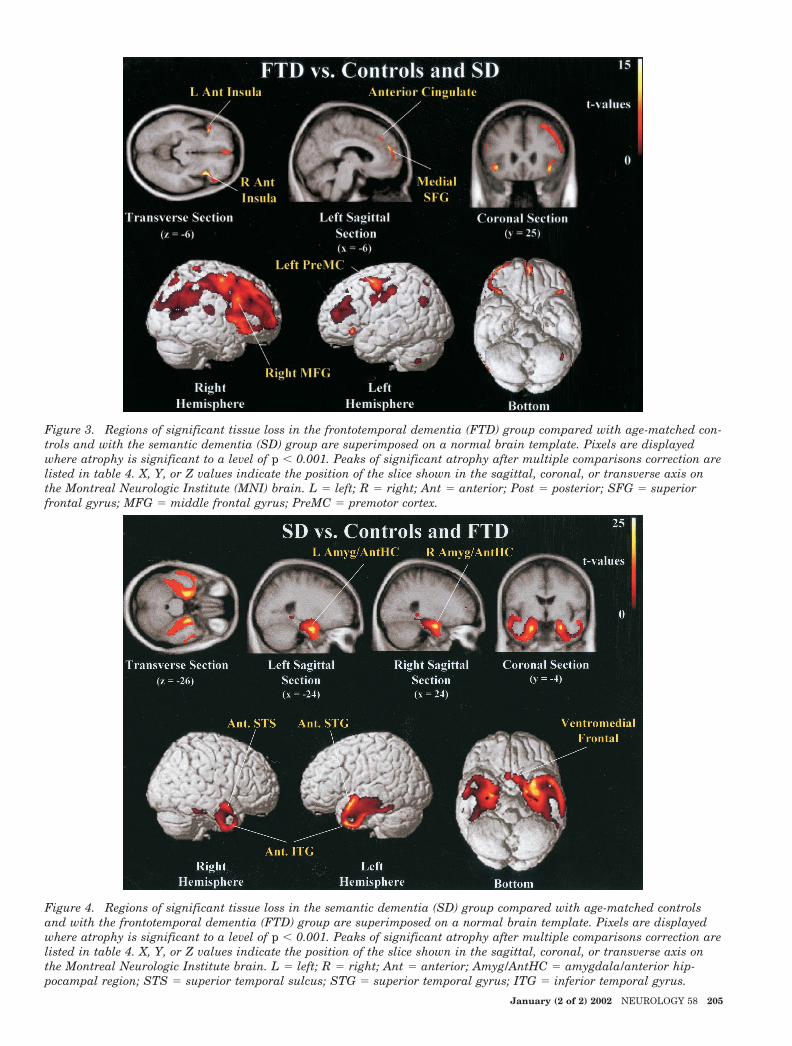
FTD vs controls and vs SemD. This contrast identifiedthose regions where significant atrophy was present inFTD relative to controls and to SemD. These sites includedthe anterior insula bilaterally, the right middle frontalgyrus, the left anterior cingulate gyrus, the left medialsuperior frontal gyrus, and the left premotor cortex (seefigure 3, table 4). Atrophy in the right anterior insula andthe right middle frontal gyrus was significant in FTDwhen compared with controls and when compared withSemD after multiple comparisons correction (see table 4).
Atrophy in the insula and the anterior cingulate regionswas present in both FTD and SemD when compared withcontrols, as well as when FTD was compared directly withSemD (see table 4), suggesting that these regions are atro-phied in both groups, but appear be more atrophic in FTDthan SemD.
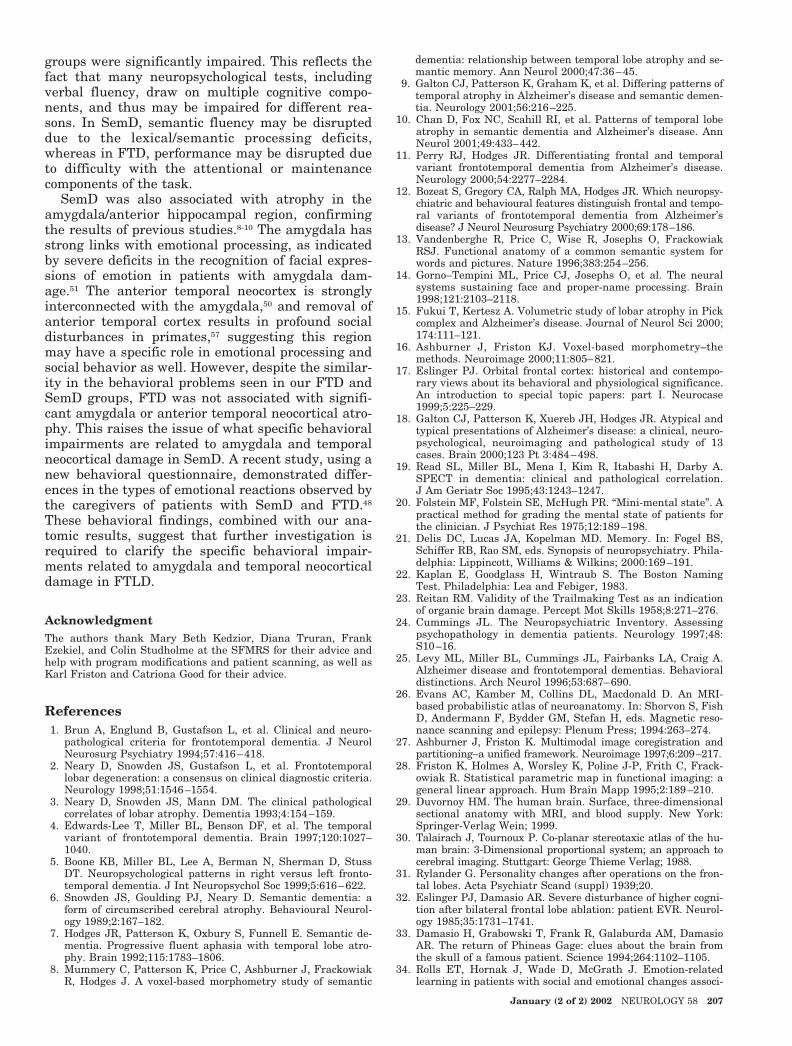
SemD vs controls and vs FTD. This contrast identifiedthose regions where significant atrophy was present inSemD relative to controls and relative to FTD. The ante-rior inferior temporal gyrus bilaterally, the anterior por-tion of the right superior temporal gyrus, the anteriorportion of the left superior temporal sulcus, the posterioramygdala/anterior hippocampal region bilaterally, and theventromedial frontal cortex (figure 4, table 4) were signifi-cantly atrophied in SemD compared with controls. Atrophyat all these sites, except for the ventromedial frontal cor-tex, was significant after multiple comparisons correctionin SemD when compared with FTD (see table 4).
The ventromedial frontal region showed gray mattertissue loss in both FTD and SemD when compared withcontrols, but also when SemD was compared directlywith FTD (see table 4), suggesting that this region isatrophied in both groups, but may be more atrophic inSemD than FTD.
Correlation of neuropsychological variables with neuro-imaging. The SemD group was unique in having severedeficits in picture naming (BNT) compared with controlsand FTD (see table 1). Partial correlations (covaried for theMMSE score) of the BNT score in SemD with the graymatter density values from the peaks of tissue loss in theSemD group (see table 4) revealed a significant correlation(r � 0.84) in the left inferior temporal gyrus. No othercluster of reduced gray matter density in SemD was corre-lated with BNT score. When compared with controls, onlythe FTD, and not the SemD, group showed a significant de-crease in the backwards digit span. This measure was posi-tively correlated with local gray matter density in the rightmiddle frontal gyrus (partial correlation coefficient � 0.82)
Table 2 Behavioral abnormalities on the NPI in FTD and SemD
and right anterior insula (partial correlation coefficient �0.74). No other cluster of reduced gray matter density in FTDwas correlated with the backwards digit span.
Discussion. In the current study, we used VBM toexamine the patterns of regional atrophy associated
with two clinical variants of FTLD: FTD and SemD.The results showed differences and commonalities inthe distributions of gray matter tissue loss betweenFTD and SemD. As expected, FTD was associatedwith predominantly dorsolateral frontal atrophy,whereas SemD showed bilateral anterior temporal
Table 3 Regions of significant atrophy in FTLD, FTD, and SemD compared with controls
Anatomic region BA X,Y,Zz-Score*(vs con)
z-Score†FTD � con
z-Score‡SemD � con
All FTLD (n � 20) vs controls
L Ventromedial frontal cortex/subcallosal gyrus 25 �2,15,�12 6.3 4.8 6.3
L Medial/posterior orbital gyrus 13/14 �26,8,�23 5.6 3.1§ 5.9
R Medial/posterior orbital gyrus 13/14 23,8,�17 4.9 3.6§ 5.0
L Posterior insula NA �44,0,�11 5.9 3.4§ 6.8
R Anterior insula NA 39,15,�15 6.0 6.3 5.2
L Anterior insula NA �38,15,0 5.3 4.5§ 5.0
L Anterior insula NA �35,23,�6 5.1 5.4 4.4§
L Anterior cingulate 32 �6,50,21 5.2 5.3 4.2§
* z-Score for the comparison of the FTLD group with controls.† z-Score at nearest location in the direct comparison of FTD with controls.‡ z-Score at nearest location in the direct comparison of SemD with controls.§ p � 0.001, uncorrected.
FTLD � frontotemporal lobar degeneration; FTD � frontotemporal dementia; SemD � semantic dementia; R � right; L � left; BA �Brodman’s area, as indicated by visual inspection the atlas of Talairach and Tournoux and the Duvornoy atlas; NA � no Brodman’sdesignation.
Figure 1. Regions of significant tissue loss in frontotemporal lobar degeneration (FTLD), including only those areas atro-phied both in the semantic dementia and frontotemporal dementia compared with control subjects, superimposed on anormal brain template. Pixels are displayed where atrophy is significant to a level of p � 0.001 in patients with FTLD vscontrol subjects. Peaks of significant atrophy after multiple comparisons correction are listed in table 3. X, Y, or Z valuesindicate the position of the slice shown in the sagittal, coronal, or transverse axis on the Montreal Neurologic Institutebrain. L � left; R � right; Ant � anterior; Post � posterior; Med � medial.
January (2 of 2) 2002 NEUROLOGY 58 203
tissue loss, including the amygdala/anterior hip-pocampal region. Our anatomic analysis thereforedemonstrated that the clinically defined syndromesof FTD and SemD corresponded closely to the ‘fron-tal’ and ‘temporal’ variants of FTLD.11,12 On the otherhand, as hypothesized, the ventromedial and poste-rior orbital frontal regions showed highly significanttissue loss in both FTD and SemD. Furthermore, theinsula and the anterior cingulate cortex were atro-phied in both groups. Our behavioral analysis dem-onstrated a similar spectrum of behavioraldisorders in both groups, consistent with the re-sults of previous studies.12 For reasons discussedbelow, we hypothesize that pathology (especiallyneurodegeneration) in the regions atrophied inboth SemD and FTD may in part provide the neu-roanatomical basis of the behavioral abnormalitiesseen in both groups.
Atrophy in the ventromedial and the posterior or-bital frontal cortex was present in both the FTD andSemD groups. Lesion studies in humans and neuro-physiologic studies in animals have provided strongevidence that orbital frontal cortex function is linkedto social behavior. Patients with orbital frontal in-jury show profound impairments in behavior thatlead to disintegration of personal and professionalrelationships. Their actions are described as impul-sive, and their mood euphoric. They may make poorfinancial decisions and display obsessive behavior,including excessive deliberation over small decisionsand hoarding of meaningless objects.31-33 These be-haviors are also frequently seen in patients withFTLD. Experimental data suggest that the orbital
frontal region is involved in the association of envi-ronmental stimuli with reward and punishment.Studies in patients with orbital frontal injury havedemonstrated specific impairment in adjusting to re-versals in previously established reward-punishmentreinforcement contingencies,34 as well as difficulty inaltering behavior in anticipation of negative out-comes.35 In line with these data, physiologic studiesin primates have demonstrated that orbital frontalneurons code for associations between environmentalstimuli and reward or punishment and can rapidlychange their responses with changes in stimulus-reward contingencies.36 Thus, patients with orbitalfrontal injury, including patients with FTLD, mayappear disinhibited, or sociopathic37,38 because of aninability to relate continuously changing environ-mental or internal cues with good or bad outcomes.In addition, since orbital frontal injury deprives pa-tients of the ability to continually reevaluate the out-come contingencies of everyday situations, it mayalso impair one’s ability to abandon previous opin-ions and strategies, and thus underlie other clinicalfeatures of FTLD, such as mental rigidity and inflex-ibility.2 Atrophy in the anterior cingulate cortex wasalso found in both the FTD and SemD groups. Injuryto the anterior cingulate region in humans leads tothe syndrome of akinetic mutism, characterized by aprofound decrease in spontaneous speech and move-ment.39 In animal studies, this region has been asso-ciated with motivational behavior.40 These datasuggest that apathy, an extremely prevalent problemin our FTLD group, may be related to anterior cingu-late injury. Graybiel and Rauch41 have suggestedthat anterior cingulate and orbital frontal regionsinteract to select action based on reward contingen-cies, and that dysfunction in this system may con-tribute to obsessive-compulsive disorder. Therefore,atrophy in these regions may contribute to the ste-reotyped thinking and compulsive behavior fre-quently seen in FTLD.42 Finally, both FTD andSemD were both associated with significant atrophyin the insula bilaterally. The insula has been associ-ated with control of the autonomic nervous sys-tem.43,44 Autonomic cues have been postulated to bepart of the process of decision making in situationswith reward-punishment contingency components,45
providing a potential role for the insula in socialbehavior. However, although the role of the left in-sula in language has been clearly established,43,46 fu-ture studies will be required to ascertain whetherthe insula plays a particular role in social behavior.The evidence discussed above suggests that abnor-malities in the neural processing of stimulus rewardcontingency and autonomic feedback are importantmechanisms by which damage in the orbital frontal,anterior cingulate, and insular areas may producebehavioral deficits in FTLD.
However, abnormal emotional processing may alsocontribute to the development of behavioral disor-ders in FTLD. Recently, it has been demonstratedthat patients with FTLD are impaired in their abil-
Figure 2. MR intensity in ventromedial frontal cortex(�2, 15, �12). Normalized MR values are compared forall controls (left) and all patients with frontotemporal lo-bar degeneration (FTLD) (right) at the ventromedial fron-tal site found to be significantly atrophied in FTLD, aswell as in the semantic dementia and frontotemporal de-mentia subgroups. Horizontal broken lines indicate themean value at this site for the control group, as well asthe values of the control mean minus 1 SD and the controlmean minus 2 SD.
204 NEUROLOGY 58 January (2 of 2) 2002
Figure 3. Regions of significant tissue loss in the frontotemporal dementia (FTD) group compared with age-matched con-trols and with the semantic dementia (SD) group are superimposed on a normal brain template. Pixels are displayedwhere atrophy is significant to a level of p � 0.001. Peaks of significant atrophy after multiple comparisons correction arelisted in table 4. X, Y, or Z values indicate the position of the slice shown in the sagittal, coronal, or transverse axis onthe Montreal Neurologic Institute (MNI) brain. L � left; R � right; Ant � anterior; Post � posterior; SFG � superiorfrontal gyrus; MFG � middle frontal gyrus; PreMC � premotor cortex.
Figure 4. Regions of significant tissue loss in the semantic dementia (SD) group compared with age-matched controlsand with the frontotemporal dementia (FTD) group are superimposed on a normal brain template. Pixels are displayedwhere atrophy is significant to a level of p � 0.001. Peaks of significant atrophy after multiple comparisons correction arelisted in table 4. X, Y, or Z values indicate the position of the slice shown in the sagittal, coronal, or transverse axis onthe Montreal Neurologic Institute brain. L � left; R � right; Ant � anterior; Amyg/AntHC � amygdala/anterior hip-pocampal region; STS � superior temporal sulcus; STG � superior temporal gyrus; ITG � inferior temporal gyrus.
January (2 of 2) 2002 NEUROLOGY 58 205
ity to identify emotions in photographs of faces.47
Furthermore, abnormalities in the ability to showemotion have also been demonstrated in patientswith FTLD.48,49 Neuroanatomic, neuropsychological,and functional neuroimaging studies have suggestedthat the regions identified in this study as atrophiedin both FTD and SemD have putative roles in emo-tional processing. The ventromedial and posterior or-bital frontal regions, the anterior portions of theinsula, and the medial portions of the dorsal frontallobe (particularly the anterior cingulate gyrus) areall heavily connected with the amygdala, a structurestrongly linked to the processing of emotion.50,51 Def-icits in the recognition of facial and vocal expressionsof emotion occur in patients with orbital frontal in-jury, along with a reduction in the ability to feelemotions.52 In addition, functional imaging experi-ments have shown that the anterior insula and ante-rior cingulate regions are activated during aversiveconditioning, a task related to emotional process-ing.53,54 Other experiments have elicited insular acti-vation during the active processing of emotion infaces.55,56 This evidence, together with our findings,suggests that future studies examining emotionalprocessing in FTLD should yield significant insightsinto the genesis of behavioral disorders.
In addition to regions of atrophy common to bothFTD and SemD, our results also demonstrated ex-pected differences in the patterns of tissue loss be-tween the two groups, along with some expectedneuropsychological correlations. FTD, but not SemD,
was associated with significant atrophy in the rightmiddle frontal gyrus and the left premotor cortex.The finding of greater frontal atrophy in FTD is con-sistent with previous neuropsychological data show-ing larger deficits in executive functioning inpatients with FTD compared with SemD.11 In ourgroup, the backwards digit span, a measure of work-ing memory usually adversely affected by frontallobe injury, was correlated with tissue content in thefrontal lobe in the FTD group. SemD, but not FTD,was associated with tissue loss in the anterior tem-poral neocortex. This result is consistent with previ-ous studies of SemD, which have demonstratedtemporal neocortical atrophy in SemD,6-9 and havesuggested that atrophy in these regions differenti-ates SemD from typical AD to a large degree.9 Volu-metric studies have indicated that semanticprocessing deficits in these patients are correlatedwith atrophy in temporal neocortical structures, par-ticularly on the left.8,9 In our SemD group picturenaming, a task that is, in part, dependent on intactsemantic memory, was correlated with tissue contentin the left inferior temporal gyrus, as would be ex-pected based on these prior studies. It is worth not-ing that the sentence comprehension and semanticfluency tasks did not differentiate FTD from SemD.In the case of sentence comprehension, the task wasdesigned to be sensitive to syntactic deficits and usedhigh frequency content words, making this task rela-tively insensitive to semantic impairment. In thecase of semantic fluency, both the FTD and SemD
Table 4 Regions of significant atrophy in FTD and SemD compared with controls and each other
Anatomic region BA X,Y,Zz-Score*(vs con)
z-Score†FTD � SD
z-Score‡SemD � FTD
FTD (n � 8) vs controls and SemD
R Anterior insula NA 38,18,�6 6.3 4.8 NS
L Anterior insula NA �38,26,�9 5.4 4.2§ NS
R Middle frontal gyrus 8 48,17,32 5.0 5.0 NS
L Anterior cingulate 32 �6,50,23 5.3 3.9§ NS
Medial superior frontal gyrus 9 2,57,�2 4.8 4.5§ NS
L Premotor cortex 6 �36,0,57 5.0 4.6§ NS
SemD (n � 12) vs controls and FTD
L Anterior inferior temporal gyrus 38 �29,11,�42 �10 NS 7.4
R Anterior inferior temporal gyrus 38 30,11,�42 6.3 NS 6.0
L Posterior amygdala/anterior hippocampus NA �24,�5,�27 7.5 NS 7.0
R Posterior amygdala/anterior hippocampus NA 26,�3,�24 7.5 NS 6.8
L Anterior superior temporal gyrus 22 �51,8,�17 7.3 NS 7.0
R Anterior superior temporal sulcus 21/22 54,�3,�17 6.5 NS 5.3
L Ventromedial frontal cortex/subcallosal gyrus 25 �2,15,�12 6.3 NS 4.1§
* z-Score for the comparison of each major diagnostic group (SemD, FTD) with controls.† z-Score at the nearest location in the direct comparison of SemD with FTD, FTD � SemD contrast.‡ z-Score at the nearest location in the direct comparison of SemD with FTD, SemD � FTD contrast.§ p � 0.001, uncorrected, not significant.
FTD � frontotemporal dementia; SemD � semantic dementia; R � right; L � left; BA � Brodman’s area, as indicated by visual inspec-tion the atlas of Talairach and Tournoux and the Duvornoy atlas; NA � no Brodman’s designation; NS � not significant.
206 NEUROLOGY 58 January (2 of 2) 2002
groups were significantly impaired. This reflects thefact that many neuropsychological tests, includingverbal fluency, draw on multiple cognitive compo-nents, and thus may be impaired for different rea-sons. In SemD, semantic fluency may be disrupteddue to the lexical/semantic processing deficits,whereas in FTD, performance may be disrupted dueto difficulty with the attentional or maintenancecomponents of the task.
SemD was also associated with atrophy in theamygdala/anterior hippocampal region, confirmingthe results of previous studies.8-10 The amygdala hasstrong links with emotional processing, as indicatedby severe deficits in the recognition of facial expres-sions of emotion in patients with amygdala dam-age.51 The anterior temporal neocortex is stronglyinterconnected with the amygdala,50 and removal ofanterior temporal cortex results in profound socialdisturbances in primates,57 suggesting this regionmay have a specific role in emotional processing andsocial behavior as well. However, despite the similar-ity in the behavioral problems seen in our FTD andSemD groups, FTD was not associated with signifi-cant amygdala or anterior temporal neocortical atro-phy. This raises the issue of what specific behavioralimpairments are related to amygdala and temporalneocortical damage in SemD. A recent study, using anew behavioral questionnaire, demonstrated differ-ences in the types of emotional reactions observed bythe caregivers of patients with SemD and FTD.48
These behavioral findings, combined with our ana-tomic results, suggest that further investigation isrequired to clarify the specific behavioral impair-ments related to amygdala and temporal neocorticaldamage in FTLD.
AcknowledgmentThe authors thank Mary Beth Kedzior, Diana Truran, FrankEzekiel, and Colin Studholme at the SFMRS for their advice andhelp with program modifications and patient scanning, as well asKarl Friston and Catriona Good for their advice.
References1. Brun A, Englund B, Gustafson L, et al. Clinical and neuro-
pathological criteria for frontotemporal dementia. J NeurolNeurosurg Psychiatry 1994;57:416–418.
2. Neary D, Snowden JS, Gustafson L, et al. Frontotemporallobar degeneration: a consensus on clinical diagnostic criteria.Neurology 1998;51:1546–1554.
3. Neary D, Snowden JS, Mann DM. The clinical pathologicalcorrelates of lobar atrophy. Dementia 1993;4:154–159.
4. Edwards-Lee T, Miller BL, Benson DF, et al. The temporalvariant of frontotemporal dementia. Brain 1997;120:1027–1040.
5. Boone KB, Miller BL, Lee A, Berman N, Sherman D, StussDT. Neuropsychological patterns in right versus left fronto-temporal dementia. J Int Neuropsychol Soc 1999;5:616–622.
6. Snowden JS, Goulding PJ, Neary D. Semantic dementia: aform of circumscribed cerebral atrophy. Behavioural Neurol-ogy 1989;2:167–182.
7. Hodges JR, Patterson K, Oxbury S, Funnell E. Semantic de-mentia. Progressive fluent aphasia with temporal lobe atro-phy. Brain 1992;115:1783–1806.
8. Mummery C, Patterson K, Price C, Ashburner J, FrackowiakR, Hodges J. A voxel-based morphometry study of semantic
dementia: relationship between temporal lobe atrophy and se-mantic memory. Ann Neurol 2000;47:36–45.
9. Galton CJ, Patterson K, Graham K, et al. Differing patterns oftemporal atrophy in Alzheimer’s disease and semantic demen-tia. Neurology 2001;56:216–225.
10. Chan D, Fox NC, Scahill RI, et al. Patterns of temporal lobeatrophy in semantic dementia and Alzheimer’s disease. AnnNeurol 2001;49:433–442.
11. Perry RJ, Hodges JR. Differentiating frontal and temporalvariant frontotemporal dementia from Alzheimer’s disease.Neurology 2000;54:2277–2284.
12. Bozeat S, Gregory CA, Ralph MA, Hodges JR. Which neuropsy-chiatric and behavioural features distinguish frontal and tempo-ral variants of frontotemporal dementia from Alzheimer’sdisease? J Neurol Neurosurg Psychiatry 2000;69:178–186.
13. Vandenberghe R, Price C, Wise R, Josephs O, FrackowiakRSJ. Functional anatomy of a common semantic system forwords and pictures. Nature 1996;383:254–256.
14. Gorno–Tempini ML, Price CJ, Josephs O, et al. The neuralsystems sustaining face and proper-name processing. Brain1998;121:2103–2118.
15. Fukui T, Kertesz A. Volumetric study of lobar atrophy in Pickcomplex and Alzheimer’s disease. Journal of Neurol Sci 2000;174:111–121.
17. Eslinger PJ. Orbital frontal cortex: historical and contempo-rary views about its behavioral and physiological significance.An introduction to special topic papers: part I. Neurocase1999;5:225–229.
18. Galton CJ, Patterson K, Xuereb JH, Hodges JR. Atypical andtypical presentations of Alzheimer’s disease: a clinical, neuro-psychological, neuroimaging and pathological study of 13cases. Brain 2000;123 Pt 3:484–498.
19. Read SL, Miller BL, Mena I, Kim R, Itabashi H, Darby A.SPECT in dementia: clinical and pathological correlation.J Am Geriatr Soc 1995;43:1243–1247.
20. Folstein MF, Folstein SE, McHugh PR. “Mini-mental state”. Apractical method for grading the mental state of patients forthe clinician. J Psychiat Res 1975;12:189–198.
21. Delis DC, Lucas JA, Kopelman MD. Memory. In: Fogel BS,Schiffer RB, Rao SM, eds. Synopsis of neuropsychiatry. Phila-delphia: Lippincott, Williams & Wilkins; 2000:169–191.
22. Kaplan E, Goodglass H, Wintraub S. The Boston NamingTest. Philadelphia: Lea and Febiger, 1983.
23. Reitan RM. Validity of the Trailmaking Test as an indicationof organic brain damage. Percept Mot Skills 1958;8:271–276.
24. Cummings JL. The Neuropsychiatric Inventory. Assessingpsychopathology in dementia patients. Neurology 1997;48:S10–16.
25. Levy ML, Miller BL, Cummings JL, Fairbanks LA, Craig A.Alzheimer disease and frontotemporal dementias. Behavioraldistinctions. Arch Neurol 1996;53:687–690.
26. Evans AC, Kamber M, Collins DL, Macdonald D. An MRI-based probabilistic atlas of neuroanatomy. In: Shorvon S, FishD, Andermann F, Bydder GM, Stefan H, eds. Magnetic reso-nance scanning and epilepsy: Plenum Press; 1994:263–274.
28. Friston K, Holmes A, Worsley K, Poline J-P, Frith C, Frack-owiak R. Statistical parametric map in functional imaging: ageneral linear approach. Hum Brain Mapp 1995;2:189–210.
29. Duvornoy HM. The human brain. Surface, three-dimensionalsectional anatomy with MRI, and blood supply. New York:Springer-Verlag Wein; 1999.
30. Talairach J, Tournoux P. Co-planar stereotaxic atlas of the hu-man brain: 3-Dimensional proportional system; an approach tocerebral imaging. Stuttgart: George Thieme Verlag; 1988.
31. Rylander G. Personality changes after operations on the fron-tal lobes. Acta Psychiatr Scand (suppl) 1939;20.
32. Eslinger PJ, Damasio AR. Severe disturbance of higher cogni-tion after bilateral frontal lobe ablation: patient EVR. Neurol-ogy 1985;35:1731–1741.
33. Damasio H, Grabowski T, Frank R, Galaburda AM, DamasioAR. The return of Phineas Gage: clues about the brain fromthe skull of a famous patient. Science 1994;264:1102–1105.
34. Rolls ET, Hornak J, Wade D, McGrath J. Emotion-relatedlearning in patients with social and emotional changes associ-
January (2 of 2) 2002 NEUROLOGY 58 207
ated with frontal lobe damage. J Neurol Neurosurg Psychiatry1994;57:1518–1524.
35. Bechara A, Tranel D, Damasio H, Damasio AR. Failure to re-spond autonomically to anticipated future outcomes followingdamage to prefrontal cortex. Cereb Cortex 1996;6:215–225.
36. Rolls ET. The orbitofrontal cortex and reward. Cereb Cortex2000;10:284–294.
37. Saver JL, Damasio AR. Preserved access and processing of socialknowledge in a patient with acquired sociopathy due to ventro-medial frontal damage. Neuropsychologia 1991;29:1241–1249.
38. Miller BL, Darby A, Benson DF, Cummings JL, Miller MH.Aggressive, socially disruptive and antisocial behaviour asso-ciated with fronto-temporal dementia. Br J Psychiatry 1997;170:150–154.
39. Chui H, Willis L. Vascular diseases of the frontal lobes. In:Miller BL, Cummings JL, eds. The human frontal lobes. NewYork: Guilford; 1999:370–401.
40. Shima K, Tanji J. Role for cingulate motor area cells in volun-tary movement selection based on reward. Science 1998;282:1335–1338.
41. Graybiel AM, Rauch SL. Toward a neurobiology of obsessive-compulsive disorder. Neuron 2002;28:343–347.
42. Mendez MF, Perryman KM, Miller BL, Swartz JR, CummingsJL. Compulsive behaviors as presenting symptoms of frontotem-poral dementia. J Geriatr Psychiatry Neurol 1997;10:154–157.
43. Augustine JR. Circuitry and functional aspects of the insularlobe in primates including humans. Brain Res Brain Res Rev1996;22:229–244.
44. Critchley HD, Elliott R, Mathias CJ, Dolan RJ. Neural activ-ity relating to generation and representation of galvanic skinconductance responses: a functional magnetic resonance imag-ing study. J Neurosci 2000;20:3033–3040.
45. Damasio AR. The somatic marker hypothesis and the possiblefunctions of the prefrontal cortex. Philosophical Transactionsof the Royal Society of London, Series B: Biological Sciences1996;351:1413–1420.
46. Dronkers NF. A new brain region for coordinating speecharticulation. Nature 1996;384:159–161.
47. Lavenu I, Pasquier F, Lebert F, Petit H, Van der Linden M.Perception of emotion in frontotemporal dementia and Alzhei-mer disease. Alzheimer Dis Assoc Disord 1999;13:96–101.
48. Snowden JS, Bathgate D, Varma A, Blackshaw A, GibbonsZC, Neary D. Distinct behavioural profiles in frontotemporaldementia and semantic dementia. J Neurol Neurosurg Psychi-atry 2001;70:323–332.
49. Perry RJ, Rosen HR, Kramer JH, Beer JS, Levenson RL,Miller BL. Hemispheric dominance for emotions, empathy andsocial behaviour: evidence from right and left handers withfrontotemporal dementia. Neurocase 2001;7:145–160.
50. Amaral DG, Price JL, Pitkanen A, Carmichael ST. Anatomicalorganization of the primate amygdaloid complex. In: AggletonJP, ed. The amygdala: neurobiological aspects of emotion, mem-ory and mental dysfunction. New York: Wiley-Liss; 1992:1–66.
51. Adolphs R, Tranel D, Hamann S, et al. Recognition of facialemotion in nine individuals with bilateral amygdala damage.Neuropsychologia 1999;37:1111–1117.
52. Hornak J, Rolls ET, Wade D. Face and voice expression iden-tification in patients with emotional and behavioural changesfollowing ventral frontal lobe damage. Neuropsychologia 1996;34:247–261.
53. Buchel C, Dolan RJ, Armony JL, Friston KJ. Amygdala-hippocampal involvement in human aversive trace condition-ing revealed through event-related functional magneticresonance imaging. J Neurosci 1999;19:10869–10876.
54. Buchel C, Dolan RJ. Classical fear conditioning in functionalneuroimaging. Curr Opin Neurobiol 2000;10:219–223.
55. Phillips ML, Young AW, Scott SK, et al. Neural responses tofacial and vocal expressions of fear and disgust. Proceedings ofthe Royal Society of London Series B: Biological Sciences1998;265:1809–1817.
56. Gorno–Tempini ML, Pradelli S, Serafini M, et al. Explicit andincidental facial expression processing: an fMRI study. Neuro-image 2001;14:465–473.
57. Franzen EA, Myers RE. Neural control of social behavior:prefrontal and anterior temporal cortex. Neuropsychologia1972;11:141–157.
208 NEUROLOGY 58 January (2 of 2) 2002
DOI 10.1212/WNL.58.2.198 2002;58;198Neurology
Tempini, W. P. Goldman, et al.−H. J. Rosen, M. L. GornoPatterns of brain atrophy in frontotemporal dementia and semantic dementia
April 11, 2013This information is current as of
ServicesUpdated Information &
http://www.neurology.org/content/58/2/198.full.htmlincluding high resolution figures, can be found at:
_dementiahttp://www.neurology.org/cgi/collection/all_cognitive_disordersAll Cognitive Disorders/Dementiafollowing collection(s):This article, along with others on similar topics, appears in the
Permissions & Licensing
http://www.neurology.org/misc/about.xhtml#permissionstables) or in its entirety can be found online at: Information about reproducing this article in parts (figures,