Patterns of Transcriptome Divergencein the Male Accessory Gland of Two Closely
Related Species of Field CricketsJose A. Andrés,*,1 Erica L. Larson,† Steven M. Bogdanowicz,† and Richard G. Harrison†
*Department of Biology, University of Saskatchewan, Saskatoon, Saskatchewan S7N-1E5, Canada, and†Department of Ecology and Evolutionary Biology, Cornell University, Ithaca, New York 14853
ABSTRACT One of the central questions in evolutionary genetics is how much of the genome is involved in the early stages ofdivergence between populations, causing them to be reproductively isolated. In this article, we investigate genomic differentiation ina pair of closely related field crickets (Gryllus firmus and G. pennsylvanicus). These two species are the result of allopatric divergenceand now interact along an extensive hybrid zone in eastern North America. Genes encoding seminal fluid proteins (SFPs) are oftendivergent between species, and it has been hypothesized that these proteins may play a key role in the origin and maintenance ofreproductive isolation between diverging lineages. Hence, we chose to scan the accessory gland transcriptome to enable directcomparisons of differentiation for genes known to encode SFPs with differentiation in a much larger set of genes expressed in thesame tissue. We have characterized differences in allele frequency between two populations for .6000 SNPs and .26,000 contigs.About 10% of all SNPs showed nearly fixed differences between the two species. Genes encoding SFPs did not have significantlyelevated numbers of fixed SNPs per contig, nor did they seem to show larger differences than expected in their average allelefrequencies. The distribution of allele frequency differences across the transcriptome is distinctly bimodal, but the relatively highproportion of fixed SNPs does not necessarily imply “ancient” divergence between these two lineages. Further studies of linkagedisequilibrium and introgression across the hybrid zone are needed to direct our attention to those genome regions that are importantfor reproductive isolation.
THE study of speciation, defined as the origin of intrinsicbarriers to gene exchange (Mayr 1942; Harrison 1998;
Coyne and Orr 2004), relies on comparisons of phenotypesand genotypes among diverging populations, strains, sub-species, or closely related species. In recently diverged taxa,observed differences in genotypes or phenotypes are likelyto be associated with the origin of reproductive barriers andless likely to be differences that have accumulated subsequentto initial divergence. As Templeton (1981) emphasized, ourultimate goal is to understand the genetics of speciation, notsimply the genetics of species differences.
It is now widely recognized that the amount of divergencebetween populations or species will vary across the genome
due to selective and random lineage sorting from poly-morphic ancestral populations and differential introgressionwhen diverging taxa hybridize where their distributions over-lap (Harrison 1991; Wu 2001; Turner et al. 2005; Nosil et al.2009). Barton and Hewitt (1981) explicitly argued that geneexchange between hybridizing taxa will depend on genomeregion. Differential introgression has been widely discussedand documented in the hybrid zone literature (Harrison1990; Rieseberg et al. 1999; Payseur 2010), where speciesboundaries have been described as semipermeable. Chromo-some regions that harbor genes that contribute to reproduc-tive isolation or local adaptation will have reduced levels ofgene flow.
The notion that genomes should be viewed as mosaics ofdifferent evolutionary histories also emerges from observa-tions of discordance among individual gene genealogies forclosely related groups of species (Beltran et al. 2002; Machadoand Hey 2003; Dopman et al. 2005; Putnam et al. 2007;Geraldes et al. 2008; White et al. 2009; Carneiro et al. 2010).
Some loci reveal species to be reciprocally monophyletic orexclusive; at other loci, haplotypes do not sort by species andmay even be shared across species. Genome scans of allelefrequencies for microsatellite loci, AFLPs, or SNPs also suggestsubstantial heterogeneity in amounts of differentiation with“FST outliers” marking regions that have become (or haveremained) differentiated (Emelianov et al. 2004; Grahameet al. 2006; Via and West 2008; Wood et al. 2008). Theseobservations have given rise to a diversity of terms that referto the fact that genome divergence is heterogeneous and thatwe can exploit this heterogeneity to identify gene regions thatcontribute to reproductive isolation and/or have experienceda recent selective sweep. Increasingly sophisticated molec-ular tools and the ease with which we can generate mas-sive amounts of sequence data make it far easier to scan thegenome (or parts of the genome with reduced complexity)and search for regions that exhibit fixed differences or majorshifts in allele frequencies between recently diverged taxa.
An alternative to the genome-scan approach is to identifycandidate genes/proteins that might account for phenotypicdifferences responsible for reproductive barriers. Consider-able attention has recently focused on the evolution of seminalfluid proteins (SFPs) in a wide variety of taxa (Dorus et al.2004; Clark et al. 2006; Walters and Harrison 2010; Waltersand Harrison 2011). In insects, male accessory glands are thesite of synthesis and secretion of SFPs that are transferred frommale to female during copulation (Wolfner 1997; Gillott2003). Evolutionary genetic analyses have revealed that,although most of these proteins are subject to selective con-straints, many are rapidly evolving, partly as the result ofdifferential selection pressures (Andrés et al. 2006; Deanet al. 2008, 2009; Ramm et al. 2009; Walters and Harrison2010, 2011). Although the functional and evolutionary con-sequences of this rapid divergence are not fully understood,experimental work suggests that SFPs may play a key role inreproductive isolation between diverging lineages (Andrésand Arnqvist 2001; Turner and Hoekstra 2008; Marshallet al. 2011). Thus, a priori, we might expect genes encodingSFPs to show elevated rates of molecular evolution and greaterdivergence between closely related species.
Here we combine the candidate gene and genome-scanapproaches, using high-throughput sequencing to survey themale accessory gland transcriptomes of two closely relatedspecies of field crickets that interact in a well-characterizedhybrid zone in North America. The two cricket species (Gryllusfirmus and Gryllus pennsylvanicus) are estimated to have di-verged �200,000 years ago (Broughton and Harrison 2003;Maroja et al. 2009). Attempts to identify fixed differencesbetween the species have met with only limited success. Allo-zyme surveys and sequencing of mitochondrial DNA andnuclear gene introns failed to identify the two species asexclusive groups (Harrison and Arnold 1982; Willett et al.1997; Broughton and Harrison 2003). However, analysisof anonymous nuclear RFLPs did uncover four apparentlydiagnostic loci (Harrison and Bogdanowicz 1997). Thesedata suggest that much of the field cricket genome has
remained undifferentiated following the origin of repro-ductive barriers. In contrast, recent proteomic analysis ofspermatophore contents identified two SFP genes that exhibitnearly fixed differences and strong evidence that positive se-lection has been responsible for patterns of differentiation(Andres et al. 2008; Maroja et al. 2009).
In this article, we used both Sanger and 454 sequencingto assemble and characterize the transcriptome of the malecricket accessory gland. To detect SNPs, we then alignedmillions of pooled Illumina reads from allopatric populationsof each species to the Sanger/454 reference transcriptome.We characterized differences in allele frequency between thetwo populations for .6000 SNPs and .26,000 contigs andidentified a subset of highly differentiated SNPs and contigsshowing strong allele frequency differences. Using Sangersequencing in a larger sample of crickets from the same allo-patric populations, we confirmed that a sample of divergentcontigs identified from Illumina reads indeed representssequences that are highly divergent between the two cricketpopulations. Finally, we compared the patterns of transcrip-tome differentiation for SFP genes with genes expressed inthe male accessory gland that are not SFPs.
Materials and Methods
Cricket samples
All crickets used in this study came from allopatric pop-ulations of the two species G. firmus (from Guilford, CT) andG. pennsylvanicus (from Ithaca, NY). Guilford is close to thehybrid zone and may show limited introgression of G. penn-sylvanicus alleles. Ithaca is more distant from the hybridzone and provides essentially “pure” G. pennsylvanicus. In-dependent samples from these populations were used forconstructing each of the libraries described below (Sanger,454, and Illumina) and for subsequent SNP validation.
Normalized Sanger library
Accessory glands were dissected from 10 anesthetized (chilled)adult male G. firmus (from Guilford, CT). Total RNA wasextracted in TRIZOL (Invitrogen). A single pooled RNA sam-ple was constructed using equimolar amounts of total RNAfrom each male. First-strand cDNA was prepared using theCreator SMART cDNA Synthesis Kit (Clontech). Briefly, com-plementary DNA (cDNA) was synthesized from the RNApool, amplified by 11–13 PCR cycles using a 59 PCR primer(59-AAGCAGTGGTATCAACGCAGAGT-39), and normalizedwith a TRIMMER kit (AXXORA). Normalized cDNA wasdigested with the restriction enzyme SfiI and ligated topDNR-Lib for directional cloning. Ligated cDNA was usedto transform Electromax DH5-a E cells (Invitrogen). Trans-formations were spread onto Luria–Bertani plates containing30 mg/ml chloramphenicol. Colonies were randomly pickedinto 384-well plates containing 50 ml 0.5· AE buffer (Qiagen)per well. Plates were heated at 96� for 5 min, and 1 ml ofsupernatant was used as template for PCR with Platinum Taqpolymerase (Invitrogen) andM13 primers. PCR products were
502 J. A. Andrés et al.
treated with Exonuclease I (New England Biolabs) and ShrimpAlkaline Phosphatase (GE Healthcare) and sequencedwith an M13 primer and BigDye v 3.1 terminators (AppliedBiosystems).
Normalized Roche/454 library
To further characterize the accessory gland transcriptome,total RNA from a single Guilford G. firmus male accessorygland was extracted as described above. The concentrationand quality of the total RNA was determined using an AgilentBioanalyzer 2100. One microgram of total RNAwas combinedwith 12 pmol SMART 39 oligo(dT) primer (59-AAGCAGTGGTATCAACGCAGAGTATTTTCTTTTTTCTTTTTTVN-39), 12 pmolSMART 59 rG primer (5-AAGCAGTGGTATCAACGCAGAGTACGCrGrGrG-39), and RNase-free water in a 10-ml volume.The sample was heated at 65� for 5 min and placed on ice,and the following was added to the reaction: 2 ml 10· reversetranscriptase buffer, 4 ml 25 mM MgCl2, 2 ml 0.1 M DTT, 1 mlRNaseOUT, and 1 ml SuperScript reverse transcriptase (Invi-trogen). The reaction was incubated at 45� for 1 hr, followedby 85� for 5 min. The sample was then diluted 40-fold, and1 ml was PCR-amplified with Platinum Taq polymerase (Invi-trogen) and a SMART IIA PCR primer (59-AAGCAGTGGTATCAACGCAGAGTA-39) for 14 cycles. We used the TRIMMERcDNA normalization kit to normalize the cDNA pool, follow-ing the manufacturer’s instructions.
Normalized cDNA was nebulized, and fragments weresubjected to end repair/adenylation by incubating the cDNAwith ATP, dNTPs, T4 polymerase, T4 polynucleotide kinase,and Taq polymerase (New England Biolabs). Samples wereincubated at room temperature for 20 min (end repair) andat 72� for 20 min (adenylation of 39 ends by Taq polymerase).Normalized cDNA (500 ng) was ligated to titanium adapters Aand B. Ligation products were diluted 100-fold and amplifiedwith the appropriate PCR primers (see Supporting Information,File S1). PCR products were checked on agarose gels, pooled,purified with a Qiaquick PCR purification kit (Qiagen), andsubmitted to the Genomics Facility of the Life Sciences CoreLaboratory Center at Cornell for quantification, bead titration,and 454 sequencing.
Illumina tag libraries
Total RNA was extracted from the accessory gland of in-dividual crickets as described above and quantified on a Nano-drop ND-1000 spectrophotometer. Equal amounts of totalRNA from each cricket were combined in two separate pools,representing 15 G. firmus adult males (from Guilford, CT) and15 G. pennsylvanicus adult males (from Ithaca, NY). First-strand synthesis, PCR amplification, and normalization ofcDNA for each pool was carried out as described above for454 sequencing. The two pools of normalized cDNA werethen submitted to the Genomics Facility at the Cornell LifeSciences Core Laboratories Center for nebulization, end repair,and construction/sequencing of Illumina paired-end fragments(2 · 86 bp). Each species pool of cDNA was run on a singlechannel on a Solexa Genome Analyzer IIx.
Transcriptome assembly and annotation
Initial quality check of the 454 sequences was performedusing Newbler (Margulies et al. 2005). Sanger and 454 readswere combined in a de novo assembly with NGen v2 (Laser-gene 8.1.1, DNASTAR). Reads were end-trimmed (windowlength: five nucleotides with a minimum quality of 20) andscanned/trimmed for the plasmid pDNR-Lib and 454 adapters(mer length = 9, minimum matches = 3, trim length = 20,trim to end = 25). We used assembly parameters that aresimilar to those reported in other transcriptome assemblies(e.g., Vera et al. 2008; Renaut et al. 2010), including anestimate of 100· fixed coverage, an estimated transcrip-tome length of 20 Mb, gap penalty = 25, match size = 19,mismatch penalty = 25, and minimum match percent = 85.Both unassembled (single-read) and multi-read contigs (i.e.,transcripts) were saved to a SeqmanPro file. The resulting fastafile was then used as a reference transcriptome for alignmentof Illumina reads generated from pools of G. firmus and G.pennsylvanicus adult male accessory gland cDNAs. Func-tional annotation was performed using BLAST2GO usingBLASTX and the default parameters.
SNP discovery
We screened the accessory gland transcriptome for SNPsusing NextGene v1.99 (Softgenetics) in a series of sequentialsteps. First, we converted raw Illumina tags to fasta files(median score threshold $20, maximum number of un-called bases#3, called base number for each read$25, trimor reject read when $3 bases with score #16). Second, theconverted reads were sequentially trimmed by the followingsequences: SMART 59 rG primer, SMART PCR primer IIA,and the 39 half of SMART PCR primer IIA. Third, thetrimmed reads of the G. firmus and G. pennsylvanicus poolswere independently aligned to the reference transcriptomeusing one round of condensation and one round of align-ment (unambiguous mapping, matching requirement $12bases, $90% identity, mutation filter #5, SNP allele .1count, coverage .20, forward/reverse balance #0.05, anda read library size range of 50–300 bases). Fourth, result-ing alignments were compared and screened for SNPs us-ing the variant comparison tool. In our SNP analyses, weincluded only single-base substitutions. We excluded dele-tions/insertions and multiple base substitutions.
Transcriptome scan
We defined interspecific SNPs as those homologous sitesthat show base frequency differences between G. firmus andG. pennsylvanicus. Therefore, the ability to correctly identifyand quantify interspecific differences critically depends onthe quality and coverage of the SNPs. Here we used a highlystringent screen strategy aimed at finding reliable interspe-cific SNPs. First, we considered only SNPs with a high basequality score ($12) and a high total coverage ($40·; $20·in each species). If the coverage was ,100·, we recognizeda SNP only if the rarer nucleotide variant was observed atleast three times. This allowed us to further reduce spurious
SNP identification due to sequencing errors. Otherwise, weconsidered SNPs with a minimum minor allele frequency(MAF) of 1%. This strategy allowed us to identify high-qualitySNPs for which accurate estimates of allele frequency differ-ences between the two species could be obtained. For each ofthe identified SNPs, we then defined the interspecific differ-entiation index (D) as:
D ¼ ��PG f 2 PG p��:
That is, D is the absolute value of the relative frequencydifference of alleles between the two species (see Renautet al. 2010). As opposed to other differentiation statistics(e.g., FST), this estimator is not sensitive to unequal samplesizes (i.e., unequal coverage) in the two species (Renaut et al.2010). Moreover, FST estimators depend on both within- andbetween-population variation, and thus the precise cause ofFST outliers can be difficult to infer. Therefore, absolute allelefrequency differences may be a better indicator of recent se-lection (Strasburg et al. 2012). To identify candidate genesthat may contribute to local adaptation and reproductive iso-lation between the two species, we screened for those tran-scripts (i.e., contigs) that show the largest shifts in theiraverage allele frequencies between the two species. Wecalculated the total number of fixed SNPs for each contig, aswell as the mean interspecific differentiation index:
�D ¼ 1n
Xn
i¼1Di;
where n is the total number of SNPs in a contig. Since �D isnot a very informative estimator of interspecific divergencefor contigs containing a small number of SNPs, our analyseswere limited to those contigs containing three or more SNPs.Furthermore, because �D depends on allele frequency differ-ences (as does FST) and not on the amount of sequence di-vergence between alleles, we also estimated the number offixed differences per site and used this as a metric of sequencedivergence.
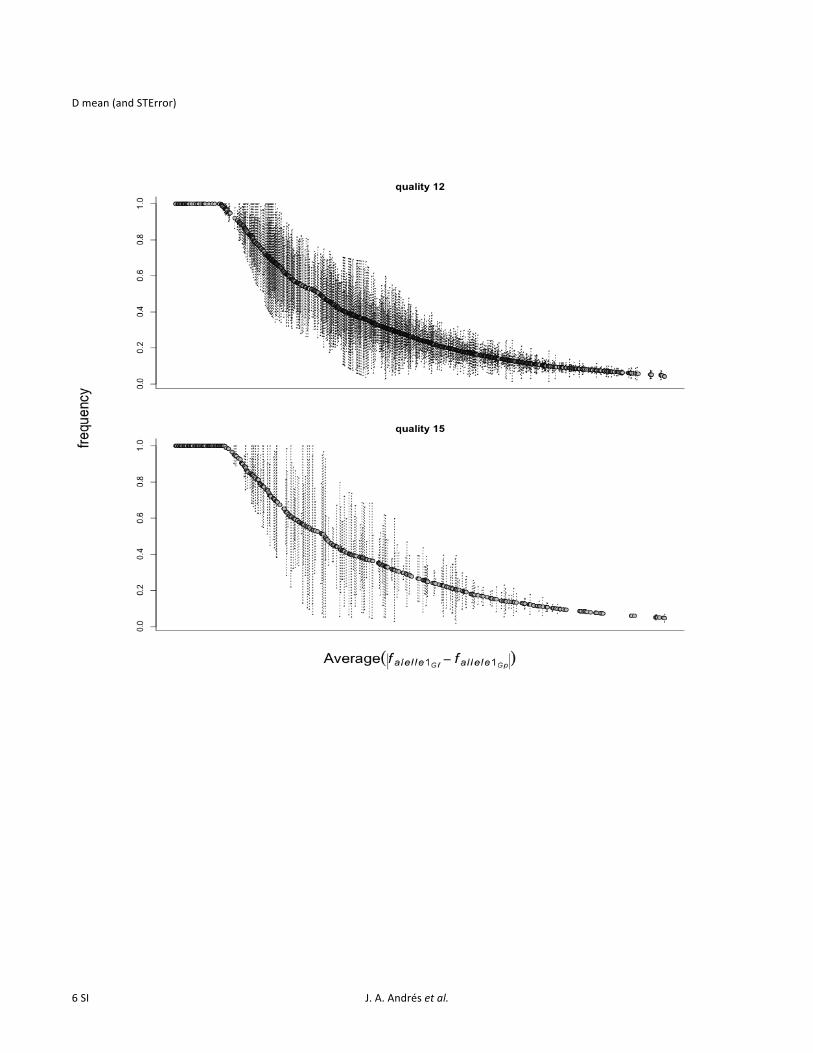
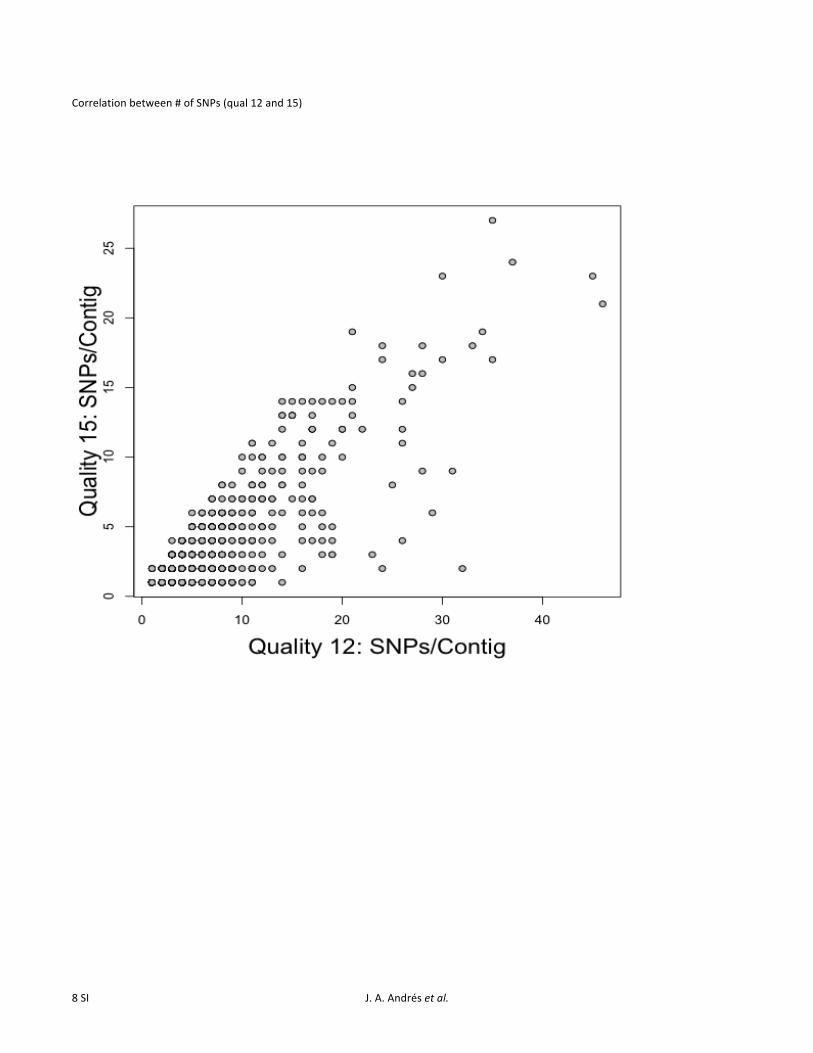
The estimated SNP frequency differences are likely todepend on the set of bioinformatics parameters that we usedto analyze our data; coverage and base quality scores are ofparticular importance. Therefore, we did test for the robust-ness of our results by varying parameter combinations andcomparing the resulting data using permutation analyses (2 ·103 simulations) as implemented in R v2.11.1(R DevelopmentCore Team 2010). Specifically, we tested if either increasingthe quality base threshold ($15 vs. $12) or reducing thecoverage ($30· vs. $40·) had a significant effect on ourresults.
For each contig, we also estimated the number of aminoacid replacement SNPs per nonsynonymous site (pN) rela-tive to the number of silent SNPs per synonymous site (pS).This index is equivalent to v (dN/dS) ratios and, therefore,provides insight into the evolutionary forces driving molec-ular divergence between closely related lineages. We first
generated all possible ORFs (minimum length: 200 nucleo-tides) using Getorf (European Molecular Biology OpenSoftware) and kept the longest ORF of each contig as themost probable coding region of the gene. Then, we used amaximum-likelihood method to estimate pN/pS using PAML4.2 (runmode = 0, CodonFreq = 2, model = 2) (Yang2007). Putative mitochondrial and nuclear contigs wererun separately using icode = 4 and 0, respectively. All anal-yses were carried out using R v2.11.1 and dnds,R, a specificcode kindly provided by Sébastien Renaut (see Renaut et al.2010). Mean pN/pS values were estimated by resampling(Bustamante et al. 2002), excluding those contigs withpS = 0 and infinite pN/pS.
Candidate gene approach
In animals with internal fertilization, a subset of genes encodingSFPs are rapidly evolving and often positively selected; theyrepresent potential candidate barrier genes. We might thenexpect elevated allele frequency differences in genes encodingseminal fluid proteins. To test this hypothesis, we identifiedhigh-quality SNPs by aligning the Illumina tags to a referenceset of 70 previously described SFPs (Andrés et al. 2006,2008), keeping the same parameters used in our transcrip-tome scan. Using permutation analyses (R v2.11.1; R De-velopment Core Team 2010), we first compared �D betweenSFPs and a subset of genes that, based on BLAST results, donot encode SFPs. However, because SFPs often rapidly evolveand their functions are not necessarily determined, it is pos-sible that some fraction of the accessory gland contigs rep-resent SFPs even if they are not currently annotated. Tominimize this potential bias, we extended our analysis tocompare contigs with or without predicted signal peptides(as a proxy for putative SFPs and non-SFPs, respectively).The significance of all permutation analyses was assessedusing 2 · 103 simulations.
Intraspecific polymorphism
To estimate the levels of intraspecific variation, we screenedthe transcriptome of each species for homologous sites exhibit-ing sequence variation. As above, we applied a stringentSNP definition and considered only those variable siteswith a quality score$12 andMAF of 1%. Then, for each contig,we estimated the average number of nucleotide differences(p). Correlational analyses between polymorphism and diver-gence were carried out using Spearman’s r. Significance ofpermutation analyses was assessed as above. All statistical anal-yses were performed using R v2.11.1 (R Development CoreTeam 2010).
SNP validation and gene genealogies
To validate our transcriptome assembly and SNP identifica-tion methods, we used Sanger sequencing to characterizevariation and divergence for a subset of contigs (n = 10)that showed at least three fixed SNPs and high interspe-cific allelic divergence values (�D ranging from 0.85 to 1).We used a new panel of 32 crickets, 16 each from our two
504 J. A. Andrés et al.
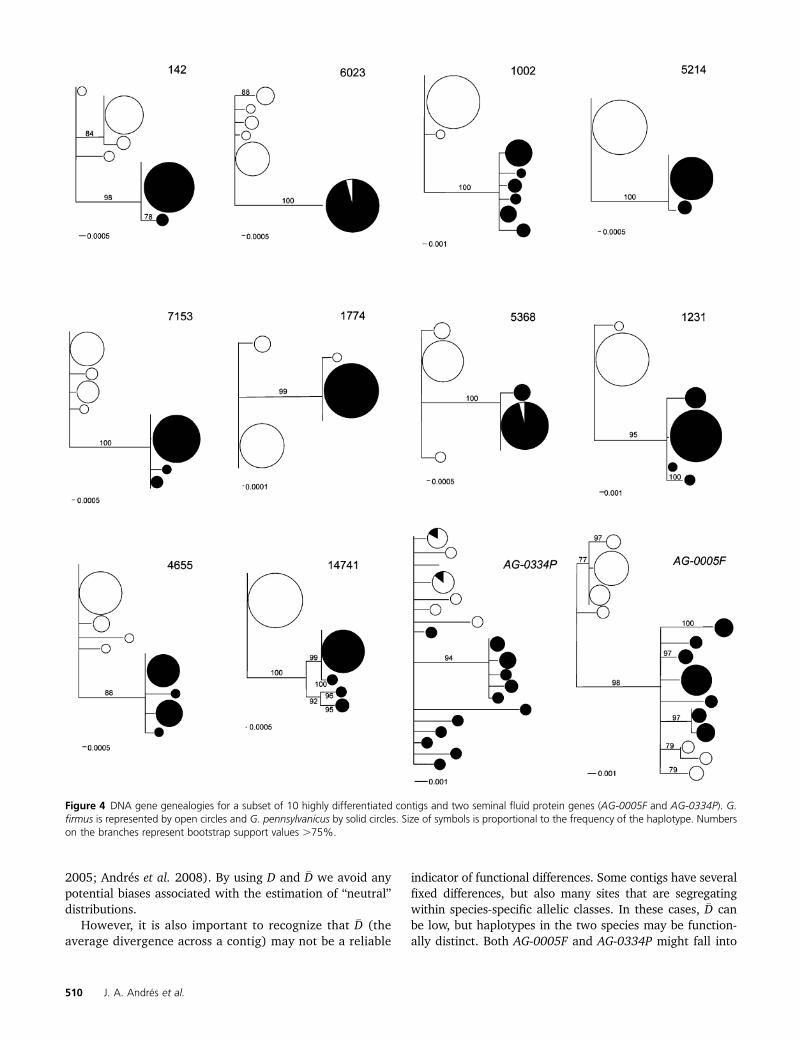
focal populations (G. firmus: Guilford, CT; G. pennsylvani-cus: Ithaca, NY). Collectively, the contigs that we targetedcontained a total of 60 putative SNPs. Selecting these highlydivergent contigs allowed us to validate putative regions ofgenomic differentiation between the two crickets. In addition,we generated gene genealogies for this subset of genes andcompared them with the genealogies of two highly differen-tiated SFP genes (AG-0005F and AG-0334P) that show almostexclusive relationships between the two species (Andrés et al.2008; Maroja et al. 2009).
Predicted SNPs for the 10 loci were validated throughPCR amplification and Sanger sequencing (primer sequencesand conditions available upon request). Resulting ampliconswere sequenced on a 3130xl DNA analyzer (Applied Bio-systems) using BigDye v3.1 terminators. Haplotypes werereconstructed using Phase (Stephens et al. 2001) imple-mented in Arlequin v3.5 (Schneider et al. 2000). For eachcontig, the optimal substitution model was determined usinghierarchical likelihood-ratio test searches implemented in JMo-deltest v0.1.1 (Posada 2008). Gene genealogies were recon-structed using the neighbor-joining (NJ) algorithm in PAUP
v4.0 (Swofford 2003). We calculated nodal support using1000 heuristic nonparametric bootstrap replicates.
Results
Transcriptome assembly and annotation
We have taken advantage of both Sanger sequencing and454 sequencing technologies to characterize the transcrip-tome of the male accessory glands in two Gryllus species.After quality control, the resulting library contains 5.1 · 105
sequences, 9.2 · 106 nucleotides, 26,565 unique contigs(mean length 434 bp), and an average coverage of 4·. Al-though our transcriptome assembly may contain informa-tion on alternatively spliced variants (contig isoforms), wedid not include this information in our assembly. Therefore,all contigs represent the longest isoforms. Illumina readsmapped to a subset of �15,000 contigs (average coverage:G. firmus: 40·, G. pennsylvanicus: 41·), half of them (n =7,931) showing similarities with either functionally anno-tated genes or other insect genomes and ESTs (TBLASTX,e # 1025; Table S1). A significant fraction of these contigs(�30%, 4635/15,000) have a predicted signal peptide, andas expected, some of them (n = 126) represent 42 previ-ously described Gryllus SFPs. Almost 60% of the annotatedgenes (4669/7931) show strong similarities to other knowngenes and do not seem to be components of the seminal fluid(TBLASTX, e # 10210).
Frequency differences between G. firmusand G. pennsylvanicus
To identify SNPs, we mapped 7.6 million and 7.3 millionhigh-quality Illumina reads for G. firmus and G. pennsylvani-cus, respectively, onto the reference transcriptome. If a substan-tial number of the predicted SNPs were the result of randomsequencing and assembly errors, a transition:transversion ra-
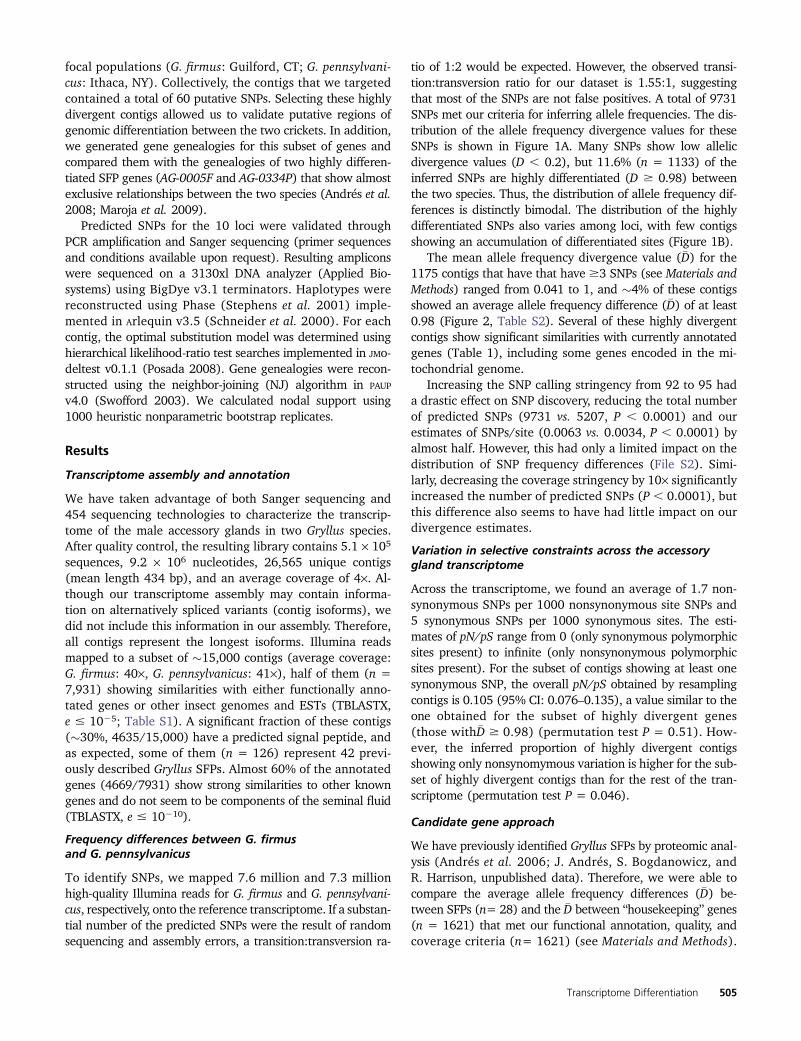
tio of 1:2 would be expected. However, the observed transi-tion:transversion ratio for our dataset is 1.55:1, suggestingthat most of the SNPs are not false positives. A total of 9731SNPs met our criteria for inferring allele frequencies. The dis-tribution of the allele frequency divergence values for theseSNPs is shown in Figure 1A. Many SNPs show low allelicdivergence values (D , 0.2), but 11.6% (n = 1133) of theinferred SNPs are highly differentiated (D $ 0.98) betweenthe two species. Thus, the distribution of allele frequency dif-ferences is distinctly bimodal. The distribution of the highlydifferentiated SNPs also varies among loci, with few contigsshowing an accumulation of differentiated sites (Figure 1B).
The mean allele frequency divergence value (�D) for the1175 contigs that have that have $3 SNPs (see Materials andMethods) ranged from 0.041 to 1, and �4% of these contigsshowed an average allele frequency difference (�D) of at least0.98 (Figure 2, Table S2). Several of these highly divergentcontigs show significant similarities with currently annotatedgenes (Table 1), including some genes encoded in the mi-tochondrial genome.
Increasing the SNP calling stringency from 92 to 95 hada drastic effect on SNP discovery, reducing the total numberof predicted SNPs (9731 vs. 5207, P , 0.0001) and ourestimates of SNPs/site (0.0063 vs. 0.0034, P , 0.0001) byalmost half. However, this had only a limited impact on thedistribution of SNP frequency differences (File S2). Simi-larly, decreasing the coverage stringency by 10· significantlyincreased the number of predicted SNPs (P , 0.0001), butthis difference also seems to have had little impact on ourdivergence estimates.
Variation in selective constraints across the accessorygland transcriptome
Across the transcriptome, we found an average of 1.7 non-synonymous SNPs per 1000 nonsynonymous site SNPs and5 synonymous SNPs per 1000 synonymous sites. The esti-mates of pN/pS range from 0 (only synonymous polymorphicsites present) to infinite (only nonsynonymous polymorphicsites present). For the subset of contigs showing at least onesynonymous SNP, the overall pN/pS obtained by resamplingcontigs is 0.105 (95% CI: 0.076–0.135), a value similar to theone obtained for the subset of highly divergent genes(those with�D $ 0.98) (permutation test P = 0.51). How-ever, the inferred proportion of highly divergent contigsshowing only nonsynomymous variation is higher for the sub-set of highly divergent contigs than for the rest of the tran-scriptome (permutation test P = 0.046).
Candidate gene approach
We have previously identified Gryllus SFPs by proteomic anal-ysis (Andrés et al. 2006; J. Andrés, S. Bogdanowicz, andR. Harrison, unpublished data). Therefore, we were able tocompare the average allele frequency differences (�D) be-tween SFPs (n= 28) and the �D between “housekeeping” genes(n = 1621) that met our functional annotation, quality, andcoverage criteria (n= 1621) (see Materials and Methods).
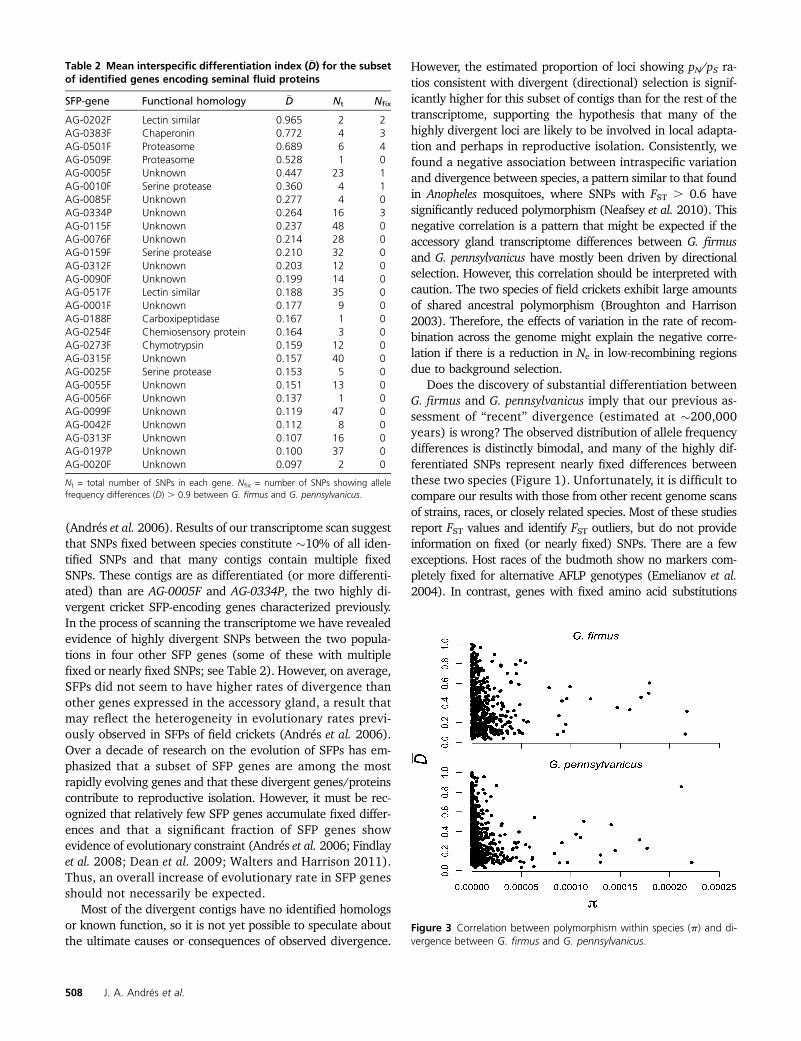
Although some of the SFP genes showed fixed differencesbetween the two species, on average, these genes did notseem to show larger shifts in their average allele frequencies(�DSFPs = 0.336, �Dhousekeeping = 0.416, P = 0.069). Similarresults were obtain by comparing either SFP encoding genesto the subset of “housekeeping” genes with a predicted signalpeptide (n = 231, �DSFPs = 0.336, �Dhousekeeping_signal = 0.402,P = 0.158) or annotated contigs that lack a predicted signalpeptide (n= 1130) with those that have it (n= 491, �Dsignal =0.381, �Dno signal = 0.386, P = 0.754). Table 2 summarizes thevalues of D and the numbers of fixed SNPs for SFP genes thatwe have characterized. Only two of these genes have �D .0.95.
Intraspecific polymorphism
We observed 5996 and 5085 polymorphic nucleotides in G.firmus and G. pennsylvanicus, respectively. Polymorphism levelsare similar between the two species (pGf = 1.38 · 10-5 pGp =1.29 · 10-5, P = 0.761). Indeed, estimates of p for manyof the contigs are roughly equal in both species (r = 0.48,
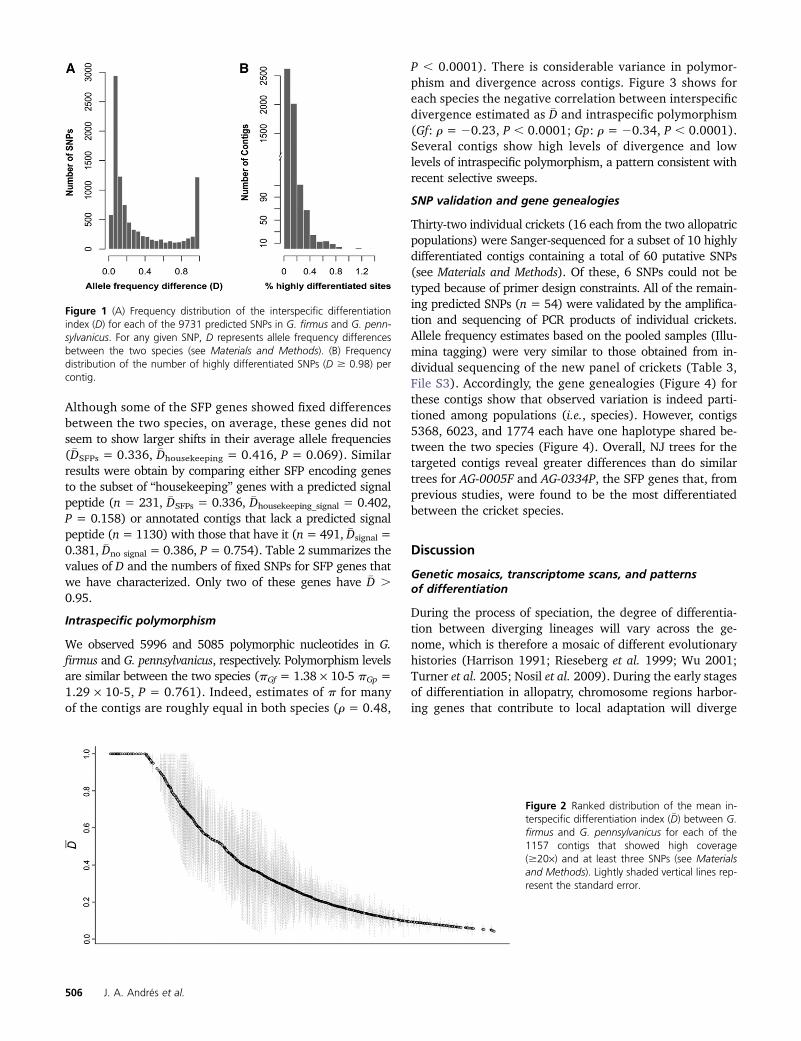
P , 0.0001). There is considerable variance in polymor-phism and divergence across contigs. Figure 3 shows foreach species the negative correlation between interspecificdivergence estimated as �D and intraspecific polymorphism(Gf: r = 20.23, P , 0.0001; Gp: r = 20.34, P , 0.0001).Several contigs show high levels of divergence and lowlevels of intraspecific polymorphism, a pattern consistent withrecent selective sweeps.
SNP validation and gene genealogies
Thirty-two individual crickets (16 each from the two allopatricpopulations) were Sanger-sequenced for a subset of 10 highlydifferentiated contigs containing a total of 60 putative SNPs(see Materials and Methods). Of these, 6 SNPs could not betyped because of primer design constraints. All of the remain-ing predicted SNPs (n = 54) were validated by the amplifica-tion and sequencing of PCR products of individual crickets.Allele frequency estimates based on the pooled samples (Illu-mina tagging) were very similar to those obtained from in-dividual sequencing of the new panel of crickets (Table 3,File S3). Accordingly, the gene genealogies (Figure 4) forthese contigs show that observed variation is indeed parti-tioned among populations (i.e., species). However, contigs5368, 6023, and 1774 each have one haplotype shared be-tween the two species (Figure 4). Overall, NJ trees for thetargeted contigs reveal greater differences than do similartrees for AG-0005F and AG-0334P, the SFP genes that, fromprevious studies, were found to be the most differentiatedbetween the cricket species.
Discussion
Genetic mosaics, transcriptome scans, and patternsof differentiation
During the process of speciation, the degree of differentia-tion between diverging lineages will vary across the ge-nome, which is therefore a mosaic of different evolutionaryhistories (Harrison 1991; Rieseberg et al. 1999; Wu 2001;Turner et al. 2005; Nosil et al. 2009). During the early stagesof differentiation in allopatry, chromosome regions harbor-ing genes that contribute to local adaptation will diverge
Figure 2 Ranked distribution of the mean in-terspecific differentiation index (�D) between G.firmus and G. pennsylvanicus for each of the1157 contigs that showed high coverage($20·) and at least three SNPs (see Materialsand Methods). Lightly shaded vertical lines rep-resent the standard error.
Figure 1 (A) Frequency distribution of the interspecific differentiationindex (D) for each of the 9731 predicted SNPs in G. firmus and G. penn-sylvanicus. For any given SNP, D represents allele frequency differencesbetween the two species (see Materials and Methods). (B) Frequencydistribution of the number of highly differentiated SNPs (D $ 0.98) percontig.
most rapidly. In secondary contact (or in cases of divergencewith gene flow), chromosome regions that contain genesthat contribute to reproductive isolation will have reducedlevels of gene flow. These insights provide the foundationfor a growing list of population genomics studies that aimto identify genomic regions contributing to reproductive iso-lation (e.g., Nosil et al. 2008; Manel et al. 2009; Schwarz et al.2009; Apple et al. 2010; Galindo et al. 2010; Michel et al.2010; Renaut et al. 2010; Fan et al. 2012; Nadeau et al. 2012).
Next-generation sequencing has made it possible to effec-tively scan the genome for specific genes (or gene regions)
that exhibit low gene flow (i.e., fixed differences or majorshifts in allele frequencies) between recently divergedtaxa. We chose to scan the accessory gland transcriptomeof hybridizing field crickets to enable direct comparisons ofdifferentiation for genes known to encode SFPs with dif-ferentiation at a much larger set of genes expressed in thesame tissue. It has been hypothesized that, in crickets, genesencoding SFPs are likely to contribute to postmating repro-ductive isolation between closely related species, and we havepreviously shown (using comparisons of dN and dS) that someSFPs exhibit rapid evolution and evidence of positive selection
Table 1 Annotation of most divergent contigs between G. firmus and G. pennsylvanicus [i.e., those showing interspecific differentiationindex (�D) . 0.98]
SNPs
Contig Total Per site pN/pS TBLASTX similarity
70 10 0.0056 N Cytochrome b310 9 0.0082 0.348 NADH dehydrogenase subunit 2 (ND2)454 6 0.0073 — Teleogryllus emma mitochondrion755 6 0.0026 0.612 NS618 5 0.0037 N Conserved protein (similar to cyclin-D1-binding protein 1)1341 5 0.0044 0.076 Citrate lyase b-like protein1699 5 0.0018 — Similar to Tribolium castaneum ADP ribosylation factor1774 5 0.0040 0 NS1903 5 0.0026 0.090 NS1978 5 0.0075 N Similar to conserved hypothetical protein5368 5 0.0068 0.411 NS1309 4 0.0023 0 Similar to T. castaneum B52 CG10851-PA1412 4 0.0041 — Insect conserved protein1721 4 0.0061 0 Similar to Gryllus bimaculatus mRNA, GBcontig282185711 4 0.0053 0.878 GalNAc transferase 6-like7164 4 0.0065 — NS14713 4 0.0092 — NS87 3 0.0021 0 Similar to G. bimaculatus mRNA, GBcontig31800580 3 0.0037 — Similar to Nasonia vitripennis p15-2a protein937 3 0.0021 N Dynactin subunit 4 (Dctn4)963 3 0.0038 — Similar to growth hormone-inducible soluble protein1101 3 0.0017 0.130 NS1275 3 0.0021 N Protease regulatory subunit S10B1306 3 0.0045 — Similar to translocase of outer membrane 71374 3 0.0033 N Conserved protein: unknown1415 3 0.0023 — Myosin essential light chain1513 3 0.0026 N UBX domain-containing protein1667 3 0.0033 — Similar to G. bimaculatus mRNA, GBcontig120282182 3 0.0023 — Histone h2a2658 3 0.0022 0.562 NS3084 3 0.0019 — Similar to Glossina morsitans mRNA3432 3 0.0053 N Similar to DnaJ (Hsp40)3566 3 0.0036 — NS3758 3 0.0026 N NADH dehydrogenase. Mitochondrial3843 3 0.0017 0 Translation initiation factor 4 gamma4655 3 0.0037 0.148 Conserved protein: unknown5777 3 0.0015 N Similar to transport and Golgi organization 1 (Tango1)6030 3 0.0035 0.147 Ethanolaminephosphotransferase8373 3 0.0044 N Asparagine synthetase9851 3 0.0050 0 NS14741 3 0.0115 0.570 Similar to eritrophin-like protein 16271 3 0.0114 — NS6026 3 0.0035 — v-Amidase (NIT2-B)4450 3 0.0035 — Similar to G. bimaculatus mRNA, GBcontig24459861 4 0.0042 0.143 Ribulose-5-phosphate-3-epimerase mRNA
Contigs in boldface type correspond to mitochondrial loci. NS, nonsignificant (E-value . 1023) similarity.
Transcriptome Differentiation 507
(Andrés et al. 2006). Results of our transcriptome scan suggestthat SNPs fixed between species constitute �10% of all iden-tified SNPs and that many contigs contain multiple fixedSNPs. These contigs are as differentiated (or more differenti-ated) than are AG-0005F and AG-0334P, the two highly di-vergent cricket SFP-encoding genes characterized previously.In the process of scanning the transcriptome we have revealedevidence of highly divergent SNPs between the two popula-tions in four other SFP genes (some of these with multiplefixed or nearly fixed SNPs; see Table 2). However, on average,SFPs did not seem to have higher rates of divergence thanother genes expressed in the accessory gland, a result thatmay reflect the heterogeneity in evolutionary rates previ-ously observed in SFPs of field crickets (Andrés et al. 2006).Over a decade of research on the evolution of SFPs has em-phasized that a subset of SFP genes are among the mostrapidly evolving genes and that these divergent genes/proteinscontribute to reproductive isolation. However, it must be rec-ognized that relatively few SFP genes accumulate fixed differ-ences and that a significant fraction of SFP genes showevidence of evolutionary constraint (Andrés et al. 2006; Findlayet al. 2008; Dean et al. 2009; Walters and Harrison 2011).Thus, an overall increase of evolutionary rate in SFP genesshould not necessarily be expected.
Most of the divergent contigs have no identified homologsor known function, so it is not yet possible to speculate aboutthe ultimate causes or consequences of observed divergence.
However, the estimated proportion of loci showing pN/pS ra-tios consistent with divergent (directional) selection is signif-icantly higher for this subset of contigs than for the rest of thetranscriptome, supporting the hypothesis that many of thehighly divergent loci are likely to be involved in local adapta-tion and perhaps in reproductive isolation. Consistently, wefound a negative association between intraspecific variationand divergence between species, a pattern similar to that foundin Anopheles mosquitoes, where SNPs with FST . 0.6 havesignificantly reduced polymorphism (Neafsey et al. 2010). Thisnegative correlation is a pattern that might be expected if theaccessory gland transcriptome differences between G. firmusand G. pennsylvanicus have mostly been driven by directionalselection. However, this correlation should be interpreted withcaution. The two species of field crickets exhibit large amountsof shared ancestral polymorphism (Broughton and Harrison2003). Therefore, the effects of variation in the rate of recom-bination across the genome might explain the negative corre-lation if there is a reduction in Ne in low-recombining regionsdue to background selection.
Does the discovery of substantial differentiation betweenG. firmus and G. pennsylvanicus imply that our previous as-sessment of “recent” divergence (estimated at �200,000years) is wrong? The observed distribution of allele frequencydifferences is distinctly bimodal, and many of the highly dif-ferentiated SNPs represent nearly fixed differences betweenthese two species (Figure 1). Unfortunately, it is difficult tocompare our results with those from other recent genome scansof strains, races, or closely related species. Most of these studiesreport FST values and identify FST outliers, but do not provideinformation on fixed (or nearly fixed) SNPs. There are a fewexceptions. Host races of the budmoth show no markers com-pletely fixed for alternative AFLP genotypes (Emelianov et al.2004). In contrast, genes with fixed amino acid substitutions
Figure 3 Correlation between polymorphism within species (p) and di-vergence between G. firmus and G. pennsylvanicus.
Table 2 Mean interspecific differentiation index (�D) for the subsetof identified genes encoding seminal fluid proteins
Nt = total number of SNPs in each gene. Nfix = number of SNPs showing allelefrequency differences (D) . 0.9 between G. firmus and G. pennsylvanicus.
508 J. A. Andrés et al.
between forms occur throughout the genome in comparisonsof the M and S forms of Anopheles gambiae (Lawniczak et al.2010). Because we have sampled only single populations ofthe two cricket species, it is likely that a fraction of the highlydivergent SNPs found in our study represent frequency differ-ences between populations rather than frequency differencesbetween species and that our divergence estimate is thereforeelevated. However, it is clear that the hybridizing field cricketsare not as recently diverged as many insect host races (e.g.,budmoth, apple maggot, pea aphid), many of which havebeen cited as exemplars of ecological speciation and/or sym-patric speciation (Emelianov et al. 2004; Via and West 2008;Michel et al. 2010). The observed pattern of trancriptome di-vergence in crickets is reminiscent of the summary figuresshowing divergence for allozyme loci in subspecies or semi-species in the Drosophila willistoni group (Ayala et al. 1974;Ayala 1975; Avise 1976) and in Lepomis sunfish (Avise 1994).Both the D. willistoni group and the genus Lepomis providedearly model systems for studying genetic differentiation dur-ing the process of geographic speciation. Although conspecificpopulations exhibited allele frequency differences at someloci, only in recognized subspecies or semispecies was therea small proportion of loci with fixed or nearly fixed differ-ences. These loci, it was suggested, were those important forlocal adaptation (Ayala 1975; Avise 1976). The proportion ofloci with fixed differences increased dramatically (to .30%of all loci) when sibling species were compared. Allozymestudies reveal differences in the frequencies of charge-changingamino acid substitutions, a presumably small subset of thedifferences that we can identify in transcriptome scans. Con-sistent with this interpretation is the earlier observation thatthere are no allozyme loci that exhibit fixed differences inallele frequency between G. firmus and G. pennsylvanicus.Although by no means conclusive, these observations areconsistent with recent divergence of the two cricket spe-cies, at least relative to other model systems for geographicspeciation.
Ascertainment bias, mapping bias, and sampling error
Our use of pooled DNA samples for SNP discovery andtranscriptome wide scans of allele frequencies could raisequestions about ascertainment bias, mapping bias, and sam-pling error. Because of the relatively high sequencing errorassociated with high-throughput sequencing, SNP detec-tion has focused on minimizing the false-positive rate byconsidering only SNPs occurring more than a predefinednumber of times (e.g., Galindo et al. 2010; Renaut et al.2010), a SNP-calling criterion that generates a systematicbias by excluding many rare alleles from the data. This, inturn, may lead to biased estimates of several population ge-netic parameters, potentially compromising the ability to iden-tify outlier loci (see Helyar et al. 2011). Mapping bias canarise from the assembly of tags from one lineage to a ref-erence transcriptome from a different lineage. This bias islikely to be more severe in highly differentiated regions ofthe genome and in comparisons involving distantly relatedlineages. Sampling error in pooled samples has two differ-ent sources: first, the number of individuals included inthe pool and, second, the unequal representation of indi-vidual alleles. This second error source arises because ofvariation in RNA amounts among individuals contributingto the pool and because some alleles are sequenced re-peatedly whereas other alleles may not be sequenced atall.
In this article we have attempted to minimize the concernsraised above. First, to reduce ascertainment bias and samplingerror, we have identified putative SNPs using a relatively largepanel of alleles (2n= 60), and we have considered only thoseSNPs with high coverage ($20·). Two recent studies suggestthat variation associated with heterogeneity in the probe ma-terial (RNA) is not a serious problem and can be kept small bycombining relatively large pools (2n .100) with relativelydeep (10–60·) sequence coverage (Futschik and Schlotterer2010; Galindo et al. 2010). Our results strongly suggest thatrelatively modest coverage (20·) and smaller pools still resultin reliable identification of SNPs. In fact, our validation exper-iment verified 90% of the predicted SNPs, a fraction similar toresults from other organisms without a reference genome(e.g., Williams et al. 2010; You et al. 2011). Likewise, we founda strong correspondence between the predicted allele frequen-cies based on the pooled samples and those obtained fromSanger sequencing of a different sample of crickets. This resultis similar to those reported in other SNP discovery experimentswith comparable coverage (Van Tassell et al. 2008; Wiedmannet al. 2008).
Second, instead of defining candidate loci by generatingan expected neutral distribution of differentiation valuesand identifying outlier loci (see Butlin et al. 2008), we havedefined candidate loci as those that show a high proportion offixed (or almost) fixed SNPs between species. This approach issimilar to that of studies in which candidate genes are de-fined as those that reveal closely related taxa to be recipro-cally monophyletic or exclusive groups (e.g., Dopman et al.
Table 3 Comparison of the allele frequency differences, estimatedas �D, between G. firmus and G. pennsylvanicus for a subset of highlydifferentiated contigs using pooled Illumina tags and individualSanger sequencing
Also see Materials and Methods. For each experiment, we independently sampledthe same two allopatric populations (Guilford, CT, and Ithaca, NY, respectively). Nind
= total number of individuals sequenced in each experiment. NSNPs = number ofSNPs typed in each contig.
Transcriptome Differentiation 509
2005; Andrés et al. 2008). By using D and �D we avoid anypotential biases associated with the estimation of “neutral”distributions.
However, it is also important to recognize that �D (theaverage divergence across a contig) may not be a reliable
indicator of functional differences. Some contigs have severalfixed differences, but also many sites that are segregatingwithin species-specific allelic classes. In these cases, �D canbe low, but haplotypes in the two species may be function-ally distinct. Both AG-0005F and AG-0334P might fall into
Figure 4 DNA gene genealogies for a subset of 10 highly differentiated contigs and two seminal fluid protein genes (AG-0005F and AG-0334P). G.firmus is represented by open circles and G. pennsylvanicus by solid circles. Size of symbols is proportional to the frequency of the haplotype. Numberson the branches represent bootstrap support values .75%.
510 J. A. Andrés et al.
this category. In addition, some fixed differences detected bytraditional Sanger sequencing do not show up as fixed SNPsin the Illumina reads because the relevant sites fall below ourthresholds for coverage or sequence quality. Thus the numbersof fixed SNPs for AG-0005F and AG-0334P reported in Table 3are less than the numbers that we know to be present fromearlier Sanger sequencing (Andrés et al. 2008). Moreover, thesignificance of fixed SNPs is still uncertain because fixationmay be a consequence of linkage to a different causative locus.Follow-up studies and a detailed linkage map are thereforecritical to establishing the possible link between functionaldivergence and elevated �D values.
Finally, mapping bias does not seem to be important inour study. Although G. pennsylvanicus shows lower levelsof intraspecific polymorphisms as expected if there werereduced ability to map G. pennsylvanicus sequences ontoa G. firmus reference, this result is also consistent with the u
values previously estimated using nuclear introns (Broughtonand Harrison 2003). Moreover, the total number of G. firmusreads mapped onto the reference is only 4% higher than thenumber of mapped G. pennsylvanicus tags, suggesting onlya small bias, if any.
Importance of fixed SNPs
In the study of speciation, a focus on recently diverged taxais important. This partly explains the current attention de-voted to recently diverged (still diverging) sympatric popula-tions or ecotypes, in which rapid adaptive divergence occurs inthe face of gene flow. In this article, we have examinedgenomic divergence between a pair of species that are theresult of a more “conventional” model of allopatric diver-gence, a model that may represent a majority of specia-tion events across all animal taxa. As discussed above, thediscovery of many fixed SNPs does not necessarily imply“ancient” divergence, and the hybrid zone between G.firmus and G. pennsylvanicus remains an important modelto study the origins of reproductive isolation. Hybrid zonesthat result from allopatric divergence and secondary contact(a majority of hybrid zone systems; see Barton and Hewitt1985) provide unique insights into the mechanistic and ge-netic basis of reproductive isolation. These zones representmany generations of hybridization and recombination be-tween differentiated populations and therefore patterns ofintrogression across hybrid zones and patterns of linkagedisequilibrium within hybrid zones direct our attention togenome regions that are important for reproductive iso-lation or regions that have recently experienced selection.The fixed SNPs that we have discovered will allow carefuldissection of patterns of introgression and linkage disequi-librium within the field cricket hybrid zone (see Teeteret al. 2008, 2010; Gompert and Buerkle 2009; Payseur2010). This will bring us a step closer to our ultimate goalof identifying the differences in genotypes or phenotypesthat are more likely associated with the origin of reproduc-tive barriers and less likely to have accumulated subse-quent to initial divergence.
Acknowledgments
We thank members of the Harrison lab for comments on anearlier version of this article. An anonymous reviewer andDavid Begun provided important feedback that resulted ingreater clarity and improved analyses. This work was sup-ported by National Science Foundation grant DEB-0639904 toR.G.H.
Literature Cited
Andrés, J. A., and G. Arnqvist, 2001 Genetic divergence of theseminal signal-receptor system in houseflies: The footprints ofsexually antagonistic coevolution? Proc. R. Soc. Lond. B Biol.Sci. 268: 399–405.
Andrés, J. A., L. S. Maroja, S. M. Bogdanowicz, W. J. Swanson, andR. G. Harrison, 2006 Molecular evolution of seminal proteinsin field crickets. Mol. Biol. Evol. 23: 1574–1584.
Andrés, J. A., L. S. Maroja, and R. G. Harrison, 2008 Searching forcandidate speciation genes using a proteomic approach: seminalproteins in field crickets. Proc. R. Soc. Lond. B Biol. Sci. 275:1975–1983.
Apple, J. L., T. Grace, A. Joern, P. S. Amand, and S. M. Wisely,2010 Comparative genome scan detects host-related divergentselection in the grasshopper Hesperotettix viridis. Mol. Ecol. 19:4012–4028.
Avise, J., 1976 Genetic differentiation during speciation, pp. 106–122 in Molecular Evolution, edited by F. J. Ayala Sinauer Asso-ciates, Sunderland, MA.
Avise, J., 1994 Molecular Markers, Natural History, and Evolution.Chapman and Hall, New York.
Ayala, F. J., 1975 Genetic differentiation during the speciation pro-cess, pp. 1–78 in Evolutionary Biology, edited by T. Dobzhansky,M. K. Hecht, and W. C. Steere. Plenum Press, New York.
Ayala, F. J., M. L. Tracey, D. Hedgecock, and R. C. Richmond,1974 Genetic differentiation during speciation process inDrosophila. Evolution 28: 576–592.
Barton, N. H., and G. M. Hewitt, 1981 A chromosomal cline in thegrasshopper Podisma pedestris. Evolution 35: 1008–1018.
Barton, N. H., and G. M. Hewitt, 1985 Analysis of hybrid zones.Annu. Rev. Ecol. Syst. 16: 113–148.
Beltran, M., C. D. Jiggins, V. Bull, M. Linares, J. Mallet et al.,2002 Phylogenetic discordance at the species boundary: com-parative gene genealogies among rapidly radiating Heliconiusbutterflies. Mol. Biol. Evol. 19: 2176–2190.
Broughton, R. E., and R. G. Harrison, 2003 Nuclear gene genealo-gies reveal historical, demographic and selective factors associatedwith speciation in field crickets. Genetics 163: 1389–1401.
Bustamante, C. D., R. Nielsen, and D. L. Hartl, 2002 A maximumlikelihood method for analyzing pseudogene evolution: implica-tions for silent site evolution in humans and rodents. Mol. Biol.Evol. 19: 110–117.
Butlin, R. K., J. Galindo, and J. W. Grahame, 2008 Sympatric,parapatric or allopatric: The most important way to classifyspeciation? Proc. R. Soc. Lond. B Biol. Sci. 363: 2997–3007.
Carneiro, M., J. A. Blanco-Aguiar, R. Villafuerte, N. Ferrand, and M.W. Nachman, 2010 Speciation in the European rabbit (Oryc-togalus cuniculus): islands of differentiation on the X chrom-some and autosomes. Evolution 64: 3443–3460.
Clark, N. L., J. E. Aagaard, and W. J. Swanson, 2006 Evolution ofreproductive proteins from animals and plants. Reproduction131: 11–22.
Coyne, J. A., and H. A. Orr, 2004 Speciation. Sinauer Associates,Sunderland, MA.
Transcriptome Differentiation 511
Dean, M. D., J. M. Good, and M. W. Nachman, 2008 Adaptiveevolution of proteins secreted during sperm maturation: ananalysis of the mouse epididymal transcriptome. Mol. Biol. Evol.25: 383–392.
Dean, M. D., N. L. Clark, G. D. Findlay, R. C. Karn, X. Yi et al.,2009 Proteomics and comparative genomic investigations re-veal heterogeneity in evolutionary rate of male reproductive pro-teins in mice (Mus domesticus). Mol. Biol. Evol. 26: 1733–1743.
Dopman, E. B., L. Perez, S. M. Bogdanowicz, and R. G. Harrison,2005 Consequences of reproductive barriers for genealogicaldiscordance in the European corn borer. Proc. Natl. Acad. Sci.USA 102: 14706–14711.
Dorus, S., P. D. Evans, G. J. Wyckoff, S. S. Choi, and B. T. Lahn,2004 Rate of molecular evolution of the seminal protein geneSEMG2 correlates with levels of female promiscuity. Nat. Genet.36: 1326–1329.
Emelianov, I., F. Marec, and J. Mallet, 2004 Genomic evidence fordivergence with gene flow in host races of the larch budmoth.Proc. Biol. Sci. 271: 97–105.
Fan, S., K. R. Elmer, and A. Meyer, 2012 Genomics of adaptationand speciation in cichlid fishes: recent advances and analyses inAfrican and Neotropical lineages. Philos. Trans. R. Soc. Lond. BBiol. Sci. 367: 385–394.
Findlay, G., X. Yi, M. Maccoss, and W. J. Swanson, 2008 Proteomicsreveals novel Drosophila seminal fluid proteins transferred at mat-ing. PLoS Biol. 6: 1417–1426.
Futschik, A., and C. Schlotterer, 2010 The next generation of mo-lecular markers from massively parallel sequencing of pooledDNA samples. Genetics 186: 207–218.
Galindo, J., J. W. Grahame, and R. K. Butlin, 2010 An EST-basedgenome scan using 454 sequencing in the marine snail Littorinasaxatilis. J. Evol. Biol. 23: 2004–2016.
Geraldes, A., P. Basset, B. Gibson, K. L. Smith, B. Harr et al.,2008 Inferring the history of speciation in house mice fromautosomal, X-linked, Y-linked and mitochondrial genes. Mol.Ecol. 17: 5349–5363.
Gillott, C., 2003 Male accessory gland secretions: modulators offemale reproductive physiology and behavior. Annu. Rev. Ento-mol. 48: 163–184.
Gompert, Z., and C. A. Buerkle, 2009 A powerful regression-basedmethod for admixture mapping of isolation across the genomeof hybrids. Mol. Ecol. 18: 1207–1224.
Grahame, J. W., C. S. Wilding, and R. K. Butlin, 2006 Adaptationto a steep environmental gradient and an associated barrier togene exchange in Littorina saxatilis. Evolution 60: 268–278.
Harrison, R. G., 1990 Hybrid zones: windows on evolutionaryprocess, pp. 69–128 in Oxford Surveys in Evolutionary Biology,edited by D. Futuyma, and J. Antonovics. Oxford University Press,New York.
Harrison, R. G., 1991 Molecular changes at speciation. Annu. Rev.Ecol. Syst. 22: 281–308.
Harrison, R. G., 1998 Linking evolutionary pattern and process:the relevance of species concepts for the study of speciation, pp.19–31 in Endless Forms: Species and Speciation, edited by D. J.Howard, and S. H. Berlocher. Oxford University Press, NewYork.
Harrison, R., and S. J. Arnold, 1982 A narrow hybrid zone be-tween closely related cricket species. Evolution 36: 535–552.
Harrison, R. G., and S. M. Bogdanowicz, 1997 Patterns of varia-tion and linkage disequilibrium in a field cricket hybrid zone.Evolution 51: 493–505.
Helyar, S. J., J. Hemmer-Hansen, D. Bekkevold, M. I. Taylor, R.Ogden et al., 2011 Application of SNPs for population geneticsof nonmodel organisms: new opportunities and challenges. Mol.Ecol. Resour. 11: 123–136.
Lawniczak, M. K. N., S. J. Emrich, A. K. Holloway, A. P. Regier, M.Olson et al., 2010 Widespread divergence between incipient
Anopheles gambiae species revealed by whole genome sequen-ces. Science 330: 512–514.
Machado, C. A., and J. Hey, 2003 The causes of phylogeneticconflict in a classic Drosophila species group. Proc. R. Soc. Lond.B Biol. Sci. 270: 1193–1202.
Manel, S., C. Conord, and L. Despres, 2009 Genome scan to assessthe respective role of host-plant and environmental constraints onthe adaptation of a widespread insect. BMC Evol. Biol. 9: 288.
Margulies, M., M. Egholm, W. E. Altman, S. Attiya, J. S. Bader et al.,2005 Genome sequencing in microfabricated high-density pico-litre reactors. Nature 437: 376–380.
Maroja, L. S., J. A. Andrés, and R. G. Harrison, 2009 Genealogicaldiscordance and patterns of introgression and selection acrossa cricket hybrid zone. Evolution 63: 2999–3015.
Marshall, J. L., D. L. Huestis, C. Garcia, Y. Hiromasa, S. Wheeleret al., 2011 Comparative proteomics uncovers the signatureof natural selection acting on the ejaculate proteomes of twocricket species isolated by postmating, prezygotic phenotypes.Mol. Biol. Evol. 28: 423–435.
Mayr, E., 1942 Systematics and the Origins of Species. ColumbiaUniversity Press, New York.
Michel, A. P., S. Sim, T. H. Q. Powell, M. S. Taylor, P. Nosil et al.,2010 Widespread genomic divergence during sympatric speci-ation. Proc. Natl. Acad. Sci. USA 107: 9724–9729.
Nadeau, N. J., A. Whibley, R. T. Jones, J. W. Davey, K. K. Dasmahapatraet al., 2012 Genomic islands of divergence in hybridizing Heli-conius butterflies identified by large-scale targeted sequencing.Philos. Trans. R. Soc. Lond. B Biol. Sci. 367: 343–353.
Neafsey, D. E., M. K. N. Lawniczak, D. J. Park, S. N. Redmond, M. B.Coulibaly et al., 2010 SNP genotyping defines complex gene-flow boundaries among African malaria vector mosquitoes. Sci-ence 330: 514–517.
Nosil, P., S. P. Egan, and D. J. Funk, 2008 Heterogeneous geno-mic differentiation between walking-stick ecotypes: “isolationby adaptation” and multiple roles for divergent selection. Evo-lution 62: 316–336.
Nosil, P., D. J. Funk, and D. Ortiz-Barrientos, 2009 Divergentselection and heterogeneous genomic divergence. Mol. Ecol. 18:375–402.
Payseur, B. A., 2010 Using differential introgression in hybridzones to identify genomic regions involved in speciation. Mol.Ecol. Resour. 10: 806–820.
Posada, D., 2008 jModelTest: phylogenetic model averaging. Mol.Biol. Evol. 25: 1253–1256.
Putnam, A. S., J. M. Scriber, and P. Andolfatto, 2007 Discordantdivergence times among Z-chromosome regions between twoecologically distinct swallowtail butterfly species. Evolution 61:912–927.
R Development Core Team, 2010 R: A language and environmentfor statistical computing. R Foundation for Statistical Comput-ing, Vienna, Austria
Ramm, S. A., L. McDonald, J. L. Hurst, R. J. Beynon, and P. Stockley,2009 Comparative proteomics reveals evidence for evolutionarydiversification of rodent seminal fluid and its functional signifi-cance in sperm competition. Mol. Biol. Evol. 26: 189–198.
Renaut, S., A. W. Nolte, and L. Bernatchez, 2010 Mining tran-scriptome sequences towards identifying adaptive single nucle-otide polymorphisms in lake whitefish species pairs (Coregonusspp. Salmonidae). Mol. Ecol. 19: 115–131.
Rieseberg, L. H., J. Whitton, and K. Gardner, 1999 Hybrid zonesand the genetic architecture of a barrier to gene flow betweentwo sunflower species. Genetics 152: 713–727.
Schneider, S., D. Roessli, and L. Excoffier, 2000 Arlequin, Version2.0, a Software for Population Genetics Data Analysis. Universityof Geneva, Geneva.
Schwarz, D., H. M. Robertson, J. L. Feder, K. Varala, M. E. Hudson et al.,2009 Sympatric ecological speciation meets pyrosequencing:
512 J. A. Andrés et al.
sampling the transcriptome of the apple maggot Rhagoletispomonella. BMC Genomics 10: 633.
Stephens, M., N. J. Smith, and P. Donnelly, 2001 A new statisticalmethod for haplotype reconstruction from population data. Am.J. Hum. Genet. 68: 978–989.
Strasburg, J. L., N. A. Sherman, K. M. Wright, L. C. Moyle, J. H.Willis et al., 2012 What can patterns of differentiation acrossplant genomes tell us about adaptation and speciation? Philos.Trans. R. Soc. Lond. B Biol. Sci. 367: 364–373.
Swofford, D. L., 2003 PAUP. Sinauer Associates, Sunderland, MA.Teeter, K. C., B. A. Payseur, L. W. Harris, M. A. Bakewell, L. M.
Thibodeau et al., 2008 Genome-wide patterns of gene flowacross a house mouse hybrid zone. Genome Res. 18: 67–76.
Teeter, K. C., L. M. Thibodeau, Z. Gompert, C. A. Buerkle, M. W.Nachman et al., 2010 The variable genomic architecture ofisolation between hybridizing species of house mice. Evolution64: 472–485.
Templeton, A. R., 1981 Mechanisms of speciation: a populationgenetic approach. Annu. Rev. Ecol. Syst. 12: 23–48.
Turner, L. M., and H. E. Hoekstra, 2008 Causes and consequencesof the evolution of reproductive proteins. Int. J. Dev. Biol. 52:769–780.
Turner, T. L., M. W. Hahn, and S. V. Nuzhdin, 2005 Genomic islandsof speciation in Anopheles gambiae. PLoS Biol. 3: 1572–1578.
Van Tassell, C. P., T. P. L. Smith, L. K. Matukumalli, J. F. Taylor, R.D. Schnabel et al., 2008 SNP discovery and allele frequencyestimation by deep sequencing of reduced representation librar-ies. Nat. Methods 5: 247–252.
Vera, J. C., C. W. Wheat, H. W. Fescemyer, M. J. Frilander, D. L.Crawford et al., 2008 Rapid transcriptome characterization fora nonmodel organism using 454 pyrosequencing. Mol. Ecol. 17:1636–1647.
Via, S., and J. West, 2008 The genetic mosaic suggests a newrole for hitchhiking in ecological speciation. Mol. Ecol. 17:4334–4345.
Walters, J. R., and R. G. Harrison, 2010 Combined EST and pro-teomic analysis identifies rapidly evolving seminal fluid proteinsin Heliconius butterflies. Mol. Biol. Evol. 27: 2000–2013.
Walters, J. R., and R. G. Harrison, 2011 Decoupling of rapid andadaptive evolution among seminal fluid proteins in Heliconius but-terflies with divergent mating systems. Evolution 65: 2855–2871.
White, M. A., C. Ané, C. N. Dewey, B. R. Larget, and B. A. Payseur,2009 Fine-scale phylogenetic discordance across the house mousegenome. PLoS Genet. 5: e1000729.
Wiedmann, R. T., T. P. L. Smith, and D. J. Nonneman, 2008 SNPdiscovery in swine by reduced representation and high through-put pyrosequencing. BMC Genet. 9: 81.
Willett, C. S., M. J. Ford, and R. G. Harrison, 1997 Inferencesabout the origin of a field cricket hybrid zone from a mitochon-drial DNA phylogeny. Heredity 79: 484–494.
Williams, L. M., X. Ma, A. R. Boyko, C. D. Bustamante, and M. F.Oleksiak, 2010 SNP identification, verification, and utility forpopulation genetics in a non-model genus. BMC Genet. 11: 32.
Wolfner, M. F., 1997 Tokens of love: functions and regulation ofDrosophila male accessory gland products. Insect Biochem. Mol.Biol. 27: 179–192.
Wood, H. M., J. W. Grahame, S. Humphray, J. Rogers, and R. K.Butlin, 2008 Sequence differentiation in regions identified bya genome scan for local adaptation. Mol. Ecol. 17: 3123–3135.
Wu, C. I., 2001 The genic view of the process of speciation. J.Evol. Biol. 14: 851–865.
Yang, Z. H., 2007 Paml 4: a program package for phylogeneticanalysis by maximum likelihood. Mol. Biol. Evol. 24: 1586–1591.
You, F. M., N. X. Huo, K. R. Deal, Y. Q. Gu, M. C. Luo et al.,2011 Annotation-based genome-wide SNP discovery in thelarge and complex Aegilops tauschii genome using next-generationsequencing without a reference genome sequence. BMC Genomics12: 59.
Available for download as an excel file at http://www.genetics.org/lookup/suppl/doi:10.1534/genetics.112.142299/-‐/DC1.
J. A. Andrés et al. 10 SI
Table S1 Annotated list of genes Available for download as an excel file at http://www.genetics.org/lookup/suppl/doi:10.1534/genetics.112.142299/-‐/DC1.
J. A. Andrés et al. 11 SI
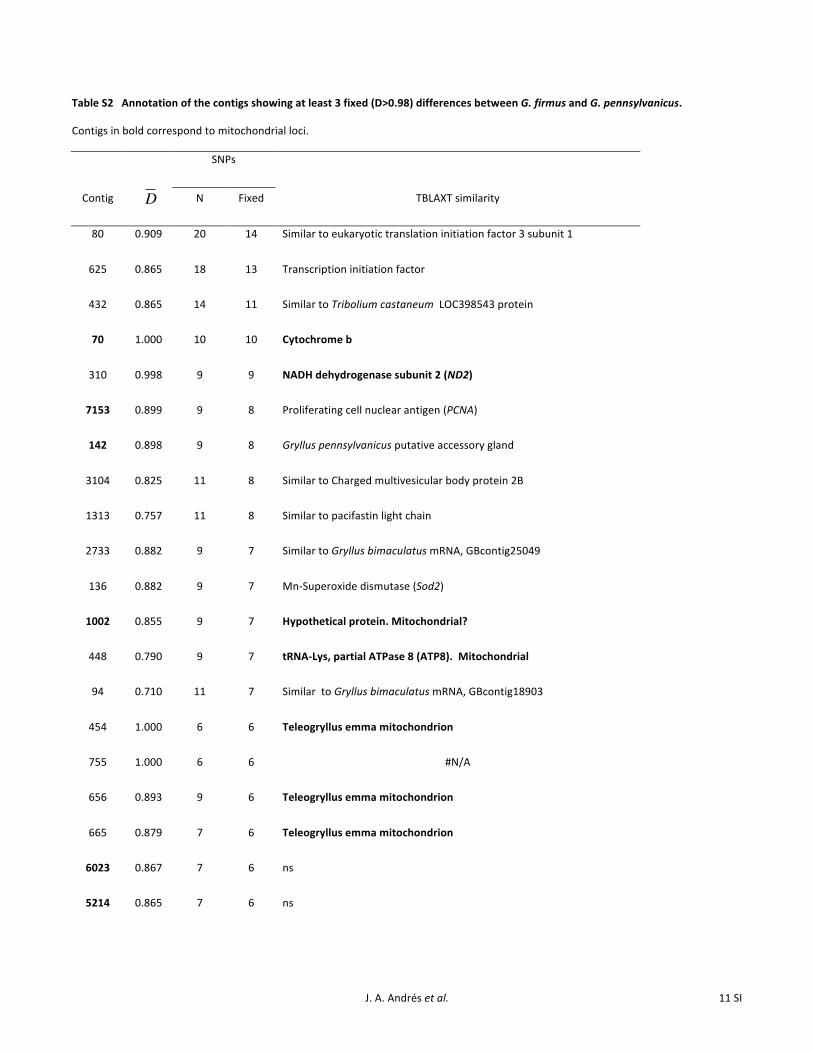
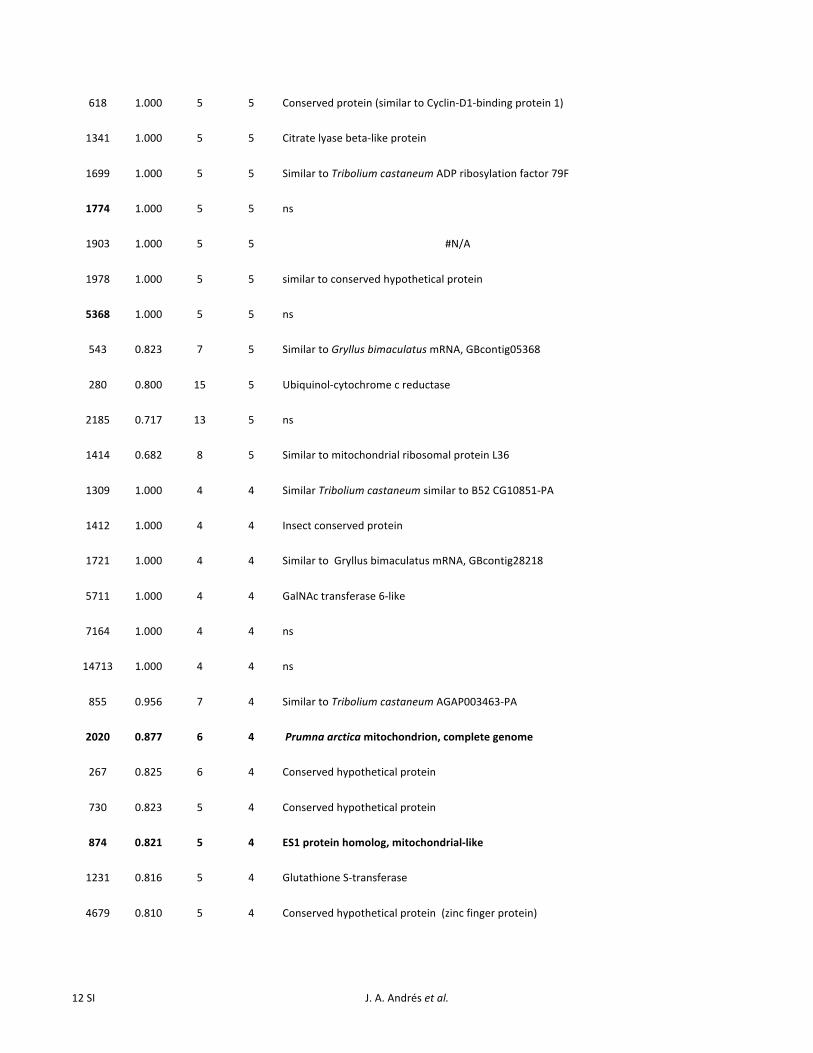
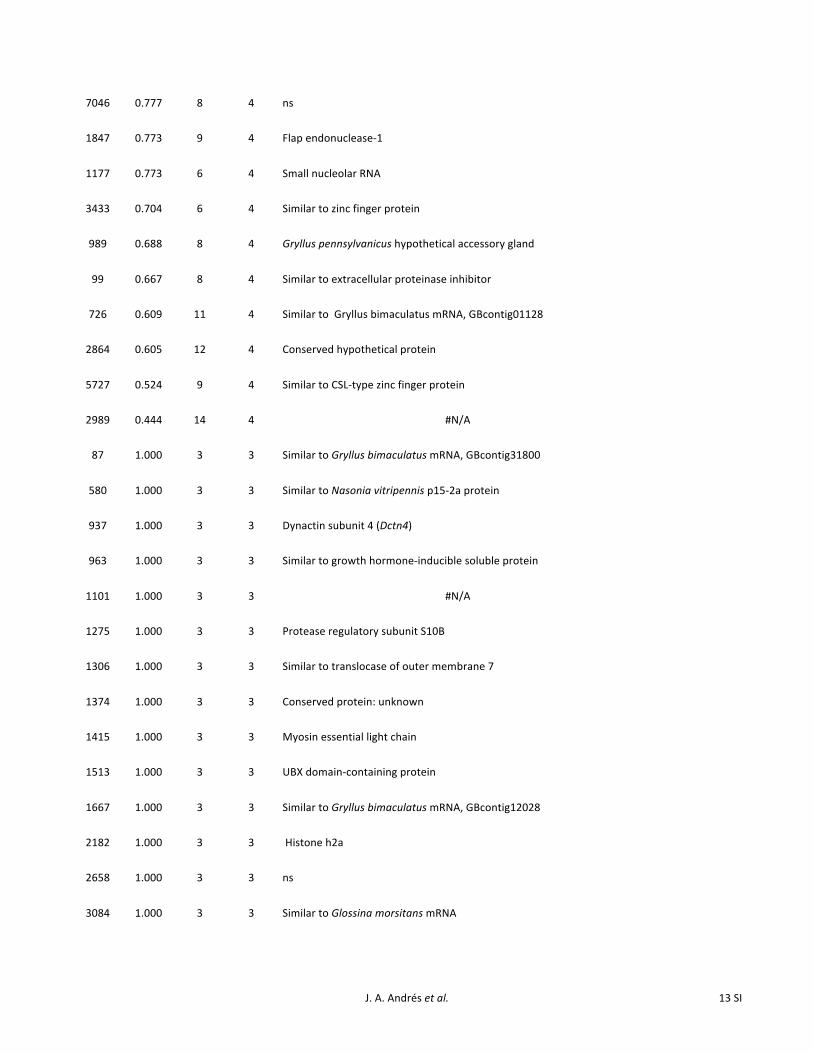
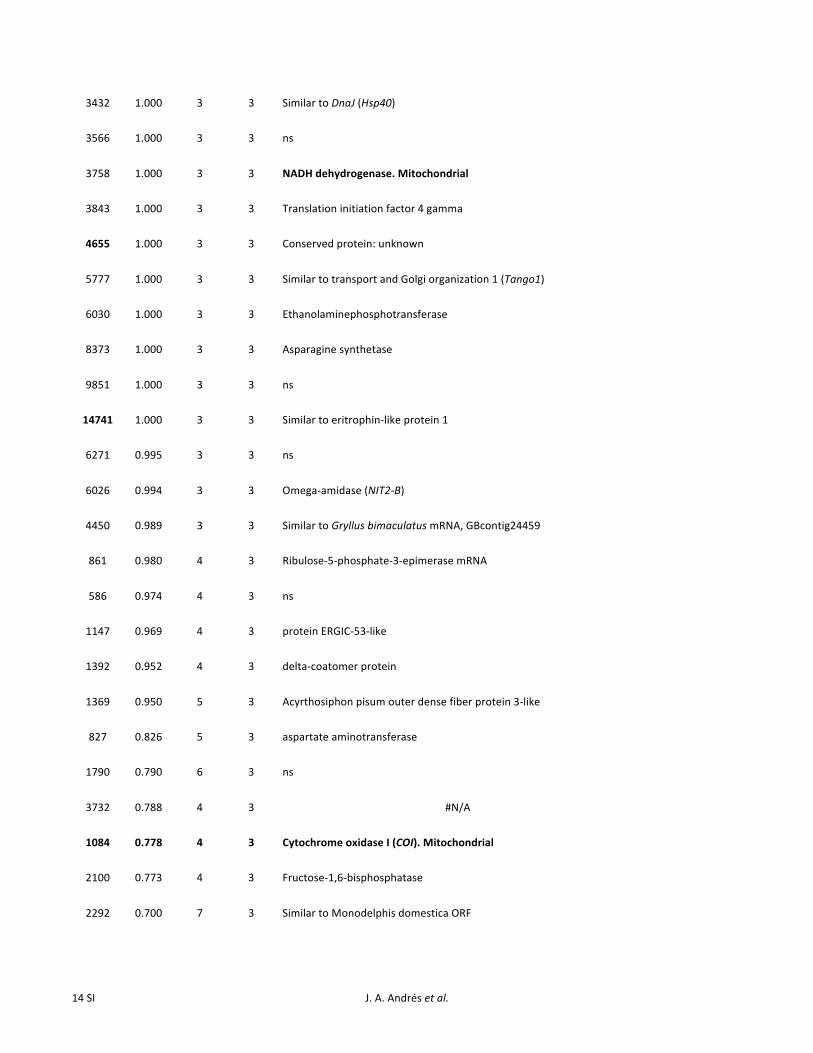
Table S2 Annotation of the contigs showing at least 3 fixed (D>0.98) differences between G. firmus and G. pennsylvanicus.
Contigs in bold correspond to mitochondrial loci.
SNPs
Contig N Fixed TBLAXT similarity
80 0.909 20 14 Similar to eukaryotic translation initiation factor 3 subunit 1
625 0.865 18 13 Transcription initiation factor
432 0.865 14 11 Similar to Tribolium castaneum LOC398543 protein